

Abstract
Outer hair cells (OHCs) are innervated by type II afferent fibers of as yet unknown function. It is still a matter of debate whether OHCs perform exocytosis. If so, they would require presynaptic Ca2+ channels at their basal poles where the type II fibers make contacts. Here we show that L-type Ca2+ channel currents (charge carrier, 10 mm Ba2+) present in neonatal OHCs [postnatal day 1 (P1) to P7] decreased from ∼170 to ∼50 pA at approximately the onset of hearing. Ba2+ currents could hardly be measured in mature mouse OHCs because of their high fragility, whereas in the rat, the average Ba2+ current amplitude of apical OHCs was 58 ± 9 pA (n = 20, P19–P30) compared with that of the inner hair cells (IHCs) of 181 ± 50 pA (n = 24, P17–P30). Properties of Ba2+ currents of mature OHCs resembled those of neonatal OHCs. One exception was the voltage dependence of activation that shifted between birth and P12 by +9 mV toward positive voltages in OHCs, whereas it remained constant in the IHCs. Cav1.3-specific mRNA was detected in mature OHCs using cell-specific reverse transcription (RT)-PCR and in situ hybridization. Cav1.3 protein was stained exclusively at the base of mature OHCs, in colocalization with the ribbon synapse protein CtBP2 (C-terminal binding protein 2)/RIBEYE. When current sizes were normalized to the estimated number of afferent fibers or presynaptic ribbons, comparable values for IHCs and OHCs were obtained, a finding that together with the colocalization of Cav1.3 and CtBP2/RIBEYE protein strongly suggests a role for Cav1.3 channels in exocytosis of mature OHCs.
Keywords: mouse, rat, hair cell, ribbon synapse, spiral ganglion, development
Introduction
Outer hair cells (OHCs) are specialized sensory cells that transform sound-induced deflections of their stereocilia into changes of their receptor potential and subsequently into length changes (Brownell et al., 1985; Davis, 1983; Dallos, 1986; Dallos and Corey, 1991). They receive pronounced efferent but sparse divergent afferent innervation (5–10% of all cochlear afferents) (Spoendlin, 1973; Ehret, 1979; Spoendlin, 1985; Berglund and Ryugo, 1987). The number of afferent fibers innervating one OHC ranges from approximately three in the mouse (Berglund and Ryugo, 1987) to four to eight in guinea pig (Takasaka and Shinkawa, 1987; Felix, 2002) and man (Nadol, 1988). Conversely, one single type II fiber integrates the signals of 6–16 OHCs (Berglund and Ryugo, 1987; Jagger and Housley, 2003) and conveys that information to a type II spiral ganglion neuron that projects to multiple targets in the cochlear nucleus (Benson and Brown, 2004). Single-fiber recordings from type II fibers were unsuccessful so far (Robertson, 1984), and the role of type II neurons in auditory processing (Robertson, 1984; Brown, 1994; Robertson et al., 1999) remains elusive. However, recent patch-clamp recordings have demonstrated action potentials in type II neurons (Jagger and Housley, 2003; Reid et al., 2004) in the first 2 postnatal weeks.
Because technical difficulties have prevented action potential recordings from type II fibers or measurements of OHC exocytosis so far, indirect evidence needs to be gathered to support the view of the OHC as a true receptor cell. So far, ribbons and ribbon-free clusters of synaptic vesicles have been identified in many mammalian species at the OHC base (Sobkowicz et al., 1986; Nadol, 1988; Felix, 2002), the same site in which murine OHCs have been stained for the ribbon protein CtBP2 (C-terminal binding protein 2)/RIBEYE (Engel et al., 2006; Schug et al., 2006). Staining of postsynaptic terminals and fibers for glutamate receptors (Kuriyama et al., 1994; Engel et al., 2006) and voltage-activated Na+ channels (Hossain et al., 2005), and staining of Deiters' cells for a glutamate/aspartate transporter indicating reuptake of glutamate (Furness et al., 2002), all favor OHC afferent signaling.
Small voltage-activated Ca2+ currents have been recorded in guinea pig OHCs that could serve as the presynaptic Ca2+ source (Nakagawa et al., 1991; Chen et al., 1995). These currents, however, were neither systematically analyzed nor related to Ca2+ currents of corresponding inner hair cells (IHCs). Recently, we have characterized Cav1.3-mediated Ca2+ currents in neonatal mouse OHCs that drastically declined after postnatal day 6 (P6) (Michna et al., 2003) when OHCs adopt their mature phenotype. Here we show that Ba2+ currents and Cav1.3 mRNA and protein persisted in mouse and rat OHCs well after the onset of hearing. We demonstrate the developmental dynamics of Ca2+ current amplitudes and characterize biophysical parameters during postnatal maturation of inner and outer hair cells. The subcellular localization of Cav1.3 channels at the base of apical and medial OHCs, in exact colocalization with the ribbon synapse protein CtBP2/RIBEYE, and the remarkable current size in mature rat OHCs strongly suggest an afferent function of OHCs.
Materials and Methods
Electrophysiological recordings.
Cochleae of NMRI mice or Wistar rats (Charles River, Sulzfeld, Germany) were used after the animals had been killed by decapitation (preceded by CO2 anesthesia in animals aged older than P8) according to national ethical guidelines. Whole-cell Ca2+ channel currents were measured in a semi-intact preparation of the organ of Corti as described previously (Michna et al., 2003). The extracellular solution for IHCs and OHCs younger than P12 was composed of the following (in mm): 160 tris-(hydroxy-methyl-amino)-methane·HCl, 10 BaCl2, 5.6 glucose, and 1 MgCl2, pH 7.4 (320 mOsm/kg) (“Tris-Cl solution”) to avoid any currents through voltage-activated Na+ and K+ channels. IBa recordings in part of the neonatal rat OHCs were performed during local perfusion with Tris-Cl solution, whereas the organ of Corti was bathed in physiological buffer [in mm: 153 NaCl, 5.8 KCl, 1.3 CaCl2, 0.9 MgCl2, 0.7 NaH2PO4, 10 HEPES, and 5.6 glucose, pH 7.4 (320 mOsm/kg)].
At ages older than P11, swelling of mouse OHCs in solutions with a high extracellular Cl− concentration such as Tris-Cl solution (155 mm [Cl−]e) became a major problem. To inhibit OHC swelling attributable to a possible Cl− influx (Siegel and Zeddies, 2001), either 10 μm tamoxifen was added from a 10 mm stock solution in DMSO to the Tris-Cl solution or all but 15 mm of the Cl− of the Tris-Cl solution was replaced by 160 mm lactobionate, a large organic anion (“Tris-lactobionate solution”). For recordings of IBa in rat OHCs and IHCs older than P11, a solution with an intermediate extracellular Cl− (95 mm) was used that successfully blocked swelling of OHCs [“TEA-lactobionate solution” (in mm: 70 NaOH·lactobionate, 43 NaCl, 35 tetraethylammonium chloride (TEA), 15 4-aminopyridine, 10 BaCl2, 5.6 glucose, and 1 MgCl2, pH 7.4 (320 mOsm/kg))].
Whole-cell currents from OHCs (third and second row) were recorded at 20–22°C by the whole-cell patch-clamp technique using an AXOPATCH 200B amplifier (Molecular Devices, Palo Alto, CA). Patch pipettes with a resistance of 4–6 MΩ were made from either quartz glass or from borosilicate glass, the latter coated with Sylgard 184 (Dow Corning, Midland, MI), and filled with the following (in mm): 120 Cs+ gluconate, 20 CsCl, 10 Na+ phosphocreatine, 5 HEPES, 5 EGTA, 4 MgCl2, 4 Na2ATP, 0.1 CaCl2, and 0.3 GTP, pH 7.35 (305 mOsm/kg). Chemicals were obtained from Sigma (Munich, Germany) except ATP, TEA, and lactobionate (Fluka, Buchs, Switzerland) and BaCl2 (Merck, Darmstadt, Germany).
Currents were corrected off-line for linear leak conductance that was determined using the current elicited by a −10 mV voltage prepulse from the holding potential preceding every voltage protocol. For determination of current–voltage (I–V) curves, any remaining offset current was subtracted from all current traces. Potentials were corrected for liquid junction potentials as determined according to Neher (1992): Tris-Cl solution, −20 mV; Tris-Cl solution locally perfused in physiological buffer, −8 mV; Tris-lactobionate solution, −14 mV; and TEA-lactobionate solution, +2.3 mV. Data acquisition was performed as described previously (Michna et al., 2003).
Data analysis.
All fits were performed assuming the Ca2+ channel current can be described by a Hodgkin–Huxley model with two gating particles (Zidanic and Fuchs, 1995). I–V curves of Ba2+ currents obtained by step depolarizations were fitted according to the following equation:
 |
where I is the IBa at the time the I–V was calculated, Pmax is the maximum permeability, ν = zFV/(RT), with z being 2, F the Faraday constant, R the universal gas constant, T the absolute temperature, and V the membrane potential. [Ba]i and [Ba]o denote the intracellular and extracellular Ba2+ concentration, respectively; Vh is the voltage for half-maximum activation, and k is the slope factor of the Boltzmann function. This description uses the Goldman–Hodgkin–Katz equation for description of the driving force for Ba2+ (Hille, 1991). The exponent 2 was found to fit the data best (cf. Zidanic and Fuchs, 1995). Activation kinetics were fitted for those cells for which the product of series resistance and linear capacitance did not exceed 150 μs (the clamp time constant of the system) using the following equation:
with
where ISS is the steady-state current, m∞ and m0 denote the steady-state and start probability, respectively, of one gating particle for being in the open state, and τ is the activation time constant.
Statistical analysis of means (Vh) was performed using Student's two-tailed t test, or, for comparisons of multiple datasets, analysis of covariance (ANCOVA) with JMP 6.0 software (SAS Institute, Cary, NC). For all statistical tests, p < 0.05 was used as the criterion for statistical significance. Mean values are quoted ± SD in the text and figures.
IHC- and OHC-specific reverse transcription-PCR analysis.
Apical and medial half-turns of the organ of Corti were dissected and fixed on a coverslip. After Hensen's and Claudius' cells had been removed with cleaning pipettes, 30–60 OHCs were harvested with pipettes of 10 μm tip opening under fast flow of Tris-Cl solution (0.7 ml/min, corresponding to a complete exchange of solution in the chamber in 120 s). Subsequently, outer pillar cells were removed and ∼30 IHCs were harvested with their adjacent supporting cells (inner phalangeal and border cells). For cDNA first-strand synthesis, primers, and PCR conditions, see Michna et al. (2003). For PCR, cDNA corresponded to ∼10–27 OHCs and 4–10 IHCs, respectively. For each age and species, experiments were repeated at least three times.
Riboprobe synthesis and whole-mount in situ hybridization.
Using the nested oligonucleotide primers for Cav1.3 (Michna et al., 2003), a 421 bp PCR fragment was amplified from rat cochlea cDNA, cloned into pCRII TOPO Vector (Invitrogen, Carlsbad, CA), and sequenced. The plasmid was linearized appropriately, and complementary strands for sense and antisense were transcribed from SP6 and T7 promoter sites in the presence of digoxigenin-labeling mix (Roche Diagnostics, Mannheim, Germany). In situ hybridization was performed using dissected cochleae that had been fixed in 2% paraformaldehyde (PFA) in PBS for 30 min before they were dehydrated in 100% methanol overnight at −20°C. Subsequent to rehydration and digestion with proteinase K (2 μg/ml in PBT, i.e., PBS containing 0.5% Tween 20) at 37°C for 3 min, cochleae were postfixed in 2% PFA for 15 min and washed in PBT. Hybridization was performed at 60°C overnight. Subsequent washing and detection steps were performed as described previously (Wiechers et al., 1999; Schimmang et al., 2003). Finally, the organ of Corti was dissected from the modiolus and the bony cochlear wall turn by turn, mounted with MOWIOL (Calbiochem, Darmstadt, Germany), and viewed with an Olympus (Tokyo, Japan) AX 70 microscope with a 100× objective and oil immersion. For both species, experiments were repeated three times.
Immunohistochemistry.
Mouse or rat cochleae (P5–P30) were isolated, fixed, cryosectioned, and stained as described previously (Knipper et al., 1998, 2000). Cochleae older than P9 were decalcified for 1–5 min with Rapid Bone Decalcifier (Fisher Scientific, Houston, TX) and stained with antibodies directed against Cav1.3 (Alomone Labs, Jerusalem, Israel). For whole-mount immunohistochemistry, organs of Corti (P20–P22) were fixed by intracochlear perfusion and immersion with 2% PFA for 15 min on ice. After removing Reissner's membrane and tectorial membrane, pieces of the organs of Corti were stained in a 96-well plate with rabbit anti-Cav1.3 and mouse anti-CtBP2/RIBEYE (BD Biosciences, San Jose, CA) as described previously (Knipper et al., 1998, 2000). Primary antibodies were detected with cyanine 3-conjugated anti-mouse IgG (Jackson ImmunoResearch, West Grove, PA) or Alexa660-conjugated anti-rabbit IgG (Invitrogen). Cryosections were embedded with Vectashield mounting medium with the nuclear stain 4′,6′-diamidino-2-phenylindole (DAPI) (blue staining; Vector Laboratories, Burlingame, CA) and viewed using an Olympus AX70 microscope equipped with epifluorescence illumination. For confocal microscopy, whole-mount tissue was stained with the nuclear stain Sytox Green (Invitrogen), embedded with FluorSave mounting medium (Calbiochem, Darmstadt, Germany), and viewed with a confocal laser scanning microscope (LSM 510 META; Zeiss, Oberkochen, Germany). The images for each of the fluorochromes were acquired separately by excitation with a helium/neon laser at 543 nm (detecting CtBP2/RIBEYE, allocated to the red color channel), a helium/neon laser at 633 nm (detecting Cav1.3, allocated to the green color channel), and an argon laser at 488 nm (detecting Sytox Green fluorescence, allocated to the blue color channel) with appropriate filter sets. Controls were performed to ensure that there was no crosstalk between the optical channels. Stacks of confocal images were taken and reconstructed by Zeiss LSM software.
Results
IBa recordings in mature mouse OHCs
Measuring Ca2+ channel currents in mouse OHCs with 10 mm Ba2+ as a charge carrier (Michna et al., 2003) became increasingly difficult from P7 onward, which was attributable to increasing stiffness and fragility of the membrane and to swelling of the OHCs. Electromotility added to the difficulties of recording from mature OHCs resulting in very short recording times. OHC swelling could be delayed by adding 10 μm tamoxifen to the Tris-Cl solution or by using lactobionate as the major anion (Tris-lactobionate solution), which seems to inhibit Cl− permeation involved in volume regulation (Siegel and Zeddies, 2001). Either solution gave comparable results regarding the amplitude of IBa. Patch-clamp recordings were performed only from those OHCs that had intact stereocilia, the typical cylindrical, elongated shape with the nucleus located close to the base and a normally structured cytoplasm.
After the first postnatal week, IBa of mouse OHCs declined from values >70 pA (Michna et al., 2003) to <45 pA at P12. Figure 1A–F shows IBa traces and current–voltage curves around and after the onset of hearing. The peak IBa inward current elicited by a step depolarization to 0 mV for 8 ms and the I–V of a P12 OHC (Fig. 1A,B) resembled those from neonatal OHCs (Michna et al., 2003) and shows that the combination of extracellular Tris+ and Ba2+ and intracellular Cs+ was sufficient to block outward (most likely K+ channel) currents <30 mV. For comparison, KCNQ4-mediated K+ currents range up to ∼5 nA in mature OHCs (Marcotti and Kros, 1999; Kharkovets et al., 2006). At the onset of hearing, IBa was sensitive to the L-type agonist Bay K 8644 (1,4-dihydro-2,6-dimethyl-5-nitro-4-[2-(trifluoromethyl)phenyl]-pyridine-3-carboxylic acid, methyl ester) (Fig. 1C), similar to the neonatal current (Michna et al., 2003). On average, 5 μm Bay K 8644 increased OHC peak IBa to 148 ± 21% (n = 3, P10–P12), indicating that the current was L-type (P1–P7 OHCs, 178 ± 58%). Current responses to long-lasting (400 ms) depolarizations revealed lack of voltage-dependent inactivation (VDI) (the inactivation measured with Ba2+ as a charge carrier) of IBa as shown by the peak current trace of a P19 apical OHC (Fig. 1D). The corresponding steady-state I–V revealed a small inward current of only 15 pA (Fig. 1E). Both activation characteristics and lack of VDI resembled that of neonatal OHCs. The voltage step to +16 mV at the end of the depolarizing pulse in Figure 1D, also present in Figures 2 (B and E) and 3 (C and F), was a test pulse of an inactivation protocol, which was not further evaluated in terms of an inactivation I–V plotting the current at the test potential versus the prepulse potential because of small current sizes and lack of substantial inactivation. Figure 1F summarizes average maximum IBa values for mouse OHCs aged P1– P19, with data for P1–P7 adopted from current density data by Michna et al. (2003) (their Fig. 1E). Between P6 and P8, when OHCs gain electromotility (Oliver and Fakler, 1999) and express the dominant KCNQ4 conductance (Marcotti and Kros, 1999; Kharkovets et al., 2006), IBa declined from 125 to <50 pA. Peak IBa continued to decrease after the onset of hearing (at approximately P12) (Ehret, 1985), to reach values as small as 10–15 pA (n = 3) at P19.
Figure 1.

Ca2+ channel currents carried by Ba2+ (10 mm) in mouse outer hair cells around and after the onset of hearing. A, Peak inward IBa (single trace) elicited by a step depolarization from −70 to 0 mV for 8 ms in a P12 apical OHC. Capacitive current transients attributable to prestin action at the start and end of the current response were cut off. Dashed line, Zero current trace. B, Corresponding I–V. C, IBa I–V for another apical OHC (P12) before (control) and during superfusion with 5 μm Bay K 8644 indicates that IBa is an L-type current. D, E, Non-inactivating peak current trace of an apical OHC at P19 in response to a long inactivation protocol (single trace; command voltages are given, D) and corresponding steady-state I–V (E) at the end of the first 400 ms depolarizing pulse in Tris-lactobionate solution. Large current transients in A and D were attributable to the nonlinear capacitance of OHCs. F, Developmental upregulation and downregulation of peak IBa as a function of age. Data for P1–P8 were adopted from Michna et al. (2003). Number of cells for ages older than P8 are as follows: P9, 4; P10, 2; P11, 2; P12, 4; P13, 1; P15, 2; and P19, 3. OHCs older than P8 were from apical half-turns, except two medial OHCs at P15.
Figure 2.

Ca2+ channel currents carried by Ba2+ (10 mm) in neonatal rat outer and inner hair cells at the age of their respective developmental peaks. A–C, IBa traces and I–V of a rat OHC at P1; C = 7.1 pF, Rleak = 6.1 GΩ, bath solution (B1) included local perfusion with Tris-Cl solution. A, Selected current traces in response to step depolarizations from a holding potential of −68 mV to the potentials indicated for 8 ms. B, Corresponding I–V taken at the last millisecond of the depolarizing pulse in A and fit according to Equation 1 (Vh = −10.4 mV; k = 13.8 mV). C, Selected IBa traces in response to a long inactivation protocol (command voltages are given) show little voltage-dependent inactivation. D–F, IBa of a rat IHC at P9; C = 10.1 pF, Rleak = 2.8 GΩ, bath included Tris-Cl solution. D, Selected current traces in response to short step depolarizations from a holding potential of −70 mV to the potentials indicated. E, Corresponding I–V taken at the last millisecond of the depolarizing pulse and fit (Vh = −19.4 mV, k = 13.6 mV). F, Selected IBa traces in response to a long inactivation protocol (command voltages are given) reveal very little voltage-dependent inactivation.
Figure 3.
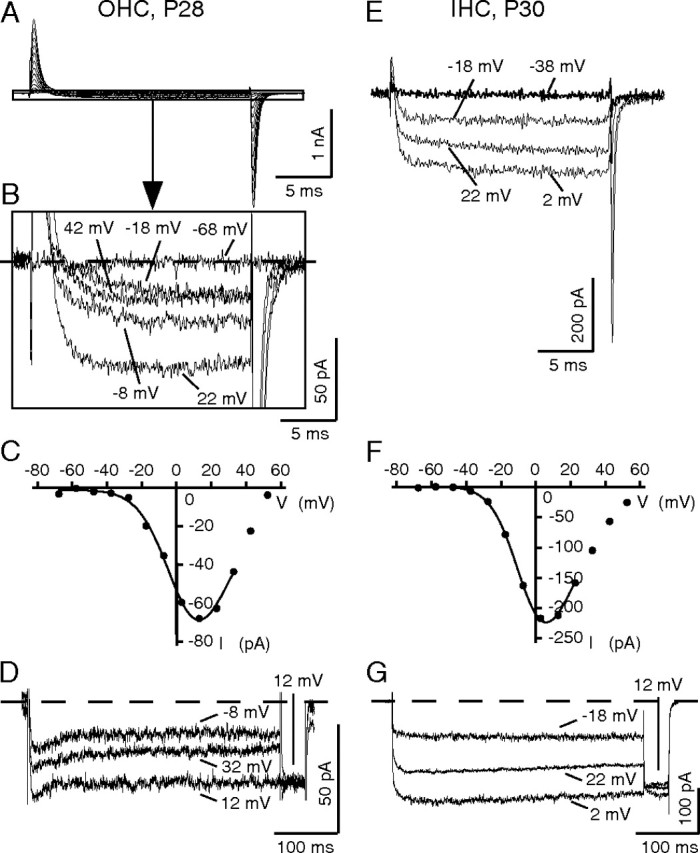
Ca2+ channel currents carried by Ba2+ (10 mm) in mature rat outer and inner hair cells. A–D, IBa of a rat OHC at P28; C = 16.1 pF, Rleak = 1.8 GΩ, bath included TEA-lactobionate solution. A, Overview of the current responses to step depolarizations from a holding potential of −68 to +52 mV for 20 ms shows large capacitive current transients at the start and the end of the voltage pulses, respectively, attributable to the nonlinear capacitance of the OHC. Selected small inward currents within the rectangle in A are magnified in B; command voltages are indicated. C, Corresponding I–V taken at the last millisecond of the depolarizing pulse in B and fit (Vh = 2.2 mV, k = 13.6 mV). D, Selected IBa traces in response to a long inactivation protocol of another OHC at P28 (C = 17.6 pF, Rleak = 1.7 GΩ), showing little voltage-dependent inactivation (command voltages are given). E–G, IBa of a rat IHC at P30; C = 14.7 pF, Rleak = 1.6 GΩ, bath included TEA-lactobionate solution. E, Selected current traces elicited by step depolarizations from a holding potential of −68 mV to the potentials indicated. F, Corresponding I–V taken at the last millisecond of the depolarizing pulse and fit (Vh = −7.1 mV, k = 11.8 mV). G, Selected IBa traces in response to a long inactivation protocol (command voltages are given) showing lack of voltage-dependent inactivation.
IBa recordings in neonatal rat outer and inner hair cells
Recording IBa from mature mouse OHCs was difficult because of a low success rate of establishing the whole-cell configuration and short recording times. Therefore, we tested whether rat OHCs would be better suited for characterizing mature Ca2+ channel currents. For reasons of comparison, we recorded IBa in both outer and inner hair cells between birth and full maturation of the organ of Corti. IBa adopted a developmental maximum in the postnatal phase before the onset of hearing in both OHCs and IHCs, similar to what has been reported for mouse hair cells (Beutner and Moser, 2001; Marcotti et al., 2003; Michna et al., 2003). Postnatal rat Ba2+ currents at the respective age of the peak current (OHCs, P1–P3; IHCs, P9–P11) showed rapid activation and deactivation in both OHCs and IHCs (Fig. 2A,D), with activation time constants at the voltage of peak IBa, Vmax, of 0.30 ± 0.10 ms for five OHCs and 0.35 ± 0.06 ms for seven IHCs, similar to those of mouse hair cells (Platzer et al., 2000; Michna et al., 2003; Johnson et al., 2005). Corresponding I–V curves of IHC and OHC IBa peaked at ∼0 mV and looked very similar (Fig. 2B,E). When elicited for 400 ms, IBa showed little VDI in both OHCs and IHCs (Fig. 2C,F). The only prominent difference was that IBa was more than twice as large in IHCs compared with OHCs (Fig. 2B,E) at the respective age of the developmental peak, which is outlined in more detail below (see Fig. 5A–D).
Figure 5.

The voltage for half-maximal activation of IBa, Vh, increases in rat outer hair cells in physiological extracellular Cl− concentration on maturation and is affected by reduction of [Cl−] e. A, B, Average Vh for OHCs (A) and IHCs (B) as a function of age recorded in either Tris-Cl solution (155 mm [Cl−]e; white bars) or TEA-lactobionate solution (95 mm [Cl−]e; gray bars). The number of cells is indicated above/below the bars. A, Vh of OHCs started from negative values in both solutions from P0–P2, increased steadily, and stabilized at different levels of at least P12, with Vh of −8.3 mV in Tris-Cl solution (dashed line) at P15–P17 contrasting Vh of ∼10 mV in TEA-lactobionate solution at P12–P30. B, In IHCs, Vh stayed nearly constant at negative values (P15–P17, −17.7 mV; dashed line) in Tris-Cl solution. In the TEA-lactobionate solution, Vh increased on maturation and stabilized at values of approximately −7 mV at ages older than P11.
IBa recordings in mature rat inner and outer hair cells
To record from rat OHCs older than P11, which are electromotile and have reduced Ba2+ currents, we used TEA-lactobionate solution that blocked all K+ conductances and prevented swelling of the OHCs (see Materials and Methods). This bath solution kept rat OHCs in a good shape, such that recording from them was easier than from the more fragile mature mouse OHCs. Recordings were performed from OHCs of the apical half-turn, which corresponds to frequencies of 1–6 kHz (Muller, 1991), unless stated otherwise. Voltage steps in mature OHCs elicited large current transients, which are attributable to the nonlinear capacitance (Santos-Sacchi, 1991), and small inward currents (Fig. 3A), which are enlarged in Figure 3B. Their kinetics of activation and deactivation was obscured by the large capacitive transients. These transients could be fitted with monoexponential functions resulting in time constants of 0.26–0.34 ms (data not shown). Taking into account that their amplitude was 20 times larger than the peak inward Ba2+ current, lack of influence of the transient current on IBa should be expected after waiting seven times the time constant of the transient, i.e., ∼2.8 ms after the beginning of depolarization (corresponding to 0.3% of the transient current peak amplitude). Assuming that the mature IBa maintains the neonatal activation time constant of 0.3 ms at Vmax, it should be primarily activated at 2.8 ms after start of depolarization, which indeed is the case (Fig. 3B).
Mature OHCs displayed a shift of the IBa I–V curve toward more depolarized values compared with neonatal OHCs (Fig. 3C). Responses to long depolarizing pulses revealed little VDI of IBa (Fig. 3D). Applying the same voltage protocols to mature IHCs resulted in larger Ba2+ currents that resembled those of mature OHCs (Fig. 3E). The I–V curves of mature IHCs peaked ∼9 mV more positive (Fig. 3F) than those of neonatal IHCs (Fig. 2E) yet were less shifted toward positive voltages than those of mature OHCs (Fig. 3C). The average activation time constant of IBa at Vmax was 0.32 ± 0.05 ms (n = 5). Mature rat IHC IBa showed no voltage-dependent inactivation (Fig. 3G). At P28, average OHC IBa amounted to 66 pA ± 18 (n = 13, P28), which is 33% of the IHC IBa of 219 ± 26 pA (n = 6, P30).
The amplitude of IBa shows a developmental maximum in both outer and inner hair cells but at different ages
On maturation, both rat and mouse OHCs and IHCs showed changes of IBa amplitudes (Fig. 4). OHCs started with an elevated IBa level in the first postnatal days that subsequently declined, whereas in IHCs, a prominent upregulation and downregulation was observed. In rat OHCs, average peak IBa amplitudes showed maximum values between P1 and P5, drastically decreased at P8 when OHCs become electromotile (Oliver and Fakler, 1999), and approximately stayed at this level until P28, the latest age recordings were performed (Fig. 4A). Rat IHC IBa data were adopted from Brandt et al. (2007); they showed a steady increase after birth until a developmental peak was reached at approximately P9–P11 (Fig. 4B). Maximum OHC IBa amounted to 174 ± 46 pA (P1–P4, n = 6) which was 41% of IHC IBa of 421 ± 63 pA (P9–P11, n = 10). To better compare the time course of upregulation and downregulation of IBa peak amplitudes between outer and inner hair cells, IBa values were normalized to their respective maximum (Fig. 4C). When the OHC IBa curve was shifted by 8 d toward older ages, the declining parts of the IHC and OHC IBa curves matched remarkably (Fig. 4D), suggesting that processes with similar kinetics control the developmental downregulation of Ca2+ channel expression in both types of hair cells. The same comparison of the dynamics of relative IBa was performed for mouse outer (data derived from Fig. 1F) and inner hair cells. IBa was elevated in mouse OHCs between P1 and P6. For IHCs, published data of age-dependent ICa amplitudes from Marcotti et al. (2003) (their Fig. 2C) were used and normalized to their developmental peak at P6 (Fig. 4E). A shift of the OHC IBa curve by 4 d revealed a comparable time course of IBa downregulation in both outer and inner hair cells (Fig. 4F), similar to the findings for rat hair cells (Fig. 4D).
Figure 4.

Ca2+ channel currents show a developmental upregulation and downregulation in both outer and inner hair cells in rats and mice, with the current maximum of OHCs preceding that of the IHCs by several days. A, Average peak IBa in rat OHCs as a function of age. Number of OHCs were as follows: P1, 6; P2, 1; P4, 2; P5, 5; P7, 6; P8, 3; P12, 2; P15, 5; P19, 6; P28, 13; and P30, 1. OHCs were from apical or medial cochlear half-turns from mice younger than P9 and from apical half-turns older than that. B, Average peak IBa in rat IHCs (triangles) and the much smaller average IBa for rat OHCs (circles) as a function of age. Number of IHCs were as follows: P1, 1; P3, 2; P5, 14; P9, 3; P11, 7; P15, 13; P17, 10; P19, 3; P21, 5; and P30, 6. C, Rat OHC and IHC average IBa values were normalized to their developmental peaks, respectively, to compare the time course of their IBa downregulation. D, When the OHC normalized IBa curve was shifted by 8 d to the right, it matched that for the IHC IBa development. E, Mouse OHC IBa data from Figure 1F were normalized to their developmental peak. The same was done for mouse IHCs using Ca2+ current data from Marcotti et al. (2003) (their Fig. 2C). F, Shifting the mouse OHC normalized IBa curve by 4 d reveals similar kinetics of developmental downregulation of IBa/ICa in mouse outer and inner hair cells.
When comparing IBa amplitudes for hair cells of hearing rats, it becomes evident that the current did not substantially change in OHCs after P12 and in IHCs after P15 (Fig. 4B). Average mature IBa values were −58 ± 9 pA (n = 20) for OHCs (P19–P30) and −181 ± 50 pA (n = 24) for IHCs (P17–P30). Thus, mature OHCs display 32% of the peak IBa amplitude of mature IHCs. Average peak IBa amplitudes were larger in IHCs compared with age-matched OHCs for ages older than P5. The developmental downregulation of IBa amplitudes showed similar kinetics in both types of hair cells but occurred earlier in outer than in inner hair cells, indicating earlier maturation of the outer hair cell with respect to voltage-activated Ca2+ currents.
The voltage dependence of rat OHC IBa changes during postnatal maturation
As shown in Figure 3C, current–voltage relationships of IBa in mature rat OHCs revealed Vmax values (voltages of maximum inward currents) that were shifted by ∼15 mV compared with Vmax of neonatal OHCs (Fig. 2B). To analyze this shift in more detail, we recorded rat OHC IBa as a function of age and analyzed Vh (voltages for half-maximum activation) according to Equation 1. Recordings were performed in both external solutions: Tris-Cl solution normally used for neonatal OHCs and TEA-lactobionate solution used for OHCs older than P11. To test whether the solutions specifically affected Vh, TEA-lactobionate was also used for determining Vh in neonatal OHCs, and, conversely, Tris-Cl solution was used for Vh of OHCs after the onset of hearing, at P15–P17. Figure 5A illustrates a significant shift of Vh in the positive direction for both solutions over age (ANCOVA, Tris-Cl solution, p = 0.004, 34 cells, 20% adjusted R2; TEA-lactobionate solution, p < 0.0001, 49 cells, 57% adjusted R2). The age-dependent increase of OHC Vh was especially pronounced in TEA-lactobionate solution at ages older than P11 (10 ± 6.6 mV; n = 23), which was ∼18 mV more positive than in Tris-Cl solution at P15–P17 (−8.3 ± 5.5 mV; n = 6) (Fig. 5A).
Trying to understand the reasons for the developmental shift of Vh in rat OHC IBa and the differential effect of the solutions on mature Vh values, we analyzed properties of IBa of inner hair cells, too (Fig. 5B). Neonatal IHCs (P3–P5) showed identical negative Vh values of approximately −20 mV in both Tris-Cl and TEA-lactobionate solutions, respectively, which were not different from OHCs in Tris-Cl solution aged P0–P2. On maturation, Vh of IHCs slightly increased in the Tris-Cl solution (ANCOVA, p = 0.034, 16 cells, 22% adjusted R2) and showed a more pronounced increase by ∼11 mV in the TEA-lactobionate (reduced Cl−) solution (ANCOVA, p = 0.0002, 54 cells, 22% adjusted R2) (Fig. 5B). The developmental increase of Vh in TEA-lactobionate solution stabilized at the onset of hearing at −7.3 ± 5.0 mV (n = 43) for IHCs (P12–P32) compared with 10 ± 6.6 mV (n = 23) for OHCs (P12–P32), resulting in a difference of Vh between mature inner and outer hair cells of 17 mV.
Thus, the TEA-lactobionate solution led to an increase in Vh in both types of hair cells that remained constant after the onset of hearing, which most likely was caused by the reduced [Cl−]e concentration. The reason for this shift of Vh is unknown. We currently consider the Vh values measured in normal extracellular Cl− concentration (Tris-Cl solution) of young hearing animals aged P15–P17 as the true mature Vh values for both types of hair cells. For OHCs, Vh was −8.3 ± 5.5 mV (n = 6), which was 9.4 mV more positive than those of age-matched IHCs (−17.7 ± 1.0 mV; n = 4), as indicated by dashed lines in Figure 5, A and B. The second parameter of the Boltzmann function describing the voltage dependence of Ca2+ channel opening, the slope factor k (Eq. 1), ranged from 12.0 to 16.1 mV and was not significantly different for IBa of neonatal and mature inner and outer hair cells. This parameter was independent of the solution used (Tris-Cl or TEA-lactobionate solution).
In conclusion, the voltage dependence of IBa activation in rat OHCs is similar to that of IHCs at the neonatal age but shifts during final differentiation by 9 mV toward positive voltages compared with IHCs.
Detection of Cav1.3 mRNA in mature mouse and rat hair cells
Using Ca2+ current recordings in hair cells of Cav1.3-deficient mice, previous studies have demonstrated that Cav1.3 is the predominant Ca2+ channel α1 subunit in neonatal and mature inner and in neonatal outer hair cells (Platzer et al., 2000; Brandt et al., 2003; Michna et al., 2003; Dou et al., 2004). To test for the presence of the Cav1.3 Ca2+ channel subunit after the onset of hearing in both mice and rats, cell-specific reverse transcription (RT)-PCR was performed for both species for P12–P32. Care was taken to avoid contamination of OHC material with IHC debris. Therefore, OHCs were collected first by removal from the strial side under fast flow of bath solution when the IHC region was still intact. In both species, Cav1.3-specific transcripts could be detected in inner and outer hair cells harvested from the apical half-turn at the onset of hearing (P12) and at two mature stages (P18 and P32) (Fig. 6).
Figure 6.

Detection of Cav1.3-specific transcripts in mouse and rat hair cells around and after the onset of hearing (P12–P32) by cell-specific RT-PCR. A, B, A 421 bp, Cav1.3-specific transcript was amplified in mouse (A) and rat (B) IHC and OHC samples at the ages indicated. Inner and outer hair cells were collected from apical cochlear turns.
We also used in situ hybridization to demonstrate the expression of Cav1.3 mRNA in whole-mount preparations of mature organs of Corti of both mice and rats. Cav1.3 mRNA could be specifically detected in OHCs located in all three rows and in all cochlear turns of both species at P19, here shown for the midbasal half-turn (Fig. 7). IHCs of all cochlear turns were positively stained for Cav1.3 mRNA, too, although surprisingly, their signal was less intense compared with the OHCs, especially in the mouse organ of Corti. Differential alternative splicing of the Cav1.3 subunit in either inner or outer hair cells (Shen et al., 2006) should not have contributed to this effect, because the riboprobe detected a highly conserved stretch of the Cav1.3 sequence. Most likely, the discrepancy in IHC/OHC staining provides an example that mRNA levels do not necessarily reflect the level of protein expression. The turnover of Cav1.3 mRNA may be much faster in the IHCs such that smaller amounts of mRNA result in larger amounts of the channel protein compared with the OHCs. In summary, the results indicate the ongoing expression of Cav1.3 mRNA in rat and mouse outer and inner hair cells.
Figure 7.

Expression of Cav1.3 mRNA in mature inner and outer hair cells using whole-mount in situ hybridization with organs of Corti of mouse and rat. A, C, Cav1.3 mRNA expression could be specifically detected in IHCs and in all three rows of OHCs in the mouse (A) and rat (C) organ of Corti (midbasal half-turn) at P19. B, D, No mRNA was detected when corresponding sense riboprobes were used in either mouse (B) or rat (D) whole-mount preparations. Large arrows indicate the row of inner hair cells, and small arrows indicate the rows of outer hair cells. Irregularities in IHC rows were a result of tissue shrinkage during the in situ hybridization procedure. Scale bar, 20 μm.
Localization of Cav1.3 channels
Because Cav1.3 channels have been shown to be essential for IHC exocytosis (Brandt et al., 2003), we attempted to localize Cav1.3 channels in outer hair cells. Using immunohistochemistry on cochlear cryosections, Cav1.3 channels were localized to the membranes of hair cells of all cochlear turns (shown for the mouse at P9, medial half-turn) (Fig. 8A), with the most prominent dot-like staining around the basolateral pole of the IHCs, in the region in which type I afferents make synaptic contacts (IHC, arrowhead). Anti-Cav1.3 immunoreactivity was also detected in OHC membranes with one to four dots labeled at the OHC base (Fig. 8A, OHC, arrowheads), the site where type II afferents make synaptic contacts. Attempts to stain cochlear sections older than P9 for Cav1.3 failed because of the requirement of decalcification that seemed to destroy the epitopes. Therefore, whole-mount preparations of the organ of Corti were stained as shown for a medial half-turn of the rat cochlea at P22 (Fig. 8B). The projection of confocal stacks revealed spot-like Cav1.3 immunoreactivity in each OHC, in the focal plain just below the nucleus (Fig. 8B, Cav1.3). CtBP2/RIBEYE immunoreactivity was found in the same spot-like manner in the focal plane just below the nuclei (Fig. 8B, CtBP2/RIBEYE), with an additional diffuse staining in OHC nuclei as described previously (Khimich et al., 2005; Engel et al., 2006; Schug et al., 2006). The merged signal revealed exact colocalization of the position of the Ca2+ channel with the position of the synaptic ribbons of the OHCs (Fig. 8B, merge). The extensive colocalization of Cav1.3 and CtBP2/RIBEYE in a plane close to the lower edge of the OHC nucleus is shown in a higher-magnification view from the base of a single OHC toward its apex, obtained by projecting stacks of confocal images (Fig. 8C). Here, the nucleus was stained with Sytox Green (visualized in blue). Both anti-Cav1.3 (Fig. 8C, left) and anti-CtBP2/RIBEYE antibodies (Fig. 8C, middle) stained a ring-like structure at the basal pole of the OHC but left the center unstained, as further shown by the merged signal (Fig. 8C, merge). The position of the Cav1.3- and CtBP2/RIBEYE-positive ring-like staining relative to OHC nuclei is also demonstrated in a three-dimensional reconstruction viewing along a slightly tilted plane from the apex of the OHCs to their base (Fig. 8D), which underscores the regular arrangement of the ribbon marker and Cav1.3 channels at the base of the OHCs. The striking colocalization of Cav1.3 and CtBP2/RIBEYE described for OHCs of the medial half-turn was also present in OHCs of the apical cochlear half-turn (data not shown).
Figure 8.

Localization of Cav1.3 immunoreactivity in the organ of Corti. A, Anti-Cav1.3 immunoreactivity (red) in a mouse cochlear cryosection at P9 (medial half-turn) revealed dot-like staining at the basolateral membrane of the IHC and two to four immunopositive dots at the base of the OHCs. The IHC is indicated by a thick arrow, OHCs are denoted by thin arrows, dot-like Cav1.3 immunoreactivity is indicated by arrowheads, and cell nuclei were stained with DAPI (blue). B, Projection of confocal images of a rat whole-mount preparation of the organ of Corti (medial half-turn) at P22 stained for Cav1.3 (top, visualized in green) and CtBP2/RIBEYE (middle, visualized in red). The anti-CtBP2 antibody also diffusely stained the nuclei; for explanation, see Materials and Methods. The merge of both images shows extensive colocalization of Cav1.3 and CtBP2/RIBEYE (bottom, yellow). C, Higher magnification of a single OHC viewed from the base, with Cav1.3 (left) and CtBP2/RIBEYE (middle) staining forming a ring at the OHC base; the nucleus is stained in blue. Both stainings primarily colocalize, as demonstrated by the yellow–brownish color in the merged image (right). D, Three-dimensional reconstruction of a stretch of OHC nuclei (blue) with a ring of Cav1.3- and CtBP2/RIBEYE-positive staining below each nucleus. E, Projection of confocal images of a rat whole-mount preparation of the organ of Corti (basal half-turn) at P20 costained for Cav1.3 (green) and CtBP2/RIBEYE (red). In all three OHC rows, a central Cav1.3-positive spot (green) is surrounded by and partially colocalized with CtBP2/RIBEYE-positive dots (red; colocalization is visible as small yellow dots). The anti-CtBP2 antibody again diffusely stained nuclei. F, Higher magnification of two OHCs from the basal cochlear half-turn viewed from the basal pole onto the nucleus (blue). Cav1.3 (green) stains the center of the OHCs pole, which is surrounded by CtBP2/RIBEYE staining (red) and partially colocalizes with it (yellow–brown). Scale bars: A, 20 μm; B–F, 5 μm.
Recently, we have shown a decreasing expression gradient for both markers from apex to base (Engel et al., 2006). We therefore also analyzed the high-frequency processing midbasal and basal half-turns of the rat cochlea for tonotopic differences regarding the staining pattern and colocalization of Cav1.3 and CtBP2/RIBEYE (Fig. 8E,F, shown for the basal half-turn). Cav1.3 was concentrated as a spot in the center of the lower poles of the OHCs in all three rows that seemed to consist of several dots that did not form the very regular ring-like structures observed in the apical/medial half-turns. CtBP2/RIBEYE staining surrounded the Ca2+ channel staining and partially overlapped with it, as shown by the yellow staining in Figure 8E. The partial overlap of Cav1.3 and the ribbon constituent is also demonstrated by two basal half-turn OHCs viewed from their basal pole (Fig. 8F).
These findings suggest a participation of Cav1.3 channels in exocytosis at OHC ribbon synapses. The prominent ring-like structures observed at OHC basal poles of the apical/medial cochlear turn most likely reflect ring-like assemblies of individual ribbons centered around afferent fiber contacts, as has been observed with electron microscopy (Sobkowicz et al., 1986). We attribute the discrepancy between the size of a ribbon (150 nm) determined with electron microscopy and the size of the dots composing the ring structure (500 nm) (Fig. 8C) to the limitations of spatial resolution of confocal microscopy using wavelengths of 543 and 633 nm.
Together, the persistence of Cav1.3 protein in mature OHCs and the similarity of pharmacological and many electrophysiological properties of IBa in neonatal and mature OHCs make it very likely that this current kept flowing through Cav1.3 channels after the onset of hearing. An explanation for the gradual shift of the OHC IBa activation with maturation may reside in a differential subunit or splice variant composition of the mature Cav1.3 channel complex in outer and inner hair cells.
Discussion
Properties and developmental time course of IBa in inner and outer hair cells
A direct proof of the function and molecular nature of mature OHC Ca2+ channels can currently not be presented. Although dysfunctions of IHCs (Platzer et al., 2000; Brandt et al., 2003) and degeneration of OHCs of the apical/medial turn in Cav1.3-deficient mice point to a crucial role of this channels in inner and outer hair cells (Platzer et al., 2000; Glueckert et al., 2003; Dou et al., 2004; Engel et al., 2006), the same dysfunctions prevent phenotyping of mature OHCs of Cav1.3−/− mice. Here we extend measurements of IBa in mouse OHCs to the period after onset of electromotility i.e., after acquisition of the mature phenotype. We further analyze the electrophysiological properties of neonatal and mature Ba2+ currents in rat hair cells. Neonatal Ba2+ currents of rat inner and outer hair cells essentially resembled those of neonatal mice reported previously (Michna et al., 2003). Activation kinetics, little VDI, sensitivity to Bay K 8644, and the persistence of Cav1.3 mRNA and protein suggest that IBa in both immature and mature OHCs flows through channels composed of the Cav1.3 α1 subunit.
Final differentiation of OHCs is accompanied by a reduction of IBa in the second postnatal week. Although average IBa peak currents of rat and mouse OHCs had the same size (170–180 pA) shortly after birth, they declined to ∼13 pA in mouse OHCs at P19, whereas rat OHCs displayed IBa values of 58 pA for P19–P32. We assume that IBa data of rat OHCs reflect the true situation, whereas IBa of mature mouse OHCs is underestimated because of the rapid decay of IBa in the more sensitive mouse cells.
Inner and outer hair cells show a postnatal downregulation of IBa, with the OHCs preceding the IHCs by several (4–8) days. The developmental peak of ICa/IBa in IHCs occurs at the time (mouse, approximately P6; rat, approximately P9–P11) when IHCs generate spontaneous Ca2+-dependent action potentials (Beutner and Moser, 2001; Marcotti et al., 2003; Brandt et al., 2007), whereas in OHCs, it occurs between at least P1 and P5. The earlier downregulation of IBa may reflect the fact that OHCs cannot produce regenerative Ca2+ action potentials even shortly after birth (Marcotti et al., 1999; Housley et al., 2006), most likely attributable to small ICa amplitudes. In conclusion, with respect to the final Ca2+ current size, OHCs are the first cochlear hair cells to acquire a mature phenotype.
Indications for exocytosis in OHCs
Could the Ca2+ current in rat OHCs trigger exocytosis? Comparing the mature peak current of rat OHCs (∼58 pA) with that of IHCs (∼181 pA) yields a current ratio between inner and outer hair cells of 1:3. Cav1.3 channels accommodate ∼13 presynapses with local increases of Ca2+ in the IHC (Khimich et al., 2005), leading to ∼14 pA IBa per presynapse or afferent fiber. The number of OHC presynapses is less clear. Ehret (1979) reported a gradient of type II fibers from apex to base (two to six fibers). However, analysis of the number of afferent terminals per OHC gave decreasing numbers from apex to base in guinea pig, cat, and man (Nadol, 1988), suggesting that one branch of a type II fiber may innervate more than one release site of the same OHC. For the mouse, Berglund and Ryugo (1987) estimated an average number of three afferent fibers per OHC. This would result in ∼19 pA IBa per OHC afferent, which is the same order of magnitude as in the IHCs. Counting alternatively the five to six CtBP2/RIBEYE-positive dots at the base of apical/medial OHCs as individual ribbons (Fig. 8B–D) leads to 10–12 pA/release site, which is still comparable with the 14 pA/release site in an IHC. Considering that Cav1.3 immunoreactivity was exclusively localized to the presumptive presynaptic regions of both IHCs and OHCs, these numbers support the idea that Ca2+ flowing through Cav1.3 channels at the OHC base can trigger exocytosis.
We observed tonotopic gradients of OHC Cav1.3 and CtPB2/RIBEYE expression (Engel et al., 2006; Schug et al., 2006) and of the degree of their colocalization from apex to base (Fig. 8). This may reflect (1) less exocytosis in midbasal/basal OHCs, or (2) other Ca2+ channel subtypes with better colocalization contributing to Ca2+ influx in midbasal/basal turns.
The voltage range of IBa activation of the OHCs shifted on maturation by ∼9 mV compared with IHCs. IHCs need Ca2+ influx at the hearing threshold, i.e., close to the resting membrane potential. Indeed, in physiological solutions (1.3 mm Ca2+), Ca2+ currents activate below −60 mV (Platzer et al., 2000; Johnson et al., 2005). The shift of Vh in mature OHCs can thus be interpreted as a threshold, preventing a steady Ca2+ influx near the resting membrane potential of the OHC, thereby permitting Ca2+ influx only at more depolarized voltages. Unfortunately, the size of OHC receptor potentials (Vm) in vivo is unclear. Typical peak alternating current OHC receptor potentials obtained with in vivo microelectrode recordings in anesthetized sound-exposed guinea pigs ranged from 5 mV (Russell and Sellick, 1983) to ∼10 mV (Dallos, 1986). As a result of electrode impalement, however, these recordings produced leak currents, which might have caused an underestimation of changes in Vm. Patch-clamp recordings in gerbil OHCs in an in vitro hemicochlea preparation with mechanical excitation revealed alternating current Vm increases of up to 38 mV (He et al., 2004), changing the previous picture of small excursions of OHC Vm from the resting value of −70 mV. Current–displacement curves obtained from mechanically stimulated apical rat inner and outer hair cells with the patch-clamp technique demonstrated a strongly rectifying behavior of transducer channels (Beurg et al., 2006) as reported previously for IHCs, in contrast to findings for guinea pig OHCs of the high-frequency region (Russell et al., 1986). A rectifying current–displacement curve of the transducer channel in OHCs could elicit a considerable direct current component of Vm. The fact that the dynamic range of OHC Vm seems to be larger than previously thought makes the activation of voltage-gated conductances such as Cav1.3 channels more likely, at least at moderate to high sound pressure levels.
Additional evidence for an afferent role of OHCs comes from the detection of the ribbon synapse protein CtBP2/RIBEYE at the basal pole of neonatal and mature OHCs. These findings fit recently published data on the existence of voltage-activated Na+ channels at afferent type II fibers below the OHCs that may convert EPSPs into action potentials (Hossain et al., 2005). Modeling results suggest that type II fibers are capable of producing and conducting action potentials (Hossain et al., 2005). The existence of postsynaptic glutamate receptors underneath the OHCs (Kuriyama et al., 1994; Engel et al., 2006) and of glutamate uptake systems in Deiters' cells (Furness et al., 2002) additionally support a role for OHCs in afferent signaling.
Possible function of OHC afferent signaling
Currently, the OHC is viewed as a sound-driven local amplifier in which the gain is adjusted by the medial efferent system. The question arises as to what signal drives the neurons in the medial olivary complex (MOC) (ipsilateral and contralateral) to fine-tune the degree of OHC inhibition. The shortest response latencies (<10 ms) of MOC neurons at high sound intensities indicate that the fast, myelinated and thick type I afferents from the IHCs activate the feedback system (Liberman and Brown, 1986; Brown, 1993). Conversely, most MOC units do not respond to brief acoustic stimuli but require tone bursts of substantial duration (>25 ms) (Liberman and Brown, 1986). A participation of the slower type II afferents in evoking the slower components of the MOC response may therefore be considered.
A general question in hearing physiology is how approximately six orders of magnitude of sound pressure are encoded. Coding of this large dynamic range requires different mechanisms such as (1) OHCs acting as the cochlear amplifier, (2) differential sensitivities of type I fibers (Liberman, 1982), (3) modulation of the type I signals by the lateral efferent olivocochlear system (Ruel et al., 2006), and (4) recruitment of neighboring IHCs at high sound pressure levels. All of these mechanisms likely confer nonlinearities in the processing of the acoustic stimuli. Using an afferent signal from the outer rather than inner hair cells may have advantages in coding loudness. Despite the fact that the type II afferents need time for integrating OHC activity in space over ∼100 μm and for conducting it to the cochlear nucleus, their signal amplitudes might be less distorted than the signals of the different type I afferents, because they only should be influenced by the current state of OHC inhibition by the MOC neurons.
Together, we have collected evidence supporting the idea of a functional afferent signaling of OHCs. We cannot exclude, however, that part of the Ca2+ influx subserves additional functions such as activating adjacent Ca2+-activated K+ (SK2/BK) channels (Oliver et al., 2000; Ruttiger et al., 2004) or triggering Ca2+-induced Ca2+ release from intracellular Ca2+ stores (Lioudyno et al., 2004).
Footnotes
This work was supported by Deutsche Forschungsgemeinschaft Grants DFG-En294/3-4-5 (J.E.) and DFG-Kni316/4-1 (M.K.). We thank Sylvia Kasperek, Karin Rohbock, and Oliver Hendrich for excellent technical assistance and Hans-Peter Zenner for his continuous support.
References
- Benson TE, Brown MC. Postsynaptic targets of type II auditory nerve fibers in the cochlear nucleus. J Assoc Res Otolaryngol. 2004;5:111–125. doi: 10.1007/s10162-003-4012-3. [DOI] [PMC free article] [PubMed] [Google Scholar]
- Berglund AM, Ryugo DK. Hair cell innervation by spiral ganglion neurons in the mouse. J Comp Neurol. 1987;255:560–570. doi: 10.1002/cne.902550408. [DOI] [PubMed] [Google Scholar]
- Beurg M, Evans MG, Hackney CM, Fettiplace R. A large-conductance calcium-selective mechanotransducer channel in mammalian cochlear hair cells. J Neurosci. 2006;26:10992–11000. doi: 10.1523/JNEUROSCI.2188-06.2006. [DOI] [PMC free article] [PubMed] [Google Scholar]
- Beutner D, Moser T. The presynaptic function of mouse cochlear inner hair cells during development of hearing. J Neurosci. 2001;21:4593–4599. doi: 10.1523/JNEUROSCI.21-13-04593.2001. [DOI] [PMC free article] [PubMed] [Google Scholar]
- Brandt A, Striessnig J, Moser T. CaV1.3 channels are essential for development and presynaptic activity of cochlear inner hair cells. J Neurosci. 2003;23:10832–10840. doi: 10.1523/JNEUROSCI.23-34-10832.2003. [DOI] [PMC free article] [PubMed] [Google Scholar]
- Brandt N, Kuhn S, Münkner S, Braig C, Winter H, Blin N, Vonthein R, Knipper M, Engel J. Thyroid hormone deficiency affects postnatal spiking activity and expression of Ca2+ and K+ channels in rodent inner hair cells. J Neurosci. 2007;27:3174–3186. doi: 10.1523/JNEUROSCI.3965-06.2007. [DOI] [PMC free article] [PubMed] [Google Scholar]
- Brown MC. Anatomical and physiological studies of type I and type II spiral ganglion neurons. In: Merchán MA, editor. The mammalian cochlear nuclei: organization and function. New York: Plenum; 1993. pp. 43–54. [Google Scholar]
- Brown MC. Antidromic responses of single units from the spiral ganglion. J Neurophysiol. 1994;71:1835–1847. doi: 10.1152/jn.1994.71.5.1835. [DOI] [PubMed] [Google Scholar]
- Brownell WE, Bader CR, Bertrand D, de Ribaupierre Y. Evoked mechanical responses of isolated cochlear outer hair cells. Science. 1985;227:194–196. doi: 10.1126/science.3966153. [DOI] [PubMed] [Google Scholar]
- Chen C, Nenov A, Norris CH, Bobbin RP. ATP modulation of L-type calcium channel currents in guinea pig outer hair cells. Hear Res. 1995;86:25–33. doi: 10.1016/0378-5955(95)00050-e. [DOI] [PubMed] [Google Scholar]
- Dallos P. Neurobiology of cochlear inner and outer hair cells: intracellular recordings. Hear Res. 1986;22:185–198. doi: 10.1016/0378-5955(86)90095-x. [DOI] [PubMed] [Google Scholar]
- Dallos P, Corey ME. The role of outer hair cell motility in cochlear tuning. Curr Opin Neurobiol. 1991;1:215–220. doi: 10.1016/0959-4388(91)90081-h. [DOI] [PubMed] [Google Scholar]
- Davis H. An active process in cochlear mechanics. Hear Res. 1983;9:79–90. doi: 10.1016/0378-5955(83)90136-3. [DOI] [PubMed] [Google Scholar]
- Dou H, Vazquez AE, Namkung Y, Chu H, Cardell EL, Nie L, Parson S, Shin HS, Yamoah EN. Null mutation of alpha1D Ca2+ channel gene results in deafness but no vestibular defect in mice. J Assoc Res Otolaryngol. 2004;5:215–226. doi: 10.1007/s10162-003-4020-3. [DOI] [PMC free article] [PubMed] [Google Scholar]
- Ehret G. Quantitative analysis of nerve fibre densities in the cochlea of the house mouse (Mus musculus) J Comp Neurol. 1979;183:73–88. doi: 10.1002/cne.901830107. [DOI] [PubMed] [Google Scholar]
- Ehret G. Behavioural studies on auditory development in mammals in relation to higher nervous system functioning. Acta Otolaryngol Suppl. 1985;421:31–40. doi: 10.3109/00016488509121754. [DOI] [PubMed] [Google Scholar]
- Engel J, Braig C, Ruttiger L, Kuhn S, Zimmermann U, Blin N, Sausbier M, Kalbacher H, Munkner S, Rohbock K, Ruth P, Winter H, Knipper M. Two classes of outer hair cells along the tonotopic axis of the cochlea. Neuroscience. 2006;143:837–849. doi: 10.1016/j.neuroscience.2006.08.060. [DOI] [PubMed] [Google Scholar]
- Felix H. Anatomical differences in the peripheral auditory system of mammals and man. A mini review. Adv Otorhinolaryngol. 2002;59:1–10. doi: 10.1159/000059235. [DOI] [PubMed] [Google Scholar]
- Furness DN, Hulme JA, Lawton DM, Hackney CM. Distribution of the glutamate/aspartate transporter GLAST in relation to the afferent synapses of outer hair cells in the guinea pig cochlea. J Assoc Res Otolaryngol. 2002;3:234–247. doi: 10.1007/s101620010064. [DOI] [PMC free article] [PubMed] [Google Scholar]
- Glueckert R, Wietzorrek G, Kammen-Jolly K, Scholtz A, Stephan K, Striessnig J, Schrott-Fischer A. Role of class D L-type Ca2+ channels for cochlear morphology. Hear Res. 2003;178:95–105. doi: 10.1016/s0378-5955(03)00054-6. [DOI] [PubMed] [Google Scholar]
- He DZ, Jia S, Dallos P. Mechanoelectrical transduction of adult outer hair cells studied in a gerbil hemicochlea. Nature. 2004;429:766–770. doi: 10.1038/nature02591. [DOI] [PubMed] [Google Scholar]
- Hille B. Sunderland, MA: Sinauer; 1991. Ionic channels of excitable membranes. [Google Scholar]
- Hossain WA, Antic SD, Yang Y, Rasband MN, Morest DK. Where is the spike generator of the cochlear nerve? Voltage-gated sodium channels in the mouse cochlea. J Neurosci. 2005;25:6857–6868. doi: 10.1523/JNEUROSCI.0123-05.2005. [DOI] [PMC free article] [PubMed] [Google Scholar]
- Housley GD, Marcotti W, Navaratnam D, Yamoah EN. Hair cells - beyond the transducer. J Membr Biol. 2006;209:89–118. doi: 10.1007/s00232-005-0835-7. [DOI] [PubMed] [Google Scholar]
- Jagger DJ, Housley GD. Membrane properties of type II spiral ganglion neurones identified in a neonatal rat cochlear slice. J Physiol (Lond) 2003;552:525–533. doi: 10.1113/jphysiol.2003.052589. [DOI] [PMC free article] [PubMed] [Google Scholar]
- Johnson SL, Marcotti W, Kros CJ. Increase in efficiency and reduction in Ca2+ dependence of exocytosis during development of mouse inner hair cells. J Physiol (Lond) 2005;563:177–191. doi: 10.1113/jphysiol.2004.074740. [DOI] [PMC free article] [PubMed] [Google Scholar]
- Kharkovets T, Dedek K, Maier H, Schweizer M, Khimich D, Nouvian R, Vardanyan V, Leuwer R, Moser T, Jentsch TJ. Mice with altered KCNQ4 K+ channels implicate sensory outer hair cells in human progressive deafness. EMBO J. 2006;25:642–652. doi: 10.1038/sj.emboj.7600951. [DOI] [PMC free article] [PubMed] [Google Scholar]
- Khimich D, Nouvian R, Pujol R, Tom Dieck S, Egner A, Gundelfinger ED, Moser T. Hair cell synaptic ribbons are essential for synchronous auditory signalling. Nature. 2005;434:889–894. doi: 10.1038/nature03418. [DOI] [PubMed] [Google Scholar]
- Knipper M, Bandtlow C, Gestwa L, Kopschall I, Rohbock K, Wiechers B, Zenner HP, Zimmermann U. Thyroid hormone affects Schwann cell and oligodendrocyte gene expression at the glial transition zone of the VIIIth nerve prior to cochlea function. Development. 1998;125:3709–3718. doi: 10.1242/dev.125.18.3709. [DOI] [PubMed] [Google Scholar]
- Knipper M, Zinn C, Maier H, Praetorius M, Rohbock K, Kopschall I, Zimmermann U. Thyroid hormone deficiency before the onset of hearing causes irreversible damage to peripheral and central auditory systems. J Neurophysiol. 2000;83:3101–3112. doi: 10.1152/jn.2000.83.5.3101. [DOI] [PubMed] [Google Scholar]
- Kuriyama H, Jenkins O, Altschuler RA. Immunocytochemical localization of AMPA selective glutamate receptor subunits in the rat cochlea. Hear Res. 1994;80:233–240. doi: 10.1016/0378-5955(94)90114-7. [DOI] [PubMed] [Google Scholar]
- Liberman MC. Single-neuron labeling in the cat auditory nerve. Science. 1982;216:1239–1241. doi: 10.1126/science.7079757. [DOI] [PubMed] [Google Scholar]
- Liberman MC, Brown MC. Physiology and anatomy of single olivocochlear neurons in the cat. Hear Res. 1986;24:17–36. doi: 10.1016/0378-5955(86)90003-1. [DOI] [PubMed] [Google Scholar]
- Lioudyno M, Hiel H, Kong JH, Katz E, Waldman E, Parameshwaran-Iyer S, Glowatzki E, Fuchs PA. A “synaptoplasmic cistern” mediates rapid inhibition of cochlear hair cells. J Neurosci. 2004;24:11160–11164. doi: 10.1523/JNEUROSCI.3674-04.2004. [DOI] [PMC free article] [PubMed] [Google Scholar]
- Marcotti W, Kros CJ. Developmental expression of the potassium current IK,n contributes to maturation of mouse outer hair cells. J Physiol (Lond) 1999;520:653–660. doi: 10.1111/j.1469-7793.1999.00653.x. [DOI] [PMC free article] [PubMed] [Google Scholar]
- Marcotti W, Geleoc GS, Lennan GW, Kros CJ. Transient expression of an inwardly rectifying potassium conductance in developing inner and outer hair cells along the mouse cochlea. Pflügers Arch. 1999;439:113–122. doi: 10.1007/s004249900157. [DOI] [PubMed] [Google Scholar]
- Marcotti W, Johnson SL, Rusch A, Kros CJ. Sodium and calcium currents shape action potentials in immature mouse inner hair cells. J Physiol (Lond) 2003;552:743–761. doi: 10.1113/jphysiol.2003.043612. [DOI] [PMC free article] [PubMed] [Google Scholar]
- Michna M, Knirsch M, Hoda JC, Muenkner S, Langer P, Platzer J, Striessnig J, Engel J. Cav1.3 (alpha1D) Ca2+ currents in neonatal outer hair cells of mice. J Physiol (Lond) 2003;553:747–758. doi: 10.1113/jphysiol.2003.053256. [DOI] [PMC free article] [PubMed] [Google Scholar]
- Muller M. Frequency representation in the rat cochlea. Hear Res. 1991;51:247–254. doi: 10.1016/0378-5955(91)90041-7. [DOI] [PubMed] [Google Scholar]
- Nadol JB., Jr Comparative anatomy of the cochlea and auditory nerve in mammals. Hear Res. 1988;34:253–266. doi: 10.1016/0378-5955(88)90006-8. [DOI] [PubMed] [Google Scholar]
- Nakagawa T, Kakehata S, Akaike N, Komune S, Takasaka T, Uemura T. Calcium channel in isolated outer hair cells of guinea pig cochlea. Neurosci Lett. 1991;125:81–84. doi: 10.1016/0304-3940(91)90136-h. [DOI] [PubMed] [Google Scholar]
- Neher E. Correction for liquid junction potentials in patch clamp experiments. Methods Enzymol. 1992;207:123–131. doi: 10.1016/0076-6879(92)07008-c. [DOI] [PubMed] [Google Scholar]
- Oliver D, Fakler B. Expression density and functional characteristics of the outer hair cell motor protein are regulated during postnatal development in rat. J Physiol (Lond) 1999;519:791–800. doi: 10.1111/j.1469-7793.1999.0791n.x. [DOI] [PMC free article] [PubMed] [Google Scholar]
- Oliver D, Klocker N, Schuck J, Baukrowitz T, Ruppersberg JP, Fakler B. Gating of Ca2+-activated K+ channels controls fast inhibitory synaptic transmission at auditory outer hair cells. Neuron. 2000;26:595–601. doi: 10.1016/s0896-6273(00)81197-6. [DOI] [PubMed] [Google Scholar]
- Platzer J, Engel J, Schrott-Fischer A, Stephan K, Bova S, Chen H, Zheng H, Striessnig J. Congenital deafness and sinoatrial node dysfunction in mice lacking class D L-type Ca2+ channels. Cell. 2000;102:89–97. doi: 10.1016/s0092-8674(00)00013-1. [DOI] [PubMed] [Google Scholar]
- Reid MA, Flores-Otero J, Davis RL. Firing patterns of type II spiral ganglion neurons in vitro. J Neurosci. 2004;24:733–742. doi: 10.1523/JNEUROSCI.3923-03.2004. [DOI] [PMC free article] [PubMed] [Google Scholar]
- Robertson D. Horseradish peroxidase injection of physiologically characterized afferent and efferent neurones in the guinea pig spiral ganglion. Hear Res. 1984;15:113–121. doi: 10.1016/0378-5955(84)90042-x. [DOI] [PubMed] [Google Scholar]
- Robertson D, Sellick PM, Patuzzi R. The continuing search for outer hair cell afferents in the guinea pig spiral ganglion. Hear Res. 1999;136:151–158. doi: 10.1016/s0378-5955(99)00120-3. [DOI] [PubMed] [Google Scholar]
- Ruel J, Wang J, Rebillard G, Eybalin M, Lloyd R, Pujol R, Puel JL. Physiology, pharmacology and plasticity at the inner hair cell synaptic complex. Hear Res. 2006;227:19–27. doi: 10.1016/j.heares.2006.08.017. [DOI] [PubMed] [Google Scholar]
- Russell IJ, Sellick PM. Low-frequency characteristics of intracellularly recorded receptor potentials in guinea-pig cochlear hair cells. J Physiol (Lond) 1983;338:179–206. doi: 10.1113/jphysiol.1983.sp014668. [DOI] [PMC free article] [PubMed] [Google Scholar]
- Russell IJ, Cody AR, Richardson GP. The responses of inner and outer hair cells in the basal turn of the guinea-pig cochlea and in the mouse cochlea grown in vitro. Hear Res. 1986;22:199–216. doi: 10.1016/0378-5955(86)90096-1. [DOI] [PubMed] [Google Scholar]
- Ruttiger L, Sausbier M, Zimmermann U, Winter H, Braig C, Engel J, Knirsch M, Arntz C, Langer P, Hirt B, Muller M, Kopschall I, Pfister M, Munkner S, Rohbock K, Pfaff I, Rusch A, Ruth P, Knipper M. Deletion of the Ca2+-activated potassium (BK) alpha-subunit but not the BKbeta1-subunit leads to progressive hearing loss. Proc Natl Acad Sci USA. 2004;101:12922–12927. doi: 10.1073/pnas.0402660101. [DOI] [PMC free article] [PubMed] [Google Scholar]
- Santos-Sacchi J. Reversible inhibition of voltage-dependent outer hair cell motility and capacitance. J Neurosci. 1991;11:3096–3110. doi: 10.1523/JNEUROSCI.11-10-03096.1991. [DOI] [PMC free article] [PubMed] [Google Scholar]
- Schimmang T, Tan J, Muller M, Zimmermann U, Rohbock K, Kopschall I, Limberger A, Minichiello L, Knipper M. Lack of Bdnf and TrkB signalling in the postnatal cochlea leads to a spatial reshaping of innervation along the tonotopic axis and hearing loss. Development. 2003;130:4741–4750. doi: 10.1242/dev.00676. [DOI] [PubMed] [Google Scholar]
- Schug N, Braig C, Zimmermann U, Engel J, Winter H, Ruth P, Blin N, Pfister M, Kalbacher H, Knipper M. Differential expression of otoferlin in brain, vestibular system, immature and mature cochlea of the rat. Eur J Neurosci. 2006;24:3372–3380. doi: 10.1111/j.1460-9568.2006.05225.x. [DOI] [PubMed] [Google Scholar]
- Shen Y, Yu D, Hiel H, Liao P, Yue DT, Fuchs PA, Soong TW. Alternative splicing of the Cav1.3 channel IQ domain, a molecular switch for Ca2+-dependent inactivation within auditory hair cells. J Neurosci. 2006;26:10690–10699. doi: 10.1523/JNEUROSCI.2093-06.2006. [DOI] [PMC free article] [PubMed] [Google Scholar]
- Siegel JH, Zeddies DG. Intact explanted adult gerbil cochleae maintained at body temperature. Assoc Res Otolaryngol Abstr. 2001;24:858. [Google Scholar]
- Sobkowicz HM, Rose JE, Scott GL, Levenick CV. Distribution of synaptic ribbons in the developing organ of Corti. J Neurocytol. 1986;15:693–714. doi: 10.1007/BF01625188. [DOI] [PubMed] [Google Scholar]
- Spoendlin H. The innervation of the cochlea receptor. In: Moller A, editor. Mechanisms in hearing. New York: Academic; 1973. pp. 185–229. [Google Scholar]
- Spoendlin H. Anatomy of cochlear innervation. Am J Otolaryngol. 1985;6:453–467. doi: 10.1016/s0196-0709(85)80026-0. [DOI] [PubMed] [Google Scholar]
- Takasaka T, Shinkawa H. Serial section reconstruction of the guinea pig outer hair cells as studied with a high-voltage electron microscope and a computer-graphic display. Acta Otolaryngol Suppl. 1987;435:7–20. doi: 10.3109/00016488709107345. [DOI] [PubMed] [Google Scholar]
- Wiechers B, Gestwa G, Mack A, Carroll P, Zenner HP, Knipper M. A changing pattern of brain-derived neurotrophic factor expression correlates with the rearrangement of fibers during cochlear development of rats and mice. J Neurosci. 1999;19:3033–3042. doi: 10.1523/JNEUROSCI.19-08-03033.1999. [DOI] [PMC free article] [PubMed] [Google Scholar]
- Zidanic M, Fuchs PA. Kinetic analysis of barium currents in chick cochlear hair cells. Biophys J. 1995;68:1323–1336. doi: 10.1016/S0006-3495(95)80305-X. [DOI] [PMC free article] [PubMed] [Google Scholar]