

Abstract
GABAergic neurons of the globus pallidus (GP) play critical roles in basal ganglia function by virtue of their widespread axonal projections to all parts of the basal ganglia. They also possess local axon collaterals. In view of the importance of GABAergic inputs in sculpting neuronal activity, we quantitatively characterized the local axon collaterals of individual GP neurons by in vivo recording, juxtacellular labeling, reconstruction, and light and electron microscopic analysis in the rat. All labeled GP neurons had similar firing properties and gave rise to local axon collaterals, the main synaptic targets of which were perikarya and primary dendrites. The neurons could be divided into two populations; neurons located within ∼100 μm of the striatopallidal border (“outer” neurons), which possess a mean of 264 local axonal boutons, and those located ∼100 μm or more from the striatopallidal border (“inner” neurons), which possess a mean of 581 local axonal boutons. The local axon collaterals gave rise to arborizations close to, or within, the parent dendritic field and arborizations located caudal, medial, and ventral to the parent neuron. The qualitative and quantitative differences in the connectivity of neurons located in the outer and inner regions of the GP underlie a complex microcircuitry that follows an asymmetric rostral to caudal organization. These data suggest that the GP should no longer be considered as an homogeneous relay nucleus that simply transmits striatal information to the subthalamic nucleus and basal ganglia output nuclei, but rather as a structure that can perform complex computations within its borders.
Keywords: basal ganglia, striatopallidal, synapses, microcircuits, local axon collaterals, globus pallidus
Introduction
The globus pallidus (GP; homologous to the external segment of the GP in primates) is located in a central position in the macrocircuits of the basal ganglia (Albin et al., 1989; DeLong, 1990; Smith et al., 1998; Bolam et al., 2000) and, as such, the activity of GP neurons is critical in defining basal ganglia output signals and the expression of basal ganglia function. Neurons of the GP, by virtue of their complex and widespread axon collaterals, are in a position to influence activity and the flow of information at every level of the basal ganglia. Thus, all GP neurons project to the subthalamic nucleus (STN) and to the basal ganglia output nuclei (substantia nigra pars reticulata and entopeduncular nucleus or internal segment of the GP in primates), some also innervate the substantia nigra pars compacta, and about a third of them also project back to the striatum (Kita and Kitai, 1994; Bevan et al., 1998; Sato et al., 2000). Furthermore, GP neurons also give rise to local axon collaterals (Falls et al., 1983; Kita and Kitai, 1994; Bevan et al., 1998; Sato et al., 2000). Although a great deal is known about the organization and synaptic targets of the long-projecting collaterals of GP neurons, very little is known about the qualitative and quantitative features of their local axonal connections.
The activity of principal neurons in many regions of the brain, including the hippocampus and striatum, is critically dependent on the activity of GABA interneurons and on the precise placement of their GABAergic synapses (Klausberger et al., 2003, 2004; Koos et al., 2004; Tepper and Bolam, 2004; Somogyi and Klausberger, 2005). Furthermore, when the principal neuron is also GABAergic, as is the case in the striatum, lateral interactions between principal neurons also play a critical role in defining their output characteristics (Koos et al., 2004). There is little evidence of GABAergic interneurons in the GP, but principal neurons are GABAergic. Thus, the fundamental operations performed by neurons of the GP (i.e., the processing and integration of signals derived from the striatum and the STN) are likely to depend not only on their intrinsic membrane properties, but also on the precise localization of GABAergic afferents derived from the local axon collaterals of other GP neurons. A detailed understanding of the synaptic organization of the GP is required to accurately interpret the activity and responses of its constituent neurons. It thus follows that to better appreciate the complex functions of the GP, it is necessary to define in both qualitative and quantitative terms the intrinsic connectivity between GP neurons. The aim of the present study was to define the organizational principles of the local axonal arborizations of GP neurons and to quantitatively characterize their synaptic targets. To address this, single GP neurons were labeled in vivo using the juxtacellular method (Pinault, 1996; Bevan et al., 1998) and their local axonal arborizations within the GP were analyzed by both light and electron microscopy.
Materials and Methods
Electrophysiological recording and juxtacellular labeling of GP neurons.
Experimental procedures were performed on adult male Sprague Dawley rats (Charles River, Margate, UK) and were conducted in accordance with the Animals (Scientific Procedures) Act 1986 (United Kingdom) and the Society for Neuroscience policy on the use of animals in research.
Electrophysiological recordings and juxtacellular labeling of GP neurons were performed in 17 rats (200–350 g). Anesthesia was induced with isoflurane (Isoflo; Schering-Plough, Welwyn Garden City, UK) and maintained with urethane (1.3 g/kg, i.p.; ethyl carbamate; Sigma, Poole, UK) and supplemental doses of ketamine (30 mg/kg, i.p., Ketaset; Willows Francis, Crawley, UK) and xylazine (3 mg/kg, i.p.; Rompun; Bayer, Leverkusen, Germany) as described previously (Magill et al., 2000, 2001). All wound margins were infiltrated with local anesthetic (0.75% w/v bupivacaine; Astra, Kings Langley, UK) and corneal dehydration was prevented with application of Hypromellose eye drops (Norton Pharmaceuticals, Harlow, UK). Animals were then placed in a stereotaxic frame. Body temperature was maintained at 37 ± 0.5°C using a homeothermic heating device (Harvard Apparatus, Edenbridge, UK). Anesthesia levels were assessed by examination of the electrocorticogram (ECoG) (see below) and by testing reflexes to a cutaneous pinch or gentle corneal stimulation. Electrocardiographic activity and respiration rate were also monitored to ensure the animals' well being (see below). Mineral oil and/or saline solution (0.9% w/v NaCl) was applied to all areas of exposed cortex to prevent dehydration.
The ECoG was recorded using a 1 mm diameter steel screw juxtaposed to the dura mater above the right frontal cortex (2.7 mm rostral and 2.0 mm lateral of bregma) (Paxinos and Watson, 1986), and referenced against an indifferent electrode placed adjacent to the temporal musculature. Raw ECoG signals were bandpass filtered (0.1–150 Hz, −3 dB limits) and amplified (2000×; NL104 preamplifier; Digitimer, Welwyn Garden City, UK) before acquisition and on-line display. The electrocardiogram (ECG) was differentially recorded using two silver wires that were inserted subcutaneously into the ipsilateral forelimb and hindlimb. Raw ECG was bandpass filtered (10–100 Hz) and amplified (5000×; NL104; Digitimer) before acquisition and on-line display.
Extracellular recordings of the action potentials of single GP neurons were made with glass electrodes (15–20 MΩ in situ, tip diameters of 1–1.5 μm) that were filled with a 0.5 m NaCl solution containing 1.5% w/v Neurobiotin (Vector Laboratories, Peterborough, UK) as described previously (Magill et al., 2000). Recordings were made under stereotaxic guidance; putative GP neurons were readily identified by their high-frequency tonic firing (Magill et al., 2000). Extracellular signals from the electrode were amplified (10×) through the active bridge circuit of an Axoprobe-1A amplifier (Molecular Devices, Sunnyvale, CA), alternating current-coupled, amplified again (100×; NL-106; Digitimer), and bandpass filtered (between 0.3 and 5 kHz; NL125; Digitimer) before being displayed on a digital oscilloscope (Gould Instruments, Ilford, UK) and digitized (see below). Action potentials always exhibited an initial positive deflection and were often several millivolts in amplitude.
After recording spontaneous activity for 3–10 min, neurons were labeled with Neurobiotin by the juxtacellular method (Pinault, 1996; Bevan et al., 1998; Magill et al., 2000). Briefly, the electrode was advanced slowly toward the neuron while a microiontophoretic current was applied (1–10 nA anodal current, 200 ms duration, 50% duty cycle). The optimal position of the electrode was identified when the firing pattern of the neuron was robustly modulated by the microiontophoretic current. It was necessary to apply the microiontophoretic current in this manner for ≥12 min to obtain strong labeling of soma, dendrites, and axonal collaterals with the Neurobiotin. After sufficient time to allow for the diffusion of the Neurobiotin throughout the local axon collaterals and beyond (at least 4 h), animals were then given a lethal dose of anesthetic and perfused via the ascending aorta with 100 ml of 0.01 m PBS at pH 7.4, followed by 300 ml of 0.1% w/v glutaraldehyde and 4% w/v paraformaldehyde in 0.1 m phosphate buffer (PB), pH 7.4, and then by of 100 ml of PBS.
Visualization of juxtacellularly labeled neurons.
Standard histochemical procedures were used to visualize juxtacellularly labeled cells (Horikawa and Armstrong, 1988; Pinault, 1996; Bevan et al., 1998). Briefly, the fixed brains were sectioned at 60 μm in the coronal or sagittal planes on a vibrating microtome (Leica Microsystems, Milton Keynes, UK) and collected in PBS. Those sections prepared for light microscopy alone were made permeable using 0.3% v/v Triton X-100 (Sigma) in the incubation solutions. Those sections for electron microscopy were subjected to two freeze–thaw cycles in cryoprotectant; they were frozen in isopentane cooled in liquid nitrogen and then in liquid nitrogen and thawed (von Krosigk and Smith, 1991). Sections were washed in PBS and incubated for 18–24 h at room temperature in avidin-biotin peroxidase complex (ABC Elite; 1:100; Vector Laboratories) in PBS containing 1% w/v bovine serum albumin (Sigma). After washing, the sections were incubated in 0.002% w/v hydrogen peroxide (Sigma) and 0.025% w/v diaminobenzidine tetrahydrochloride (DAB; Sigma) in the absence or presence of 0.5% w/v nickel ammonium sulfate (Ni-DAB; Sigma) dissolved in Tris buffer (0.05 m, pH 7.6 or 8.0) for 15–30 min. After washes in Tris buffer and PB, the sections were then postfixed in 1% w/v osmium tetroxide (Oxkem, Oxford, UK) in PB for 30 min and then dehydrated in an ascending series of dilutions of ethanol; 1% w/v uranyl acetate (GE Healthcare, High Wycombe, UK) was included in the 70% v/v ethanol solution for the sections prepared for electron microscopy. Finally, the sections were treated with propylene oxide (Sigma), equilibrated overnight in an electron microscope resin (Durcupan ACM; Fluka, Gillingham, UK), mounted on glass slides, and cured at 60°C for 48 h.
Acquisition and analysis of electrophysiological data.
Unit activity was sampled at 16 kHz, and ECoG and ECG at 400 Hz, and digitized on-line with a PC running Spike2 acquisition and analysis software (version 4; Cambridge Electronic Design, Cambridge, UK). Portions of the spike trains composed of 150–250 spikes were isolated and used for statistical analysis of spontaneous unit discharge. The coefficient of variation (CV) of the interspike intervals was calculated as an indicator of regularity in point processes (Johnson, 1996); the lower the value of the CV, the more regular the unit activity. Mean firing frequency was calculated from the reciprocal of the mean interspike interval and expressed as mean and SD. Statistical comparisons of unpaired data were performed using the Mann–Whitney U test (SPSS; SPSS, Chicago, IL). The criterion for significance was the 95% level.
Three-dimensional reconstruction of labeled neurons.
The soma, dendrites, and complete local axonal arborizations of Neurobiotin-labeled GP neurons, as well as the boundaries of the GP, were traced from successive serial sections under a 100× oil-immersion objective and were digitized in three dimensions on a desktop computer running Neurolucida software (version 5; MicroBrightField, Williston, VT). Three-dimensional reconstructions of the neurons were visualized and analyzed using the accompanying software package, Neuroexplorer (MicroBrightField). The distance between the labeled soma and the nearest striatal border in the sagittal plane was recorded for each neuron. The numbers of axonal varicosities (boutons) along the local axon collaterals were recorded. The axonal arborizations and postsynaptic targets within the GP of some of the neurons were further examined by (correlated) light and electron microscopy. Light microscopic images of labeled neurons were captured using a digital camera (Coolsnap; Photometrics, Tucson, AZ) and Openlab software (version 2.2.5; Improvisions, Coventry, UK) on a Macintosh (Apple, Cupertino, CA) computer. Images were manipulated (contrast, brightness, and labeling) using Adobe (San Jose, CA) Photoshop software.
Electron microscopy.
After examination and digitization in the light microscope, areas of the axonal arborization within the GP were selected for additional analysis. The areas of interest were cut out from the microscope slide and glued to blank cylinders of resin. Serial ultrathin sections of 40–60 nm thickness were cut on an ultramicrotome (Reichert-Jung Ultracut E ultramicrotome; Leica) and collected on pioloform-coated single-slot copper grids. The ultrathin sections were then contrasted with lead citrate (Reynolds, 1963) for 2–3 min and examined in a Philips (FEI UK, Cambridge, UK) CM10 or CM100 electron microscope. Labeled boutons and axons were examined in serial sections to identify the types of synaptic specialization and their postsynaptic targets. Images from the electron microscope were recorded on film. High-quality prints or the negatives were then scanned and manipulated for contrast and brightness and labeled using Adobe Photoshop. Dimensions of the synaptic boutons were measured on the scanned images using public domain software, ImageJ 1.34 s (W. Rasband, National Institutes of Health, Bethesda, MD).
Statistical analysis of anatomical data.
Anatomical data were analyzed using a combination of statistical modeling and cluster analysis. Anatomical characteristics of the labeled neurons, such as the number of boutons, distance of soma to nearest striatal border, dendritic lengths, and somatic perimeters and cross-sectional areas were all examined for distribution patterns. An F test for comparing nested linear models (Thiel, 1971) was used to determine whether there was a correlation between the numbers of boutons in the local axonal arborizations and the location of the GP neuron with respect to the nearest striatal border.
Correction factors for tissue shrinkage.
To correct for the shrinkage of tissue that results from fixation, histochemical processing, and resin-embedding, a parallel bipolar electrode (pole separation of 500 μm; FHC, Bowdoinham, ME) was implanted under stereotaxic conditions into the GP/striatum on both sides of the brain of two anesthetized rats. After perfusion with fixative, the brains were sectioned in the horizontal plane and processed for electron microscopy following the same protocol as described above. The distance between the two small circular lesions created by the electrodes was measured in multiple sections (n = 10–20) using Neurolucida and compared with the known distance between the two parallel electrodes. The difference between the observed and expected distances was deemed to be caused by tissue shrinkage and, thus, was used to calculate correction factors for shrinkage in the x-axis and y-axis. The correction factor for shrinkage in the z-axis was obtained by comparing the thickness of sections at the end of histological processing, as measured using Neurolucida, to the measured thickness of 60 μm from “wet” unprocessed (but fixed) sections, as cut on the vibrating microtome. A total of twenty sections from three animals were used to calculate the shrinkage in the z-axis. The mean shrinkages in the x-axis and y-axis were 6.3 and 6.0%, respectively, and the mean shrinkage in the z-axis was 8.0%. All three-dimensional anatomical data were corrected according to these factors in Neuroexplorer.
Results
Juxtacellulary labeled neurons in the GP were filled with a dense blue-black reaction product when visualized with Ni-DAB as the chromogen for the peroxidase reaction, or a dense brown reaction product when visualized with DAB (Figs. 1, 2). A total of 26 neurons were labeled in 17 animals. Seventeen of the neurons were modulated by the iontophoretic current in excess of 12 min and were selected for detailed analysis and digital reconstruction. Labeling for this length of time gave rise to complete filling of the somatodendritic tree as evidenced by the tapering and “natural ends” of dendrites. Each of these neurons gave rise to an axon, which emerged from the cell body or a proximal dendrite, and the main axon (0.5–1.5 μm diameter) traversed in the same plane as the dendritic arborization and gave rise to local collaterals (Figs. 1, 2). The local collaterals branched frequently, giving rise to complex arborizations within the GP (Figs. 1, 2). The local axon arborizations were considered to be entirely labeled because collaterals of the main axon extended for long distances and entered the internal capsule, and were often seen to extend further caudally into the entopeduncular nucleus. In addition, six of the 17 neurons gave rise to collaterals that extended rostrally into the striatum.
Figure 1.
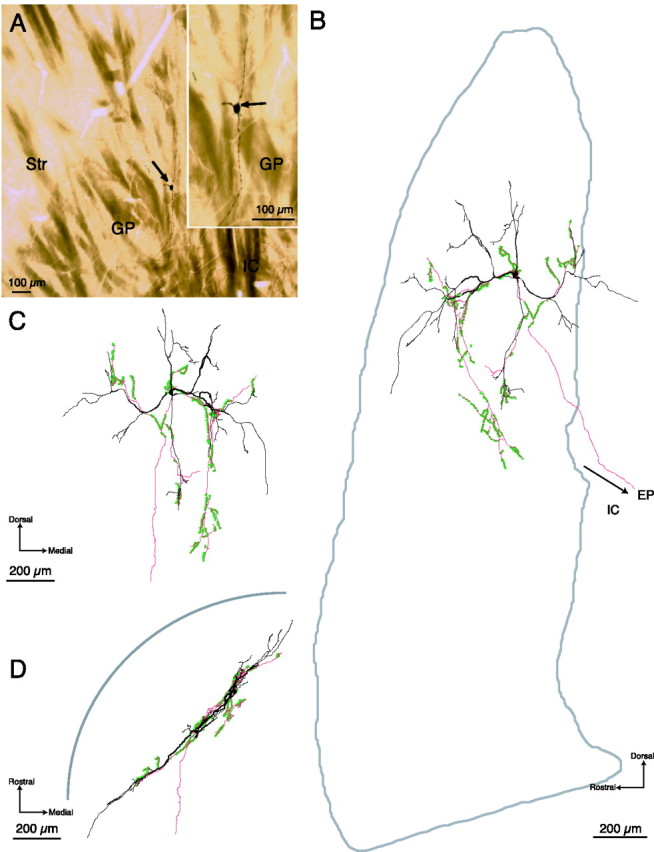
Light micrographs and digital reconstructions of an inner neuron in the GP. A, Low- and higher-power (inset) light micrographs of a sagittal section of the striatum (Str) and GP showing the location of the juxtacellularly labeled GP neuron (arrows). The neuron is classified as an inner neuron because it is located 449 μm from the striatopallidal border in the sagittal plane. Three of the primary dendrites emerging from the perikaryon are visible in the inset. Dorsal is toward the top, rostral is to the left. B–D, Digital reconstructions of the labeled neuron. The cell bodies and dendrites are indicated in black, the axon in red, and axonal boutons as green dots. B, Reconstruction in the sagittal plane. The approximate boundaries of the GP, reconstructed from the section containing the perikaryon, are included. C, Reconstruction in the coronal plane. D, Reconstruction in the horizontal plane. The approximate position of the striatopallidal boundary is illustrated diagrammatically. The dendritic arborization in the sagittal (B) and coronal (C) planes is radial and will, thus, present the maximal extent of its dendritic arborization to the incoming striatal afferents. However, when viewed in the horizontal plane (D), the dendritic and axonal arborizations appear restricted to a relatively narrow band. The axon emerges from the soma and gives rise to a complex arborization within the GP with 633 boutons. A main branch extends ventrocaudally into the internal capsule (IC) and caudally toward to the entopeduncular nucleus (EP). Within the GP, the arborization and distribution of boutons was heterogeneous with clusters present within the dendritic tree, referred to as the “proximal” arborization, and a cluster located ventral and medial to the cell body, referred to as the “distal” arborization (see also Fig. 4).
Figure 2.
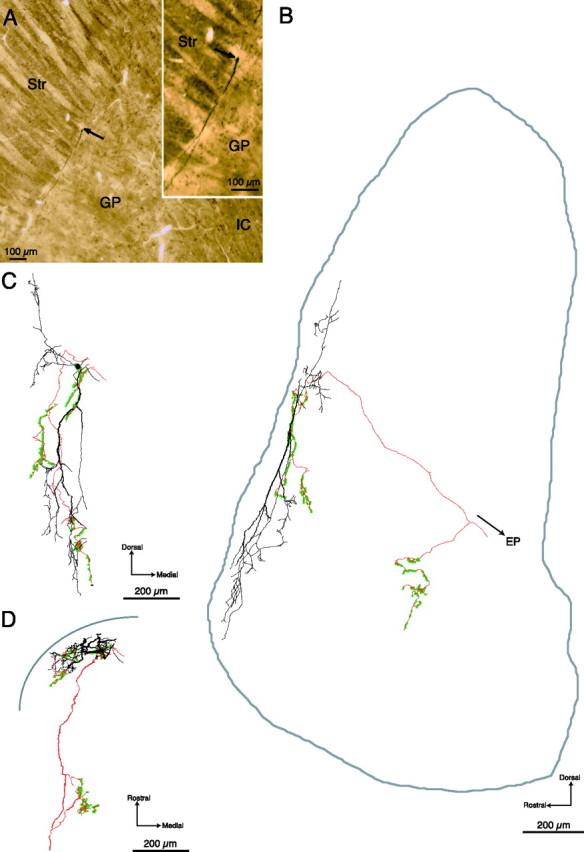
Light micrographs and digital reconstructions of an outer neuron in the GP. A, Low- and higher-power (inset) light micrographs of a sagittal section of the striatum (Str) and GP showing the location of the juxtacellularly labeled GP neuron (arrows). The neuron is classified as an outer neuron because its cell body is located 16 μm from the striatopallidal border. Two of the primary dendrites emerging from the perikaryon are visible in the micrographs and extend along the border between the striatum and the GP. B–D, Digital reconstructions of the labeled neuron. The cell body and dendrites are indicated in black, the axon in red, and the axonal boutons with green dots. B, Reconstruction in the sagittal plane. The approximate boundaries of the GP, reconstructed from the section containing the perikaryon, are included. C, Reconstruction in the coronal plane. D, Reconstruction in the horizontal plane. The dendritic arborization is bipolar when viewed in the sagittal (B) and the coronal planes (C), but compressed in the horizontal plane (D). The approximate position of the striatopallidal boundary is illustrated diagrammatically in D. Four primary dendrites emerge from the cell body, which extend within the GP parallel to the striatopallidal border and present their greatest dendritic extent in the sagittal and coronal plane to the incoming striatal afferents (C, D). The axon emerges from the soma and gives rise to a complex local arborization with 369 boutons. A main branch, which is not reconstructed here, extends ventrocaudally into the internal capsule and continues toward to the entopeduncular nucleus (EP). Within the GP, the axonal collaterals give rise to two distinct local arborizations: a proximal arborization located within the dendritic tree and a distal arborization that lies caudal and ventral to the neuron.
Two classes of GP neurons based on their location and their local axon collaterals
The local collaterals of GP neurons possessed varying numbers of varicosities (range, 135–649) distributed throughout their complex arborizations. Examination at the light microscopic level and analysis of the digitally reconstructed neurons (Figs. 1, 2) suggested that there was a correlation between the number of axonal varicosities and the location of the neurons with respect to the boundary between the GP and the striatum, such that neurons located close to the striatopallidal border possessed fewer axonal varicosities than those located in the more caudal and medial aspects of the GP. This hypothesis was tested by statistical analysis (Fig. 3). Using a one-grand-mean model, we first tested the hypothesis that the neurons formed a single group distributed about a single mean number of axonal boutons within the GP (mean, 413) (Fig. 3A). Using a two-grand-mean model, we then tested the hypothesis that the neurons consisted of two groups distributed around two mean numbers of axonal boutons within the GP (means of 581 and 264) (Fig. 3B). Using the residual sum of the squares (RSS) (i.e., the deviations of the observed number of boutons around the mean number of boutons), an F test for comparing nested linear models (Thiel, 1971) demonstrated that the probability of the one-grand-mean model being more valid than the two-grand-mean model is 0.00001, where the two-grand-mean model has the lowest RSS at the cutoff point of 96 μm from the striatopallidal border. This implies that GP neurons can best be divided into two populations on the basis of their location and the numbers of varicosities possessed by their local collaterals. Neurons located ≥96 μm from the striatopallidal border possess significantly more boutons (mean, 581; SD, 73; range, 464–649) than those neurons located within 96 μm of the striatopallidal border (mean, 264; SD, 90; range, 135–369) (p = 0.004, Mann–Whitney U test). Hereafter, these two populations of neurons are referred to as “inner” (n = 9) and “outer” (n = 8) neurons, respectively. On this basis, two of the inner neurons and four of the outer neurons gave rise to collaterals that extended rostrally into the striatum.
Figure 3.
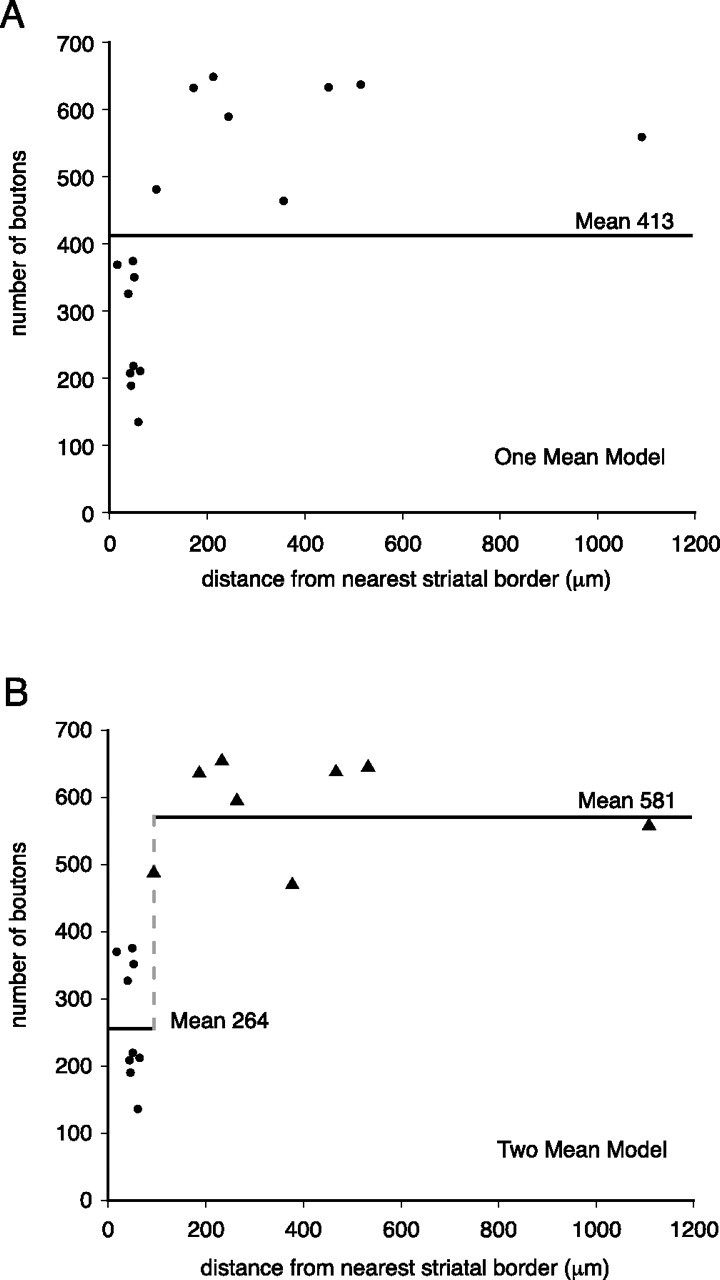
Neurons in the GP can be divided into two groups on the basis of their location and the number of boutons in the local axonal arborizations. Two statistical models were applied to examine the relationship between the numbers of boutons in the local collaterals and their location relative to the striatopallidal boundary. A, B, A one-grand-mean model (A) and a two-grand-mean model (B) were applied. An F test demonstrated that the probability of the one-grand-mean model being more valid than the two-grand-mean model is p = 0.00001. This implies that there are two populations of neurons within the GP (B) that are referred to as outer neurons (•) and inner neurons (▴) and possess an average of 264 and 581 boutons within the GP, respectively. The dashed line in B indicates the cutoff point between the two groups of neurons (96 μm from striatopallidal border) for which this model is most significant.
Organization of local axon collaterals
The distributions of varicosities along the complex axonal arborizations of both populations of neurons were variable. The maximum distance of axonal varicosities from the perikaryon varied between 490 and 1090 μm (mean, 700 μm; SD, 181) for outer neurons and 430–930 μm (mean, 710 μm; SD, 173) for inner neurons. In five of the outer neurons and two of the inner neurons, the distribution of the varicosities along the collaterals was clearly bimodal (Figs. 1, 2, 4A,C), with the initial peak in density of varicosities at ∼200 μm from the perikaryon and the second peak at ∼400–700 μm, depending on the size of the arborization. In the remainder of the neurons, the varicosities were more evenly distributed across the axonal arbor (Fig. 4B,D). For the neurons with the bimodal distribution, the first cluster of varicosities are referred to as the “proximal arborization” and the second cluster as the “distal arborization.” The trajectory of the collaterals giving rise to the distal arborization (or the distal components of the arborization of the nonbimodal neurons) followed the bundles of myelinated axons that traverse the GP and collect together to form part of the internal capsule (i.e., they were usually located caudal, ventral, and medial to the perikaryon). This suggests that the outer neurons are in a position to innervate their neighbors and also inner neurons located more medially and caudally, which, in turn, implies a rostral-to-caudal organization of the GP. Two of the inner neurons gave rise to collaterals that innervated the striatum and, thus, traversed the outer region of the GP. These collaterals gave rise to only a few boutons (16–20) in the outer region of the GP. These boutons collectively represent a tiny proportion (∼ 3%) of all of the boutons on the local axon collaterals of these inner neurons.
Figure 4.

A–D, Plots of the distribution of boutons in the axonal arborizations of outer (A, B) and inner (C, D) GP neurons. The plots illustrate the number of boutons in 10 μm bins from the perikaryon. The number of boutons and the maximal distance from the perikaryon is indicated in each plot. Note that for both outer (A) and inner (C) neurons, the location of boutons may display a distinctly bimodal distribution (A and C, respectively) in which the proximal and distal arborizations are clearly separated. Other neurons have a distribution of boutons that is more evenly spread over the whole of the axonal field (B, outer; D, inner).
Synaptic connections of the local axon collaterals of GP neurons
Although it was not possible to determine the postsynaptic targets of a labeled axon at the light microscopic level, varicosities of the local axon collaterals of GP neurons were often apposed to unlabeled perikarya (Figs. 5A, 6A) or large-diameter proximal dendrites (Fig. 5A). As many as 14 boutons were apposed to a single perikaryon and its proximal dendrite (Fig. 6). This implies, as has been suggested in previous studies (Falls et al., 1983; Kita and Kitai, 1994), that the proximal region of GP neurons is the main target of their collaterals, as is the case in the other target regions of GP neurons (Smith and Bolam 1990; Bevan et al., 1997, 1998; Smith et al., 1998).
Figure 5.
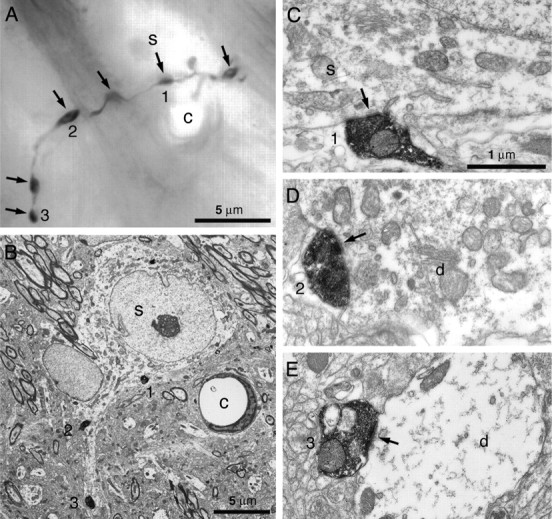
Synaptic targets of the local collaterals of GP neurons. A, Montage of five light microscopic digital images of part of the proximal axonal arborization of an inner GP neuron. This part of the axon gives rise to several boutons (arrows) that apposed the unstained soma (s) and proximal dendrite of a neighboring GP neuron. The three numbered boutons are shown in subsequent electron micrographs. B, Low-power electron micrograph of the same unstained soma and boutons 1–3 of the labeled axon. The micrograph is rotated ∼40° in the counter-clockwise direction with respect to the light micrograph. Note the position of the capillary (c) for correlation between the light and electron micrographs. C–E, High-power electron micrographs of serial sections of the three boutons. Each forms symmetrical synaptic contact (arrows) with the unstained soma (s) or its dendrite (d). Scale bar in C applies to D and E.
Figure 6.
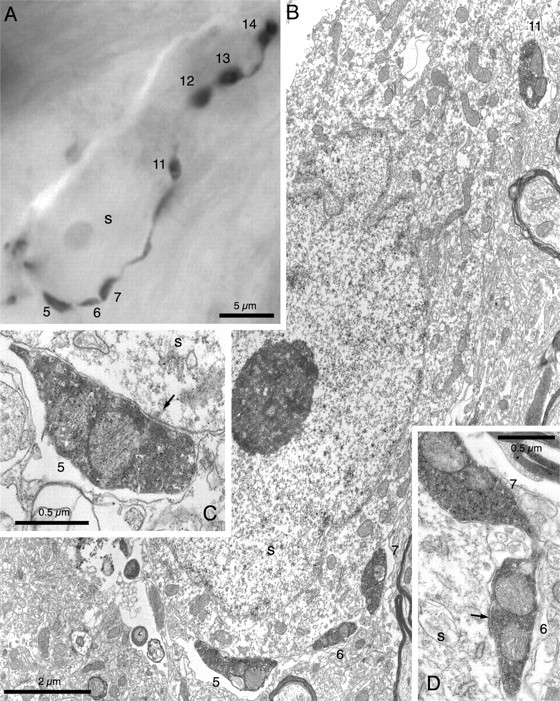
Synaptic targets of the local collaterals of GP neurons. A, Light micrograph of part of the distal axonal arborization of an outer GP neuron. This part of the axon formed a distinct “basket” around the unstained soma (s) of a neighboring GP neuron. The labeled axon gave rise to 14 boutons that were apposed to the cell body and proximal dendrites of the unstained neuron, seven of which are clearly visible at this focal depth (boutons 5–7 and 11–14). Ten of the boutons were examined at the electron microscope level and were found to make symmetrical synapses with the unstained neuron. Four of the synaptic boutons are illustrated in the subsequent electron micrographs. B, Low-power electron micrograph of part of the unstained neuron and four of the labeled boutons apposed to it (boutons 5–7, 11). The labeled axon and boutons are recognized by the electron-dense peroxidase reaction product that fills the labeled structures. Each of these boutons formed symmetrical synaptic contacts with the unstained neuron. The synaptic contacts (arrows) formed by boutons 5 and 6 are shown at higher magnification in C and D, respectively.
To determine directly the postsynaptic targets of the local axons of GP neurons, the labeled axonal arborizations were examined in the electron microscope. The labeled axons were identified by the electron-dense peroxidase reaction product that filled labeled structures and adhered to the internal surface of the plasma membrane and the outer surface of subcellular organelles including mitochondria (Figs. 5–7). The axonal varicosities observed at the light microscopic level were identified as vesicle-filled terminal and preterminal boutons. They possessed many of the characteristics of boutons of pallidal origin that have been identified in other regions of the basal ganglia (Smith et al., 1998). Thus, they were large, up to 1.5 μm2 in cross-sectional area, usually contained one or more mitochondria, contained small round or oval synaptic vesicles, and invariably formed symmetrical synapses with dendrites or perikarya (Figs. 5B–E, 6B–D, 7). Occasionally glial cells were observed to ensheath the synaptic boutons. They were also occasionally found to interdigitate with postsynaptic structures (Fig. 7A,B) or seemingly unrelated structures apposed to the bouton (Fig. 7A,C). Correlated light and electron microscopy revealed that 96% of putative synaptic boutons (n = 229), identified as such at the light microscopic level, formed clear synaptic specializations when examined at the electron microscopic level. Failure to detect clear synaptic specializations was usually attributable to the loss of sections in the series, dense reaction product obscuring the membranes, or suboptimal preservation of the tissue. Those boutons that were examined in serial sections were not observed to form multiple synapses with more than one structure. Thus, bouton counts can be considered equivalent to synapse counts. However, individual boutons did, on occasion, give rise to more than one active zone, but with the same postsynaptic structure. This is a common feature of pallidal terminals in other regions of the basal ganglia (Smith et al., 1998).
Figure 7.
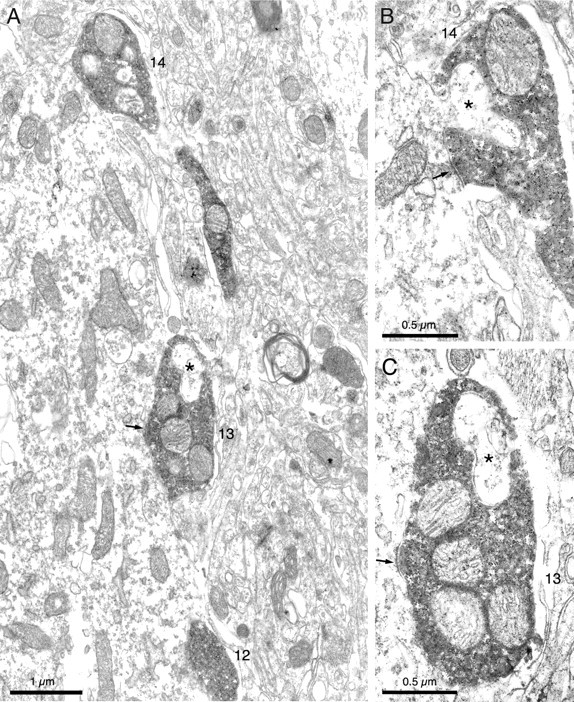
A, Low-power electron micrograph of another part of the cell body and an emerging proximal dendrite of the neuron illustrated in Figure 6 (rotated 45° counter-clockwise relative to the light micrograph in Fig. 6B). At this level, three boutons (12–14) are visible and two of them, boutons 13 and 14, form symmetrical synapses (arrows) with the unstained neuron and are shown at a higher power in serial sections in B and C, respectively. Note how the labeled boutons interdigitate with the postsynaptic structure (asterisk in B) or other structures apposed to the bouton (asterisk in C).
The electron microscopic analysis of the intrapallidal axon terminals was performed in two ways. The aim of the first approach was to give an indication of the overall distribution of the postsynaptic targets of the local collaterals. This was achieved by re-embedding parts of local axonal arborizations in blocks of resin, sectioning for electron microscopy, and characterizing all boutons and their postsynaptic targets identified in the electron microscope. Five arborizations were analyzed to determine the synaptic targets of inner neurons: the proximal arborizations and distal arborizations of the two neurons whose axonal arborizations were bimodally distributed (Fig. 4) plus the axonal arborization of an additional neuron that was located within the parent dendritic field. Similarly, five arborizations were analyzed to determine the synaptic targets of outer neurons (two for the proximal arborization and three for the distal arborization) (Table 1). For the inner neurons, 19.8% of the synaptic boutons of the proximal arborizations made contact with perikarya and 80% made contact with dendrites, whereas 56% of the synaptic boutons of the distal arborizations were in contact with perikarya and 44% in contact with dendrites. For the outer neurons, 6.3% of the synaptic boutons of the proximal arborizations made contact with perikarya and 93.7% with dendrites, whereas 48% of the synaptic boutons of the distal arborizations made contact with perikarya and 52% with dendrites. These data suggest that boutons of the local axon collaterals that arise close to the cell body are less likely to make synaptic contact with neighboring GP perikarya than those that arise at a distance from the parent cell body. However, the quantitative data from the Neurolucida reconstructions enabled us to categorize dendrites on the basis of their diameters into primary (≥1.6 μm) or higher-order dendrites (<1.6 μm). After applying these values, it was evident that the majority of the synaptic boutons of both the inner and outer neurons, in both their proximal and distal arborizations, made contact with the proximal regions of other GP neurons (i.e., perikaryon and primary dendrites; inner neurons: proximal, 67%; distal, 64%; outer neurons: proximal, 62.5%; distal, 74%). Overall, this means that 66.2% of boutons of inner neurons and 69.2% of the boutons of outer neurons contact the proximal regions of other GP neurons.
Table 1.
Synaptic targets of the local axon collaterals of GP neurons
| Synaptic targets | Inner neurons |
Outer neurons |
||
|---|---|---|---|---|
| Proximal (n = 3) | Distal (n = 2) | Proximal (n = 2) | Distal (n = 3) | |
| Perikarya | 21 (19.8%) | 34 (55.7%) | 2 (6.3%) | 22 (47.8%) |
| Primary dendrites | 50 (47.2%) | 5 (8.2%) | 18 (56.2%) | 12 (26.1%) |
| Higher-order dendrites | 35 (33.0%) | 22 (36.1%) | 12 (37.5%) | 12 (26.1%) |
| Total number of boutons | 106 | 61 | 32 | 46 |
Figures represent the numbers of synaptic boutons of the proximal and distal axon arborizations of inner or outer GP neurons in contact with different targets. n indicates the number of neurons analyzed.
The second approach to the electron microscopic analysis was to examine features of interest that were first identified at the light microscopic level (i.e., correlated light and electron microscopy). These included axons apposed to unstained dendrites (Fig. 5) and axons forming “baskets” around unstained perikarya (Figs. 6, 7). This analysis revealed that the axon terminals that were apposed to unstained perikarya or dendrites did in fact form symmetrical synaptic contacts (Figs. 5B–E, 6B–D, 7). The axon shown in Figure 6A gave rise to 14 boutons apposed to a single perikaryon and its proximal dendrite. Ten of the boutons were examined in the electron microscope and each was seen to be in symmetrical synaptic contact with the same neuronal perikaryon or its proximal dendrite (Figs. 6, 7). These data thus support the conclusions from the light microscopic study. The synapses identified using this approach were not included in the quantification of postsynaptic targets because they were not selected on a random basis.
Somatodendritic features of GP neurons
The somatodendritic features (Table 2) and orientation of the juxtacellularly labeled GP neurons were essentially consistent with previous studies using a variety of techniques, including Golgi impregnation and single-cell filling in rodents and primates (Iwahori and Mizuno, 1981; Park et al., 1982; Millhouse, 1986; Kita, 1994; Kita and Kitai, 1994; Yelnik et al., 1997). The perikarya of both inner and outer neurons were round, oval, or fusiform in shape, and had similar mean cross-sectional areas and perimeters (Table 2). Each neuron gave rise to three to five primary dendrites that branched repeatedly and spanned a large proportion of the GP (Figs. 1, 2). Outer neurons had a larger number of “dendritic ends” than inner neurons (outer neurons: mean, 57.3; SD, 14.7; inner neurons: mean, 39.3; SD, 14.6; p = 0.034 Mann–Whitney test), implying a greater degree of branching. However, although the total dendritic length of inner neurons was smaller, this was not significantly different (Table 2).
Table 2.
Morphological characteristics of GP neurons
| Inner neurons (n = 7) |
Outer neurons (n = 9) |
|||
|---|---|---|---|---|
| Mean | SD | Mean | SD | |
| Soma area (μm2) | 225.0 | 116.2 | 274.7 | 103.7 |
| Soma perimeter (μm) | 61.2 | 17.7 | 68.9 | 19.0 |
| Total dendritic length (μm) | 4817 | 1624 | 6436 | 1559 |
| Mean dendritic length (total length/number of dendrites; μm) | 124.2 | 7.2 | 121.0 | 52.5 |
Dendritic spines were observed on five of the outer neurons and two of the inner neurons. The location and density of spines was not analyzed quantitatively; however, qualitative observations were consistent in that spines were sparse on proximal dendrites (i.e., 1–5 spines between bifurcations), but at a higher density on higher-order dendrites (up to 30 spines between bifurcations). Although the dendrites generally tapered to a natural end, they were often beaded or varicose and occasionally, in their most distal parts, formed frequently branching, highly varicose, ramifications or tufts similar to those described previously (Francois et al., 1984; Millhouse, 1986). Electron microscopic analysis revealed that the dendritic varicosities are a consequence of the presence of one or more mitochondria, the combined diameter of which is greater than that of the dendrite (data not shown).
In agreement with previous studies, the dendritic arborizations of both the inner and outer neurons were orientated parallel to the striatopallidal border, such that each neuron presents its greatest dendritic extent to incoming striatal afferents (Iwahori and Mizuno, 1981; Park et al., 1982; Millhouse, 1986; Kita, 1994; Kita and Kitai, 1994; Yelnik et al., 1997). The dendrites of inner neurons were generally distributed in a radial manner in this plane (Fig. 1B,C), whereas the dendrites of neurons located closer to the striatopallidal borders (i.e., outer neurons) were distributed less evenly but in a more restricted volume in the GP (Fig. 2B,C). In both cases, the extent of the dendritic arborization was far greater in the plane parallel to the striatopallidal border than in the plane 90° to it (i.e., the plane in which striatal axons traverse the GP) (Figs. 1, compare B, C with D, 2, compare B, C with D).
Firing patterns of the juxtacellularly labeled GP neurons
All GP neurons displayed a highly regular, single-spike firing pattern during cortical slow-wave activity (Magill et al., 2000). Comparison of the firing properties of inner and outer neurons (Mann–Whitney test) revealed no difference in their mean firing rates (26.5 Hz; SD, 13.6 Hz, and 27.0 Hz; SD, 15.0 Hz, respectively) or the regularity of firing [mean coefficients of variation of 0.32 (SD, 0.09) and 0.31 (SD, 0.1), respectively].
Discussion
Our findings that pallidal neurons can be subdivided on the basis of their local synaptic connections have implications for our understanding of the microcircuits of the GP and how information is processed within the GP and the basal ganglia as a whole. They suggest that, contrary to what is proposed by the direct/indirect pathways model of basal ganglia organization (Albin et al., 1989; DeLong, 1990), the GP should not be considered a simple relay nucleus, but rather a structure that, through highly structured local axon collateral networks, can perform complex computations within its boundaries. Furthermore, it is clear that individual GP neurons play a pivotal role at every level of the basal ganglia (Kita and Kitai, 1994; Bevan et al., 1998; Bolam et al., 2000).
Local synaptic connections of GP neurons
In agreement with previous suggestions (Falls et al., 1983; Kita and Kitai, 1994), we found that the majority of boutons (63–74%) of both populations of neurons make synaptic contacts with the perikarya and primary dendrites of other GP neurons. They are thus placed in a strategically powerful position to influence the activity of neighboring neurons. The quantitative differences between the number of synaptic boutons arising from outer and inner neurons has implications for the number of synapses they receive from neighboring GP neurons. The axonal arborization of an outer GP neuron possesses, on average, 264 boutons. If we assume that connectivity is homogeneous across the GP (which, of course, may not be the case), an outer neuron will receive an average of 264 synaptic boutons from neighboring neurons. In reality, this number will be smaller because the distal arborization extends into the more caudomedial and ventral GP (i.e., toward the inner neurons). Similarly, because the average number of boutons in the arborization of an inner GP neuron is 581, an inner GP neuron will thus receive on average up to 581 synaptic boutons from neighboring GP neurons plus the additional boutons derived from the distal arborizations of outer neurons. Thus, inner neurons are likely to receive input from more than twice as many GP boutons than outer neurons and, because total dendritic lengths are similar, they are likely to have more than twice the density of input from GP boutons (Fig. 8).
Figure 8.

Diagrammatic representation of the organization of the GP that takes into account new data on intrinsic connectivity. The GP can be considered to be divided into at least two functional domains, an outer layer consisting of a 100-μm-wide band apposed to the striatal boundary and an inner layer that is more medial, caudal, and ventral (i.e., closer to the boundary with the internal capsule). Outer neurons located close to the striatal boundary receive afferent input from the striatum and other afferents that innervate the GP. Through their local collaterals, there is a lateral interaction between these neurons at synapses located mainly on perikarya and primary dendrites. “Processed” information is then transmitted to the targets of the GP, including the STN and basal ganglia output nuclei and also, via their distal collateral arborizations, to neurons located more medially and caudally, in the inner layer of the GP. These inner neurons receive, in addition to this processed striatal information, direct synaptic input from the striatum and from the other afferents of the GP. They also interact laterally with other inner neurons through their local collaterals, but, in quantitative terms, this is more extensive than for the outer neurons. The inner neurons, in turn, transmit the processed striatal information to the targets of the GP, including the STN and basal ganglia output nuclei.
The microcircuits of the GP
The present findings, together with the findings of other studies, enable us to define the rules governing the connectivity of neurons in the GP (Fig. 8). First, the GP can be considered to be divided into at least two domains, an outer region consisting of a 100-μm-wide band apposed to the striatal boundary, and a more medial and caudal inner region. Second, through their local collaterals, there is lateral interaction between outer neurons at synapses located mainly on perikarya and primary dendrites. A similar connectivity exists between inner neurons. Third, there is an asymmetry in the connections between outer and inner neurons. Indeed, outer neurons receive little input from inner neurons, but inner neurons are substantially innervated by outer neurons. Presumably, both outer and inner neurons receive inputs from the striatum, STN, and other extrinsic afferents of the GP. Thus, afferent information “processed” by outer neurons is transmitted to the targets of the GP and, in addition, to neurons located in the inner region of the GP. The inner neurons will thus receive afferent information by two routes: direct synaptic inputs from extrinsic afferents and indirect inputs through the outer GP neurons. Because the local collaterals of inner neurons also possess distal arborizations located medial and caudal to the parent cell body, we cannot exclude the possibility that the GP consists of a series of layers in which neurons receive progressively more input from neurons located more lateral and rostral.
The fact that neurons in both the “outer” and the “inner” divisions innervate GP targets, but are located at different positions in the pallidal microcircuits, suggests that striatal and other afferent information that has been processed in two ways (i.e., from outer and inner GP neurons) is transmitted to the targets of the basal ganglia. Differences in the nature of the information carried by these two pallidal outputs remains unknown, as is the way in which they relate to the topographic input/output characteristics of the GP. It is interesting to note, however, that anterograde and single cell-labeling studies reveal a dual representation of the striatum within the GP (Chang et al., 1981; Wilson and Phelan, 1982; Kawaguchi et al., 1990; Levesque and Parent, 2005). One band of striatal afferents innervate a region close to the striatal border and a second band innervates more medial and caudal regions of the GP. It is tempting to speculate that the organization of the GP that we have identified relates to this organization of striatal afferents and, because the two bands of striatal afferents appear to follow complex topographic rules and innervate different functional territories of the GP (Yelnik et al., 1996), it represents an additional system within the basal ganglia for the integration of functionally diverse information, in this case, at the level of the GP (Bevan et al., 1996, 1997; Haber et al., 2000, 2005; Ramanathan et al., 2002).
Functions of the local collaterals of GP neurons
These anatomical data suggest that intrinsic connectivity is important in sculpting the activity of GP neurons, whether in response to extrinsic inputs or as part of internal pallidal processing. Although the precise physiological mechanisms and postsynaptic effects of these local axon collaterals are unknown, they potentially allow GP neurons to fulfill functions that, in other brain regions, are undertaken by GABAergic interneurons. This may be especially important for the GP because the existence of interneurons is unlikely. Studies in the striatum and hippocampus suggest that local GABAergic inputs can reduce target activity by membrane hyperpolarization, provide “shunting” inhibition, drive activity through rebound responses, and/or phase-lock and synchronize activity (Freund and Buzsaki, 1996; Koos and Tepper, 1999; Klausberger et al., 2003, 2004, 2005; Koos et al. 2004; Tepper et al., 2004; Mallet et al., 2005, 2006; Somogyi and Klausberger, 2005). Our data suggest that the local collaterals of GP neurons can subserve these functions within the GP.
The activity of many (but not all) GP neurons is modulated in a phasic, bidirectional manner during motor (and cognitive) behavior (DeLong, 1971; Brotchie et al., 1991a,b; Mink and Thach, 1991a,b; Turner and Anderson, 1997; Arkadir et al., 2004; Turner and Anderson, 2005). It is commonly assumed that the excitatory responses of GP neurons are caused by increased glutamatergic drive from the STN, and that inhibitory responses are caused by GABAergic striatal inputs. Interconnections between GP neurons could, however, mediate both excitatory and inhibitory responses by feedforward disinhibitory and inhibitory processes. Task-related responses aside, pallido–pallidal connections might also partly underlie the spontaneous “pauses” in activity that are characteristic of primate external segment GP neurons during “resting” behavior (DeLong, 1972).
The organization of the intrapallidal collaterals that we describe could provide a center-surround type of antagonism for focused effects on the STN (and other targets). For example, if a spatially contiguous set of GP neurons were inhibited by enhanced striatal input, these now less-active GP neurons would then release from inhibition the pallidal neurons receiving collateral input from them. Assuming the entire ensemble of inhibited and disinhibited GP neurons targeted a spatially contiguous set of STN neurons, the pallidal inputs could create a focused subthalamic region of diminished inhibitory input surrounded by heightened inhibitory input. Thus, a very specific part of the STN would be disinhibited and produce enhanced excitatory input to output nuclei and GP.
Given the prominence of the local axon collateral network within the GP, it is surprising that GP neurons exhibit high firing rates (>20 Hz) in vivo and that correlated activity is rare (at least between pairs of GP neurons) (Bar-Gad et al., 2003; Stanford, 2003). It could be that during resting behavior, and in the presence of normal dopamine levels, pallido–pallidal synapses are relatively inefficacious (Kita et al., 2005). In support of this, functional connectivity in the GP, as indexed by coherent local field potentials, is variable and is dependent on brain state (Magill et al., 2006). Moreover, hyperpolarization- and cyclic nucleotide-activated channels located presynaptically on pallidal terminals paradoxically decrease the likelihood of GABA release (Boyes et al., 2007). Finally, chronic dopamine depletion dramatically increases the strength and incidence of synchronized activity in the GP (Filion and Tremblay, 1991; Nini et al., 1995; Raz et al., 2000, 2001). Correlated activity, however, may be uncommon because single GP neurons probably innervate a maximum of 194 other GP neurons (Sadek et al., 2005), which represents only 0.6% of the total population (Oorschot, 1996). Thus, if two GP neurons were randomly selected, the probability of finding a connected pair and correlated activity would be low (in the absence of a common driving input). Our data further predict, however, that the incidence of correlated activity would be higher for GP neurons of the inner division, where interconnectivity is greatest.
Our anatomical data highlight the highly structured organization of, and the functional significance of, the intrinsic connectivity of GP. Although the interconnections of GP neurons are rarely incorporated into models of basal ganglia functional organization, our data suggest their inclusion is necessary for advancing models toward biological plausibility and emphasize the pivotal position that GP neurons occupy within the neuronal circuits of the basal ganglia.
Footnotes
This work was supported by the Medical Research Council (MRC), United Kingdom. A.R.S. was supported by an MRC studentship. We thank Caroline Francis, Liz Norman, Paul Jays, and Ben Micklem for technical support and Kristin Jarvis and Brian Ripley (Department of Statistics, University of Oxford) for advice on the statistical analyses. We also thank Justin Boyes for comments on this manuscript.
References
- Albin RL, Young AB, Penney JB. The functional anatomy of basal ganglia disorders. Trends Neurosci. 1989;12:366–375. doi: 10.1016/0166-2236(89)90074-x. [DOI] [PubMed] [Google Scholar]
- Arkadir D, Morris G, Vaadia E, Bergman H. Independent coding of movement direction and reward prediction by single pallidal neurons. J Neurosci. 2004;24:10047–10056. doi: 10.1523/JNEUROSCI.2583-04.2004. [DOI] [PMC free article] [PubMed] [Google Scholar]
- Bar-Gad I, Heimer G, Ritov Y, Bergman H. Functional correlations between neighboring neurons in the primate globus pallidus are weak or nonexistent. J Neurosci. 2003;23:4012–4016. doi: 10.1523/JNEUROSCI.23-10-04012.2003. [DOI] [PMC free article] [PubMed] [Google Scholar]
- Bevan MD, Smith AD, Bolam JP. The substantia nigra as a site of synaptic integration of functionally diverse information arising from the ventral pallidum and the globus pallidus in the rat. Neuroscience. 1996;75:5–12. doi: 10.1016/0306-4522(96)00377-6. [DOI] [PubMed] [Google Scholar]
- Bevan MD, Clarke NP, Bolam JP. Synaptic integration of functionally diverse pallidal information in the entopeduncular nucleus and subthalamic nucleus in the rat. J Neurosci. 1997;17:308–324. doi: 10.1523/JNEUROSCI.17-01-00308.1997. [DOI] [PMC free article] [PubMed] [Google Scholar]
- Bevan MD, Booth PAC, Eaton SA, Bolam JP. Selective innervation of neostriatal interneurons by a subclass of neuron in the globus pallidus of the rat. J Neurosci. 1998;18:9438–9452. doi: 10.1523/JNEUROSCI.18-22-09438.1998. [DOI] [PMC free article] [PubMed] [Google Scholar]
- Bolam JP, Booth PA, Hanley JJ, Bevan MD. Synaptic organisation of the basal ganglia. J Anatomy. 2000;196:527–542. doi: 10.1046/j.1469-7580.2000.19640527.x. [DOI] [PMC free article] [PubMed] [Google Scholar]
- Boyes J, Bolam JP, Shigemoto R, Stanford IM. Presynaptic HCN channels in the globus pallidus. Eur J Neurosci. 2007;25:2081–2092. doi: 10.1111/j.1460-9568.2007.05463.x. [DOI] [PubMed] [Google Scholar]
- Brotchie P, Iansek R, Horne MK. Motor function of the monkey globus pallidus. 1. Neuronal discharge and parameters of movement. Brain. 1991a;114:1667–1683. doi: 10.1093/brain/114.4.1667. [DOI] [PubMed] [Google Scholar]
- Brotchie P, Iansek R, Horne MK. Motor function of the monkey globus pallidus. 2. Cognitive aspects of movement and phasic neuronal activity. Brain. 1991b;114:1685–1702. doi: 10.1093/brain/114.4.1685. [DOI] [PubMed] [Google Scholar]
- Chang HT, Wilson CJ, Kitai ST. Single neostriatal efferent axons in the globus pallidus: a light and electron microscopic study. Science. 1981;213:915–918. doi: 10.1126/science.7256286. [DOI] [PubMed] [Google Scholar]
- DeLong MR. Activity of pallidal neurons during movement. J Neurophysiol. 1971;34:414–427. doi: 10.1152/jn.1971.34.3.414. [DOI] [PubMed] [Google Scholar]
- DeLong MR. Activity of basal ganglia neurons during movement. Brain Res. 1972;40:127–135. doi: 10.1016/0006-8993(72)90118-7. [DOI] [PubMed] [Google Scholar]
- DeLong MR. Primate models of movement disorders of basal ganglia origin. Trends Neurosci. 1990;13:281–285. doi: 10.1016/0166-2236(90)90110-v. [DOI] [PubMed] [Google Scholar]
- Falls WM, Park MR, Kitai ST. An intracellular HRP study of the rat globus pallidus. II. Fine structural characteristics and synaptic connections of medially located large GP neurons. J Comp Neurol. 1983;221:229–245. doi: 10.1002/cne.902210210. [DOI] [PubMed] [Google Scholar]
- Filion M, Tremblay L. Abnormal spontaneous activity of globus pallidus neurons in monkeys with MPTP-induced parkinsonism. Brain Res. 1991;547:142–151. [PubMed] [Google Scholar]
- Francois C, Percheron G, Yelnik J, Heyner S. A Golgi analysis of the primate globus pallidus. I. Inconstant processes of large neurons, other neuronal types, and afferent axons. J Comp Neurol. 1984;227:182–199. doi: 10.1002/cne.902270205. [DOI] [PubMed] [Google Scholar]
- Freund TF, Buzsaki G. Interneurons of the hippocampus. Hippocampus. 1996;6:347–470. doi: 10.1002/(SICI)1098-1063(1996)6:4<347::AID-HIPO1>3.0.CO;2-I. [DOI] [PubMed] [Google Scholar]
- Haber SN, Fudge JL, McFarland NR. Striatonigrostriatal pathways in primates form an ascending spiral from the shell to the dorsolateral striatum. J Neurosci. 2000;20:2369–2382. doi: 10.1523/JNEUROSCI.20-06-02369.2000. [DOI] [PMC free article] [PubMed] [Google Scholar]
- Haber SN, Deniau JM, Groenewegen HJ, O'Donnell P, McGinty JF, Baunez C. The ventral dorsal divide: to integrate or separate. In: Bolam JP, Ingham CA, Magill PJ, editors. The basal ganglia VIII. New York: Springer Science and Business Media; 2005. pp. 437–456. [Google Scholar]
- Horikawa K, Armstrong WE. A versatile means of intracellular labeling: injection of biocytin and its detection with avidin conjugates. J Neurosci Methods. 1988;25:1–11. doi: 10.1016/0165-0270(88)90114-8. [DOI] [PubMed] [Google Scholar]
- Iwahori N, Mizuno N. A Golgi study on the globus pallidus of the mouse. J Comp Neurol. 1981;197:29–43. doi: 10.1002/cne.901970104. [DOI] [PubMed] [Google Scholar]
- Johnson DH. Point process models of single-neuron discharges. J Comput Neurosci. 1996;3:275–299. doi: 10.1007/BF00161089. [DOI] [PubMed] [Google Scholar]
- Kawaguchi Y, Wilson CJ, Emson PC. Projection subtypes of rat neostriatal matrix cells revealed by intracellular injection of biocytin. J Neurosci. 1990;10:3421–3438. doi: 10.1523/JNEUROSCI.10-10-03421.1990. [DOI] [PMC free article] [PubMed] [Google Scholar]
- Kita H. Parvalbumin-immunopositive neurons in rat globus pallidus: a light and electron microscopic study. Brain Res. 1994;657:31–41. doi: 10.1016/0006-8993(94)90950-4. [DOI] [PubMed] [Google Scholar]
- Kita H, Kitai ST. The morphology of globus pallidus projection neurons in the rat: an intracellular staining study. Brain Res. 1994;636:308–319. doi: 10.1016/0006-8993(94)91030-8. [DOI] [PubMed] [Google Scholar]
- Kita H, Tachibana Y, Nambu A, Chiken S. Balance of monosynaptic excitatory and disynaptic inhibitory responses of the globus pallidus induced after stimulation of the subthalamic nucleus in the monkey. J Neurosci. 2005;25:8611–8619. doi: 10.1523/JNEUROSCI.1719-05.2005. [DOI] [PMC free article] [PubMed] [Google Scholar]
- Klausberger T, Magill PJ, Marton LF, Roberts JD, Cobden PM, Buzsaki G, Somogyi P. Brain-state- and cell-type-specific firing of hippocampal interneurons in vivo. Nature. 2003;421:844–848. doi: 10.1038/nature01374. [DOI] [PubMed] [Google Scholar]
- Klausberger T, Marton LF, Baude A, Roberts JD, Magill PJ, Somogyi P. Spike timing of dendrite-targeting bistratified cells during hippocampal network oscillations in vivo. Nat Neurosci. 2004;7:41–47. doi: 10.1038/nn1159. [DOI] [PubMed] [Google Scholar]
- Klausberger T, Marton LF, O'Neill J, Huck JH, Dalezios Y, Fuentealba P, Suen WY, Papp E, Kaneko T, Watanabe M, Csicsvari J, Somogyi P. Complementary roles of cholecystokinin- and parvalbumin-expressing GABAergic neurons in hippocampal network oscillations. J Neurosci. 2005;25:9782–9793. doi: 10.1523/JNEUROSCI.3269-05.2005. [DOI] [PMC free article] [PubMed] [Google Scholar]
- Koos T, Tepper JM. Inhibitory control of neostriatal projection neurons by GABAergic interneurons. Nat Neurosci. 1999;2:467–472. doi: 10.1038/8138. [DOI] [PubMed] [Google Scholar]
- Koos T, Tepper JM, Wilson CJ. Comparison of IPSCs evoked by spiny and fast-spiking neurons in the neostriatum. J Neurosci. 2004;24:7916–7922. doi: 10.1523/JNEUROSCI.2163-04.2004. [DOI] [PMC free article] [PubMed] [Google Scholar]
- Levesque M, Parent A. The striatofugal fiber system in primates: a reevaluation of its organization based on single-axon tracing studies. Proc Natl Acad Sci USA. 2005;102:11888–11893. doi: 10.1073/pnas.0502710102. [DOI] [PMC free article] [PubMed] [Google Scholar]
- Magill PJ, Bolam JP, Bevan MD. Relationship of activity in the subthalamic nucleus-globus pallidus network to cortical electroencephalogram. J Neurosci. 2000;20:820–833. doi: 10.1523/JNEUROSCI.20-02-00820.2000. [DOI] [PMC free article] [PubMed] [Google Scholar]
- Magill PJ, Bolam JP, Bevan MD. Dopamine regulates the impact of the cerebral cortex on the subthalamic nucleus-globus pallidus network. Neuroscience. 2001;106:313–330. doi: 10.1016/s0306-4522(01)00281-0. [DOI] [PubMed] [Google Scholar]
- Magill PJ, Pogosyan A, Sharott A, Csicsvari J, Bolam JP, Brown P. Changes in functional connectivity within the rat striatopallidal axis during global brain activation in vivo. J Neurosci. 2006;26:6318–6329. doi: 10.1523/JNEUROSCI.0620-06.2006. [DOI] [PMC free article] [PubMed] [Google Scholar]
- Mallet N, Le Moine C, Charpier S, Gonon F. Feedforward inhibition of projection neurons by fast-spiking GABA interneurons in the rat striatum in vivo. J Neurosci. 2005;25:3857–3869. doi: 10.1523/JNEUROSCI.5027-04.2005. [DOI] [PMC free article] [PubMed] [Google Scholar]
- Mallet N, Ballion B, Le Moine C, Gonon F. Cortical inputs and GABA interneurons imbalance projection neurons in the striatum of parkinsonian rats. J Neurosci. 2006;26:3875–3884. doi: 10.1523/JNEUROSCI.4439-05.2006. [DOI] [PMC free article] [PubMed] [Google Scholar]
- Millhouse OE. Pallidal neurons in the rat. J Comp Neurol. 1986;254:209–227. doi: 10.1002/cne.902540206. [DOI] [PubMed] [Google Scholar]
- Mink JW, Thach WT. Basal ganglia motor control. I. Nonexclusive relation of pallidal discharge to five movement modes. J Neurophysiol. 1991a;65:273–300. doi: 10.1152/jn.1991.65.2.273. [DOI] [PubMed] [Google Scholar]
- Mink JW, Thach WT. Basal ganglia motor control. II. Late pallidal timing relative to movement onset and inconsistent pallidal coding of movement parameters. J Neurophysiol. 1991b;65:301–329. doi: 10.1152/jn.1991.65.2.301. [DOI] [PubMed] [Google Scholar]
- Nini A, Feingold A, Slovin H, Bergman H. Neurons in the globus pallidus do not show correlated activity in the normal monkey, but phase-locked oscillations appear in the MPTP model of parkinsonism. J Neurophysiol. 1995;74:1800–1805. doi: 10.1152/jn.1995.74.4.1800. [DOI] [PubMed] [Google Scholar]
- Oorschot DE. Total number of neurons in the neostriatal, pallidal, subthalamic, and substantia nigral nuclei of the rat basal ganglia: a stereological study using the cavalieri and optical disector methods. J Comp Neurol. 1996;366:580–599. doi: 10.1002/(SICI)1096-9861(19960318)366:4<580::AID-CNE3>3.0.CO;2-0. [DOI] [PubMed] [Google Scholar]
- Park MR, Falls WM, Kitai ST. An intracellular HRP study of the rat globus pallidus. I. Responses and light microscopic analysis. J Comp Neurol. 1982;211:284–294. doi: 10.1002/cne.902110307. [DOI] [PubMed] [Google Scholar]
- Paxinos G, Watson C. The rat brain in stereotaxic coordinates. Ed 2. Sydney: Academic; 1986. [DOI] [PubMed] [Google Scholar]
- Pinault D. A novel single-cell staining procedure performed in vivo under electrophysiological control: morpho-functional features of juxtacellularly labeled thalamic cells and other central neurons with biocytin or neurobiotin. J Neurosci Methods. 1996;65:113–136. doi: 10.1016/0165-0270(95)00144-1. [DOI] [PubMed] [Google Scholar]
- Ramanathan S, Hanley JJ, Deniau J-M, Bolam JP. Synaptic convergence of motor and somatosensory cortical afferents onto GABAergic interneurons in the rat striatum. J Neurosci. 2002;22:8158–8169. doi: 10.1523/JNEUROSCI.22-18-08158.2002. [DOI] [PMC free article] [PubMed] [Google Scholar]
- Raz A, Vaadia E, Bergman H. Firing patterns and correlations of spontaneous discharge of pallidal neurons in the normal and the tremulous 1-methyl-4-phenyl-1,2,3,6-tetrahydropyridine vervet model of parkinsonism. J Neurosci. 2000;20:8559–8571. doi: 10.1523/JNEUROSCI.20-22-08559.2000. [DOI] [PMC free article] [PubMed] [Google Scholar]
- Raz A, Frechter-Mazar V, Feingold A, Abeles M, Vaadia E, Bergman H. Activity of pallidal and striatal tonically active neurons is correlated in MPTP-treated monkeys but not in normal monkeys. J Neurosci. 2001;21(RC128):1–5. doi: 10.1523/JNEUROSCI.21-03-j0006.2001. [DOI] [PMC free article] [PubMed] [Google Scholar]
- Reynolds ES. The use of lead citrate at high pH as an electron-opaque stain in electron microscopy. J Cell Biol. 1963;17:208–212. doi: 10.1083/jcb.17.1.208. [DOI] [PMC free article] [PubMed] [Google Scholar]
- Sadek AR, Magill PJ, Bolam JP. Local connectivity between neurons of the globus pallidus. In: Bolam JP, Ingham CA, Magill PJ, editors. The basal ganglia VIII. New York: Springer Science and Business Media; 2005. pp. 611–619. [Google Scholar]
- Sato F, Lavallée P, Lévesque M, Parent A. Single-axon tracing study of neurons of the external segment of the globus pallidus in primate. J Comp Neurol. 2000;417:17–31. [PubMed] [Google Scholar]
- Smith Y, Bolam JP. The output neurones and the dopaminergic neurones of the substantia nigra receive a GABA-containing input from the globus pallidus in the rat. J Comp Neurol. 1990;296:47–64. doi: 10.1002/cne.902960105. [DOI] [PubMed] [Google Scholar]
- Smith Y, Bevan MD, Shink E, Bolam JP. Microcircuitry of the direct and indirect pathways of the basal ganglia. Neuroscience. 1998;86:353–387. doi: 10.1016/s0306-4522(98)00004-9. [DOI] [PubMed] [Google Scholar]
- Somogyi P, Klausberger T. Defined types of cortical interneurone structure space and spike timing in the hippocampus. J Physiol (Lond) 2005;562:9–26. doi: 10.1113/jphysiol.2004.078915. [DOI] [PMC free article] [PubMed] [Google Scholar]
- Stanford IM. Independent neuronal oscillators of the rat globus pallidus. J Neurophysiol. 2003;89:1713–1717. doi: 10.1152/jn.00864.2002. [DOI] [PubMed] [Google Scholar]
- Tepper JM, Bolam JP. Functional diversity and specificity of neostriatal interneurons. Curr Opin Neurobiol. 2004;14:685–692. doi: 10.1016/j.conb.2004.10.003. [DOI] [PubMed] [Google Scholar]
- Tepper JM, Koos T, Wilson CJ. GABAergic microcircuits in the neostriatum. Trends Neurosci. 2004;27:662–669. doi: 10.1016/j.tins.2004.08.007. [DOI] [PubMed] [Google Scholar]
- Thiel H. Statistical modelling. New York: Wiley; 1971. [Google Scholar]
- Turner RS, Anderson ME. Pallidal discharge related to the kinematics of reaching movements in two dimensions. J Neurophysiol. 1997;77:1051–1074. doi: 10.1152/jn.1997.77.3.1051. [DOI] [PubMed] [Google Scholar]
- Turner RS, Anderson ME. Context-dependent modulation of movement-related discharge in the primate globus pallidus. J Neurosci. 2005;25:2965–2976. doi: 10.1523/JNEUROSCI.4036-04.2005. [DOI] [PMC free article] [PubMed] [Google Scholar]
- von Krosigk M, Smith AD. Descending projections from the substantia nigra and retrorubral field to the medullary and pontomedullary reticular formation. Eur J Neurosci. 1991;3:260–273. doi: 10.1111/j.1460-9568.1991.tb00088.x. [DOI] [PubMed] [Google Scholar]
- Wilson CJ, Phelan KD. Dual topographic representation of neostriatum in the globus pallidus of rats. Brain Res. 1982;243:354–359. doi: 10.1016/0006-8993(82)90260-8. [DOI] [PubMed] [Google Scholar]
- Yelnik J, Francois C, Percheron G, Tande D. A spatial and quantitative study of the striatopallidal connection in the monkey. NeuroReport. 1996;7:985–988. doi: 10.1097/00001756-199604100-00006. [DOI] [PubMed] [Google Scholar]
- Yelnik J, Francois C, Percheron G. Spatial relationships between striatal axonal endings and pallidal neurons in macaque monkeys. Adv Neurol. 1997;74:45–56. [PubMed] [Google Scholar]