

Abstract
Although expression of some genes is known to change during neuronal activity or plasticity, the overall relationship of gene expression changes to memory or memory disorders is not well understood. Here, we combined extensive statistical microarray analyses with behavioral testing to comprehensively identify genes and pathways associated with aging and cognitive dysfunction. Aged rats were separated into cognitively unimpaired (AU) or impaired (AI) groups based on their Morris water maze performance relative to young-adult (Y) animals. Hippocampal gene expression was assessed in Y, AU, and AI on the fifth (last) day of maze training (5T) or 21 d posttraining (21PT) and in nontrained animals (eight groups total, one array per animal; n = 78 arrays). ANOVA and linear contrasts identified genes that differed from Y generally with aging (differed in both AU and AI) or selectively, with cognitive status (differed only in AI or AU). Altered pathways/processes were identified by overrepresentation analyses of changed genes. With general aging, there was downregulation of axonal growth, cytoskeletal assembly/transport, signaling, and lipogenic/uptake pathways, concomitant with upregulation in immune/inflammatory, lysosomal, lipid/protein degradation, cholesterol transport, transforming growth factor, and cAMP signaling pathways, primarily independent of training condition. Selectively, in AI, there was downregulation at 5T of immediate-early gene, Wnt (wingless integration site), insulin, and G-protein signaling, lipogenesis, and glucose utilization pathways, whereas Notch2 (oligodendrocyte development) and myelination pathways were upregulated, particularly at 21PT. In AU, receptor/signal transduction genes were upregulated, perhaps as compensatory responses. Immunohistochemistry confirmed and extended selected microarray results. Together, the findings suggest a new model, in which deficient neuroenergetics leads to downregulated neuronal signaling and increased glial activation, resulting in aging-related cognitive dysfunction.
Keywords: microarray, immediate-early genes, insulin, glycogen, cholesterol, myelination, astrocyte, inflammation, Alzheimer's, aging brain
Introduction
Intense neuronal activity, synaptic plasticity, and learning/memory processes are associated with altered gene expression, in particular, with activation of some immediate-early genes (IEGs) such as Bdnf, Arc, Homer 1, Gap-43, and Egr1/Zif268/NGFI-A (early growth response 1/zinc finger protein/nerve growth factor inducible-A) (Gall et al., 1991; Biewenga et al., 1996; Guzowski et al., 2000; French et al., 2001; Steward and Worley, 2001; Vazdarjanova et al., 2002; Bozon et al., 2003; Scharfman, 2005; Lynch et al., 2007). Conversely, decreased IEG expression is seen in some models of memory disorders (Dickey et al., 2003; Palop et al., 2005; Rosi et al., 2005), including normal aging (Blalock et al., 2003; Small et al., 2004). In addition, alterations in many other genes and processes related to basic cellular functions, including endocrine pathways, lipid metabolism, inflammation/oxidative stress, and insulin signaling, have been associated with cognitive dysfunction (Porter and Landfield, 1998; Green and Simpkins, 2000; Gemma et al., 2002; McGaugh and Roozendaal, 2002; Petanceska et al., 2002; Wyss-Coray and Mucke, 2002; Blalock et al., 2003; Dickey et al., 2003; Puglielli et al., 2003; Lu et al., 2004; McGeer and McGeer, 2004; Verbitsky et al., 2004; Watson and Craft, 2004; Griffin, 2006).
The relationships of such alterations in gene expression to plasticity, and to synaptic posttranslational modification cascades (Lynch et al., 2007), are not well understood. Nevertheless, memory and memory disorders apparently involve highly complex, multilevel networks, the elucidation of which will likely benefit from a comprehensive understanding of associated gene expression profiles. Gene microarrays provide a powerful technology for addressing the complexity of memory systems, because they measure the simultaneous activity of thousands of genes and can also identify alterations in specific cellular pathways (Mirnics and Pevsner, 2004; Blalock et al., 2005). To date, microarray approaches have been used to study normal memory processes (Cavallaro et al., 2002; Keeley et al., 2006) as well as cognitive dysfunction in animal models of brain aging or Alzheimer's disease (AD) (Lee et al., 2000; Jiang et al., 2001; Blalock et al., 2003; Dickey et al., 2003; Burger et al., 2007) or in AD brain (Ginsberg et al., 2000; Loring et al., 2001; Pasinetti, 2001; Colangelo et al., 2002; Mufson et al., 2002; Yao et al., 2003; Blalock et al., 2004). However, although a number of potentially important genes and processes have been identified, the training conditions, subjects, statistical testing, and platforms have varied widely across studies, and a consistent overview has not yet emerged (for review, see Blalock et al., 2005).
Here, we combined well powered statistical microarray analyses and behavioral testing under multiple conditions to identify hippocampal expression profiles that reliably associate with aging-related cognitive impairment or with generalized aging. Aged learning-impaired rats were compared with aged unimpaired (and young) rats, a strategy that enhances power and reduces confounding effects of general aging (Markowska et al., 1989; Olton et al., 1991; Gallagher et al., 2003; Rowe et al., 2003). We chose the Morris water maze task to screen the aged animals because (1) it represents a (dorsal) hippocampal-dependent task (Moser and Moser, 1998) and (2) we and others have consistently found that there is considerable individual variability on this task, with some aged animals demonstrating the same proficiency as young animals and others exhibiting severe learning deficits (Yau et al., 2002; Gallagher et al., 2003; Rowe et al., 2003; Tombaugh et al., 2005). Together, the results provide an integrative overview of multiple novel and previously reported processes that selectively associate with aging-related cognitive impairment.
Materials and Methods
Subjects
Young adult (4–6 months of age) and aged (24–26 months of age) male Fischer 344 (F344) rats were obtained from Hilltop Lab Animals (Scottsdale, PA). The animals were left undisturbed for a minimum of 1 month in our facility until the beginning of behavioral testing. Rats were housed in pairs in polycarbonate cages (45 × 30 × 18 cm) with corncob bedding and maintained on a 12 h light/dark schedule (lights off at 7:00 P.M.). Food (LabDiet 5001 rodent diet; LabDiet, Brentwood, MO) and water were available ad libitum. Animal health was monitored by a veterinarian. All procedures were conducted in accordance with local Institutional Animal Care and Use Committee guidelines.
Morris water maze training
Young and aged rats were separated into home cage [nontrained (NT)] and behaviorally characterized groups. Aged animals in the behaviorally characterized groups were separated into two categories, aged cognitively impaired (AI) and aged cognitively unimpaired (AU) based on their relative performance in the Morris water maze task as described previously (Tombaugh et al., 2005). Briefly, the maze consisted of a 1.6-m-diameter circular pool filled to within 15 cm of the rim with water (22°C) made opaque by the addition of nontoxic white latex paint (Createx Colors, East Granby, CT). A circular Plexiglas escape platform (14.5 cm in diameter) was located in the center of one of the quadrants of the pool. The animals were given 15 trials over 5 consecutive days with the platform submerged 2 cm below the surface of the water (three trials per day; 120 s maximum trial duration; 20–30 min intertrial interval). On the last training trial, a probe test was performed in which the retractable Plexiglas platform was pneumatically lowered out of reach of the rats for 30 s and then returned to its original position for the remainder of the trial. All latency, distance, and dwell-time measures were recorded and analyzed using a computer-based tracking system (San Diego Instruments, San Diego, CA). On day 5 (∼40 min after probe trial), rats were given an additional four 60 s visible-platform trials in which the platform was raised 2.5 cm above the water level, to test for visual, motivational, or motor deficits that may have influenced performance. Rats that required >40 s to reach the visible platform on any trial were excluded from additional analysis. In the larger cohort from which our animals were obtained, only ∼2% (5 of 224) of aged animals were excluded by this criterion.
In addition, because stress, hypothermia, thigmotaxis, and swimming time vary among aged animals (Issa et al., 1990; Mabry et al., 1995; Bizon et al., 2001; Stoelzel et al., 2002) and might potentially influence gene expression and/or water maze performance, we mitigated aspects of these factors by several methods. Novel environment stress was compensated for by extended (1 month) acclimation to the animal facility and 45–60 min acclimation to the behavioral facility on each day. Hypothermia was controlled for by providing warming lamps for cages during and after sessions. Finally, experiments were performed in the morning, taking advantage of previous findings that basal stress hormone levels do not differ across young, aged impaired, and unimpaired animals during this diurnal nadir (Issa et al., 1990; Rowe et al., 1998). We also carefully monitored swimming speed and pattern.
The cognitive status of an aged animal was defined on the basis of its latencies to find the submerged platform on days 3–5 of testing relative to the mean latency of young controls. Because change in latency was usually maximal by the third day of training and latencies remained stable across days 3–5 (Fig. 1), we used averaged day 3–5 latency as an index of retention. An AI rat (n = 19) was defined as one whose mean latency across days 3–5 differed by >3.0 SDs from that of young controls (Y). An aged animal was considered AU (n = 20) if its mean latency score was ≤0.5 SD from the mean of the young controls. Aged animals whose mean escape latencies fell between these values (partially impaired) were not used in any additional analyses. It should be noted that, consistent with the view that latency across days 3–5 of training is a reliable test of retention, four measures of retention during the probe trial agreed closely with the latency data and also strongly distinguished the selected AU and AI animals (see Results). Cohorts of animals were run until group n values were complete. AU and AI animals represented ∼20 and 40%, respectively, of the aged population. Other groups of nontrained aged (NT-A) and young (NT-Y) animals were analyzed in parallel to identify genes that differed with aging under resting behavioral conditions (Fig. 1). For more information on the classification and population data, see Tombaugh et al. (2002). Behaviorally characterized rats were killed by isoflurane anesthesia 1 h after visible platform testing [fifth day of training (5T)] or after a 21 d interval [21 d posttraining (21PT)], together with NT animals maintained in home cages. Overall, this study comprised eight treatment groups, each with n = 10 per group, except for the 21PT-Y and 21PT-AI groups, which had n = 9 each.
Figure 1.
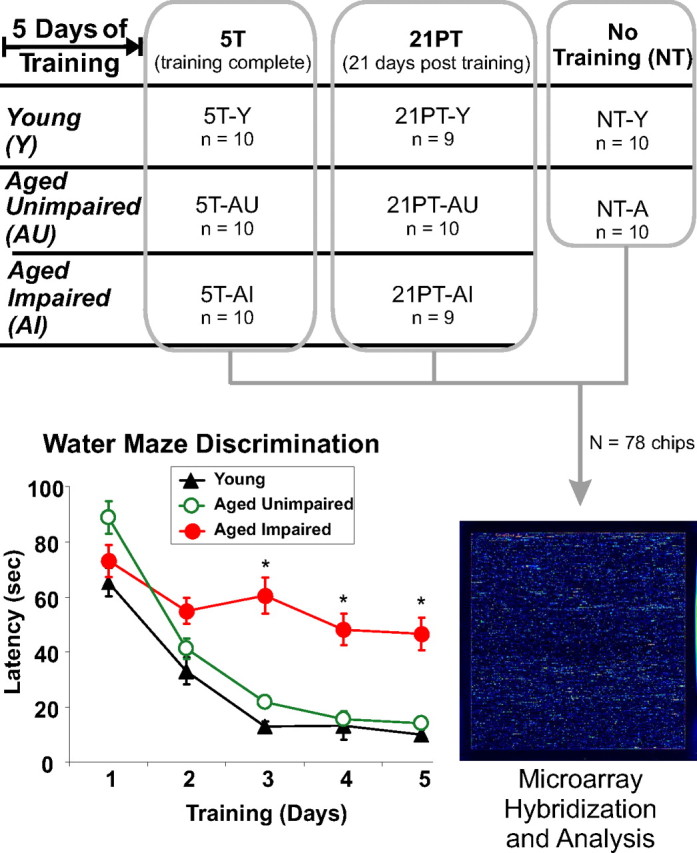
Overview of experimental design. Young and aged rats were randomly assigned to 5T (killed on the last day of training), 21PT (killed 21 d after end of training), or NT groups. Between days 0 and 5, 5T and 21PT animals were trained on the Morris water maze. Bottom left inset, Performance on the water maze, relative to Y animals, was used to discriminate between AU and AI animals (see Materials and Methods). Mean latency to platform is plotted versus training day (*p < 0.001). Overall, there were eight training groups (NT-Y, NT-A, 5T-Y, 5T-AU, 5T-AI, 21PT-Y, 21PT-AU, and 21PT-AI; n = 9–10 animals per group). Microarray analysis on dorsal hippocampus was performed for all 78 animals (1 chip per animal).
Microarrays
Sample RNA extraction, array hybridization, and quality control.
Immediately after the animals were killed, the dorsal half of the left hippocampus (including dentate gyrus) was dissected free and frozen. Subsequently, mRNA was extracted, generating ∼11 μg of total RNA per hippocampal sample, labeled, and hybridized to RAE-230A (Affymetrix, Santa Clara, CA) GeneChips according to standard protocols. A total of 78 GeneChips were used in the present study (one chip per animal). All arrays used performed within accepted parameters [data uploaded to the Gene Expression Omnibus (www.ncbi.nlm.nih.gov/geo/) with accession number GSE5666], and no quality control variables differed significantly across treatment (one-way ANOVA) (Table 1).
Table 1.
Quality control measures
| Mean ± SEM | p value | |
|---|---|---|
| Noise | 6.34 ± 0.13 | 0.7 |
| RawQ | 3.52 ± 0.06 | 0.792 |
| SF | 1.03 ± 0.02 | 0.522 |
| GAPDH (3′/5′) | 1.23 ± 0.01 | 0.126 |
| 260:280 | 1.69 ± 0.02 | 0.554 |
| RNA (μg/μl) | 0.51 ± 0.01 | 0.143 |
| 28S:18S | 1.34 ± 0.01 | 0.38 |
| cRNA (μg) | 81.81 ± 1.38 | 0.374 |
Columns: measure, quality control/chip performance; average ± SEM for all 78 chips (because none were significant, results are not broken out according to treatment group); p value for one-way ANOVA across eight groups (n = 9–10 per group). Rows: Noise and RawQ, Affymetrix MAS5-derived measures of overall chip noise and noise among background pixels, respectively; SF, scaling factor, multiplier used to artificially set each chip to a target intensity of 500; GAPDH (3′/5′), on-chip measure of the ratio of signal intensities for the 3′ and 5′ ends of the ″housekeeping″ gene glyceraldehyde-3-phosphate dehydrogenase; 260:280, ratio of the spectrophotometric absorbance at 260 (nucleic acid) and 280 (protein) nm wavelengths; μg/μl RNA, RNA concentration (in ∼22 μl volume) extracted per hippocampus; 28S:18S, Agilent Technologies (Palo Alo, CA) Bioanalyzer 2100 measured ratios of ribosomal RNA (values close to 1 indicate little to no degradation of RNA); cRNA, total μg labeled RNA generated from 8 μg of tissue RNA.
Microarray data filtering.
Procedures used were similar to those used previously (Blalock et al., 2003, 2004). Briefly, the Microarray Analysis Suite 5 (MAS5) algorithm was applied using Affymetrix Gene Chip Operating System software (GCOS version 1.1). All-probe-set scaling normalization (target intensity 500) was applied, and presence call and signal intensity values were copied to Excel (Microsoft, Seattle, WA) for additional analysis. Annotations were downloaded from the Affymetrix website (July, 2005; augmented by a rat genome database search). For gene symbols represented by more than one probe set (repeats), the probe set with the smallest test statistic was used. Within-group outliers (>2 SD from the group mean) (Blalock et al., 2004) were treated as missing values.
Immunohistochemistry
Young (3–4 months) and aged (23–24 months) male F344 rats, subjected to similar but not precisely the same training protocols as those in the microarray studies, were used for immunohistochemical (IHC) analyses. Rats were anesthetized with sodium pentobarbital (80 mg/kg) and transcardially perfused with cold buffered 0.9% NaCl. The brains were removed, and one hemisphere was immersed in 4% paraformaldehyde in 0.1 m phosphate buffer, pH 7.4, overnight, and then transferred to a 30% sucrose solution for cryoprotection. The half brains were cut into coronal sections (six 1-in-6 series of 30 μm) using a freezing, sliding microtome. The brain sections were immunohistochemically stained for Acyl-CoA-transferase [ACAT-1 (gene symbol, Soat1)] (rabbit anti-ACAT-1; Cayman Chemical, Ann Arbor, MI), Tau-13 (mouse anti-Tau-13; Covance, Berkeley, CA), and Cathepsin D (goat anti-Cathepsin D; Santa Cruz Biotechnology, Santa Cruz, CA) antibodies and S100a4 (rabbit anti-S100A4; Lab Vision, Fremont, CA). The sections for Tau-13 and Cathepsin D antibody staining were boiled in sodium citrate, pH 6, for 30 min. Thereafter, the sections were transferred to a solution containing the primary antibody (mouse anti-Tau-13, 1:1000, 2 weeks in 4°C; rabbit anti-ACAT-1, 1:500, overnight; goat anti-Cathepsin D, 1:500, overnight), consisting of Tris-buffered saline (TBS) with 0.5% Triton X-100 added (TBS-T). After the incubation in primary antibody, sections were rinsed three times in TBS-T and transferred to the solution containing appropriate secondary antibody [goat anti-mouse biotin (Sigma, St. Louis, MO); goat anti-rabbit biotin (Chemicon, Temecula, CA); rabbit anti-goat biotin (Abcam, Cambridge, MA)]. After 2 h, sections were rinsed three times in TBS-T and transferred to a solution containing mouse ExtrAvidin (Sigma). After rinsing, the sections were incubated for 3 min with nickel-enhanced DAB (Kadish and Van Groen, 2002). All stained sections were mounted on slides and coverslipped.
Statistics
Behavioral data.
All statistical analyses for behavioral data were performed using ANOVA, followed by pairwise comparisons (Tukey's post hoc test) when appropriate.
Statistical analysis and gene expression pattern assignment.
Microarray data were separated into three independent datasets corresponding to the three training conditions under which animals were studied (NT, 5T, and 21PT), and each set was filtered and statistically analyzed separately (see Fig. 2): NT, young versus aged groups were compared by t test; 5T and 21PT conditions, for each dataset, Y versus AU versus AI groups were tested by one-way ANOVA (Blalock et al., 2003, 2004). All genes found to differ significantly (at p ≤ 0.05) across groups (hereafter termed identified genes) in the 5T or 21PT groups were assigned to a cognitive status pattern (AI for impaired, AG for aging, and AU for unimpaired) (see Fig. 2). The AG pattern represented genes whose expression in aged animals differed significantly from the Y group regardless of cognitive status (i.e., both AU and AI differed more from Y than from each other, AG pattern). AI and AU patterns also differed with aging from the Y group but did so selectively, by cognitive status [i.e., the AI group differed from the Y and AU groups more than the latter differed from each other (AI pattern) or the AU group differed most from the other two groups (AU pattern)]. To assign a cognitive pattern to an identified gene, we determined which of the three groups significantly differed most from the other two using three planned post hoc linear contrasts (LCs):
 |
where Ya and Yb are the treatment means for the two groups being combined, Yc is the treatment mean being contrasted, ni is the geometric mean of the number of subjects within each of the three treatment groups, and MSE is the mean squared error within groups. Ties in the LC analysis were broken with the highest Pearson's correlation of group means with an idealized pattern template (see Fig. 2). Genes significant by ANOVA for which pattern ties could still not be broken (11 genes from 5T and 10 from 21PT analyses) were default labeled as AG pattern genes.
Figure 2.

Flowchart of array analyses and pattern assignment. The number of gene probe sets to be tested was filtered by excluding expressed sequence tags and genes rated absent (see Materials and Methods). Three separate statistical analyses were performed (one each across NT, 5T, and 21PT conditions), and genes whose expression varied (p ≤ 0.05) among the groups for any training condition were termed “identified genes.” Genes tested varied slightly for each test because of differences in absence calls. Using post hoc tests (see Materials and Methods), significant genes identified in the 5T and 21PT ANOVAs were assigned to one of three cognitive status patterns (bottom right): AG, both aged groups (AU, AI) differed from the young (Y) group; AI, the AI group differed from the Y and AU groups; AU, the AU group differed from the Y and AI groups. Identified genes in nontrained animals were categorized only by whether they were upregulated or downregulated with age. Top right, Venn diagram showing overlap of genes that were identified in at least one analysis (NT, 5T, 21PT), regardless of cognitive pattern assigned.
Immunohistochemistry.
Grayscale images of the appropriate areas (i.e., stratum pyramidale or stratum radiatum of hippocampus) were acquired with an Olympus Optical (Tokyo, Japan) DP70 digital camera. To facilitate comparable measurement, all images were acquired in one session, and sections were stained simultaneously (in the same staining tray). Two types of measurements were performed by an investigator blinded to animal age: (1) optical density of the region of interest, using ImagePro Plus (Media Cybernetics, Silver Spring, MD) and (2) counts of labeled cells in a field, using Scion (Frederick, MD) NIH Image. All density measurements were performed on a standardized area at three different septotemporal levels in the dorsal hippocampus, at similar lateromedial positions in area CA1.
Results
Maze learning performance
Figure 1 illustrates the basic experimental design of the study and shows the results on which the primary unimpaired/impaired distinction was based. The data confirm numerous previous studies showing that aged animals generally do not perform as well as younger animals in learning the water maze. Multiple other measures of retention performance are shown in Table 2, including latency and path length to find the submerged platform on the last 3 training days (Fig. 1) as well as several probe trial measures of spatial retention, including duration spent in the platform quadrant, mean distance to the target, dwell time, and latency to entry into the annulus-40 (a 20 cm radius circle extending from the center of the target; for additional details, see Tombaugh et al., 2002). Four of the five probe measures also clearly distinguished AU from AI animals, whereas the fifth, path length during the 30 s probe trial, did not differ in AI, indicating that the AI animals swam as far as AU and Y but in the wrong regions (Table 2).
Table 2.
Behavioral measures on the water maze for all six trained groups
| 5T-Y | 21PT-Y | 5T-AU | 21PT-AU | 5T-AI | 21PT-AI | p value | |
|---|---|---|---|---|---|---|---|
| Day 3–5 average | |||||||
| Latency (s) | 10.9 ± 1.7 | 10.5 ± 1.4 | 16.2 ± 0.8 | 16.8 ± 0.6 | 50.1 ± 2.5* | 54.9 ± 4.7* | 1.2E-22 |
| Path length (cm) | 270 ± 40 | 253 ± 32 | 372 ± 14 | 395 ± 19 | 1146 ± 59* | 1230 ± 90* | 6.8E-24 |
| Velocity (cm/s) | 26.0 ± 1.1 | 24.6 ± 1.3 | 23.1 ± 0.4 | 23.6 ± 1.0 | 22.9 ± 0.4 | 22.6 ± 0.4 | 0.0526 |
| Probe trial | |||||||
| Dwell in annulus (s) | 6.3 ± 0.7 | 5 ± 0.5 | 4.7 ± 0.6 | 3.8 ± 0.4 | 1.7 ± 0.3* | 1.3 ± 0.3* | 9.4E-10 |
| Mean distance to goal (cm) | 35.3 ± 1.8 | 41.6 ± 2.3 | 41 ± 2.8 | 43.7 ± 2.4 | 51.6 ± 1.5* | 50.6 ± 2.4* | 1.6E-05 |
| Path length (cm) | 734 ± 23 | 695 ± 28 | 656 ± 11 | 694 ± 28 | 670 ± 29 | 661 ± 15 | 0.1838 |
| Annulus entry latency (s) | 5.3 ± 1.3 | 5.6 ± 1.3 | 8.1 ± 1.0 | 5.6 ± 0.5 | 18.7 ± 3.5* | 17.6 ± 3.5* | 7.5E-06 |
| Time in goal quadrant (%) | 48.6 ± 3.2 | 42.7 ± 3.5 | 41.7 ± 4.5 | 39.8 ± 2.9 | 25.9 ± 3.2* | 28.7 ± 3.7 | 0.0001 |
The discrimination of AU and AI animals was based primarily on latency (top row) and confirmed by other measures. Day 3–5 average (averages of measures taken during days 3–5 of training): Latency, latencies to platform; Path length, distance of path to goal platform; and Velocity, path length/latency. Probe trial (measures taken during probe trial): Dwell in annulus, time spent in goal annulus; Mean distance to goal, average distance from goal annulus; path length, distance swum during probe trial; Annulus entry latency, time from maze entry to first goal annulus entry; Total time in quadrant, percentage of 30 s probe trial in goal quadrant. *p < 0.01 for pairwise AI versus AU and AI versus Y contrasts.
To control for declining sensorimotor or motivational processes that might contribute to impaired performance, visually cued platform trials were conducted (see Materials and Methods). The mean swim times for the Y, AU, and AI rats did not differ on the visually cued platform trials and were (mean ± SEM) 8.38 ± 0.99, 9.13 ± 0.62, and 10.4 ± 0.88 s, respectively (p > 0.24, one-way ANOVA). As noted, nearly all AI and AU (>97%) reached criterion on the cued task. These data suggest that the altered ability of the AI animals to locate the submerged platform was not attributable to visual, motor, or motivational deficits or to interference from fatigue or stress.
There is evidence that aged animals, particularly AI animals, exhibit prolonged stress responses, or greater susceptibility to fatigue or hypothermia, which conceivably could exert noncognitive effects that differentially influence an aged rat's ability to find the platform (Issa et al., 1990; Mabry et al., 1995; Porter and Landfield, 1998; Bizon et al., 2001; Stoelzel et al., 2002). As noted, however, the AI animals were not impaired in the visual cued task at the end of training (5T) and did not differ in probe trial path length. Moreover, a number of studies have shown that spatial water maze learning impairment in aged rats can be generalized to other spatial tasks and species (Gallagher and Rapp, 1997; Burke and Barnes, 2006) and is similar to the cognitive deficit after dorsal hippocampal lesions in young animals (Moser and Moser, 1998; Gould et al., 2002). Thus, the maze performance deficit in AI animals appears to reflect a primary cognitive impairment and is at least partly analogous to that seen after hippocampal lesions. Accordingly, if stress influenced performance in the present study, it apparently did so by impacting cognitive processes.
Identification of genes varying with aging/cognitive status under each training condition
Figure 2 illustrates the analysis flow chart and algorithm used to identify genes altered with aging and/or cognition. The expression of each gene was tested for differences by three separate statistical tests, one each across the groups in the NT (t test), 5T (ANOVA), and 21PT (ANOVA) training conditions. For genes identified as significantly different (p ≤ 0.05) across the three groups at the 5T or 21PT points, post hoc linear contrast analyses (see Materials and Methods) were used to assign one of three possible cognitive status patterns, AG, AI, or AU, to each significantly different gene (Fig. 2). Genes identified as different with age between the two NT groups were classified as simply upregulated or downregulated with aging.
Interpretation of cognitive status patterns
AG-pattern genes exhibited a nonselective aging pattern (both AI and AU differed from Y by linear contrast) and appear to reflect changes linked more closely to generalized aging processes than to cognitive status. Consistent with this, AG patterns occurred in many genes that also differed with age in the NT condition, in which the aged group presumably contained both AU and AI animals.
AI-pattern genes differed in the AI animals from both the Y and AU animals. These genes were both aging dependent (i.e., AI different from Y) and cognition selective (AI also different from AU). Thus, these genes changed primarily in those aged animals showing impaired cognition.
AU-pattern genes differed in the AU animals from both the Y and AI animals. These genes also were aging dependent (AU different from Y) and cognition selective (AU also different from AI). Consequently, AU-pattern genes changed the most in aged animals that showed the least behavioral change.
AI-pattern genes were emphasized in this study because they represented genes in which expression differences from Y could be correlated with performance differences from Y. Accordingly, AI-selective changes appear most likely to be causally related to, or at least vary directly with, cognitive status in aged animal brain. Nonetheless, it is clear that both AG-pattern and AU-pattern genes also likely play important roles in aging-related cognitive decline as either general aging alterations that set the stage for specific impairment-linked changes or compensatory changes that preserve cognitive function in the face of generalized aging alterations, respectively. Therefore, in addition to the full lists and category analyses of AI-pattern genes, similar lists/analyses are provided for all AG-pattern and AU-pattern genes (supplemental Tables A–C, available at www.jneurosci.org as supplemental material).
Numbers of genes identified for each condition and cognitive pattern
The t test of animals in the NT condition (NT-Y compared with NT-A) identified 653 genes that differed significantly in the hippocampal formation with aging (Fig. 2). Of these, more were upregulated than downregulated with aging. In the animals killed on the fifth day of training (5T), ∼1 h after the last trial (see Materials and Methods), 746 genes were found to differ significantly across the Y, AU, and AI groups. A large majority of these (417) exhibited the AG pattern, whereas smaller numbers of genes exhibited cognitively selective AI and AU patterns (Fig. 2). As was the case for NT-identified genes, many more AG- and AU-pattern genes were upregulated than downregulated among altered genes. Interestingly, the only exception in any training condition or pattern to this predominance of upregulated genes with aging was for the 5T-AI-pattern genes, more than twice as many of which were downregulated as were upregulated (Fig. 2).
In animals killed 21 d after the last (fifth) training session (21PT), 847 genes were found to differ across Y, AU, and AI animals, the large majority of which, 522, exhibited the AG pattern. For all patterns at the 21 d point, more genes were upregulated than downregulated with aging (Fig. 2).
Lists of identified genes
All genes identified under each training condition are listed in supplemental Table A (available at www.jneurosci.org as supplemental material), classified by cognitive pattern. As shown in Figure 2 (Venn diagram inset), many genes showed overlap across conditions, differing significantly among groups at more than one training condition. Some overlapping genes exhibited the same pattern at 5T and 21PT, whereas others showed different cognitive patterns in the different conditions. For ease of reference, supplemental Table B (available at www.jneurosci.org as supplemental material) lists in alphabetical order by gene symbol (along with the title/protein name of each gene) all identified genes and summarizes all conditions in which they were identified and the patterns they exhibited under those conditions.
Identification of functional processes and pathways
To facilitate inferences regarding which cellular pathways and functional processes were altered, we performed overrepresentation analyses on the identified genes. The Expression Analysis Systematic Explorer (EASE) program assigns genes to functional categories within the Gene Ontology (GO) hierarchical database (Ashburner et al., 2000; Hosack et al., 2003) and determines which categories in the Biological Process, Cellular Component, or Molecular Function ontologies of GO are statistically overrepresented by identified genes. Genes in overrepresented categories are coregulated to a greater degree than expected by chance, thereby implying that a pathway associated with that category may be altered. As a first step in our study, we conducted a separate EASE analysis on each subset of identified genes exhibiting the same aging/cognitive pattern and direction of change, for each training condition (supplemental Table A, available at www.jneurosci.org as supplemental material). An EASE p value ≤0.05 for a functional category was considered to reflect significant overrepresentation, and EASE score p values >0.05 and ≤0.15 were considered borderline significant. Supplemental Table C (available at www.jneurosci.org as supplemental material) provides the complete EASE/GO analysis with all overrepresented or borderline categories (p ≤ 0.15) and all genes populating each overrepresented category. [As can be seen in supplemental Table C (available at www.jneurosci.org as supplemental material), there is considerable cross-listing and redundancy of genes across identified categories.] Thus, pathways/categories were identified through overrepresentation analyses of genes with the same pattern and under the same training condition.
Extension of pathway analysis by literature review
Despite its considerable value, the GO system is still being developed, and its structure does not include some types of associations (e.g., cell type and pathway targets). Additionally, many annotated genes on the microarray chip have not yet been fully associated with categories in the appropriate GO hierarchies. Consequently, we extended and refined the pathway/process analyses with extensive literature review to detect clusters of genes with known pathway associations in either the identified GO categories (supplemental Table C, available at www.jneurosci.org as supplemental material) or the comprehensive identified-gene lists (supplemental Tables A, B, available at www.jneurosci.org as supplemental material) that were not found by the EASE analyses.
Table 3 shows both the EASE/GO defined-categories [in normal type; some redundant or apparently uninformative categories are omitted (supplemental Table C, available at www.jneurosci.org as supplemental material)] and the literature-identified pathways (shown in boldface), under the training condition and pattern in which most genes assigned to that pathway were identified. Note that, although the same pathway oftenappears under more than one condition, the genes populating the category vary somewhat across conditions.
Table 3.
Functional categories/pathways altered with general aging and/or cognitive impairment
| NT |
5T | 21PT |
|---|---|---|
| Downregulated | ||
| Receptor tyrosine phosphatase (P) | AG patterns | AG patterns |
| Signal transduction (P) | Neurogenesis (P) | Cell surface receptor (P) |
| Myosin/actin binding (C, F) | Signal transducer/receptor (F) | Coated vesicle/synapse (P,C) |
| Transcription factor activity (F) | Ca2+ signaling (P) | Microtubule cytoskeleton/actin binding (C, F) |
| Axonal growth | Steroid/nuclear receptor (C) | Calcium ion binding (F) |
| Lipid uptake/synthesis | Axonal growth | Axonal growth |
| Lipid uptake/synthesis | Lipid uptake/synthesis | |
| Glucose oxidation | ||
| AI patterns | AI patterns | |
| G-protein-coupled receptors (P) | G-protein-coupled receptor/response to stimulus (P) | |
| Organogenesis (P) | ||
| IEG pathway | ||
| Shh/Wnt signaling | ||
| Lipogenesis | ||
| Glucose utilization | ||
| Insulin signaling | ||
| Upregulated | ||
| Immune response (P) | AG patterns | AG patterns |
| Ion homeostasis/ transport (P) | Immune response (P) | Immune response (P) |
| Lipid/protein metabolism/transport (β-oxidation) (P) | Ion homeostasis/transport (P) | Cell adhesion (P) |
| Lysosome (C) | Lipid/ protein metabolism/binding (β-oxidation) (P, F) | Neg. reg. transcrip. (P) |
| Growth factor activity (F) | Lysosome (C) | Lipid/protein metabolism (P) |
| Cholesterol transport (LXR) | Cholesterol transport (LXR) | Lysosome (C) |
| cAMP/PKA pathway | Cholesterol transport (LXR) | |
| TGF/BMP pathways | cAMP/PKA pathway | |
| Glycolysis | ||
| TGF/BMP pathways | ||
| AI patterns | AI patterns | |
| Oxidoreductase activity (F) | Activation of cell proliferation (P) | |
| Notch2 pathway | Organogenesis (P) | |
| Notch2 pathway | ||
| Myelinogenesis | ||
| AU patterns | AU patterns | |
| Receptor activity (P) | Hydrolase activity (F) | |
Gene categories are listed under each training condition by cognitive pattern and direction of change of most of their populating genes. Many of the categories listed under general aging (AG/NT) patterns (e.g., Axonal growth, Immune response) primarily comprised genes that were identified with AG/NT patterns under more than one training condition, whereas AI pattern pathways were more often identified under specific training conditions (e.g., IEGs at 5T). Categories/pathways with high proportions of coregulated genes were identified with EASE-based overrepresentation analysis of the Gene Ontology Database (P, Biological Process; C, Cell Component; F, Molecular Function) and by literature-based searches (boldface).
Genes/pathways altered with aging and cognitive status
In Table 3 and supplemental Table C (available at www.jneurosci.org as supplemental material), limited examples of populating genes are given parenthetically; see alphabetical supplemental Table B (available at www.jneurosci.org as supplemental material) for gene/protein names of gene symbols.
Nontrained animals
Major functional categories and pathways found to be overrepresented by downregulated genes in hippocampus of aged NT animals included signal transduction (Adrbk1, Arf5, Chn1, Gucy1a3, Gucy1b3, Homer1, Htr5b, Plcb4, Plcg1, Rgs4, Rgs5, Sstr2), with a heavy concentration of genes for receptor tyrosine phosphatases (Ptpro, Ptpra, Ptprd, etc.). The latter play essential roles in axonal outgrowth/guidance (Stepanek et al., 2005) and, when combined with other axon guidance genes in the NT condition, suggested downregulation of a major pathway for axonal growth (Table 3). Other downregulated GO categories included transcription factor activity, primarily growth-related (e.g., Jun, Junb, Myc, E2f5, Nr4a2), actin/microtubule binding important for neurite outgrowth and axon transport (Arc, Cfl1, Dbn1, Myo5b, Pfn1, etc.), and lipogenesis/fatty acid utilization (Abcd2, Acsl4, Cyp51, Fads1, Hsd11b1, Pnlip, Sult4a1, Vldlr, etc.). In addition, a cluster of genes for epigenetic/transcriptional regulation (Hdac2, Hdac3, Hnrpa1, Nap1l3) was present in the list of NT-identified genes (for the complete list, supplemental Table A, available at www.jneurosci.org as supplemental material), although not identified by the EASE analysis (supplemental Table C, available at www.jneurosci.org as supplemental material).
Overrepresented upregulated categories for NT-A included ion (iron) homeostasis (Fth1, Fxyd1, Mt1a, Sgk, Tf), immune/inflammation response, lipid metabolism, particularly the free fatty acid β-oxidation pathway (Acadl, Decr2, Ech1), as well as a group of genes important in the catabolism of ketogenic amino acids (Fah, Kat2/Aadat2, Ivd, Qdpr). Upregulated categories also included lysosomal activation (Acp2, Cln2, Ctsb, Ctsd, Ctsh, Ctsl, Csts, Lamp2) and some growth factor activity, particularly of the transforming growth factor (TGF)/bone morphogenetic protein (BMP) pathways (e.g., Bmp6, Cntf, Igf2r, Tgfa, Tgfb2), likely related to upregulated markers of astroglial activation (Gfap, Vim). In addition to EASE-identified categories, relatively high concentrations of genes for Ca2+-binding S100 proteins (S100a4, S100a6, S100a10, S100β), annexins (Anxa3, Anxa4, Anxa5, Anxa7) and the cholesterol transport pathway (ApoE, Lcat, Srebf1) were present in the NT-A up-list.
Trained animals, 5T condition
AG patterns
The categories populated by downregulated genes with 5T-AG patterns included signal transduction (encompassing many of the same neurite growth-related genes found in the NT condition), receptor activity, neurogenesis, and nuclear receptor activity (including the IEGs, Nr4a2, Nr4a3, and the mineralocorticoid receptor gene Nr3c2). In addition, the literature-identified categories of axonal growth and lipid uptake/synthesis were, as in the NT condition, highly represented (Table 3). Upregulated 5T-AG processes again included immune/inflammation response, lipid metabolism and lipid binding, lysosomal activation, and ion homeostasis, as well as cholesterol transport (Table 3). Furthermore, multiple genes encoding pyruvate dehydrogenase kinases (Pdk1, Pdk2, Pdk4), which inhibit pyruvate dehydrogenase (PDH) and glucose oxidation, were upregulated at 5T.
AI patterns
Processes that were downregulated selectively in AI at 5T included cell surface and G-protein-coupled receptors (Adcyap1, Adora2b, Grm8, Htr5a, Htr7, Insr, Rgs4) and organogenesis (Table 3), the latter including a number of IEG/growth-related genes (Arc, Egr-1, Insr, Neud4, Smo, and Vgf). In addition to the EASE-identified GO categories, inspection of our 5T-AI-identified gene lists (supplemental Table A, available at www.jneurosci.org as supplemental material) revealed a number of other insulin signaling pathway genes (Insr, Irs1, Akt2, Ide, Stat5b) as well as additional IEG/growth genes (Egr4, Ier5), indicating that IEG and insulin signaling pathways were downregulated in AI animals. Additionally, a group of genes from the Shh (Sonic hedgehog)–Wnt (wingless integration site) pathways (Smo, Wnt5a, Catnb, Fzd2), critical in growth/development, exhibited 5T-AI (or 5T-AG) down patterns. Moreover, clusters of glycogenolytic/glucose oxidation genes (Pdhb, Phka1, Phkg, Gck), lipogenic genes involved in membrane synthesis (Dhcr7, Fads2, Rxrg, Ugcg), and cAMP signaling genes (Adcy5, Adcyap1, Prkar2b) were present in the 5T-AI down-list. A few important Ca2+ signaling genes (Cacna1c, encoding the L-type channel α subunit, and Camk2d) also were decreased selectively in AI. Upregulated 5T-AI processes included general oxidoreductase activity (Acads, Akr7a2, Aldh9a1, Ivd, Th). In addition, multiple genes related to Notch signaling, which is critical in developmental/differentiation processes, were altered in AI, under either or both of the 5T and 21PT conditions. These included Jag2, Adam17, and Notch2 (upregulated) and Notch1 and Neud4 (downregulated). The opposite regulation of Notch receptor subtypes may reflect opposing roles in differentiation (see Discussion).
AU patterns
No processes comprising downregulated genes with 5T-AU patterns were clearly overrepresented in the EASE analysis. However, one upregulated 5T-AU process was receptor activity (Gabarg3, Grik2, Htr3a, Nr4a1), consistent with several signaling-related genes in the list (Adcy6, Gbp2, Ptprh). These results may indicate that AU animals, when challenged, are able to upregulate some receptor/signaling pathways to compensate for the above-noted aging-related downregulation of signal transduction activity in hippocampus (i.e., in NT and AG patterns).
Trained animals, 21PT condition
AG patterns
Many of the categories populated by 21PT-AG-pattern genes were the same as or similar to those found in the 5T-AG and NT groups. Downregulated categories included cell surface receptors, microtubule/cytoskeleton/actin binding, and Ca2+ ion signaling/binding. Again, numerous genes involved in lipogenesis (Cyp51, Lss, Scd1, Fads1, Hsd11b1) and fatty acid uptake/utilization (Abcd2, Cpt1a, Lpl, Pnlip, Vldlr) were downregulated. Upregulated processes again included immune/complement activation, cell adhesion, lipid metabolism/transport, lysosomal activation, cholesterol transport, particularly related to the liver X receptor (LXR)–apolipoprotein E (ApoE) pathway (Nr1h2/Lxr, Nr1d2, ApoE, Lcat, Soat1, Npc2, Srebf1), and cAMP signaling. Furthermore, some glycolytic genes (Pygm, Hk2, Pfkm, Aldoc, Aldoa) exhibited upregulation at 21PT, perhaps reflecting rebound processes.
AI patterns
The GO categories downregulated in AI at 21PT again included G-protein-coupled receptors and other signaling processes. However, some genes not assigned in the EASE analysis included several important lipogenic (Dhcr7, Rxrg), growth-regulating (Cdk5, Igfbp2, Igfbp3, Nell1, Ptpra), and Ca2+ channel (Cacna2d3, Cacnb2) genes. Upregulated AI-pattern GO processes included pathways for organogenesis and cell proliferation, suggestive of activated growth processes. Several genes in these categories (supplemental Table C, available at www.jneurosci.org as supplemental material) were related to myelinogenesis (e.g., Mobp, Plp). In addition, inspection of the identified gene lists (supplemental Table A, available at www.jneurosci.org as supplemental material) revealed many other myelin/oligodendrocyte-related genes with 21PT-AI patterns, collectively pointing to activation of myelinogenic pathways. Furthermore, several Notch signaling genes were again upregulated.
AU patterns
Again, no downregulated GO processes were identified among 21PT-AU genes. However, some interesting genes were decreased selectively in AU (Akap8, Atp2a2, Camk2a, Camkb, Fgfr1, Mapt, Mog). Hydrolase activity was found as an upregulated category, primarily reflecting inclusion of several phosphatases and other signaling molecules. Additionally, other signaling/growth molecules were increased (Adra2c, Adrbk1, Calm1, Camk2d, Gpr26, Gpr83, Grm2, Itpkb, Mtap2, Mtap6, Nrg1, Pik3c2g).
Training dependence of identified pathways (Fig. 3)
Figure 3.
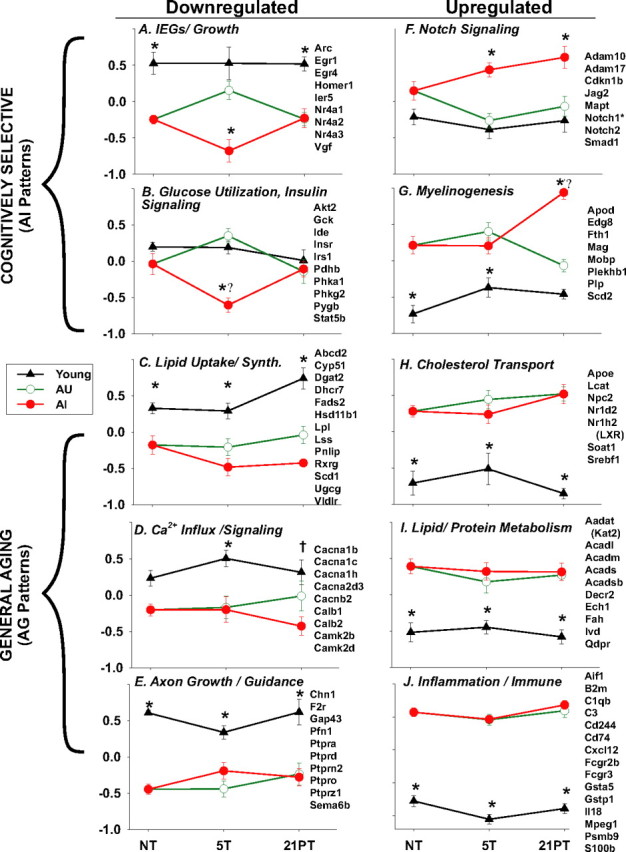
Training dependence of several key identified pathways from Table 3. Shown are the means ± SEM of the standardized expression values for identified genes populating each pathway, along with a list of those genes. Top panels, Pathways populated primarily by genes with cognitively selective (AI) expression patterns. Bottom panels, Pathways reflecting genes with general aging (AG) expression patterns. Left, Downregulated pathways. Right, Upregulated pathways. Note that pathways downregulated in 5T-AI animals generally recovered within 21 d (A, B), whereas AI-selective differences in upregulated pathways were sustained at 21PT (F, G). (*p ≤ 0.05 difference between that group and the other two groups at that training condition; Ψp ≤ 0.05 difference between that point and the NT point for that pathway; †p ≤ 0.05 difference between Y and AI only at 21PT).
To compare genes/pathways across training conditions, expression values were standardized. The standardized expression values for genes within identified pathways (Blalock et al., 2003) were averaged and plotted. Figure 3 shows these plots for selected pathways and lists the genes assigned to each pathway from which the means were calculated. Genes assigned within a pathway comprised the genes populating that pathway under the training condition(s) in which it was primarily identified (Table 3), supplemented by clearly related genes identified under other conditions. Some pathways with apparently related functions and similar training dependence were combined in these calculations and plots (e.g., Fig. 3, B, glucose utilization with insulin signaling, I, lipid oxidation with amino acid degradation).
The effects of training condition and group on each pathway plotted in Figure 3 were then tested by one-way ANOVA and post hoc (Tukey's) comparisons (note that both the AU and AI groups used the same NT-A group as baseline). Numerous comparisons were significant at p ≤ 0.05 (Fig. 3).
Results showed a clear distinction in training dependence between AI- and AG-pattern pathways. Nearly all processes downregulated selectively in AI (Fig. 3A,B, IEGs, glucose utilization, insulin signaling) were decreased after intense training (5T point) and recovered to the AU level by 21PT. However, expression in the Y and AU groups remained relatively steady or rose modestly at 5T.
In contrast, pathways/processes upregulated selectively in AI (Notch signaling, myelinogenesis) were sustained at 21PT (Fig. 3F,G). In fact, for myelinogenesis, the AU and AI groups differed only at 21PT. Thus, downregulated and upregulated AI-selective pathways were both training sensitive but showed different posttraining patterns.
AG-pattern processes, which did not consistently distinguish AU from AI, exhibited changes that were essentially training independent. Pathways and genes exhibiting generalized aging changes frequently differed in aged animals from the Y group whether assessed under NT, 5T, or 21PT conditions (Table 3, Fig. 3C–E,H–J).
Immunohistochemical confirmation and extension
IHC methods were used to confirm the inferred cell-specific localization of expression and the quantitative microarray findings and to determine whether protein expression generally follows gene expression. We selected four genes with commercially available characterized antibodies, for testing by IHC methods. Immunolabeled hippocampal sections from young (3–4 months; n = 9) and aged (23–24 months; n = 10) animals (see Materials and Methods) were analyzed by optical density measurement. To enhance IHC detection, we selected four proteins for which the encoding genes increased with aging as noted, and these proteins (with associated gene symbols) were Acyl-CoA-transferase (also termed Sterol-O-transferase) (Soat1) (seen here in astrocytes and some neurons), microtubule-associated protein Tau-13 (Mapt) (in neurons), S100A4 (S100a4) (in glial cells), and Cathepsin D (Ctsd) (in glia and neurons). For each protein examined, expression was found to change significantly with age (unpaired, two-tailed Student's t test) in the same direction (up) as for the encoding gene: SOAT1/ACAT-1, p = 1.45 × 10⁻⁶; MAPT, p = 0.03; S100A4, p = 1.27 × 10⁻¹⁰; CTSD, p = 1.0 × 10⁻⁵. (Representative examples of SOAT1/ACAT1 and MAPT density and distribution in young and aged rat sections are shown in Figure 4.)
Figure 4.

Immunohistochemical labeling of example proteins in coronal sections from dorsal hippocampus of young and aged rats. A and B show SOAT1 (alias ACAT-1)-stained sections. C and D show MAPT (alias Tau-13)-stained sections. SO, Stratum oriens; SP, stratum pyramidale; SR, stratum radiatum. Scale bar in A applies to all photomicrographs. Note that SOAT1, which functions in cholesterol storage, is localized primarily in astrocytes, whereas MAPT, a target of hyperphosphorylation in AD, is localized primarily in pyramidal neuron somata (SP) and dendrites (SR).
Statistical reliability
The three statistical analyses of microarray results for the three different training conditions (NT, 5T, 21PT) showed false discovery rates (FDRs) of 0.23–0.29 (Fig. 2). The FDR, which is the ratio of the false positives expected from multiple comparisons to total positives observed, is also the approximate probability that any one gene identified is a false positive (Benjamini et al., 2001; Miller et al., 2001; Mirnics and Pevsner, 2004; Blalock et al., 2005). However, confidence in microarray data are often much higher than implied by the FDR, because it is bolstered by pathway/category analysis (Fig. 3) (supplemental Table C, available at www.jneurosci.org as supplemental material), which can show that genes functionally related to one another or linked by pathway are disproportionately coregulated (overrepresented among identified genes) (Mirnics and Pevsner, 2004; Blalock et al., 2005). Importantly, statistical identification of a gene in a second independent analysis indicates much greater reliability (Blalock et al., 2005), because the probability that a gene will be identified by chance in two independent studies is the product of the two p values used (e.g., 0.05 × 0.05 = 0.0025). Therefore, the many overlapping genes (Fig. 2, Venn diagram) identified in more than one of the three analyses here (supplemental Table B, available at www.jneurosci.org as supplemental material) and the pathways they represent are likely to be particularly reliable. Moreover, many of the same pathways were identified in more than one analysis (Table 3), and many also were identified in a previous study (Blalock et al., 2003). Finally, the expression of four proteins encoded by genes identified here all agreed statistically and visually (Fig. 4) with the microarray data for the related genes. Consequently, the results reported here appear to be highly reliable.
Discussion
The present work provides a comprehensive overview of the mosaic of hippocampal gene expression changes associated selectively either with aging-dependent cognitive impairment or nonselectively with general aging. Moreover, because this study was relatively well powered, thereby reducing false negatives and increasing detection of true positives (Fig. 2), the identification of altered pathways/processes was also facilitated considerably (Mirnics and Pevsner, 2004; Blalock et al., 2005).
A number of the processes identified here (Table 3) have been implicated previously in normal or pathological brain aging (Bi et al., 2000; Lee et al., 2000; Nixon et al., 2000; Jiang et al., 2001; Gemma et al., 2002; Wyss-Coray and Mucke, 2002; Blalock et al., 2003; Dickey et al., 2003; Peters and Sethares, 2003; McGeer and McGeer, 2004; Verbitsky et al., 2004; Finch, 2005; Griffin, 2006). In addition to previously described processes, however, the current study identified novel pathways in brain and cognitive aging, some of which appear to have important implications for pathogenic mechanisms, as discussed below.
Processes associated with general aging
Many more expression changes were associated with general aging than with selective cognitive status (Fig. 2, Table 3), indicative of a broad impact of aging on hippocampal function. These general aging changes revealed widespread downregulation of pathways for neurite/axon growth (Fig. 3E), cytoskeletal/extracellular assembly, lipid synthesis/uptake (Fig. 3C), and transcriptional and signal transduction, including Ca2+ signaling (Fig. 3D) processes. The latter grouping (which includes Cacna1c) appears to suggest that the increased L-type Ca2+ channel activity seen with aging in hippocampal pyramidal neurons (Thibault et al., 1998, 2007) results from posttranslational modification or membrane alterations rather than increased expression. Concomitantly, there was widespread upregulation of pathways related to other basic cellular and signaling processes (Table 3), including inflammation/oxidative stress (Fig. 3J), lysosomal activity, ion transport, lipid/protein metabolism (Fig. 3I), cholesterol transport (Fig. 3H), TGF signaling, and cAMP/protein kinase A (PKA)-related signaling [although a smaller cluster of PKA-related genes was downregulated in AI at 5T, suggesting differential regulation in separate compartments (Huang et al., 2006)].
Specifically, multiple lipid metabolic genes in the fatty acid β-oxidation pathway were upregulated with general aging. In parallel, genes encoding key enzymes for the metabolism of ketogenic amino acids (Aadat/Kat2, Fah, Ivd, Qdpr) also were upregulated (Fig. 3I). These degradative pathways yield precursors for ketone bodies, apparently contradicting the traditional view that the brain can use but not produce ketone bodies for energy. In fact, our results show that the hippocampus expresses the genes essential for ketogenesis (Acaa2, Hmgcs, Hmgcl; data uploaded to Gene Expression Omnibus under accession number GSE5666), one of which (Acaa2) was increased in NT-A (supplemental Table B, available at www.jneurosci.org as supplemental material). Conversely, pyruvate flux through PDH, the rate limiting enzyme for glucose oxidation, was apparently decreased. That is, a major PDH subunit gene, Pdhb, was downregulated at NT and 21PT-AG and in AI at 5T (see below), and several PDKs (Pdk1, Pdk2, Pdk4), which inactivate PDH, were upregulated with AG patterns, primarily at 5T.
Together, these alterations suggest an aging-related increased reliance on hippocampal lipid and protein degradation, and conservation of glucose, in generating substrates for oxidative energy production. Such changes may imply a reduction in overall energy generation, consistent with the extensive downregulation of genes involved in mitochondrial electron transport (Blalock et al., 2003).
Additionally, there was increased expression of genes in the LXR pathway (Fig. 3H), which plays a major role in controlling cholesterol transport/efflux and storage (Dietschy and Turley, 2001; Ory, 2004) and is primarily centered in astrocytes (Petanceska et al., 2003; Abildayeva et al., 2006) (Fig. 4A). The relationship, if any, of cholesterol transport activation to the major alterations in metabolism/growth, discussed above, is not clear. However, considering the expanding evidence of a link between cholesterol and AD (Petanceska et al., 2002; Puglielli et al., 2003), aging-related changes in the LXR pathway might well be associated with the increased risk of AD with normal brain aging.
IEG/growth-related pathways in AI
Against this backdrop of broad aging changes, AI animals selectively showed downregulation in IEG/growth-related and insulin receptor-signaling pathways at 5 d of training (Table 3, Fig. 3). Several of the IEGs identified here can interact with one another (Alder et al., 2003; Li et al., 2005), with neurite outgrowth (Levkovitz and Baraban, 2002) or with IGF or cAMP signaling (Bozon et al., 2003; Keeton et al., 2003; Sartipy and Loskutoff, 2003). As noted, however, their possible roles in memory/plasticity are not fully understood. Interestingly, another recent microarray study identified hippocampal genes that differed between AU and AI rats (Burger et al., 2007). However, that study used different controls and specifically excluded genes that differed with age. Consequently, with few exceptions (e.g., Homer1, Nr4a1) (Blalock et al., 2003), there was little overlap of identified genes with the present study.
Glucose metabolism in AI
Genes encoding (glycogenolytic) phosphorylase kinase subunits (Phka1, Phkg2), expressed exclusively in astrocytes (Pfeiffer et al., 1992; Psarra et al., 1998), and the glucokinase (Gck) and Pdhb genes were also downregulated selectively in AI at 5T. Astrocytes contain the only glycogen reserve of the brain and provide increased glucose/lactate to neurons during periods of high energy demand (Chih et al., 2001; Pellerin, 2005). However, in AI, it appears that glucose-using pathways are downregulated during high demand (5T) (Fig. 3B). In addition, the parallel downregulation of insulin receptor signaling at 5T (Fig. 3B) suggests that such signaling may be important in glucose utilization in brain (as in the periphery), although brain insulin signaling has also been associated with neuronal plasticity (Zhao et al., 2004).
Upregulated notch/myelinogenic pathways in AI
Notch receptor signaling is important for oligodendrocyte specification and differentiation (Park et al., 2005), and Notch2 shows sustained response to hippocampal excitotoxic damage (Ferrari-Toninelli et al., 2003). Further, Notch1 and Notch2 exert opposing effects on some neural processes, including medulloblastoma growth and cerebellar development (Fan et al., 2004). Here, opposite regulation of Notch2 (up) and Notch1 (down) occurred in AI. Together, these observations raise the possibility that elevated Notch2 signaling, potentially in response to an injury-like signal during training, played a role in triggering remyelination programs. Upregulated myelinogenic processes have been correlated previously with memory disorders and aging, via both genomic (Blalock et al., 2003) and anatomic (Peters and Sethares, 2003) analyses. In addition, we found here that myelinogenic expression was selectively elevated in AI at 21PT.
Changes selective for AU animals
AU, by definition, did not manifest clear cognitive changes with aging. However, it is uncertain whether this cognitive stability reflects greater resistance to the impact of aging on critical pathways or, instead, a greater capacity to maintain homeostasis via compensatory alterations of other processes. One category that was consistently upregulated in AU was receptor/signal transduction (Table 3) (supplemental Tables A, C, available at www.jneurosci.org as supplemental material), suggesting that AU may increase expression in some receptor pathways to compensate for the widespread aging-related decline in signaling pathways.
Training dependence of identified pathways (Fig. 3)
Among the pathways/categories shown in Figure 3, post hoc comparisons found no significant training-dependent effects in Y or AU animals. This suggests that any short-term effects of training on expression had already abated by the end of the 5 d training period. However, several AI processes exhibited significant (Fig. 3B,G, ψ) or nearly significant training-dependent changes from baseline (NT), apparently reflecting intermediate-term changes in expression at 5T. Downregulated AI processes (Fig. 3A,B, IEG, glucose utilization) recovered by 21PT, whereas upregulated AI processes (Fig. 3F,G, Notch, myelinogenesis) were sustained at 21 d. A number of mechanisms could underlie this sustained activation. As noted, Notch2 exhibits long-lasting increases in response to damage. In addition, AI animals exhibit more sustained elevations of glucocorticoids after stress (Issa et al., 1990; Rowe et al., 1998; Bizon et al., 2001). Conceivably, this response might impact cognitive function during or soon after training (Shors et al., 1990; Bodnoff et al., 1995; Porter and Landfield, 1998; Bizon et al., 2001; McGaugh and Roozendaal, 2002) and might extend gene activation in some pathways (Fig. 3G).
In contrast, generalized aging-associated (AG) processes were relatively independent of training condition (Fig. 3C–E,H–J). Thus, genes showing AG patterns appeared to reflect training-independent, chronic alterations in expression set points. Additionally, in some AI-selective pathways (Fig. 3, A, IEG signaling, G, myelinogenesis), training-dependent changes appeared to interact with resting, baseline (NT) aging differences, exacerbating the aging effect selectively in AI.
An integrative model of pathway alterations associated with impairment
The present results reveal associations between gene expression profiles and cognitive impairment. These associations may of course reflect cause, effect, or incidental relationships between cognitive impairment and gene expression changes. Nevertheless, close association is a key prediction of any causative hypothesis and, therefore, can greatly narrow the range of candidate causal factors and enhance the sophistication of models to be tested by intervention approaches. An example of one possible model of interactions among AI-selective processes is shown schematically in Figure 5. In this view, glucose utilization cannot be maintained in AI animals during intense neuronal activation accompanying learning, leading to downregulation of glycogenolysis and pyruvate dehydrogenase [similar to events during muscle exercise (Watt et al., 2004)] and, in turn, to coordinate downregulation of some high-energy-using pathways (Table 3) that enable or support plasticity mechanisms. Concomitantly, this neuroenergetic insufficiency generates injury- or stress-like signals that activate glial inflammatory and myelinogenic pathways, perhaps further disrupting cognitive processes.
Figure 5.
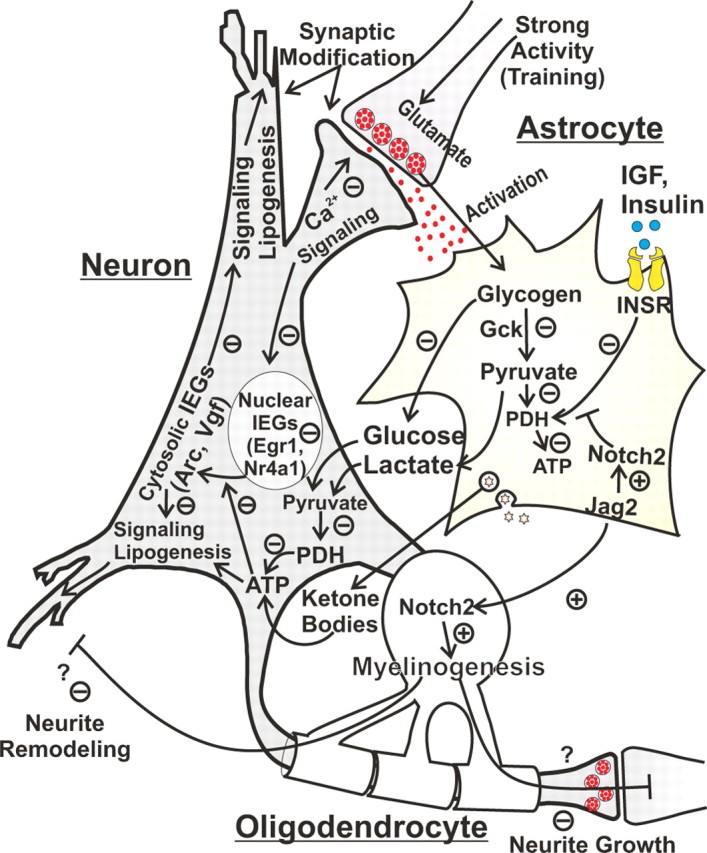
Schematic model of possible interactions among pathways selectively altered in aged impaired animals. During normal learning in Y or AU animals, intense neuronal activation and glutamate release trigger energy-dependent signaling cascades in neurons that enable or support plasticity and memory formation. Elevated glutamate release also activates enhanced glucose provision to neurons from astrocytes [via glycogenolysis, glycolysis for lactate, insulin receptor (INSR) signaling]. The increase in oxidative substrates for ATP production provides the increased energy needed by support or effector pathways related to neuronal plasticity. In hippocampus of aged impaired animals, however, these energy-providing astrocytic processes appear to be downregulated (−) after a 5 d training protocol, perhaps reflecting an adaptation to a supply deficiency (e.g., glycogen depletion). In parallel, some energy-dependent neuronal pathways appear coordinately downregulated. Together, these changes are suggested to impair the signaling or substrate synthesis needed for plasticity/learning. Concurrently, Notch2 signaling is upregulated (+) in AI, possibly by injury/stress-like signals related to energy shortfall. In turn, this triggers oligodendrocytic activation and abnormally sustained myelinogenesis, potentially further suppressing some growth pathways related to plasticity. Pathways altered selectively in aged impaired animals are indicated as increased (+) or decreased (−).
Clearly, further studies will be needed to elucidate the cause–effect relationships among these processes and the bases for selective vulnerability of AI animals. Nevertheless, several novel hippocampal pathways identified here may prove to be valuable targets for interventions aimed at enhancing successful cognitive aging.
Footnotes
This work was supported in part by National Institute on Aging Grants AG10836 and AG04542 (P.W.L.) and AG020251 (N.M.P.) and by Memory Pharmaceuticals. We thank Julia Hogan, Veronique Thibault, Ana Chow, and Bozena Bugaj-Gaweda for expert technical assistance.
References
- Abildayeva K, Jansen PJ, Hirsch-Reinshagen V, Bloks VW, Bakker AH, Ramaekers FC, de Vente J, Groen AK, Wellington CL, Kuipers F, Mulder M. 24(S)-hydroxycholesterol participates in a liver X receptor-controlled pathway in astrocytes that regulates apolipoprotein E-mediated cholesterol efflux. J Biol Chem. 2006;281:12799–12808. doi: 10.1074/jbc.M601019200. [DOI] [PubMed] [Google Scholar]
- Alder J, Thakker-Varia S, Bangasser DA, Kuroiwa M, Plummer MR, Shors TJ, Black IB. Brain-derived neurotrophic factor-induced gene expression reveals novel actions of VGF in hippocampal synaptic plasticity. J Neurosci. 2003;23:10800–10808. doi: 10.1523/JNEUROSCI.23-34-10800.2003. [DOI] [PMC free article] [PubMed] [Google Scholar]
- Ashburner M, Ball CA, Blake JA, Botstein D, Butler H, Cherry JM, Davis AP, Dolinski K, Dwight SS, Eppig JT, Harris MA, Hill DP, Issel-Tarver L, Kasarskis A, Lewis S, Matese JC, Richardson JE, Ringwald M, Rubin GM, Sherlock G. Gene ontology: tool for the unification of biology. The Gene Ontology Consortium. Nat Genet. 2000;25:25–29. doi: 10.1038/75556. [DOI] [PMC free article] [PubMed] [Google Scholar]
- Benjamini Y, Drai D, Elmer G, Kafkafi N, Golani I. Controlling the false discovery rate in behavior genetics research. Behav Brain Res. 2001;125:279–284. doi: 10.1016/s0166-4328(01)00297-2. [DOI] [PubMed] [Google Scholar]
- Bi X, Yong AP, Zhou J, Gall CM, Lynch G. Regionally selective changes in brain lysosomes occur in the transition from young adulthood to middle age in rats. Neuroscience. 2000;97:395–404. doi: 10.1016/s0306-4522(00)00021-x. [DOI] [PubMed] [Google Scholar]
- Biewenga JE, Schrama LH, Gispen WH. Presynaptic phosphoprotein B-50/GAP-43 in neuronal and synaptic plasticity. Acta Biochim Pol. 1996;43:327–338. [PubMed] [Google Scholar]
- Bizon JL, Helm KA, Han JS, Chun HJ, Pucilowska J, Lund PK, Gallagher M. Hypothalamic-pituitary-adrenal axis function and corticosterone receptor expression in behaviourally characterized young and aged Long–Evans rats. Eur J Neurosci. 2001;14:1739–1751. doi: 10.1046/j.0953-816x.2001.01781.x. [DOI] [PubMed] [Google Scholar]
- Blalock EM, Chen KC, Sharrow K, Herman JP, Porter NM, Foster TC, Landfield PW. Gene microarrays in hippocampal aging: statistical profiling identifies novel processes correlated with cognitive impairment. J Neurosci. 2003;23:3807–3819. doi: 10.1523/JNEUROSCI.23-09-03807.2003. [DOI] [PMC free article] [PubMed] [Google Scholar]
- Blalock EM, Geddes JW, Chen KC, Porter NM, Markesbery WR, Landfield PW. Incipient Alzheimer's disease: microarray correlation analyses reveal major transcriptional and tumor suppressor responses. Proc Natl Acad Sci USA. 2004;101:2173–2178. doi: 10.1073/pnas.0308512100. [DOI] [PMC free article] [PubMed] [Google Scholar]
- Blalock EM, Chen KC, Stromberg AJ, Norris CM, Kadish I, Kraner SD, Porter NM, Landfield PW. Harnessing the power of gene microarrays for the study of brain aging and Alzheimer's disease: statistical reliability and functional correlation. Ageing Res Rev. 2005;4:481–512. doi: 10.1016/j.arr.2005.06.006. [DOI] [PubMed] [Google Scholar]
- Bodnoff SR, Humphreys AG, Lehman JC, Diamond DM, Rose GM, Meaney MJ. Enduring effects of chronic corticosterone treatment on spatial learning, synaptic plasticity, and hippocampal neuropathology in young and mid-aged rats. J Neurosci. 1995;15:61–69. doi: 10.1523/JNEUROSCI.15-01-00061.1995. [DOI] [PMC free article] [PubMed] [Google Scholar]
- Bozon B, Kelly A, Josselyn SA, Silva AJ, Davis S, Laroche S. MAPK, CREB and zif268 are all required for the consolidation of recognition memory. Philos Trans R Soc Lond B Biol Sci. 2003;358:805–814. doi: 10.1098/rstb.2002.1224. [DOI] [PMC free article] [PubMed] [Google Scholar]
- Burger C, Lopez CM, Feller JA, Baker HV, Muzyczka N, Mandel RJ. Changes in transcription within the CA1 field of the hippocampus are associated with age-related spatial learning impairments. Neurobiol Learn Mem. 2007;87:21–41. doi: 10.1016/j.nlm.2006.05.003. [DOI] [PubMed] [Google Scholar]
- Burke SN, Barnes CA. Neural plasticity in the ageing brain. Nat Rev Neurosci. 2006;7:30–40. doi: 10.1038/nrn1809. [DOI] [PubMed] [Google Scholar]
- Cavallaro S, D'Agata V, Manickam P, Dufour F, Alkon DL. Memory-specific temporal profiles of gene expression in the hippocampus. Proc Natl Acad Sci USA. 2002;99:16279–16284. doi: 10.1073/pnas.242597199. [DOI] [PMC free article] [PubMed] [Google Scholar]
- Chih CP, Lipton P, Roberts EL., Jr Do active cerebral neurons really use lactate rather than glucose? Trends Neurosci. 2001;24:573–578. doi: 10.1016/s0166-2236(00)01920-2. [DOI] [PubMed] [Google Scholar]
- Colangelo V, Schurr J, Ball MJ, Pelaez RP, Bazan NG, Lukiw WJ. Gene expression profiling of 12633 genes in Alzheimer hippocampal CA1: transcription and neurotrophic factor down-regulation and up-regulation of apoptotic and pro-inflammatory signaling. J Neurosci Res. 2002;70:462–473. doi: 10.1002/jnr.10351. [DOI] [PubMed] [Google Scholar]
- Dickey CA, Loring JF, Montgomery J, Gordon MN, Eastman PS, Morgan D. Selectively reduced expression of synaptic plasticity-related genes in amyloid precursor protein + presenilin-1 transgenic mice. J Neurosci. 2003;23:5219–5226. doi: 10.1523/JNEUROSCI.23-12-05219.2003. [DOI] [PMC free article] [PubMed] [Google Scholar]
- Dietschy JM, Turley SD. Cholesterol metabolism in the brain. Curr Opin Lipidol. 2001;12:105–112. doi: 10.1097/00041433-200104000-00003. [DOI] [PubMed] [Google Scholar]
- Fan X, Mikolaenko I, Elhassan I, Ni X, Wang Y, Ball D, Brat DJ, Perry A, Eberhart CG. Notch1 and notch2 have opposite effects on embryonal brain tumor growth. Cancer Res. 2004;64:7787–7793. doi: 10.1158/0008-5472.CAN-04-1446. [DOI] [PubMed] [Google Scholar]
- Ferrari-Toninelli G, Bernardi C, Quarto M, Lozza G, Memo M, Grilli M. Long-lasting induction of Notch2 in the hippocampus of kainate-treated adult mice. NeuroReport. 2003;14:917–921. doi: 10.1097/01.wnr.0000069962.11849.e6. [DOI] [PubMed] [Google Scholar]
- Finch CE. Developmental origins of aging in brain and blood vessels: an overview. Neurobiol Aging. 2005;26:281–291. doi: 10.1016/j.neurobiolaging.2004.03.015. [DOI] [PubMed] [Google Scholar]
- French PJ, O'Connor V, Jones MW, Davis S, Errington ML, Voss K, Truchet B, Wotjak C, Stean T, Doyere V, Maroun M, Laroche S, Bliss TV. Subfield-specific immediate early gene expression associated with hippocampal long-term potentiation in vivo. Eur J Neurosci. 2001;13:968–976. doi: 10.1046/j.0953-816x.2001.01467.x. [DOI] [PubMed] [Google Scholar]
- Gall C, Lauterborn J, Bundman M, Murray K, Isackson P. Seizures and the regulation of neurotrophic factor and neuropeptide gene expression in brain. Epilepsy Res. 1991;4(Suppl):225–245. [PubMed] [Google Scholar]
- Gallagher M, Rapp PR. The use of animal models to study the effects of aging on cognition. Annu Rev Psychol. 1997;48:339–370. doi: 10.1146/annurev.psych.48.1.339. [DOI] [PubMed] [Google Scholar]
- Gallagher M, Bizon JL, Hoyt EC, Helm KA, Lund PK. Effects of aging on the hippocampal formation in a naturally occurring animal model of mild cognitive impairment. Exp Gerontol. 2003;38:71–77. doi: 10.1016/s0531-5565(02)00159-6. [DOI] [PubMed] [Google Scholar]
- Gemma C, Mesches MH, Sepesi B, Choo K, Holmes DB, Bickford PC. Diets enriched in foods with high antioxidant activity reverse age-induced decreases in cerebellar beta-adrenergic function and increases in proinflammatory cytokines. J Neurosci. 2002;22:6114–6120. doi: 10.1523/JNEUROSCI.22-14-06114.2002. [DOI] [PMC free article] [PubMed] [Google Scholar]
- Ginsberg SD, Hemby SE, Lee VM, Eberwine JH, Trojanowski JQ. Expression profile of transcripts in Alzheimer's disease tangle-bearing CA1 neurons. Ann Neurol. 2000;48:77–87. [PubMed] [Google Scholar]
- Gould TJ, Rowe WB, Heman KL, Mesches MH, Young DA, Rose GM, Bickford PC. Effects of hippocampal lesions on patterned motor learning in the rat. Brain Res Bull. 2002;58:581–586. doi: 10.1016/s0361-9230(02)00832-8. [DOI] [PubMed] [Google Scholar]
- Green PS, Simpkins JW. Estrogens and estrogen-like non-feminizing compounds. Their role in the prevention and treatment of Alzheimer's disease. Ann NY Acad Sci. 2000;924:93–98. doi: 10.1111/j.1749-6632.2000.tb05566.x. [DOI] [PubMed] [Google Scholar]
- Griffin WS. Inflammation and neurodegenerative diseases. Am J Clin Nutr. 2006;83:470S–474S. doi: 10.1093/ajcn/83.2.470S. [DOI] [PubMed] [Google Scholar]
- Guzowski JF, Lyford GL, Stevenson GD, Houston FP, McGaugh JL, Worley PF, Barnes CA. Inhibition of activity-dependent arc protein expression in the rat hippocampus impairs the maintenance of long-term potentiation and the consolidation of long-term memory. J Neurosci. 2000;20:3993–4001. doi: 10.1523/JNEUROSCI.20-11-03993.2000. [DOI] [PMC free article] [PubMed] [Google Scholar]
- Hosack DA, Dennis G, Jr, Sherman BT, Lane HC, Lempicki RA. Identifying biological themes within lists of genes with EASE. Genome Biol. 2003;4:R70. doi: 10.1186/gb-2003-4-10-r70. [DOI] [PMC free article] [PubMed] [Google Scholar]
- Huang T, McDonough CB, Abel T. Compartmentalized PKA signaling events are required for synaptic tagging and capture during hippocampal late-phase long-term potentiation. Eur J Cell Biol. 2006;85:635–642. doi: 10.1016/j.ejcb.2006.02.005. [DOI] [PMC free article] [PubMed] [Google Scholar]
- Issa AM, Rowe W, Gauthier S, Meaney MJ. Hypothalamic-pituitary-adrenal activity in aged, cognitively impaired and cognitively unimpaired rats. J Neurosci. 1990;10:3247–3254. doi: 10.1523/JNEUROSCI.10-10-03247.1990. [DOI] [PMC free article] [PubMed] [Google Scholar]
- Jiang CH, Tsien JZ, Schultz PG, Hu Y. The effects of aging on gene expression in the hypothalamus and cortex of mice. Proc Natl Acad Sci USA. 2001;98:1930–1934. doi: 10.1073/pnas.98.4.1930. [DOI] [PMC free article] [PubMed] [Google Scholar]
- Kadish I, Van Groen T. Low levels of estrogen significantly diminish axonal sprouting after entorhinal cortex lesions in the mouse. J Neurosci. 2002;22:4095–4102. doi: 10.1523/JNEUROSCI.22-10-04095.2002. [DOI] [PMC free article] [PubMed] [Google Scholar]
- Keeley MB, Wood MA, Isiegas C, Stein J, Hellman K, Hannenhalli S, Abel T. Differential transcriptional response to nonassociative and associative components of classical fear conditioning in the amygdala and hippocampus. Learn Mem. 2006;13:135–142. doi: 10.1101/lm.86906. [DOI] [PMC free article] [PubMed] [Google Scholar]
- Keeton AB, Bortoff KD, Bennett WL, Franklin JL, Venable DY, Messina JL. Insulin-regulated expression of Egr-1 and Krox20: dependence on ERK1/2 and interaction with p38 and PI3-kinase pathways. Endocrinology. 2003;144:5402–5410. doi: 10.1210/en.2003-0592. [DOI] [PubMed] [Google Scholar]
- Lee CK, Weindruch R, Prolla TA. Gene-expression profile of the ageing brain in mice. Nat Genet. 2000;25:294–297. doi: 10.1038/77046. [DOI] [PubMed] [Google Scholar]
- Levkovitz Y, Baraban JM. A dominant negative Egr inhibitor blocks nerve growth factor-induced neurite outgrowth by suppressing c-Jun activation: role of an Egr/c-Jun complex. J Neurosci. 2002;22:3845–3854. doi: 10.1523/JNEUROSCI.22-10-03845.2002. [DOI] [PMC free article] [PubMed] [Google Scholar]
- Li L, Carter J, Gao X, Whitehead J, Tourtellotte WG. The neuroplasticity-associated arc gene is a direct transcriptional target of early growth response (Egr) transcription factors. Mol Cell Biol. 2005;25:10286–10300. doi: 10.1128/MCB.25.23.10286-10300.2005. [DOI] [PMC free article] [PubMed] [Google Scholar]
- Loring JF, Wen X, Lee JM, Seilhamer J, Somogyi R. A gene expression profile of Alzheimer's disease. DNA Cell Biol. 2001;20:683–695. doi: 10.1089/10445490152717541. [DOI] [PubMed] [Google Scholar]
- Lu T, Pan Y, Kao SY, Li C, Kohane I, Chan J, Yankner BA. Gene regulation and DNA damage in the ageing human brain. Nature. 2004;429:883–891. doi: 10.1038/nature02661. [DOI] [PubMed] [Google Scholar]
- Lynch G, Rex CS, Gall CM. LTP consolidation: substrates, explanatory power, and functional significance. Neuropharmacology. 2007;52:12–23. doi: 10.1016/j.neuropharm.2006.07.027. [DOI] [PubMed] [Google Scholar]
- Mabry TR, Gold PE, McCarty R. Age-related changes in plasma catecholamine responses to acute swim stress. Neurobiol Learn Mem. 1995;63:260–268. doi: 10.1006/nlme.1995.1030. [DOI] [PubMed] [Google Scholar]
- Markowska AL, Stone WS, Ingram DK, Reynolds J, Gold PE, Conti LH, Pontecorvo MJ, Wenk GL, Olton DS. Individual differences in aging: behavioral and neurobiological correlates. Neurobiol Aging. 1989;10:31–43. doi: 10.1016/s0197-4580(89)80008-9. [DOI] [PubMed] [Google Scholar]
- McGaugh JL, Roozendaal B. Role of adrenal stress hormones in forming lasting memories in the brain. Curr Opin Neurobiol. 2002;12:205–210. doi: 10.1016/s0959-4388(02)00306-9. [DOI] [PubMed] [Google Scholar]
- McGeer PL, McGeer EG. Inflammation and the degenerative diseases of aging. Ann NY Acad Sci. 2004;1035:104–116. doi: 10.1196/annals.1332.007. [DOI] [PubMed] [Google Scholar]
- Miller RA, Galecki A, Shmookler-Reis RJ. Interpretation, design, and analysis of gene array expression experiments. J Gerontol A Biol Sci Med Sci. 2001;56:B52–B57. doi: 10.1093/gerona/56.2.b52. [DOI] [PubMed] [Google Scholar]
- Mirnics K, Pevsner J. Progress in the use of microarray technology to study the neurobiology of disease. Nat Neurosci. 2004;7:434–439. doi: 10.1038/nn1230. [DOI] [PubMed] [Google Scholar]
- Moser MB, Moser EI. Functional differentiation in the hippocampus. Hippocampus. 1998;8:608–619. doi: 10.1002/(SICI)1098-1063(1998)8:6<608::AID-HIPO3>3.0.CO;2-7. [DOI] [PubMed] [Google Scholar]
- Mufson EJ, Counts SE, Ginsberg SD. Gene expression profiles of cholinergic nucleus basalis neurons in Alzheimer's disease. Neurochem Res. 2002;27:1035–1048. doi: 10.1023/a:1020952704398. [DOI] [PubMed] [Google Scholar]
- Nixon RA, Cataldo AM, Mathews PM. The endosomal-lysosomal system of neurons in Alzheimer's disease pathogenesis: a review. Neurochem Res. 2000;25:1161–1172. doi: 10.1023/a:1007675508413. [DOI] [PubMed] [Google Scholar]
- Olton DS, Markowska A, Breckler SJ, Wenk GL, Pang KC, Koliatsos V. Individual differences in aging: behavioral and neural analyses. Biomed Environ Sci. 1991;4:166–172. [PubMed] [Google Scholar]
- Ory DS. Nuclear receptor signaling in the control of cholesterol homeostasis: have the orphans found a home? Circ Res. 2004;95:660–670. doi: 10.1161/01.RES.0000143422.83209.be. [DOI] [PubMed] [Google Scholar]
- Palop JJ, Chin J, Bien-Ly N, Massaro C, Yeung BZ, Yu GQ, Mucke L. Vulnerability of dentate granule cells to disruption of arc expression in human amyloid precursor protein transgenic mice. J Neurosci. 2005;25:9686–9693. doi: 10.1523/JNEUROSCI.2829-05.2005. [DOI] [PMC free article] [PubMed] [Google Scholar]
- Park HC, Boyce J, Shin J, Appel B. Oligodendrocyte specification in zebrafish requires notch-regulated cyclin-dependent kinase inhibitor function. J Neurosci. 2005;25:6836–6844. doi: 10.1523/JNEUROSCI.0981-05.2005. [DOI] [PMC free article] [PubMed] [Google Scholar]
- Pasinetti GM. Use of cDNA microarray in the search for molecular markers involved in the onset of Alzheimer's disease dementia. J Neurosci Res. 2001;65:471–476. doi: 10.1002/jnr.1176. [DOI] [PubMed] [Google Scholar]
- Pellerin L. How astrocytes feed hungry neurons. Mol Neurobiol. 2005;32:59–72. doi: 10.1385/MN:32:1:059. [DOI] [PubMed] [Google Scholar]
- Petanceska SS, DeRosa S, Olm V, Diaz N, Sharma A, Thomas-Bryant T, Duff K, Pappolla M, Refolo LM. Statin therapy for Alzheimer's disease: will it work? J Mol Neurosci. 2002;19:155–161. doi: 10.1007/s12031-002-0026-2. [DOI] [PubMed] [Google Scholar]
- Petanceska SS, DeRosa S, Sharma A, Diaz N, Duff K, Tint SG, Refolo LM, Pappolla M. Changes in apolipoprotein E expression in response to dietary and pharmacological modulation of cholesterol. J Mol Neurosci. 2003;20:395–406. doi: 10.1385/JMN:20:3:395. [DOI] [PubMed] [Google Scholar]
- Peters A, Sethares C. Is there remyelination during aging of the primate central nervous system? J Comp Neurol. 2003;460:238–254. doi: 10.1002/cne.10639. [DOI] [PubMed] [Google Scholar]
- Pfeiffer B, Meyermann R, Hamprecht B. Immunohistochemical co-localization of glycogen phosphorylase with the astroglial markers glial fibrillary acidic protein and S-100 protein in rat brain sections. Histochemistry. 1992;97:405–412. doi: 10.1007/BF00270387. [DOI] [PubMed] [Google Scholar]
- Porter NM, Landfield PW. Stress hormones and brain aging: adding injury to insult? Nat Neurosci. 1998;1:3–4. doi: 10.1038/196. [DOI] [PubMed] [Google Scholar]
- Psarra AM, Pfeiffer B, Giannakopoulou M, Sotiroudis TG, Stylianopoulou F, Hamprecht B. Immunocytochemical localization of glycogen phosphorylase kinase in rat brain sections and in glial and neuronal primary cultures. J Neurocytol. 1998;27:779–790. doi: 10.1023/a:1006970429961. [DOI] [PubMed] [Google Scholar]
- Puglielli L, Tanzi RE, Kovacs DM. Alzheimer's disease: the cholesterol connection. Nat Neurosci. 2003;6:345–351. doi: 10.1038/nn0403-345. [DOI] [PubMed] [Google Scholar]
- Rosi S, Ramirez-Amaya V, Vazdarjanova A, Worley PF, Barnes CA, Wenk GL. Neuroinflammation alters the hippocampal pattern of behaviorally induced Arc expression. J Neurosci. 2005;25:723–731. doi: 10.1523/JNEUROSCI.4469-04.2005. [DOI] [PMC free article] [PubMed] [Google Scholar]
- Rowe WB, Spreekmeester E, Meaney MJ, Quirion R, Rochford J. Reactivity to novelty in cognitively-impaired and cognitively-unimpaired aged rats and young rats. Neuroscience. 1998;83:669–680. doi: 10.1016/s0306-4522(97)00464-8. [DOI] [PubMed] [Google Scholar]
- Rowe WB, O'Donnell JP, Pearson D, Rose GM, Meaney MJ, Quirion R. Long-term effects of BIBN-99, a selective muscarinic M2 receptor antagonist, on improving spatial memory performance in aged cognitively impaired rats. Behav Brain Res. 2003;145:171–178. doi: 10.1016/s0166-4328(03)00116-5. [DOI] [PubMed] [Google Scholar]
- Sartipy P, Loskutoff DJ. Expression profiling identifies genes that continue to respond to insulin in adipocytes made insulin-resistant by treatment with tumor necrosis factor-alpha. J Biol Chem. 2003;278:52298–52306. doi: 10.1074/jbc.M306922200. [DOI] [PubMed] [Google Scholar]
- Scharfman HE. Brain-derived neurotrophic factor and epilepsy—a missing link? Epilepsy Curr. 2005;5:83–88. doi: 10.1111/j.1535-7511.2005.05312.x. [DOI] [PMC free article] [PubMed] [Google Scholar]
- Shors TJ, Foy MR, Levine S, Thompson RF. Unpredictable and uncontrollable stress impairs neuronal plasticity in the rat hippocampus. Brain Res Bull. 1990;24:663–667. doi: 10.1016/0361-9230(90)90005-k. [DOI] [PubMed] [Google Scholar]
- Small SA, Chawla MK, Buonocore M, Rapp PR, Barnes CA. Imaging correlates of brain function in monkeys and rats isolates a hippocampal subregion differentially vulnerable to aging. Proc Natl Acad Sci USA. 2004;101:7181–7186. doi: 10.1073/pnas.0400285101. [DOI] [PMC free article] [PubMed] [Google Scholar]
- Stepanek L, Stoker AW, Stoeckli E, Bixby JL. Receptor tyrosine phosphatases guide vertebrate motor axons during development. J Neurosci. 2005;25:3813–3823. doi: 10.1523/JNEUROSCI.4531-04.2005. [DOI] [PMC free article] [PubMed] [Google Scholar]
- Steward O, Worley PF. Selective targeting of newly synthesized Arc mRNA to active synapses requires NMDA receptor activation. Neuron. 2001;30:227–240. doi: 10.1016/s0896-6273(01)00275-6. [DOI] [PubMed] [Google Scholar]
- Stoelzel CR, Stavnezer AJ, Denenberg VH, Ward M, Markus EJ. The effects of aging and dorsal hippocampal lesions: performance on spatial and nonspatial comparable versions of the water maze. Neurobiol Learn Mem. 2002;78:217–233. doi: 10.1006/nlme.2001.4054. [DOI] [PubMed] [Google Scholar]
- Thibault O, Porter NM, Chen KC, Blalock EM, Kaminker PG, Clodfelter GV, Brewer LD, Landfield PW. Calcium dysregulation in neuronal aging and Alzheimer's disease: history and new directions. Cell Calcium. 1998;24:417–433. doi: 10.1016/s0143-4160(98)90064-1. [DOI] [PubMed] [Google Scholar]
- Thibault O, Gant JC, Landfield PW. Expansion of the calcium hypothesis of brain aging and Alzhiemer's disease: minding the store. Aging Cell. 2007 doi: 10.1111/j.1474-9726.2007.00295.x. in press. [DOI] [PMC free article] [PubMed] [Google Scholar]
- Tombaugh GC, Rowe WB, Chow AR, Michael TH, Rose GM. Theta-frequency synaptic potentiation in CA1 in vitro distinguishes cognitively impaired from unimpaired aged Fischer 344 rats. J Neurosci. 2002;22:9932–9940. doi: 10.1523/JNEUROSCI.22-22-09932.2002. [DOI] [PMC free article] [PubMed] [Google Scholar]
- Tombaugh GC, Rowe WB, Rose GM. The slow afterhyperpolarization in hippocampal CA1 neurons covaries with spatial learning ability in aged Fisher 344 rats. J Neurosci. 2005;25:2609–2616. doi: 10.1523/JNEUROSCI.5023-04.2005. [DOI] [PMC free article] [PubMed] [Google Scholar]
- Vazdarjanova A, McNaughton BL, Barnes CA, Worley PF, Guzowski JF. Experience-dependent coincident expression of the effector immediate-early genes arc and Homer 1a in hippocampal and neocortical neuronal networks. J Neurosci. 2002;22:10067–10071. doi: 10.1523/JNEUROSCI.22-23-10067.2002. [DOI] [PMC free article] [PubMed] [Google Scholar]
- Verbitsky M, Yonan AL, Malleret G, Kandel ER, Gilliam TC, Pavlidis P. Altered hippocampal transcript profile accompanies an age-related spatial memory deficit in mice. Learn Mem. 2004;11:253–260. doi: 10.1101/lm.68204. [DOI] [PMC free article] [PubMed] [Google Scholar]
- Watson GS, Craft S. Modulation of memory by insulin and glucose: neuropsychological observations in Alzheimer's disease. Eur J Pharmacol. 2004;490:97–113. doi: 10.1016/j.ejphar.2004.02.048. [DOI] [PubMed] [Google Scholar]
- Watt MJ, Heigenhauser GJ, LeBlanc PJ, Inglis JG, Spriet LL, Peters SJ. Rapid upregulation of pyruvate dehydrogenase kinase activity in human skeletal muscle during prolonged exercise. J Appl Physiol. 2004;97:1261–1267. doi: 10.1152/japplphysiol.00132.2004. [DOI] [PubMed] [Google Scholar]
- Wyss-Coray T, Mucke L. Inflammation in neurodegenerative disease–a double-edged sword. Neuron. 2002;35:419–432. doi: 10.1016/s0896-6273(02)00794-8. [DOI] [PubMed] [Google Scholar]
- Yao PJ, Zhu M, Pyun EI, Brooks AI, Therianos S, Meyers VE, Coleman PD. Defects in expression of genes related to synaptic vesicle trafficking in frontal cortex of Alzheimer's disease. Neurobiol Dis. 2003;12:97–109. doi: 10.1016/s0969-9961(02)00009-8. [DOI] [PubMed] [Google Scholar]
- Yau JL, Noble J, Hibberd C, Rowe WB, Meaney MJ, Morris RG, Seckl JR. Chronic treatment with the antidepressant amitriptyline prevents impairments in water maze learning in aging rats. J Neurosci. 2002;22:1436–1442. doi: 10.1523/JNEUROSCI.22-04-01436.2002. [DOI] [PMC free article] [PubMed] [Google Scholar]
- Zhao WQ, Chen H, Quon MJ, Alkon DL. Insulin and the insulin receptor in experimental models of learning and memory. Eur J Pharmacol. 2004;490:71–81. doi: 10.1016/j.ejphar.2004.02.045. [DOI] [PubMed] [Google Scholar]