

Abstract
Recent data indicate that T-type Ca2+ channels are amplifiers of peripheral pain signals, but their involvement in disorders of sensory neurons such as those associated with diabetes is poorly understood. To address this issue, we used a combination of behavioral, immunohistological, molecular, and electrophysiological studies in rats with streptozotocin (N-[methylnitrosocarbamoil]-d-glucosamine)-induced early diabetic neuropathy. We found that, in parallel with the development of diabetes-induced pain, T-type current density increased by twofold in medium-size cells from L4–L5 dorsal root ganglia (DRG) with a depolarizing shift in steady-state inactivation. This not only correlated closely with more prominent afterdepolarizing potentials (ADPs) but also increased cellular excitability manifested as a lower threshold for burst firing in diabetic than in control cells. T-type currents and ADPs were potently inhibited by nickel and enhanced by l-cysteine, suggesting that the CaV3.2 T-type channel isoform was upregulated. Both control and diabetic DRG cells with ADPs stained positively for isolectin B4, but only diabetic cells responded robustly to capsaicin, suggesting enhanced nociceptive function. Because increased excitability of sensory neurons may result in such pathological perceptions of pain as hyperalgesia and allodynia, upregulation of T-type Ca2+ currents and enhanced Ca2+ entry into these cells could contribute to the development of symptoms in diabetic neuropathy.
Keywords: low-threshold calcium channel, calcium, dorsal root ganglion, capsaicin, pain, diabetes
Introduction
Diabetes mellitus, a debilitating chronic disease, affects ∼100 million people. Peripheral neuropathy is one of the most common early complications of diabetes in ∼66% of these patients (Gooch and Podwall, 2004). Therapies for this devastating complication of diabetes are largely inadequate, partly attributable to lack of insight into the pathophysiological mechanisms of this disease. One of the most prominent features of diabetic peripheral neuropathy is the development of pain that typically involves the extremities, occurring as an exaggerated response to either a painful stimulus (hyperalgesia) or a mild and normally nonpainful stimulus (allodynia). The precise cellular mechanisms of hyperalgesia and allodynia in neuropathic pain remain poorly understood, but the remodeling of voltage- and ligand-gated ion channels that can increase excitability of the sensory neurons may play a critical role (Coderre et al., 1993; Woolf, 2004; Campbell and Meyer, 2006).
T-type (low-voltage-activated) Ca2+ channels activate with small depolarizations; they have a key function in neuronal membrane oscillations as well as the generation and timing of action potentials (APs) in both the PNS and CNS (Llinas, 1988; Huguenard, 1996; Catterall, 2000; Perez-Reyes, 2003). Although one of the first descriptions of the biophysical properties of these channels was performed with sensory neurons (Carbone and Lux, 1984), their function in pain transmission (nociception) has been discovered only recently. Data obtained through the use of electrophysiological, pharmacological (Todorovic et al., 2001, 2002, 2004b; Pathirathna et al., 2005a), molecular (Bourinet et al., 2005), and genetic (Choi et al., 2007) approaches have now demonstrated the function of T-type channels in supporting acute peripheral nociceptive signals. Pharmacological (Dogrul et al., 2003; Flatters and Bennett, 2004; Todorovic et al., 2004a; Pathirathna et al., 2005b) and gene-silencing (Bourinet et al., 2005) studies also support the idea that T-type channels contribute to symptoms of chronic pain associated with peripheral axonal injury. Furthermore, in a recent in vitro study, we found that modulation of T-type current appears to increase the subthreshold excitability of a specific subset of isolectin B4 (IB4)- and capsaicin-positive sensory neurons (Nelson et al., 2005). These studies are generating interest in exploring the possibility that T-type channels can be used as targets for therapeutic interventions in different disorders of sensory neurons characterized by intractable chronic pain. However, there has been no direct evidence of the involvement of T-type channels in controlling the excitability of sensory neurons in conditions accompanied by pathological symptoms of neuropathic pain such as hyperalgesia and allodynia. In the present study, we used an animal model of streptozotocin (N-[methylnitrosocarbamoil]-d-glucosamine) (STZ)-induced painful peripheral neuropathy to study the properties of T-type voltage-gated Ca2+ channels and their contribution to the excitability of acutely isolated sensory neurons.
Materials and Methods
Induction of experimental diabetes and behavioral experiments.
Abnormalities in pain perception that are similar to those in humans, such as mechanical and thermal hyperalgesia, as well as mechanical allodynia, have been reported to occur in experimental models of diabetes in rats with painful peripheral neuropathy (Aley and Levine, 2001; Gooch and Podwall, 2004). We used a well established model of streptozotocin injections to induce diabetic neuropathy in adult female retired-breeder Sprague Dawley rats (250–350 g, 6–10 months old). We used adult female adult rats because they are easier to handle in behavioral pain testing. All experimental protocols were approved by the University of Virginia Animal Care and Use Committee (Charlottesville, VA) and in accordance with the National Institutes of Health Guide for the Care and Use of Laboratory Animals. Every effort was made to minimize animal suffering and the number of animals used. Rats were maintained in a diabetic state no longer than 2 weeks after the injection of STZ because, during this time, animals do not develop significant ketoacidosis or prostration (Aley and Levine, 2001). Experimental diabetes was induced in rats by a single injection of STZ solution (50 mg/kg, i.v.) into the tail vein. STZ was prepared in saline (0.9% NaCl adjusted to pH 4 with hydrochloric acid) on ice; the solution was discarded if bubbling was noted. Control age-matched rats for behavioral experiments received an equal volume of saline.
We started checking blood sugar levels 2–3 d after injections, using a blood glucometer (Accu-check Active; Roche Diagnostics, Indianapolis, IN). Rats with values of >400 mg/dl were considered hyperglycemic and were included in experimental group (see Fig. 1A). We assessed thermal and mechanical nociception as we described previously (Pathirathna et al., 2005a,b).
Figure 1.

Hyperglycemia after STZ injection is associated with simultaneous development of enhanced mechanical and thermal nociception in adult rats. A, Average random blood glucose levels are expressed in STZ-injected rats (filled squares; n = 5) and control, saline-injected rats (open circles; n = 5) for up to 15 d after injection. In all panels, error bars indicate ±SEM; *p < 0.01, values significantly different from control; †p < 0.01 values significantly different from preinjection in STZ-injected rats (two-way ANOVA). B, Thermal hyperalgesia testing was performed measuring thermal PWLs, in seconds, of vehicle-injected (circles) or STZ-injected (triangles) rats in right (open symbols) and left (filled symbols) hindpaws. In parallel with the development of hyperglycemia, PWLs significantly decreased in both paws of STZ-injected rats on the third day after injection and remained at that level for up to 12 d of behavioral testing. C, Mechanical hyperalgesia developed in STZ-injected (triangles) but not saline-injected (circles) rats. This was shown by a twofold increase in the frequency of paw withdrawals during application of von Frey filament 4.93 starting on the third day after injection. D, Mechanical allodynia developed in STZ-injected (triangles) but not saline-injected (circles) rats as shown by the measured frequency of more than two paw withdrawals on average during application of von Frey filament 2.83, starting on the third day after injection. This filament did not evoke any response in saline-injected rats.
For all behavioral data, we used ANOVA to compare the effects of STZ or vehicle on thermal and mechanical sensation; paw-withdrawal latency (PWL) measured during thermal nociceptive testing or number of paw withdrawals during mechanical testing was the dependent variable. For example, to evaluate the course of thermal nociception during treatment with STZ versus vehicle, we compared the STZ-injected group with the saline-injected PWLs across all test sessions after treatment (i.e., 1–12 d after treatment). We also evaluated the effects of drug treatments on thermal nociception by one-way repeated-measures ANOVA on the PWLs measured during both pretreatment and posttreatment tests of the injected rats. Subsequent pairwise comparisons between the pretreatment and posttreatment PWLs were done if significant F values resulted from one-way ANOVA, and α levels were adjusted using the Bonferroni's procedure when appropriate.
Acutely dissociated dorsal root ganglia neurons.
We prepared dissociated dorsal root ganglia (DRG) cells and used them within 6–8 h for whole-cell recordings as described previously (Todorovic and Lingle, 1998). In brief, we dissected two L4 and two L5 DRGs from one animal, cut each one into three to four pieces, and incubated the pieces in Tyrode's solution containing 140 mm NaCl, 4 mm KCl, 2 mm MgCl2, 2 mm CaCl2, 10 mm glucose, and 10 mm HEPES, adjusted to pH 7.4 with NaOH and supplemented with 2 mg/ml collagenase H and 5 mg/ml dispase I (Roche Diagnostics) water bath at 36°C for 60 min. We chose L4 and L5 ganglia because they contain cell bodies of sensory neurons innervating peripheral receptive fields of the hindpaws. After incubation, ganglia were washed three times with Tyrode's solution at room temperature. We then obtained single neuronal somas at room temperature by a series of triturations through three glass pipettes fire polished to progressively decreasing diameters. For recordings, we plated cells onto an uncoated glass coverslip, placed it in a culture dish, and perfused it with external solution. All data were obtained from isolated DRG cells without visible processes. All experiments were done at room temperature. We routinely observed small, medium, and large cells in the same preparation but, for this study, focused only on cells with a soma larger than 30 μm (medium to large cells) (Scroggs and Fox, 1992).
Electrophysiology.
Recordings were made using standard whole-cell techniques. Electrodes were pulled from borosilicate glass microcapillary tubes (Drummond Scientific, Broomall, PA); they had resistances from 1 to 2 MΩ when filled with internal solution. We made recordings using an Axopatch 200B patch-clamp amplifier (Molecular Devices, Palo Alto, CA). We controlled voltage and current commands and digitization of membrane voltages and currents using a Digidata 1322A interfaced with Clampex 8.2 of the pClamp software package (Molecular Devices), running on a personal computer. We analyzed data using Clampfit (Molecular Devices) and Origin 7.0 (Microcal Software, Northampton, MA). Currents were low-pass filtered at 2–5 kHz. Series resistance (Rs) and capacitance (Cm) values were taken directly from readings of the amplifier after electronic subtraction of the capacitive transients. Series resistance was compensated to the maximum extent possible (usually ∼60–80%). In most experiments, we used a P/5 protocol for on-line leak subtractions. Action potentials were recorded in the fast current-clamp mode.
Multiple independently controlled glass syringes served as reservoirs for a gravity-driven local perfusion system. We used manually controlled valves to switch between solutions. Solution exchange was accomplished by constant suction through a glass capillary tube at the opposite end of the recording dish. All drugs were prepared as stock solutions: capsaicin, 10 mm; SNX-482, 500 μm; l-cysteine; and Ni2+, 100 mm. Drugs were freshly diluted to the appropriate concentrations at the time of experiments. l-Cysteine and Ni2+ were prepared in H2O, and capsaicin was prepared in DMSO. The maximum concentration of DMSO in any one experiment was 0.02%; at that concentration, DMSO has no effect on Ca2+ currents or membrane potential (Todorovic et al., 2001).
For voltage-clamp experiments, the external solution used to isolate Ca2+ currents contained the following (in mm): 10 BaCl2, 152 tetraethylammonium (TEA)-Cl, and 10 HEPES adjusted to pH 7.4 with TEA-OH. Tyrode's solution served as the external solution for all current-clamp recordings. The internal solution used for all voltage-clamp recordings contained the following (in mm): 110 Cs-methane sulfonate, 14 phosphocreatine, 10 HEPES, 9 EGTA, 5 Mg-ATP, and 0.3 Tris-GTP, adjusted to pH 7.3 with CsOH (solution 1). To minimize any contamination of T-type currents with even minimal high-voltage-activated (HVA) components, we also used fluoride-based internal solution to facilitate HVA rundown, containing the following (in mm): 135 tetramethyl-ammonium-hydroxide, 10 EGTA, 40 HEPES, and 2 MgCl2, adjusted to pH 7.2 with hydrofluoric acid (solution 2). The pipette solution used for all current-clamp recordings contained the following (in mm): 130 KCl, 5 MgCl2, 1 EGTA, 40 HEPES, 2 Mg-ATP, and 0.1 Na-GTP, adjusted to pH 7.2 with KOH (solution 3). The liquid junction potential between various internal salines and external solutions used for seal formation was calculated (using Clampex 8.2 software), and it was −7.7 mV for solution 1, −6.0 mV for solution 2, and −3.6 mV for solution 3. Reported membrane potentials have not been corrected for these values. All chemicals were obtained from Sigma (St. Louis, MO) unless otherwise noted.
Immunohistochemistry.
After the positive identification of a T-type channel in current-clamp mode, manifested as a prominent afterdepolarizing potential (ADP), we exchanged the external recording solution to Tyrode's solution supplemented with 10 μg/ml isolectin B4 (IB4) (Stucky and Lewin, 1999; Nelson et al., 2005) conjugated to green fluorescein isothiocyanate (FITC) (Sigma). We incubated the dish in the dark for 10–12 min and then rinsed it three times with Tyrode's solution. We visualized cells using a standard FITC filter on a regular inverted or confocal microscope. Only cells with an intense halo of stain around the plasma membrane were considered to be positive (see Fig. 6). Only one round of staining was done per dish.
Figure 6.
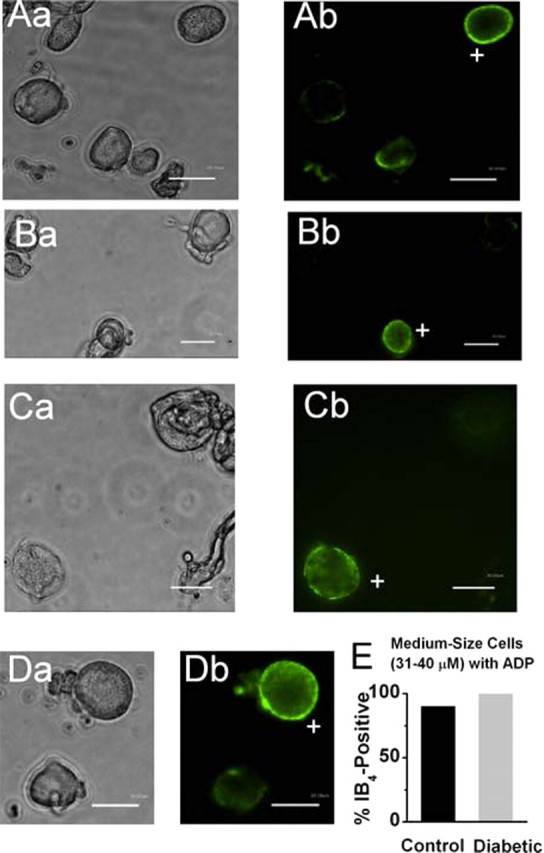
Many medium-size DRG cells with ADP are IB4 positive. A–D, Microphotographs of acutely dissociated DRG cells from control rats showing bright-field images on the left (a) and fluorescent images with FITC filter on the right (b). Scale bars, 30 μm. Only cells with a bright ring of fluorescence were considered positive (marked with + sign). Every panel contains only one IB4-positive medium DRG cell (Ab, Cb, Db) or one small IB4-positive cell (Bb) and at least one IB4-negative cell. E, Histograms show that the majority of both control (black bar) and diabetic (gray bar) medium-size DRG cells with ADP are IB4 positive. Columns indicate 90 and 100%, respectively, for the control and diabetic groups. Total number of cells studied is 10 in each group.
Analysis.
Unless otherwise indicated, statistical comparisons were made, when appropriate, using paired or unpaired Student's t test, two-way ANOVA, Mann–Whitney sum test, and χ2 or Fisher's exact test. All quantitative data are expressed as means of multiple experiments ± SEM. The percentage reductions in peak current at various Ni2+ concentrations were used to generate a concentration–response curve. Mean values were fit to the following Hill function:
where PBmax is the maximal percentage block of peak current, IC50 is the concentration that produces 50% inhibition, and n is the apparent Hill coefficient for blockade. The fitted value is reported with 95% linear confidence limits. The voltage dependencies of activation and steady-state inactivation were described with single Boltzmann distributions of the following forms:
In these forms, Imax is the maximal amplitude of current and Gmax is the maximal conductance, V50 is the voltage at which half of the current is activated or inactivated, and k represents the voltage dependence (slope) of the distribution.
The amplitude of T-type current was measured from the peak, which was subtracted from the current at the end of the depolarizing test potential to avoid small contamination with residual HVA currents. The amplitude of the HVA currents was measured at the end of the depolarizing pulse and subtracted from the baseline.
Input resistance (Rin) was determined from the slope of the peak voltage versus the current plot that resulted from injecting 500-ms-long current ranging from 1 to 3 nA.
We paid close attention to the fidelity of voltage-clamp recordings. Cells were not chosen for any quantitative analysis of current kinetics if we noted signs of poor voltage control such as slow tail currents, sudden increase in the amplitude of inward current with a depolarizing step of 10 mV increments, and/or irregular shape of the inward current.
Quantitative real-time PCR.
Lumbar dorsal root ganglia were dissected from two to three animals (50–70 mg of tissue) after decapitation of anesthetized rats. RNA was isolated by using the Trizol reagent, and quantitative real-time (qRT)-PCR was performed in triplicate using an ICycler, with IScript reverse transcription and IQ SYBR Green SuperMix reagents (all according to the instructions of the manufacturer). In preliminary experiments, a dilution series of cDNA was used with each primer set to establish conditions (primer concentration and annealing temperature) to yield >94% efficiency. Melt curve analysis and no template controls were included with each run. We used primers for three T-type channel isoforms as reported by Bourinet et al. (2005), with cyclophilin as an internal standard using primers (GenBank accession numbers NM_005038): upper, GGCTCTTGAAATGGACCCTTC; lower, CAGCCAATGCTTGATCATATTCTT; 91 bp amplicon (Lauritzen et al., 2003). We analyzed qRT-PCR data by using a so-called ΔCt normalization procedure (Pfaffl, 2001) (see Fig. 4D): the cycle threshold (Ct) for cyclophilin was subtracted from each corresponding channel Ct from each sample, and relative mRNA levels were obtained from derived ΔCt values (2−ΔCt) for comparison between experimental (STZ-injected) and control groups.
Figure 4.

Pharmacological properties of T-type current are not altered in medium-size DRG cells from diabetic rats. A, Left, Representative T-type current traces showing concentration-dependent block with escalating concentrations (3, 10, 30, and 100 μm) of Ni2+ in medium-size diabetic cell. Right, Representative T-type current traces before, during, and after application of 100 μm l-cysteine in another medium-size diabetic DRG cell. Calibration bars apply to both right and left. B, Time course of the effects of different concentrations of Ni2+ (left) and 100 μm l-cysteine (right) on the peak T-type current (IT) from the same experiments presented on A. Horizontal bars indicate the time of drug applications. Note rapid onset and reversal of the effects of these agents on the peak T-type current. C, Concentration–response curves from multiple experiments showing block of T-type current by Ni2+ in control (open symbols) and diabetic (filled symbols) medium-size DRG cells. Every symbol represents averages from multiple cells (7–8 control and 15–17 in diabetic); error bars are ±SEM. Solid lines are best fits obtained in controls using Equation 1, which gave 100% maximal block, IC50 of 10.3 ± 0.3 μm, and n of 0.9 ± 0.1 and, in diabetic cells, IC50 of 9.6 ± 0.3 μm and n of 0.8 ± 0.1. D, Histograms depict comparative analysis of CaV3.1, CaV3.2, and Cav3.3 transcripts by qRT-PCR in lumbar DRGs from control (open symbols; n = 9 groups) and diabetic (filled symbols; n = 10 groups) rats. n.s., Not significant by Student's t test.
Results
Early painful diabetic neuropathy is associated with a large, selective increase in T-type Ca2+ current density in a subpopulation of acutely dissociated rat sensory neurons
Three days after the injection of STZ, most (>70%) rats developed hyperglycemia (mean, 510 ± 14 mg/dl) that was stable through the 12 d recorded. In contrast, saline-injected animals maintained normal blood glucose levels (mean, 91 ± 1 mg/dl) that did not differ from baseline levels (Fig. 1A). In parallel with elevated blood glucose levels, diabetic rats exhibited stable exaggerated responses to thermal (Fig. 1B) and mechanical noxious stimuli (Fig. 1C), manifested, respectively, as thermal and mechanical hyperalgesia. In addition, as shown in Figure 1D, diabetic rats exhibited mechanical allodynia, manifested as withdrawal of the paw in response to previously non-noxious touch with a von Frey filament. This is consistent with previous reports of the development of neuropathic hyperalgesia and allodynia after intravenous injections of STZ (Aley and Levine, 2001). Because our behavioral pain testing indicated that both hyperglycemia and altered pain responses were established by the third day after STZ injection, we performed in vitro experiments 3–8 d after STZ injections. Furthermore, because saline injections did not alter pain responses in vivo, we used intact (naive) rats for most of our controls in in vitro experiments. For animals used in voltage-clamp recordings, we confirmed the presence of diabetes-induced thermal hyperalgesia before the animals were killed. This hyperalgesia was manifested as decreased PWLs from 10.31 ± 0.18 to 6.24 ± 0.18 s (p < 0.001) in right paws and from 10.25 ± 0.18 to 6.96 ± 0.18 s in left paws (p < 0.001; data not shown).
We recorded from a total of 490 medium-size (31–40 μm soma diameter) and large-size (≥45 μm soma diameter) DRG neurons. These included 227 cells from control, saline-injected and naive rats (n = 35 rats) and 263 cells from diabetic, STZ-injected rats (n = 60 rats). There were no significant differences in average Rs or Cm between the two groups (Table 1). To determine the expression of voltage-gated Ca2+ currents in DRG cells, we held cells at −90 mV and then imposed voltage commands of depolarizing pulses from −80 to 60 mV in 10 mV increments. A representative family of total inward currents in medium-size DRG cell from diabetic and control animals is depicted in Figure 2A. Note that T-type Ca2+ currents activate at negative membrane potentials have a characteristic criss-crossing pattern and display fast and almost complete inactivation during 250-ms-long depolarizing test potentials. Current–voltage curves were constructed from similar experiments, which indicated significant enhancement of total inward Ca2+ currents (measured from peak to baseline) in diabetic animals; these currents were most prominent at negative membrane potentials (Fig. 2B).
Table 1.
Average soma size and active and passive membrane properties of acutely dissociated medium- and large-size DRG cells from control and diabetic animals
| Average soma diameter (μm) | Rs(MΩ) | Capacitance (pF) | Rin (MΩ) | RMP (−mV) | AP overshoot (mV) | AP width at base (ms) | AP width at 0 mV (ms) | AHP amplitude (mV) | AHP duration (ms) | ADP duration (ms); amplitude (mV) | |
|---|---|---|---|---|---|---|---|---|---|---|---|
| Control medium | 35.8 ± 0.2 | 4.0 ± 0.2 | 31.5 ± 0.5 | 545.0 ± 33.8 | 49.0 ± 1.0 | 40.6 ± 1.8 | 3.0 ± 0.2 | 1.2 ± 0.1 | 12.5 ± 0.7 | 40.3 ± 3.8 | 40.3 ± 3.8; 21.8 ± 1.0 |
| Diabetic medium | 35.0 ± 0.1*** | 3.6 ± 0.2 | 30.8 ± 0.4 | 505.0 ± 27.9 | 50.1 ± 0.8 | 44.6 ± 2.0 | 3.0 ± 0.3 | 0.9 ± 0.1 | 11.2 ± 0.5 | 36.3 ± 3.0 | 39.0 ± 2.2;23.1 ± 1.0 |
| Control large | 49.6 ± 0.3 | 4.5 ± 0.3 | 42.7 ± 1.7 | 207.0 ± 24.4 | 53.0 ± 2.9 | 41.2 ± 4.0 | 3.0 ± 0.2 | 1.0 ± 0.1 | 9.4 ± 1.0 | 50.0 ± 7.2 | |
| Diabetic large | 49.6 ± 0.3 | 4.6 ± 0.3 | 42.5 ± 1.7 | 226.5 ± 29.9 | 52.2 ± 2.7 | 31.3 ± 2.6* | 3.5 ± 0.2 | 1.3 ± 0.2 | 10.3 ± 1.2 | 54.1 ± 6.2 |
Rs, Series resistance; Rin, input resistance; RMP, resting membrane potential; AHP, afterhyperpolarization potential.
*p < 0.05 and
***p < 0.001 for comparison for a given cell size between control and diabetic groups. Average soma diameter, Rs, and capacitance were obtained from 161 control and 213 diabetic medium-size DRG cells and 66 control and 43 large-size DRG cells. Rin, RMP, AP, and afterhyperpolarization potential properties were obtained from 82 control and 93 diabetic medium-size DRG cells and from 20 control and 20 diabetic large-size DRG cells. ADP parameters (maximal amplitude and maximal width) were measured at RMP of −85 mV from cells presented on Figure 5B
Figure 2.

Selective increase in T-type current density in medium-size DRG neurons from diabetic rats. A, Families of inward Ca2+ currents evoked in representative medium DRG cells from control (top black trace; Rs of 4.0 MΩ) and diabetic rats (bottom gray trace; Rs of 1.4 MΩ) by voltage steps from −90 mV (Vh) to Vt from −80 through +60 mV in 10 mV increments. Both T-type (rapidly inactivating) and HVA (slowly inactivating) currents are present on both traces. B, Average current–voltage curves from similar experiments as depicted in A are representative of control (black symbols) and diabetic (gray symbols) medium-size DRG cells. Diabetes more prominently increased the absolute average amplitude of total Ca2+ current at more negative test potentials. For example, at Vt of −40 mV, average control peak current was −1714 ± 274 pA, whereas average diabetic peak was −4035 ± 386 pA; at Vt of 0 mV, average control peak current was −4012 ± 481 pA, whereas average diabetic peak current was −5574 ± 393 pA. Error bars indicate ±SEM of multiple determinations. The amplitude of the total inward current at any given potential was measured from the baseline to its peak. Asterisks indicate significance (p < 0.05 or higher) by two-way ANOVA. The numbers in parentheses indicate the number of cells in samples. Significant p value for comparison of average peak current in control and diabetic groups was at different test potentials, as follows: Vt of −50 mV, 0.029; Vt of −40 mV, 0.001; Vt of −30 mV, 0.001; Vt of −20 mV, 0.001; Vt of −10 mV, 0.002; Vt of 0 mV, 0.006; Vt of 10 mV, 0.032. C, D, Representative Ca2+ current traces in medium (C) and large (D) DRG cells. Top black traces are from control rats; bottom gray traces are from diabetic rats. Insets indicate the voltage protocol used to separate rapidly inactivating T-type current (left traces) and slowly inactivating HVA current (right traces) in the same cells. Medium-size cells have more prominent T-type than HVA currents. Conversely, large cells have more robust HVA currents. Calibration on the scale bars is same for top and bottom panels. E, F, Histograms indicate average T-type and HVA current amplitudes in medium (E) and large (F) DRG cells from control and diabetic rats expressed as current density in picoamperes per picofarads to correct for differences in cell size. We used the same protocols to evoke T-type and HVA currents as depicted in C and D. Amplitude of T-type current was measured as maximal peak current subtracted from the small sustained current at the end of the depolarizing pulse. Amplitude of HVA current was measured as maximal current at the end of the depolarizing pulse (just before tail current) subtracted from the baseline. Size of each sample is in parentheses; error bars are SEM of multiple determinations. Peak T-type current density in medium cells averaged 70 ± 7 pA/pF in the control and 137 ± 8 pA/pF in the diabetic group; peak HVA current density in these cells averaged 50 ± 6 pA/pF in the control and 71 ± 8 pA/pF in the diabetic group. T-type current density in large cells averaged 15 ± 2 pA/pF in the control and 24 ± 5 pA/pF in the diabetic group; HVA current density was 134 ± 9 pA/pF in the control and 137 ± 12 pA/pF in the diabetic group. ***p < 0.001 indicates significant value by Student's t test; n.s. indicates nonsignificant values (p > 0.05).
To further determine which type of the current increased in diabetic animals and to express it as current density, we normalized peak inward currents to the cell capacitance in both medium- and large-size neurons from diabetic and control rats. Our protocol and representative traces for the isolation of T-type (inactivating) and HVA (sustained) Ca2+ current in medium- and large-size cells, respectively, are shown in Figure 2, C and D. Histograms based on experiments similar to this one indicate that T-type current density was enhanced, approximately twofold, in medium-size DRG cells from diabetic rats compared with cells from control rats (p < 0.001); HVA current density did not significantly differ in the two groups of DRG cells (Fig. 2E). The percentage of cells expressing T-type current was not significantly different in medium-size cells (control, 73%; diabetic, 75%; χ2 test; data not shown). In contrast, neither T-type nor HVA type Ca2+ current density was significantly different in large-size cells from control and diabetic rats (Fig. 2F).
Diabetes alters biophysical properties of voltage-dependent T-type Ca2+ current inactivation in medium-size DRG neurons
Voltage-dependent or steady-state activation and inactivation are important properties of T-type channels and can influence the excitability of neurons that express these channels. Thus, we studied the effects of STZ-induced diabetic neuropathy on voltage-dependent activation and inactivation of T-type channels in DRG cells. We assessed steady-state inactivation by a double-pulse protocol involving the application of a series of preconditioning pulses from −110 to −40 mV for 3.5 s and then measuring the resulting peak current of the second pulse at −30 mV (Fig. 3A). These experiments revealed that diabetes caused a significant depolarizing shift of ∼8 mV in the midpoint (V50) of steady-state inactivation. For example, Figure 3B shows that the inactivation V50 was approximately −74 mV in control cells (n = 15) and approximately −66 mV in diabetic medium-size cells (n = 34; p < 0.001). In contrast, the average V50 for T-type channel activation calculated from current–voltage curves was not significantly different in medium-size cells from the control (−52 mV; n = 15) and diabetic (−52 mV; n = 23) groups (Fig. 3B). The effect of diabetes on inactivation of T-type channels was cell specific for medium-size neurons: the V50 for inactivation in large DRG cells was not significantly affected (control, V50 of −73.3 ± 0.9 mV, k = 8.0 ± 1.0 mV, n = 8 cells; diabetic cells, V50 of −71.8 ± 0.9 mV, k = 7.7 ± 0.9 mV, n = 6 cells; p > 0.05; data not shown).
Figure 3.

Altered voltage-dependent inactivation in medium-size DRG cells from diabetic rats. A, Representative current traces in control on the left (black trace; Rs of 4.0 MΩ) and diabetic on the right (gray trace; Rs of 4.0 MΩ) medium DRG cells. Currents are evoked by test steps to −30 mV after a 3.5 s prepulse at potentials from −110 to −40 mV in 10 mV increments. B, Left, Normalized peak T-type current (IT) steady-state curves for voltage-dependent inactivation from similar experiments depicted in A. All points are averages from different cells as noted in parentheses: open black symbols represent the control group; filled gray symbols represent the diabetic group. Error bars are SEM of multiple determinations. Solid lines are fitted using Equation 3, giving half-maximal availability (V50) that occurred at −73.6 ± 0.6 mV with k = 7.0 ± 0.5 mV in the control group (black line). V50 was −65.8 ± 0.6 mV with k = 6.9 ± 0.5 mV in the diabetic group (gray line). Note a parallel shift to the right of the average fit in diabetic cells. Right, These curves show apparent peak conductance values defined as Ipeak/(V − Er) plotted against command potentials in whole-cell recordings from control (open black squares) and diabetic (filled gray squares) cells calculated from current–voltage curves such as those in Figure 2B. We excluded any cell in which maximal HVA current amplitude was bigger than T-type current amplitude. The extrapolated reversal potential (Er) was taken to be +55 mV. Error bars are SEM of multiple determinations; solid lines are fitted using Equation 2, giving half-maximal conductance (V50) that occurred at −52.3 ± 0.5 mV with k = 5.6 ± 0.4 mV in the control group (black line), and V50 was −52.0 ± 0.5 mV with k = 4.9 ± 0.4 mV in the diabetic group (gray line). Note that two average fits almost overlap. C, Families of inward Ca 2+ current traces in typical medium-size cells from control group (top; Rs of 4.0 MΩ) and diabetic group (bottom; Rs of 7.0 MΩ) evoked with a series of depolarizing voltage commands as shown in the insets. Left (Vh of −90 mV), Both cells exhibited similar amplitudes of HVA current (gray), and maximal T-type current (black) amplitude was ∼30% larger in control than diabetic cell. Right, In contrast, at positive membrane potentials (Vh of −40 mV) only the diabetic cell had prominent T-type current, whereas in both cells the amplitude of HVA current remains minimally affected with alterations of Vh. The criss-crossing pattern of transient Ca2+ currents at both Vh of −90 and Vh of −40 mV is characteristic of T-type channels. Calibration bars apply to both the top and bottom. D, Scaled current traces at two different Vh values of −90 and −40 mV and the same Vt of −10 mV from the same diabetic cell depicted in C. The kinetic features of macroscopic current activation and inactivation are very similar in both experimental conditions. E, Mean activation times measured as 10–90% rise times and mean inactivation time constants determined from fits of a single-exponential equation from Vh of −90 mV (open symbols) and Vh of −40 mV (filled symbols) at indicated test potentials in diabetic cells. Error bars indicate ±SEM. Strong voltage-dependent activation and inactivation are slower at negative test potentials but become nearly identical at −10 mV in both experiments. F, The graph represents mean time constants of deactivation determined in five diabetic cells with 15-ms-long depolarizing pulse from Vh of −40 mV to Vt of −30 mV followed by repolarizing pulses to the potentials indicated on x-axis. Deactivation tail currents were reasonably well fitted by single-exponential function at all potentials. Inset depicts deactivation traces in a representative diabetic cell (Rs of 4.8 MΩ).
Next we considered the possibility that the shift in V50 of inactivation in diabetic medium-size DRG cells could be attributable to contaminating HVA current, because these currents activate and inactivate at more depolarized membrane potentials. Accordingly, we used patch pipettes filled with solution containing tetramethylammonium fluoride, which inhibits HVA currents and allows the study of DRG T-type current kinetics in virtual isolation (Todorovic and Lingle, 1998). In these experiments, we repeated our protocols for voltage-dependent activation and inactivation and found that voltage-dependent activation of the channel was very little affected (control, −58 ± 1 mV, n = 13 cells; diabetic cells, −57 ± 1 mV, n = 16 cells; p > 0.05; data not shown). We also measured time-dependent activation (10–90% rise time) and inactivation τ (single-exponential fit of decaying portion of the current waveforms) from current–voltage curves in these cells over the range of test potentials from −50 to −10 mV. We found no significant differences between the control and diabetic groups (data not shown). Despite the lack of changes in activation kinetics, diabetic cells still had increased current density when measured at Vt of −30 mV (control, 50 ± 6 pA/pF, n = 19 cells; diabetic cells, 75 ± 6 pA/pF, n = 18 cells; p < 0.01; data not shown).
In contrast to the lack of changes in activation voltage dependence, voltage-dependent inactivation showed a depolarizing shift of ∼6 mV in diabetic cells compared with those in the control group (control, V50 of −74 ± 1 mV, n = 15 cells; diabetic, V50 of −68 ± 1 mV, n = 18 cells; p < 0.01; data not shown). Overall, these data in two experimental conditions yielded similar results, i.e., there was a larger overlap area between activation and inactivation curves (“window period”) in diabetic cells, indicating that more T-type channels are available at physiological membrane potentials (Fig. 3B). This is important because we previously used computational modeling to demonstrate a positive correlation between the window period and enhanced cellular excitability of DRG cells (Nelson et al., 2005).
Next we tested the possibility that T-type channels might be readily available for activation in conditions of the steady depolarizations that may accompany repetitive stimulation of primary sensory neurons (Dichter and Fischbach, 1977). Normally, T-type channels are fully inactivated, with long depolarization of neuronal membrane more positive than −50 mV (for review, see Llinas, 1988; Huguenard, 1996; Perez-Reyes 2003). Indeed, we found that, in control rats, T-type currents were prominent when Vh was −90 mV, whereas in the same cells T-type currents were completely absent when Vh was −40 mV; at those times, only sustained HVA currents were present (Fig. 3C, top row). In contrast, we were surprised to discover (Fig. 3C, bottom row) that, in a subpopulation of medium-size DRG cells from diabetic animals, inward T-type currents were only partially inactivated at Vh of −40 mV and still showed the characteristic criss-crossing pattern that is the classical electrophysiological signature of T-type currents. Overall, we observed in ∼20% (8 of 44) of DRG cells from diabetic rats substantial inactivating inward currents at Vh of −40 mV, whereas this was observed in only 2% (1 of 48) of cells from control animals (p = 0.013, Fisher's exact test; data not shown). Current density in cells from diabetic animals was 30 ± 11 pA/pF (Vh of −40 mV; Vt of −20 mV; n = 8 cells; data not shown) and 60 ± 14 pA/pF (Vh of −40 mV; Vt of −10 mV; n = 5 cells; data not shown). Furthermore, we examined the basic kinetic properties of inactivating inward currents at depolarized membrane potentials in cells from diabetic rats. Figure 3D shows raw traces from a representative diabetic cell with inward currents evoked in different conditions: Vh of −90 mV and Vt of −10 mV (top trace) and Vh of −40 mV and Vt of −10 mV (bottom trace). It is evident that these two traces have very similar macroscopic kinetic features. We also found that, at both Vh of −90 mV and Vh of −40 mV, T-type currents show voltage-dependent activation (Fig. 3E, left) and voltage-dependent inactivation (Fig. 3E, right), with values almost completely overlapping in voltage-independent regions (e.g., −10 mV). Finally, Figure 3F shows that the T-type currents we recorded at Vh of −40 mV had deactivation kinetics very similar to those reported previously for native rat DRG (Todorovic and Lingle, 1998; Nelson et al., 2005) and recombinant rat CaV3.2 T-type currents (McRory et al., 2001). These kinetics were many times slower than those reported previously for rapidly inactivating HVA channels (e.g., CaV2.3) (Randall and Tsien, 1997).
Both T-type currents and ADPs in diabetic cells have pharmacological features of CaV3.2 (α1H) isoform of T-type channels
Overall, our data are consistent with upregulation of T-type currents in medium-size diabetic DRG cells, with altered kinetic properties indicating inactivation at more depolarized potentials. Next, we examined the pharmacological properties of these cells, because some variants of T-type currents with different kinetic properties also exhibit different sensitivity to specific pharmacological tools, such as nickel, a T-type channel blocker (Lee et al., 1999), and l-cysteine, an endogenous T-type channel agonist (Joksovic et al., 2006). Figure 4A shows representative traces, and Figure 4B shows representative time courses from experiments in which nickel reversibly blocked T-type current in a concentration-dependent manner (3, 10, 30, and 100 μm; left panels) and l-cysteine (100 μm; right panels) reversibly enhanced these currents. However, when we compared IC50 values (∼10 μm) for nickel in diabetic versus control DRG cells, there was no significant difference between the two groups (Fig. 4C). l-Cysteine increased on average 70 ± 10% of peak T-type current in diabetic (n = 10) and 68 ± 12% in control (n = 5) cells (p > 0.05; data not shown). These results indicate that the pharmacological properties of T-type currents are not altered in medium-size DRG cells from diabetic rats. Because both nickel and l-cysteine at low micromolar concentrations are highly selective for the CaV3.2 isoform of T-type channels, our data strongly suggest that this isoform of T-type channels is upregulated in medium-size DRG cells in diabetes. Furthermore, we analyzed the expression of mRNA for three isoforms of T-type channels in lumbar DRGs using qRT-PCR and found that CaV3.2 was significantly more expressed within both diabetic (n = 10) and control groups (n = 9) than CaV3.1 and CaV3.3 (p < 0.001). However, when we compared mRNA levels for each corresponding isoform between diabetic and control groups, we did not find statistically significant difference (p > 0.05) (Fig. 4D).
Previous data indicate that T-type channels mediate ADPs in some acutely dissociated medium-size DRG cells from healthy rats and that these have a crucial function in controlling the cellular excitability manifested by burst firing of these cells (White et al., 1989). Hence, we did current-clamp experiments to study spike firing of DRG cells from diabetic rats. Consistent with our finding that only medium-size diabetic cells express prominent T-type currents, we found that only medium-size cells express ADPs (Fig. 5A), sometimes crowned with another AP. Furthermore, ADP visible at membrane potentials of −85 mV is potently and reversibly enhanced by the T-type channel agonist l-cysteine (100 μm) and essentially diminished by application of the T-type channel blocker nickel (30 μm). Overall, l-cysteine at 100 μm similarly increased the maximal height of ADP for 31 ± 4% of predrug values in control cells (n = 14; p < 0.001) and 55 ± 13% of diabetic cells (n = 20; p < 0.001; data not shown). In contrast, 30 μm Ni2+ blocked the maximal height of ADP by 55 ± 5% in control cells (n = 14; p < 0.001) and by 53 ± 3% in diabetic cells (n = 20; p < 0.001; data not shown). There was no statistically significant difference in the effects of l-cysteine and Ni2+ when control and diabetic groups were compared (p > 0.05, Student's t test).
Figure 5.

T-type channels decrease threshold for AP burst firing in diabetic medium-size DRG cells. A, Typical traces from current-clamp recordings in a medium DRG cell from a diabetic rat (gray traces on the left) and a cell from a control rat (black traces on the right) at indicated membrane potentials (−85 mV, top traces; −60 mV, bottom traces) obtained by hyperpolarizing the membrane via constant current through the recording electrode and applying 1-ms-long, 3–5 nA depolarizing pulses to elicit APs. We used this brief pulse to avoid contaminating APs and ADPs with the stimulus waveform. A fast single AP spike can be followed with ADP, the depolarizing hump that follows the fast repolarization of an AP. Note that the AP spike at −85 mV in both cells is followed by a depolarizing crest indicative of ADP, but, at −60 mV, only diabetic cells displayed ADP and control cells exhibited a negative membrane potential deflection. Calibration bars apply to both cells. B, Histogram compares the frequency of ADPs in percentages in medium-size diabetic and control DRG cells at membrane potentials of −85 mV (left) and −60 mV (right). Numbers in parentheses indicate number of cells with ADP of total cells studied at each potential. Overall, diabetes increased the frequency of ADP from 51 to 76% at −85 mV (p = 0.014, χ2 test) and from 8 to 31% at −60 mV (p = 0.014, χ2 test). C, Application of 80 μm Ni2+ increased rheobase for repetitive AP firing in a medium-size diabetic DRG cell. The first AP spike was induced by injecting suprathreshold (5 nA, 1 ms) depolarizing current at a given membrane potential of −85 mV. At the peak of ADP, 5 ms after the first depolarizing current injection, the amplitude of a second 1-ms-long depolarizing current was gradually increased in 0.1 nA increments to 1.4 nA, when a second AP spike was evoked. In the same cell, we applied 80 μm Ni2+, which increased rheobase for second AP to 3.0 nA. The size of the ADP is decreased in the presence of Ni2+. Also, the second current injection of 1.4 nA failed to elicit AP. After Ni2+ was washed out, both ADP and rheobase for a second AP partially recovered (1.8 nA). Inset shows current injection protocol; numbers by second AP indicate rheobase for any given experimental condition. D, Histograms with normalized values for rheobase for second AP spike firing from experiments similar to the one shown in C in medium-size diabetic DRG cells for two concentrations of Ni2+. Overall, 30 μm Ni2+ increased rheobase for 44 ± 11% (n = 8; p < 0.01), whereas 80 μm Ni2+ increased rheobase for 94 ± 11% (n = 3; p < 0.05). Error bars indicate SEM. E, Histogram compares rheobase for second AP spike firing (in nanoamperes) at membrane potentials of −60 mV in control (left) and diabetic (middle) medium-size DRG cells, as well as diabetic cells in the presence of 30 μm Ni2+ (right). In control cells, rheobase was 2.75 ± 0.20 nA, in diabetic cells it was 2.30 ± 0.13 nA, and in diabetic cells in the presence of Ni2+ it was 2.80 ± 0.17. *p < 0.05, **p < 0.01 (rank sum test). Error bars indicate ±SEM; number of cells is in parentheses.
It is known that R-type HVA Ca2+ currents share certain similar kinetic properties with T-type currents and that some R-type currents contribute to ADPs in CNS neurons (Metz et al., 2005). Thus, we also considered the possibility that SNX-482 (500 nm), a selective blocker of α1E-based R-type currents (Newcomb et al., 1998), could affect ADP. However, in three cells from diabetic rats, it had no significant effect on ADP (8 ± 7% increase; p > 0.05; data not shown). Consistent with this, SNX-482 in voltage-clamp experiments at this concentration had no significant effect on T-type currents (Vh of −90 mV, Vt of −30 mV, n = 3; and Vh of −40 mV, Vt of −30 mV, n = 4) or HVA currents (Vh of −40 mV, Vt of 0 mV, n = 5) in diabetic cells (data not shown). Overall, these data are consistent with the concept that ADPs in medium-size cells from diabetic rats have pharmacological properties of α1H (CaV3.2) T-type channels.
T-type current contributes to burst firing in medium-size DRG cells from diabetic rats more prominently than it does in cells from control rats
Because our voltage-clamp data indicate a depolarizing shift in steady-state inactivation in the diabetic group (Fig. 3), we tested the expression of ADPs at negative (e.g., −85 mV) and more depolarized physiological membrane potentials (e.g., −60 mV). Figure 5A shows AP waveforms at −85 and −60 mV in one diabetic and one control cell: both cells had prominent ADPs at −85 mV, but only the diabetic cell displays a prominent ADP at −60 mV, whereas in the control cell we observed an afterhyperpolarization at this membrane potential. Figure 5B shows that, overall, significantly more diabetic cells have ADP at −85 mV (∼0.5-fold); this difference is even more impressive at −60 mV (∼4.0-fold). This indicates that upregulated T-type channels in diabetes cause ADPs to be more prevalent at physiological membrane potentials. Next we studied the role of ADPs on burst firing at various membrane potentials using Ni2+ at concentrations thought to be selective for T-type channels. In some medium-size cells, after inducing AP with a single depolarizing current injection, ensuing ADP is crowned with spontaneous burst firing that is completely abrogated by the application of 30 or 80 μm Ni2+ (n = 3 diabetic cells; data not shown). However, to quantify this more precisely and compare the effects of Ni2+ on repetitive (burst) AP spike firing in control and diabetic cells, we designed the current-clamp protocol depicted in Figure 5C. First, AP spike was elicited with a suprathreshold current injection, and, at 5 ms intervals, graded depolarizing current was injected in 0.1 nA increments until overshooting the second AP spike was evoked (rheobase). In the presence of Ni2+ only, with escalating amplitudes of injections of depolarizing current, a second spike was evoked (Fig. 5C). Applying 80 μm Ni2+ reversibly increased rheobase for the second AP spike in this cell from 1.4 to 3.0 nA. The histograms in Figure 5D summarize these experiments and show that Ni2+ decreased excitability for burst firing in DRG cells from diabetic rats, as indicated by an increased rheobase for the second AP spike, for ∼50 and 80% for 30 and 80 μm, respectively.
It was consistent with the finding of more frequent ADPs that when we compared rheobase for second AP spike in control and diabetic cells at −60 mV, it was significantly reduced in the diabetic group, by ∼20% (Fig. 5E). This figure also shows that, in the diabetic group in the presence of 30 μm Ni2+, there was no difference compared with control group, strongly suggesting that upregulation of T-type channels underlies this reduced threshold for burst firing in diabetic cells. An important point is that we found no statistically significant difference in the active and passive membrane properties of medium-size DRG cells between control and diabetic groups (Table 1). This suggests that other voltage-gated ion channels that influence the excitability of these cells are essentially not altered.
Medium-size cells with ADP display functional properties of nociceptors, with IB4-positive immunoreactivity in both control and diabetic groups but enhanced responses to capsaicin only in diabetic rats
Previous in vivo recordings with sharp electrodes have shown that many medium-size DRG cells belong to slowly conducting Aδ sensory fibers, most of which are high-threshold mechanoreceptors capable of sensing painful stimuli (Harper and Lawson, 1985; Lee et al., 1986; Gerke and Plenderleith, 2001; Fang et al., 2005). Although acute enzymatic dissociation allows patch clamping and studies of ion channels, functional identification of dissociated DRG cells based on conduction velocity is not feasible. However, we used immunohistochemistry with IB4 and capsaicin as a pharmacological tool to study a possible functional link between medium-size DRG cells with ADP and nociceptive function in vivo.
Nociceptors can be histologically classified by the expression of IB4 from Griffonia simplicifoilia. Binding of IB4 has been observed in subsets of both Aδ - and C-type nociceptors in vivo (Gerke and Plenderleith, 2001), as well as in acutely dissociated medium-size DRG cells (Petruska et al., 2000, 2002). However, expression of this marker of nociceptive function in relation to T-type channels and ADP in medium-size neurons has not been studied. We noted that, in our preparations of many of small-size (<30 μm) and medium-size (31–40 μm) neurons, but not larger ones, stained with IB4 (Fig. 6). To establish a possible relationship between cells with ADP and IB4 antigen, we recorded from medium-size DRG cells in current clamp first and then incubated these cells with external solution containing fluorescent-dye-labeled IB4. Initially, we examined control cells with ADP, finding that 9 of 10 cells showed strong IB4 immunofluorescence. Furthermore, as shown in Figure 6, similar proportions of medium-size cells with ADP in both diabetic (100%) and control (90%) groups had an intense ring of IB4 immunofluorescence. These results strongly suggest that ADP may have an important function in controlling the excitability of the subset of IB4-positive nociceptors.
Many small- and medium-size sensory neurons may also bear vanilloid receptors and respond to capsaicin, an important selective marker of nociceptive function in vivo for DRG cells that respond to noxious heat (Snider and McMahon, 1998; McCleskey and Gold, 1999; Petruska et al., 2000, 2002; Caterina and Julius, 2001). Previous molecular studies with dissociated DRG cells have shown that positive electrophysiological responses to 2 μm capsaicin highly and selectively correlated with the expression of mRNA for vanilloid receptors in these cells (Bell et al., 2004). Thus, after recording the AP shape of medium-size DRG cells in current-clamp mode at negative membrane potentials (e.g., less than −80 mV), we held cells at −65 mV and challenged them with 2 μm capsaicin (Fig. 7A). Because even most stable current-clamp recordings can be associated with spontaneous membrane potential fluctuations, we considered depolarizations equal to or higher than 10 mV to be positive responses to capsaicin application. Based on these experiments, we classified cells as ADP positive or not and capsaicin responders or nonresponders. Figure 7B summarizes these results, showing that capsaicin responders and ADP were detected only in medium-size DRG cells, not large ones. Although the total number of capsaicin-responding medium-size cells did not statistically differ in control and diabetic groups, we found capsaicin-positive cells with ADP only in the diabetic group.
Figure 7.

Only medium-size DRG cells with ADP from diabetic rats are strongly depolarized by capsaicin. A, Top row demonstrates APs with prominent ADPs at a membrane potential of −85 mV in a representative control (left) and diabetic (right) cell. Bottom row shows different membrane responses to the application of 2 μm capsaicin at a membrane potential of −65 mV in the same cells. In the control cell, capsaicin had little effect on baseline membrane potential, whereas in the diabetic cell it reversibly depolarized the membrane for ∼30 mV. Horizontal bars indicate times of drug application. Calibration bars apply to both the left and right. B, Histograms indicate percentage of capsaicin-responsive cells in subpopulations of medium and large DRG cells from control and diabetic groups as indicated by the symbols. Only medium DRG cells responded to capsaicin application. There was no statistically significant difference between the total number of cells responding to capsaicin in control (20.8%) and diabetic (25.0%; p > 0.05, χ2 test) groups. However, when only cells with ADP are compared, there were no capsaicin positive in the control group, as opposed to 27.2% in the diabetic group. Numbers in parentheses indicate number of capsaicin-positive cells in indicated samples. * indicates statistical significance of 0.02; n.s. indicates p > 0.05 by χ2 test.
Discussion
Recent data indicate that T-type channels have a crucial function in tuning sensory neuron excitability and serve as amplifiers in peripheral pain transmission. However, the function of these channels in the excitability of sensory cells in painful disorders of peripheral neurons has not been established. To our knowledge, this is the first study demonstrating the upregulation of T-type channels and their contribution to increased cellular excitability in a subpopulation of sensory neurons in rats with painful diabetic neuropathy.
Characterization of T-type currents in subpopulations of DRG neurons in diabetic neuropathy
A major finding of this study is that a large and selective increase in the amplitude of T-type current occurs in medium-size DRG neurons with prominent changes in voltage-dependent inactivation of the channel. Our pharmacological, molecular, and kinetic analyses of the current is consistent with the α1H (CaV3.2) isoform, the most abundant isoform of T-type channels in DRG from normal rats (Talley et al., 1999). The immediate cause of the increase in T-type current is unclear. Indeed, many different possibilities may contribute. One possibility is that the STZ-induced diabetic neuropathy model can be associated with alterations in neuronal homeostasis, such as local microvascular ischemia of peripheral nerves (Schratzberger et al., 2001; Chavez et al., 2005). This is particularly important because tissue ischemia–hypoxia of only 6–24 h is sufficient to induce robust and selective twofold increase in T-type CaV3.2 current density in neuroblastoma cell lines (Del Toro et al., 2003).
Is it possible that there may be a switch in T-type channel isoform, as occurs for voltage-gated Na+ currents after peripheral nerve axotomy (Dib-Hajj et al., 1999)? It is known that the α1I (CaV3.3) isoform of the T-type channel is characterized by more strongly positive voltages of both activation and inactivation than are the α1G (CaV3.1) and α1H (CaV3.2) isoforms (Perez-Reyes, 2003). However, we feel that this is unlikely because diabetic DRG T-type currents potently blocked with Ni2+ (IC50 of 10 μm) and increased with l-cysteine (maximal effect achieved with 100 μm). In contrast, α1I and α1G type currents are blocked only by higher concentrations of Ni2+ (IC50 of 250 μm) (Lee et al., 1999) and are not altered even by 10-fold higher concentrations of l-cysteine (Joksovic et al., 2006). Finally, our qRT-PCR analysis of DRGs from diabetic rats confirms the notion that the relative ratio of T-type channel isoforms is not altered.
Another possible reason for the increase in T-type current is that intracellular messenger-mediated pathways, particularly phosphorylation reactions, may have modified diabetic DRG T-type current. For example, recombinant α1H T-type channels are stimulated by Ca2+/calmodulin-dependent kinase II (Wolfe et al., 2002). In thalamic native neurons mostly based on α1G isoform, ATP causes a paradoxical potentiation of T-type currents at depolarized membrane potentials (Leresche et al., 2004). This can cause more T-type channels to be available for activation at physiological membrane potentials (e.g., −60 mV), a consequence that is similar to our findings in DRG cells at membrane potentials of −40 mV.
It is likely that depolarizing shift in steady-state inactivation of T-type channels at Vh of −90 mV is not sufficient alone to account for a large increase in current density that we observed in medium-size DRG cells. This suggests that other mechanisms may contribute to upregulation of T-type channels. In contrast to other voltage-gated ion channels, there has been no conclusive evidence of the existence of T-type channel-specific accessory subunits. However, both β and α2δ HVA Ca2+ channel subunits may increase the surface expression and current density of recombinant T-type channels (Dubel et al., 2004). This is particularly intriguing because an increase in mRNA for the α2δ subunit has been reported in DRGs from rats with mechanically (Luo et al., 2001) and STZ-induced (Yusaf et al., 2001) peripheral neuropathy. This accessory subunit is also considered a major cellular target for the anticonvulsant gabapentin, which can relieve diabetes-induced neuropathic pain in humans and other animals (Rogawski and Loscher, 2004).
It is also possible that new splice variants of T-type current with higher probability of channel opening are overexpressed in DRGs in rats with diabetic neuropathy. Recently, multiple functional transcripts have been reported for human CaV3.2 channels as a result of alternative splicing of this gene at 12–14 sites. Some of these splice variants involve a depolarizing shift in steady-state inactivation of this channel that is likely to affect membrane firing in a manner similar to our findings (Zhong et al., 2006). Toward this end, new nociceptor-specific splice variants increase N-type HVA Ca2+ current density in DRG cells (Bell et al., 2004).
Thus, it is possible that many different factors contribute to the increased current density and altered voltage-dependent inactivation of T-type channels in DRG cells from diabetic rats. In our view, the most appealing hypothesis is that these changes are the result of second-messenger regulation, expression of accessory Ca2+ channel subunits, and/or new splice variants of CaV3.2 channels. Overall, these possibilities provide several potential avenues for studies aimed at deciphering the molecular basis of sensory neuron cell-specific upregulation of T-type currents in diabetic neuropathy.
Functional identification of medium-size DRG cells with ADP in vitro
Our findings in this study were primarily derived from recordings of dissociated medium-size DRG cells that express robust T-type current and ADP (White et al., 1989; Scroggs and Fox, 1992). Direct evidence that could be obtained from in vivo recordings linking ADPs to either nociceptive or mechanosensitive DRG neurons is presently lacking. However, comprehensive in vivo study has shown that most DRG cells in this size range belong to Aδ high-threshold mechanoreceptors (Fang et al., 2005). Furthermore, many of these cells stain for IB4 (Hammond et al., 2004), which selectively labels nociceptors that contribute to mechanical nociception (Vulchanova et al., 2001) and are proposed to have a key function in the development of neuropathic pain (Snider and McMahon, 1998). In addition, some of these cells also display capsaicin sensitivity (Petruska et al., 2000, 2002), indicating their ability to respond to noxious heat in vivo. Collectively, these results strongly suggest that DRG cells with ADP may be prominent contributors to mechanical and thermal nociception.
Recent studies with cultured mouse DRGs have suggested that T-type currents increase cellular excitability in a small subpopulation of medium-size DRG cells thought to belong to D-hair mechanoreceptors (Shin et al., 2003; Dubreuil et al., 2004). Because these cells are difficult to identify among acutely dissociated cells, it is possible that some of the cells in our sample could also belong to this class of low-threshold mechanoreceptors. However, it has been postulated that increased activity of mechanosensitive, primarily non-nociceptive DRG neurons contributes to enhanced excitability of central neurons in the dorsal horn of the spinal cord (central sensitization). Such cells have also been implicated in the pathophysiology of neuropathic pain (Coderre et al., 1993; Woolf, 2004; Campbell and Meyer, 2006).
Functional implications
Overall, our data are consistent with the hypothesis that upregulation of T-type channels and more prominent expression of underlying ADPs may increase the excitability of a subset of IB4- and capsaicin-positive DRG neurons. Furthermore, because many of these cells are likely to respond to noxious heat and mechanical stimuli in vivo, our data strongly suggest that upregulation of T-type channels and a consequent increase in the excitability of these cells may contribute to pathological pain responses such as the mechanical and thermal hyperalgesia and mechanical allodynia that occur in diabetic neuropathy (Fig. 1). This conclusion is supported by the observation that an early increase in T-type current in these cells seems to be selective because it is not accompanied by changes in other voltage-gated channels that contribute to resting membrane potential and action potential (Table 1).
Previous studies have documented remodeling of voltage-gated Ca2+ channels in different subpopulations of sensory neurons in other animal models of diabetes. For example, in genetically induced diabetic BB/W rats, upregulation of HVA Ca2+ currents was found in small DRG cells as a consequence of diminished G-protein function, which may in turn contribute to decreased efficacy of opioid analgesics (Hall et al., 1996). These rats, after 8 months of diabetes, also upregulate T-type channels in small DRG cells (Hall et al., 1995). Serum from BB/W rats increases both HVA and T-type currents in DRG cells grown in culture without alterations in T-type channel inactivation kinetics (Ristic et al., 1998). In contrast, we found that T-type channels in medium-size neurons in STZ-induced diabetic neuropathy show prominent changes in voltage-dependent inactivation, allowing a greater fraction of the channels to be available for activation during both short and prolonged periods of depolarization. These unique changes seem to be specific to medium-size neurons; they did not occur in large-size DRG cells in this study. Furthermore, upregulation of T-type channels and the shift in inactivation resulted in more prominent ADPs in these cells, profoundly influencing burst firing of these cells. Specifically, we found that the threshold for repetitive spike firing was significantly decreased in diabetic cells compared with control cells. This is important because the hyperexcitability of sensory neurons is thought to contribute directly to enhanced nociception in vivo. Because pain states such as allodynia and hyperalgesia are part of many disorders of sensory neurons, our data imply that blockade of T-type channels in these neurons may ameliorate neuropathic pain, which is inconsistently responsive to currently available therapies. Thus, future pharmacological developments targeted to T-type channels in sensory neurons may offer better treatments for intractable neuropathic pain in diabetes.
Footnotes
This work was supported in part by National Institutes of Health Grant R01 GM075229 and funds from Department of Anesthesiology (S.M.T.). We thank Dr. Edward Perez-Reyes for the use of the confocal microscope.
References
- Aley KO, Levine JD. Rapid onset pain induced by intravenous streptozotocin in the rat. J Pain. 2001;2:146–150. doi: 10.1054/jpai.2001.21592. [DOI] [PubMed] [Google Scholar]
- Bell TJ, Thaler C, Castiglioni AJ, Helton TD, Lipscombe D. Cell-specific alternative splicing increases calcium channel current density in the pain pathway. Neuron. 2004;41:127–138. doi: 10.1016/s0896-6273(03)00801-8. [DOI] [PubMed] [Google Scholar]
- Bourinet E, Alloui A, Monteiol A, Barrere C, Couette B, Poirot O, Pages A, McRory J, Snutch TP, Eschalier A, Nargeot J. Silencing of the Cav3.2 T-type calcium channel gene in sensory neurons demonstrates its major role in nociception. EMBO J. 2005;24:315–324. doi: 10.1038/sj.emboj.7600515. [DOI] [PMC free article] [PubMed] [Google Scholar]
- Campbell JN, Meyer RA. Mechanisms of neuropathic pain. Neuron. 2006;52:77–92. doi: 10.1016/j.neuron.2006.09.021. [DOI] [PMC free article] [PubMed] [Google Scholar]
- Carbone E, Lux HD. A low-voltage activated, fully inactivating Ca2+ channel in vertebrate sensory neurons. Nature. 1984;310:501–502. doi: 10.1038/310501a0. [DOI] [PubMed] [Google Scholar]
- Caterina MJ, Julius D. The vanilloid receptor: a molecular gateway to the pain pathway. Annu Rev Neurosci. 2001;24:487–517. doi: 10.1146/annurev.neuro.24.1.487. [DOI] [PubMed] [Google Scholar]
- Catterall WA. Structure and regulation of voltage-gated Ca2+ channels. Annu Rev Cell Dev Biol. 2000;16:521–555. doi: 10.1146/annurev.cellbio.16.1.521. [DOI] [PubMed] [Google Scholar]
- Chavez JC, Almhanna K, Berti-Mattera LN. Transient expression of hypoxia-inducible factor-1 alpha and target genes in peripheral nerves from diabetic rats. Neurosci Lett. 2005;374:179–182. doi: 10.1016/j.neulet.2004.10.050. [DOI] [PubMed] [Google Scholar]
- Choi S, Na HS, Kim J, Lee J, Lee S, Kim D, Park J, Chen CC, Campbell KP, Shin HS. Attenuated pain responses in mice lacking Ca3.2 T-type channels. Genes Brain Behav. 2007 doi: 10.1111/j.1601-183X.2006.00268.x. in press. [DOI] [PubMed] [Google Scholar]
- Coderre TJ, Katz J, Vaccarino AL, Melzack R. Contribution of central neuroplasticity to pathological pain: review of clinical and experimental evidence. Pain. 1993;52:259–285. doi: 10.1016/0304-3959(93)90161-H. [DOI] [PubMed] [Google Scholar]
- Del Toro R, Levitsky KL, Lopez-Barneo J, Chiara MD. Induction of T-type calcium channel gene expression by chronic hypoxia. J Biol Chem. 2003;278:22316–22324. doi: 10.1074/jbc.M212576200. [DOI] [PubMed] [Google Scholar]
- Dib-Hajj SD, Fjell J, Cummins TR, Zheng Z, Fried K, LaMotte R, Black JA, Waxman SG. Plasticity of sodium channel expression in DRG neurons in the chronic constriction injury model of neuropathic pain. Pain. 1999;83:591–600. doi: 10.1016/S0304-3959(99)00169-4. [DOI] [PubMed] [Google Scholar]
- Dichter MA, Fischbach GD. The action potential of chick dorsal root ganglion neurons maintained in cell culture. J Physiol (Lond) 1977;267:281–298. doi: 10.1113/jphysiol.1977.sp011813. [DOI] [PMC free article] [PubMed] [Google Scholar]
- Dogrul A, Gardell LR, Ossipov MH, Tulunay FC, Lai J, Porecca F. Reversal of experimental neuropathic pain by T-type calcium channel blockers. Pain. 2003;105:159–168. doi: 10.1016/s0304-3959(03)00177-5. [DOI] [PubMed] [Google Scholar]
- Dubel SJ, Altier C, Chaumont S, Lory P, Bourinet E, Nargeot J. Plasma membrane expression of T-type calcium channel alpha(1) subunits is modulated by high voltage-activated auxiliary subunits. J Biol Chem. 2004;279:29263–29269. doi: 10.1074/jbc.M313450200. [DOI] [PubMed] [Google Scholar]
- Dubreuil A, Boukhaddaoui H, Desmadryl G, Martinez-Salgado C, Moshourab R, Lewin GR, Caroll P, Valmier J, Scamps F. Role of T-type calcium current in identified D-hair mechanoreceptor neurons studied in vitro. J Neurosci. 2004;24:8480–8484. doi: 10.1523/JNEUROSCI.1598-04.2004. [DOI] [PMC free article] [PubMed] [Google Scholar]
- Fang X, McMullan S, Lawson SN, Djouhri L. Electrophysiological differences between nociceptive and non-nociceptive dorsal root ganglion neurons in the rat in vivo. J Physiol (Lond) 2005;565:927–943. doi: 10.1113/jphysiol.2005.086199. [DOI] [PMC free article] [PubMed] [Google Scholar]
- Flatters SJL, Bennett GJ. Ethosuximide reverses paclitaxel- and vincristine-induced painful peripheral neuropathy. Pain. 2004;109:150–161. doi: 10.1016/j.pain.2004.01.029. [DOI] [PubMed] [Google Scholar]
- Gerke MB, Plenderleith MB. Binding sites for the plant lectin Bandeiraea simplicifolia I-isolectin B(4) are expressed by nociceptive primary sensory neurones. Brian Res. 2001;911:101–104. doi: 10.1016/s0006-8993(01)02750-0. [DOI] [PubMed] [Google Scholar]
- Gooch C, Podwall D. The diabetic neuropathies. Neurologist. 2004;10:311–322. doi: 10.1097/01.nrl.0000144733.61110.25. [DOI] [PubMed] [Google Scholar]
- Hall KE, Sima AA, Wiley JW. Voltage-dependent calcium currents are enhanced in dorsal root ganglion neurones from the Bio Bred/Worchester diabetic rat. J Physiol (Lond) 1995;486:313–322. doi: 10.1113/jphysiol.1995.sp020814. [DOI] [PMC free article] [PubMed] [Google Scholar]
- Hall KE, Sima AA, Wiley JW. Opiate-mediated inhibition of calcium signaling is decreased in dorsal root ganglion neurons from the diabetic BB/W rat. J Clin Invest. 1996;97:1165–1172. doi: 10.1172/JCI118530. [DOI] [PMC free article] [PubMed] [Google Scholar]
- Hammond DL, Ackerman L, Holdsworth R, Elzey B. Effects of spinal nerve ligation on immunohistochemically identified neurons in the L4 and L5 dorsal root ganglia of the rat. J Comp Neurol. 2004;475:575–589. doi: 10.1002/cne.20209. [DOI] [PubMed] [Google Scholar]
- Harper AA, Lawson SN. Conduction velocity is related to morphological cell type in rat dorsal root ganglion neurons. J Physiol (Lond) 1985;359:31–46. doi: 10.1113/jphysiol.1985.sp015573. [DOI] [PMC free article] [PubMed] [Google Scholar]
- Huguenard JR. Low threshold calcium currents in central nervous system neurons. Annu Rev Physiol. 1996;58:329–348. doi: 10.1146/annurev.ph.58.030196.001553. [DOI] [PubMed] [Google Scholar]
- Joksovic PM, Nelson MT, Jevtovic-Todorovic V, Patel MK, Perez-Reyes E, Campbell KP, Chen C-C, Todorovic SM. CaV3.2 (α1H) channel is the major molecular substrate for redox regulation of T-type channels in the rat and mouse thalamus. J Physiol (Lond) 2006;574:415–430. doi: 10.1113/jphysiol.2006.110395. [DOI] [PMC free article] [PubMed] [Google Scholar]
- Lauritzen I, Zanzouri M, Honore E, Duprat F, Ehrengruber MU, Lazdunski M, Patel AJ. K+-dependent cerebellar granule neuron apoptosis. Role of task leak K+ channels. J Biol Chem. 2003;278:32068–32076. doi: 10.1074/jbc.M302631200. [DOI] [PubMed] [Google Scholar]
- Lee JH, Gomora JC, Cribbs LL, Perez-Reyes E. Nickel block of three cloned T-type calcium channels: low concentrations selectively block alpha1H. Biophys J. 1999;77:3034–3042. doi: 10.1016/S0006-3495(99)77134-1. [DOI] [PMC free article] [PubMed] [Google Scholar]
- Lee KH, Chung K, Chung JM, Coggeshall RE. Correlation of cell body size, axon size, and signal conduction velocity for individually labeled dorsal root ganglion cells in the cat. J Comp Neurol. 1986;15:335–346. doi: 10.1002/cne.902430305. [DOI] [PubMed] [Google Scholar]
- Leresche N, Hering J, Lambert RC. Paradoxical potentiation of neuronal T-type Ca2+ current by ATP at resting membrane potential. J Neurosci. 2004;24:5592–5602. doi: 10.1523/JNEUROSCI.1038-04.2004. [DOI] [PMC free article] [PubMed] [Google Scholar]
- Llinas RR. The intrinsic electrophysiological properties of mammalian neurons: insights into central nervous system function. Science. 1988;242:1654–1664. doi: 10.1126/science.3059497. [DOI] [PubMed] [Google Scholar]
- Luo ZD, Chaplan SR, Higuera ES, Sorkin LS, Stauderman KA, Williams ME, Yaksh TL. Upregulation of dorsal root ganglion α2δ calcium channel subunit and its correlation with allodynia in spinal nerve-injured rats. J Neurosci. 2001;21:1868–1875. doi: 10.1523/JNEUROSCI.21-06-01868.2001. [DOI] [PMC free article] [PubMed] [Google Scholar]
- McCleskey EW, Gold MS. Ion channels of nociception. Annu Rev Physiol. 1999;61:835–856. doi: 10.1146/annurev.physiol.61.1.835. [DOI] [PubMed] [Google Scholar]
- McRory JE, Santi CM, Hamming KSC, Mezeyova J, Sutton KG, Baillie DL, Stea A, Snutch TP. Molecular and functional characterization of a family of rat brain T-type calcium channels. J Biol Chem. 2001;276:3999–4011. doi: 10.1074/jbc.M008215200. [DOI] [PubMed] [Google Scholar]
- Metz AE, Jarsky T, Martina M, Spruston N. R-type calcium channels contribute to afterdepolarization and bursting in hippocampal CA1 pyramidal neurons. J Neurosci. 2005;25:5763–5773. doi: 10.1523/JNEUROSCI.0624-05.2005. [DOI] [PMC free article] [PubMed] [Google Scholar]
- Nelson MT, Joksovic PM, Perez-Reyes E, Todorovic SM. The endogenous redox agent l-cysteine induces T-type Ca2+ channel-dependent sensitization of a novel subpopulation of rat peripheral nociceptors. J Neurosci. 2005;25:8766–8775. doi: 10.1523/JNEUROSCI.2527-05.2005. [DOI] [PMC free article] [PubMed] [Google Scholar]
- Newcomb R, Szoke B, Palma A, Wang G, Chen X, Hopkins W, Cong R, Miller J, Urge L, Tarczy-Hornoch K, Loo JA, Dooley DJ, Nadasdi L, Tsien RW, Lemos J, Miljanich G. Selective peptide antagonist of the class E calcium channel from the venom of the tarantula Hysterocrates gigas. Biochem. 1998;37:15353–15362. doi: 10.1021/bi981255g. [DOI] [PubMed] [Google Scholar]
- Pathirathna S, Brimelow BC, Jagodic MM, Kathiresan K, Jiang X, Zorumski CF, Mennerick S, Covey DF, Todorovic SM, Jevtovic-Todorovic V. New evidence that both T-type Ca2+ channels and GABAA channels are responsible for the potent peripheral analgesic effects of 5α-reduced neuroactive steroids. Pain. 2005a;114:429–443. doi: 10.1016/j.pain.2005.01.009. [DOI] [PubMed] [Google Scholar]
- Pathirathna S, Todorovic SM, Covey DF, Jevtovic-Todorovic V. Novel 5α-reduced neuroactive steroids induce peripheral thermal anti-nociception in rats with neuropathic pain. Pain. 2005b;117:326–339. doi: 10.1016/j.pain.2005.06.019. [DOI] [PubMed] [Google Scholar]
- Perez-Reyes E. Molecular physiology of low-voltage-activated T-type calcium channels. Physiol Rev. 2003;83:117–161. doi: 10.1152/physrev.00018.2002. [DOI] [PubMed] [Google Scholar]
- Petruska JC, Napaporn J, Johnson RD, Gu JG, Cooper BY. Subclassified acutely dissociated cells of rat DRG: histochemistry and patterns of capsaicin-, proton-, and ATP-activated currents. J Neurophysiol. 2000;84:2365–2379. doi: 10.1152/jn.2000.84.5.2365. [DOI] [PubMed] [Google Scholar]
- Petruska JC, Napaporn J, Johnson RD, Gu JG, Cooper BY. Chemical responsiveness and histochemical phenotype of electrophysiologically classified cells of the adult rat dorsal root ganglion. Neuroscience. 2002;115:15–30. doi: 10.1016/s0306-4522(02)00409-8. [DOI] [PubMed] [Google Scholar]
- Pfaffl MW. A new mathematical model for relative quantification in real-time RT-PCR. Nucleic Acids Res. 2001;29:e45. doi: 10.1093/nar/29.9.e45. [DOI] [PMC free article] [PubMed] [Google Scholar]
- Randall AD, Tsien RW. Contrasting biophysical and pharmacological properties of T-type and R-type calcium channels. Neuropharmacology. 1997;36:879–893. doi: 10.1016/s0028-3908(97)00086-5. [DOI] [PubMed] [Google Scholar]
- Ristic H, Srinivasan S, Hall KE, Sima AA, Wiley JW. Serum from diabetic BB/W rats enhances calcium currents in primary sensory neurons. J Neurophysiol. 1998;80:1236–1244. doi: 10.1152/jn.1998.80.3.1236. [DOI] [PubMed] [Google Scholar]
- Rogawski MA, Loscher W. The neurobiology of antiepileptic drugs for the treatment of nonepileptic conditions. Nat Med. 2004;10:685–692. doi: 10.1038/nm1074. [DOI] [PubMed] [Google Scholar]
- Schratzberger P, Walter DH, Rittig K, Bahlmann FH, Pola R, Curry C, Silver M, Krainin JG, Weinberg DH, Ropper AH, Isner JM. Reversal of experimental diabetic neuropathy by VEGF gene transfer. J Clin Invest. 2001;107:1083–1092. doi: 10.1172/JCI12188. [DOI] [PMC free article] [PubMed] [Google Scholar]
- Scroggs RS, Fox AP. Calcium current variation between acutely isolated adult rat dorsal root ganglion neurons of different size. J Physiol (Lond) 1992;445:639–658. doi: 10.1113/jphysiol.1992.sp018944. [DOI] [PMC free article] [PubMed] [Google Scholar]
- Shin JB, Martinez-Salgado C, Heppenstall PA, Lewin GR. A T-type calcium channel required for normal function of a mammalian mechanoreceptor. Nat Neurosci. 2003;6:724–730. doi: 10.1038/nn1076. [DOI] [PubMed] [Google Scholar]
- Snider WD, McMahon SB. Tackling pain at the source: new ideas about nociceptors. Neuron. 1998;20:629–632. doi: 10.1016/s0896-6273(00)81003-x. [DOI] [PubMed] [Google Scholar]
- Stucky CL, Lewin GR. Isolectin B4-positive and -negative nociceptors are functionally distinct. J Neurosci. 1999;19:6497–6505. doi: 10.1523/JNEUROSCI.19-15-06497.1999. [DOI] [PMC free article] [PubMed] [Google Scholar]
- Talley EM, Cribbs LL, Lee JH, Daud A, Perez-Reyes E, Bayliss DA. Differential distribution of three members of a gene family encoding low voltage-activated (T-type) calcium channels. J Neurosci. 1999;19:1895–1911. doi: 10.1523/JNEUROSCI.19-06-01895.1999. [DOI] [PMC free article] [PubMed] [Google Scholar]
- Todorovic SM, Lingle CJ. Pharmacological properties of T-type Ca2+ current in adult rat sensory neurons: effects of anticonvulsant and anesthetic agents. J Neurophysiol. 1998;79:240–252. doi: 10.1152/jn.1998.79.1.240. [DOI] [PubMed] [Google Scholar]
- Todorovic SM, Jevtovic-Todorovic V, Meyenburg A, Mennerick S, Perez-Reyes E, Romano C, Olney JW, Zorumski CF. Redox modulation of T-type calcium channels in rat peripheral nociceptors. Neuron. 2001;31:75–85. doi: 10.1016/s0896-6273(01)00338-5. [DOI] [PubMed] [Google Scholar]
- Todorovic SM, Meyenburg A, Jevtovic-Todorovic V. Mechanical and thermal antinociception in rats following systemic administration of mibefradil, a T-type calcium channel blocker. Brain Res. 2002;951:336–340. doi: 10.1016/s0006-8993(02)03350-4. [DOI] [PubMed] [Google Scholar]
- Todorovic SM, Meyenburg A, Jevtovic-Todorovic V. Redox modulation of peripheral T-type Ca2+ channels in vivo: alteration of nerve injury-induced thermal hyperalgesia. Pain. 2004a;109:328–339. doi: 10.1016/j.pain.2004.01.026. [DOI] [PubMed] [Google Scholar]
- Todorovic SM, Pathirathna S, Brimelow BC, Jagodic MM, Ko SH, Jiang X, Nilsson KR, Zorumski CF, Covey DF, Jevtovic-Todorovic V. 5beta-reduced neuroactive steroids are novel voltage-dependent blockers of T-type Ca2+ channels in rat sensory neurons in vitro and potent peripheral analgesics in vivo. Mol Pharmacol. 2004b;66:1223–1235. doi: 10.1124/mol.104.002402. [DOI] [PubMed] [Google Scholar]
- Vulchanova L, Olson TH, Stone LS, Riedl MS, Elde R, Honda CN. Cytotoxic targeting of isolectin IB4-binding sensory neurons. Neuroscience. 2001;108:143–155. doi: 10.1016/s0306-4522(01)00377-3. [DOI] [PubMed] [Google Scholar]
- White G, Lovinger DM, Weight FF. Transient low-threshold Ca2+ current triggers burst firing through an afterdepolarizing potential in an adult mammalian neuron. Proc Natl Acad Sci USA. 1989;86:6802–6806. doi: 10.1073/pnas.86.17.6802. [DOI] [PMC free article] [PubMed] [Google Scholar]
- Wolfe JT, Wang H, Perez-Reyes E, Barrett PQ. Stimulation of recombinant Cav3.2, T-type, Ca2+ channel currents by CaMKIIgamma(C) J Physiol (Lond) 2002;15:343–355. doi: 10.1113/jphysiol.2001.012839. [DOI] [PMC free article] [PubMed] [Google Scholar]
- Woolf CJ. Dissecting out mechanisms responsible for peripheral neuropathic pain: implications for diagnosis and therapy. Life Sci. 2004;74:2605–2610. doi: 10.1016/j.lfs.2004.01.003. [DOI] [PubMed] [Google Scholar]
- Yusaf SP, Goodman J, Gonzalez IM, Bramwell S, Pinnock RD, Dixon AK, Lee K. Streptozocin-induced neuropathy is associated with altered expression of voltage-gated calcium channel subunit mRNAs in rat dorsal root ganglion neurones. Biochem Biophys Res Commun. 2001;289:402–406. doi: 10.1006/bbrc.2001.5943. [DOI] [PubMed] [Google Scholar]
- Zhong X, Liu JR, Kyle JW, Hanck DA, Agnew WS. A profile of alternative RNA splicing and transcript variation of CACNA1H, a human T-channel gene candidate for idiopathic generalized epilepsies. Hum Mol Genet. 2006;15:1497–1512. doi: 10.1093/hmg/ddl068. [DOI] [PubMed] [Google Scholar]