

Abstract
The neurons of many basal ganglia nuclei, including the external and internal globus pallidus (GPe and GPi, respectively) and the substantia nigra pars reticulata (SNr) are characterized by their high-frequency (50–100 spikes/s) tonic discharge (HFD). However, the high firing rate of GPe neurons is interrupted by long pauses. We studied the extracellularly recorded spiking activity of 212 well-isolated HFD GPe and 52 GPi/SNr neurons from five monkeys during different states of behavioral activity. An algorithm that maximizes the surprise function was used to detect pauses and pauser cells (“pausers”). Only 6% of the GPi/SNr neurons versus as many as 56% of the GPe neurons were classified as pausers. The GPe average pause duration equals 0.62 s. The interpause intervals follow a Poissonian distribution with a frequency of 13 pauses/minute. No linear relationship was found between pause parameters (duration or frequency) and the firing rate of the cell. Pauses were preceded by various changes in firing rate but not dominantly by a decrease. The average amplitude and duration of the spike waveform was modulated only after the pause but not before it. Pauses of pairs of cells that were recorded simultaneously were not correlated. The probability of GPe cells to pause spontaneously was extremely variable among monkeys (30–90%) and inversely related to the degree of the monkey's motor activity. These findings suggest that spontaneous GPe pauses are related to low-arousal periods and are generated by a process that is independent of the discharge properties of the cells.
Keywords: primate, basal ganglia, firing pattern, correlation, spikes, arousal
Introduction
The globus pallidus (GP), one of the major nuclei of the basal ganglia, consists of two parts: an external segment (GPe) and an internal segment (GPi) (Gerfen, 2004; Haber and Gdowski, 2004). Traditional models of the basal ganglia networks emphasized their role in the control of motor activity (DeLong, 1971; Mink and Thach, 1987; Turner and Anderson, 1997) and considered the GPe to be a relay station along the indirect pathway connecting input and output structures of the basal ganglia (Albin et al., 1989). More recent studies have shown that the basal ganglia are involved in limbic and associative processes as well as in motor computation and view the GPe as a central component of this neural network (Bolam et al., 2000; Arkadir et al., 2004; Levesque and Parent, 2005; Turner and Anderson, 2005; Nadjar et al., 2006).
An early electrophysiological study (DeLong, 1971) of the primate GPe classified its neurons into two types: most (85%) exhibiting a high-frequency discharge (HFD) of action potentials (spikes) and the remaining 15% exhibiting a low-frequency discharge and bursts. The high-frequency discharge of almost all (95%) the GPe HFD neurons was found to be interrupted by long intervals of total silence or pauses; hence, their name, “pausers”. The presence of pauses is considered to be a basic characteristic of the GPe and an identifying feature of this nucleus in electrophysiological recordings (Arkadir et al., 2004; Galvan et al., 2005). However, pauses have been found mainly in the GPe of normal awake primates. Recordings of GPe activity in primate models of Parkinson's disease reveal abnormal bursting activity (Boraud et al., 1998; Heimer et al., 2002), in which “bursts split the long pauses” (Filion, 1979; Filion and Tremblay, 1991). In addition, pauses have been described rarely in intracellular studies of pallidal neurons in vitro in normal conditions (Nambu and Llinas, 1994; Cooper and Stanford, 2000; Stanford, 2003; Chan et al., 2004) (but see Hashimoto and Kita, 2006) or in the in vivo studies of the anesthetized rodent (Kita and Kitai, 1991). These findings suggest that pauses are present and play a role primarily in the behaving animal.
Although considered an identifying physiological characteristic of the GPe, the statistics of the pauses and their contiguous spiking activity have never been explored quantitatively in behaving animals. Thus, the general aims of this study are: (1) to find objective criteria for defining pausers and detecting pauses in the GPe and other basal ganglia neurons; (2) to characterize the pause-generating process and to evaluate it as an intrinsic or synaptically driven event; and (3) to elucidate the relationships between pauses and behavioral states. We therefore analyzed long (mean, 32 min) recordings of the activity of 212 GPe neurons from five monkeys. To avoid spike misclassification errors, which are particularly crucial in extracellular studies of pauses, we developed objective criteria to assess the isolation quality of extracellular spikes. Only neurons that fulfilled these criteria were included in this study. Our neural data contained recordings during behaving as well as nonbehaving (idle) periods, enabling us to examine the effects of behavioral state and arousal on pauses.
Materials and Methods
Neuronal and behavioral recording procedures.
The experiments were performed on two vervet monkeys (monkeys S and Cu, Cercopithecus aethiops aethiops, female; weight, 3.5–4 kg) and three Macaca fascicularis monkeys (monkey Y, male, weighing 5 kg; monkey Cl, female, weighing 2 kg; monkey P, female, weighing 3 kg). Monkeys S and Cu were trained to perform a self-initiated button-pressing task to obtain a liquid reward (Goldberg et al., 2002). However, most of the recordings in Monkey Cu were conducted during a “quiet-wakeful” state. Monkeys Y and Cl performed a self-initiated probabilistic delayed visual-motor task (Arkadir et al., 2004; Morris et al., 2004). Monkey P was not engaged in any behavioral task and was trained only to sit quietly in the primate chair.
After training, a recording chamber was attached to the monkeys' skulls. The recording chamber was tilted 40–50° laterally in the coronal plane and was targeted by a stereotaxic device to cover most of the GPe territory (Contreras et al., 1981; Szabo and Cowan, 1984; Martin and Bowden, 2000). The exact position of the chamber was established using a magnetic resonance imaging (MRI) scan and electrophysiological mapping. Details of the surgery and data-recording methods are given previously (Goldberg et al., 2002; Heimer et al., 2002; Arkadir et al., 2004; Morris et al., 2004). The monkeys' care and surgical procedures were in accordance with the NIH Guide for the Care and Use of Laboratory Animals and the Hebrew University Guidelines for the Use and Care of Laboratory Animals in Research, supervised by the Institutional Committee for Animal Care and Use.
GPe neurons were identified according to the stereotaxic coordinates (based on the MRI and the primate atlas data) and their real-time physiological identification. These physiological parameters included the characteristic symmetric, narrow and high amplitude spike shape, and typical firing rate (DeLong, 1971) as well as the neuronal activity of the striatum obtained above in the same electrode trajectory. Pallidal cells that could not be classified with certainty as part of the GPe during the recordings were considered to be GPe cells only if their depth was <2 mm (monkeys S, Cu, and P) and 2.5 mm (monkeys Y and Cl) from the first pallidal cell encountered by the electrode.
Cells were also recorded from the output structures of the basal ganglia: the GPi (in monkeys Cu and P) and the substantia nigra pars reticulata (SNr) (in monkey P). Neurons of both structures were identified according to their stereotaxic coordinates (based on the MRI and the primate atlas data) and real-time physiological data. For GPi neurons, the criteria were the depth of the electrode (depths from the first pallidal unit were 2.5 ± 0.8 mm in monkey Cu and 3.13 ± 0.87 mm in monkey P), the physiological identification of border cells between the GPe and the GPi (DeLong, 1971), and the real-time assessment of the firing pattern of the cell. SNr neurons were identified according to the following criteria: the electrophysiological characteristics (narrow spike shape and high firing rate) of the cells (DeLong et al., 1983; Schultz, 1986) and the firing characteristics of neighboring neurons and fibers (e.g., fibers of the internal capsule, SN pars-compacta dopaminergic neurons, and fibers of the oculomotor nerve).
Monkeys S, Cu, and P were systematically treated with 1-methyl-4-phenyl-1,2,3,6-tetra-hydropyridine (MPTP) after the recordings in the normal state. The MPTP data are not included in this report. After the last recording session, monkeys S, Cu, and P were killed with a lethal dose of phenobarbitol and perfused through the heart with saline followed by a 4% paraformaldehyde solution.
Isolation quality analysis of extracellularly recorded spikes.
The output of the electrodes was amplified (×10,000), bandpass filtered within the range of 300–6000 Hz, and fed to a template-matching device (MSD, Alpha-Omega, Nazareth, Israel) to isolate the spiking activity of single neurons. Briefly, the amplified signal was continuously sampled and placed in a buffer containing the last 100 samples (2 ms). The buffer was compared continuously with one to three templates. Each template was constructed of eight equally spaced points and was defined by the user following a learning process of threshold-crossing signals. The sum of squares of the differences between the buffer points and the templates was calculated. When this sum reached a minimum that was below a user-defined threshold, detection was hardware reported. The real-time sorting was continuously (every 2–4 min) monitored, adjusted (template shapes, detection threshold), and graded by human experts. In almost all recording sessions, two experimenters were responsible for the real time sorting of the output of the six to eight electrodes.
The timing of the detected spikes and behavioral events was sampled at 12 kHz in parallel with the continuous sampling at 24 kHz (MCP+, AlphaMap; Alpha-Omega) of the amplified (×5000), bandpass filtered electrode output, within the range of 1–6000 Hz (in monkey Cu, 300–6000 Hz).
Only neurons that were considered to be well isolated during recording were subjected to off-line quality analysis. The quality analysis included the testing of rate stability, refractory period, waveform isolation quality, minimal firing rate, and recording time.
Rate stability criterion.
The firing rate was stationary, and no significant trends or transients were seen in the data (Tuckwell, 1998). The firing rates were plotted as a function of time using 50 ms bins and smoothed with a Gaussian sliding bin of σ = 500 ms. One of the experimenters inspected all rate functions and selected the longest stable recording period for each cell.
Refractory period criterion.
The interspike-interval (ISI) histogram displayed a refractory period (see examples in Fig. 4a,b, insets), indicating that the cell was well isolated (Fee et al., 1996). The database was exclusively made up of cells in which <1.5% of the total intervals were shorter than 2 ms.
Figure 4.

ISI histograms, autocorrelograms, and IPI histograms of nonpausers and pausers. Each row depicts sample data from one monkey. a, ISI histograms (hist.) and autocorrelograms (autocorr.) of nonpauser GPe cells (examples of the corresponding spike waveforms and isolation scores are shown on the left). The y-axis of the ISI histograms is truncated for better examination of long intervals. The inset includes higher time resolution of the ISI histograms, which demonstrates a refractory period. b, ISI histograms (hist.) and autocorrelograms (autocorr.) of pauser cells (examples of the corresponding spike waveforms and isolation scores are shown on the left). Axis and conventions are as in a. c, First column, IPI histograms (hist.) of the same pausers shown in b. Bin size, 1 s. Second column, Log function of the IPI histograms shown on the left. The line shows a linear fit of the data, whereas the goodness of fit is given in the inset. Third column, Histograms of the pooled R2 values of the linear regression for all GPe cells with at least 200 pauses. Cells with >350 pauses are shown as black bars. In all cases, the R2 values are significantly greater than zero (p < 0.01), indicating that the pause distribution over time follows a Poissonian distribution.
Waveform isolation criteria.
To further assess the isolation quality of the cells in the database, we developed an isolation score. This score quantifies on a zero-to-one scale the validity of our on-line attribution of extracellular waveforms to single cells. Briefly, waveforms from a given electrode were divided into two clusters: a spike cluster and a noise cluster. The spike cluster was constructed by extracting 1.5 ms voltage segments from the analog trace according to the time stamps of the spike detections that were attributed on-line to a specific cell. The noise cluster contained waveforms that crossed an amplitude threshold but were not included in the spike cluster. We defined the distance between a waveform (X) in the spike cluster to another waveform (Y) (from the spike cluster or the noise cluster) as the Euclidean distance between these voltage vectors. This distance was normalized by a gain constant (10 in this study) and by the average Euclidian distance between two waveforms in the spike cluster and then was transformed by the softmax function. The confidence that a waveform (X) belonged to the spike cluster was estimated by summing the distances between this waveform (X) and all other waveforms in the spike cluster. The isolation score is defined as the mean confidence value of the waveforms in the spike cluster and represents the mean probability that a waveform from the spike cluster belongs to this cluster. Only units with an isolation score higher than 0.8 were used here for additional analysis.
Recording duration and firing rate criteria.
The analysis database included only stationary and well isolated (as defined by the refractory period and waveform isolation criteria) segments that had been recorded for at least 10 min. Finally, only units with an average firing rate exceeding 20 spikes per second were included. This latter criterion was added to exclude GPe units with low-frequency discharge and bursts (DeLong, 1971).
The longest continuous time segment (a single segment per neuron) that fulfilled all the quality criteria was included in the neuronal database (Table 1).
Table 1.
The GPe neuronal database
| Monkey S | Monkey Cu | Monkey Y | Monkey Cl | Monkey P | Total | |
|---|---|---|---|---|---|---|
| Total number of cells | 57 | 70 | 24 | 25 | 36 | 212 |
| Firing rates of cells (spikes/second) (mean ± STD) | 48.85 ± 17.73 | 60.36 ± 15.44 | 57.16 ± 22.06 | 54.55 ± 21.08 | 54.51 ± 15.29 | 55.23 ± 18.00 |
| Stable recording time (minutes) (mean ± STD) | 38.85 ± 20.85 | 32.06 ± 12.27 | 46.89 ± 18.10 | 28.80 ± 13.78 | 13.19 ± 3.04 | 31.98 ± 17.97 |
| Number of recorded spikes/cell (mean ± STD) | 120,630 ± 95,170 | 118,650 ± 60,803 | 156,090 ± 77,880 | 93,555 ± 61,924 | 43,379 ± 16,362 | 107,680 ± 76,390 |
| Percentage of ISIs ≤2 ms of total ISIs | 0.14 ± 0.27 | 0.21 ± 0.35 | 0.22 ± 0.38 | 0.13 ± 0.21 | 0.33 ± 0.37 | 0.2 ± 0.33 |
| Spike S/N ratio | 3.63 ± 2.13 | 3.1 ± 0.91 | 2.55 ± 1.08 | 3.34 ± 2.26 | 4.1 ± 1.71 | 3.38 ± 1.7 |
Mean and STD were calculated separately for each monkey. The total column was calculated by taking the value of each neuron as one entry. The noise in the spike signal to noise (S/N) ratio was defined as 5 × SD of background activity to comply with the peak-to-peak definition of the signal.
Identification of pauses.
We compared four definitions of pauses (Fig. 1): (1) ISIs longer than 300 ms; (2) ISIs longer than 500 ms (DeLong, 1971); (3) ISIs that were 25 times larger than the median interspike interval of the cell (e.g., for a cell with a median interval of 10 ms, pauses were defined as ISI ≥250 ms); and (4) segments with zero or an extremely low firing rate that were detected by maximizing a Poisson pause surprise function (see details below).
Figure 1.

Examples of different methods for detecting pauses. The different methods are depicted on the same raster plot segment (manual pause grading, 4) (Fig. 2c). Each raster shows 20 consecutive (from top to bottom and from left to right) 10 s segments. Detected pauses are indicated by the top lines. a, A pause is defined as a spike-free interval longer than 300 ms. b, A pause is defined as a spike-free interval longer than 500 ms. c, A pause is defined as an interval 25 times longer than the median ISI (16.97 ms; pause definition, 424.25 ms). d, A pause is defined as a segment that maximizes the surprise function. An example of the raw analog data of a given 10 s segment (marked by an asterisk) appears beneath the raster plot. The last row contains a magnified 2 s segment from the 10 s analog segment above. Examples of spike waveforms with their corresponding isolation scores (range, 0–1) are shown next to the analog segment. The spike plot includes 100 superimposed waveforms of 1.5 ms, equally spaced and randomly selected from the whole recording period of the cell.
The pause surprise method uses principles similar to the surprise burst-detection algorithm (Legendy and Salcman, 1985). The method used here is based on an evaluation of how improbable it is that a certain number of spikes or less appear in a time segment of a spike train with a known average firing rate (e.g., the probability of finding a segment of 500 ms with one or zero spikes in a spike train of a neuron with an average discharge rate of 70 spikes/s). Those segments containing a small number of spikes, the probability of which, given the average firing rate of the cell, is significantly low, are considered to be pauses. In the extreme case, these segments do not contain any spikes (aside from the spike that begins or ends the pause) as in the absolute (300 or 500 ms) definition of the pause. However, the program can overcome errors that may be caused by single or few spikes (as a result of either accidental firing during a pause or false positive errors in the detection algorithm) that might spilt a single long pause.
The program begins by detection of ISIs longer than a certain length (the “core interval”) in the spike train. Then, the program tests whether adding an additional interval before or after the core interval increases the Poisson surprise value (S) of the pause, which is calculated by the following: S = −logP(n), where P(n) is the probability of finding n spikes or less in an interval of T ms (in the case of adding one interval, n = 2, and T equals the original plus the added ISI). This probability is based on a Poissonian distribution with a mean value of rT, where r is the probability of emitting a spike in a 1 ms bin and is calculated from the mean firing rate of the cell as follows:
If the Poisson surprise value increases, the interval is added to the core interval and included in the pause. The process of adding an interval to maximize the surprise value is limited by the “upper limit of added intervals” from each side of the core interval. Only final segments having a certain length (“minimal length of the final pause”) are considered as pauses. Finally, our algorithm merges two adjacent pauses into one continuous pause if they are separated by a certain number, or less, of spikes (“maximal number of spikes enabling merging of pauses”).
In summary, the variables that can be manipulated by the experimenter in the pause surprise algorithm are: (1) the length of the core interval; (2) the upper limit of added intervals; (3) the minimal length of the final pause; and (4) the maximal number of spikes enabling merging of pauses. The core interval and the minimal length of the final pause can have a constant value or they can be determined according to the firing rate of the cell (e.g., a core interval that is 10 times the median ISI of the cell). Although the proportional method is more computationally attractive, we did not use this method so as to avoid possible biases in the data when studying the relationships between the firing rate parameters and pause parameters (see Fig. 6). We found that the following parameters yielded optimal (close to human decision) detection of pauses: core interval, 250 ms; upper limit of added interval, 5 (from each side of the core interval); minimal length of the final pause, 300 ms; maximal number of spikes enabling merging of pauses, 1 (aside from the spikes that began or ended the pause; e.g., two pauses separated by three spikes or less can be merged). The minimal length of pause (300 ms) corresponded to the mean onset of the second peak in the ISI histograms of the pausers, which displayed a bimodal distribution in their ISI histograms (mean, 354.16 ± 100.47 ms; n = 12). In our database (n = 39,471 pauses), the process of adding an interval to maximize the surprise value continued on average 0.34 times from each side of the core interval with a SD of 0.72; thus, the upper limit of added intervals was rarely reached (<0.5% of all cases).
Figure 6.

The relationships between the discharge parameters and the pause parameters of GPe pausers. a, Population analysis of the relationships between the mean corrected firing rate of cells and the pause parameters. Figures include data from 119 pausers of all monkeys (color coded; see inset). Each point represents a different cell. From top to bottom, The relationship between the mean corrected firing rate and the frequency of pauses; the relationship between the mean corrected firing rate and the mean pause duration; and the relationship between the mean corrected firing rate and the amount of time the cell was in a pause. b, An example of the relationships between discharge parameters and pause duration in a pauser of Monkey Cu. Each column presents a different parameter. First row, Examples of raw analog data of the examined pauser with markings of the pause, the IPI before and after the pause, and the 500 ms segments used for calculating the firing rate before and after the pause. Second row, Scatter diagrams of the relationship between the IPI and the duration of the following pause (left plot), the relationship between the firing rate and the duration of the following pause (second plot); the relationship between the IPI and the duration of the preceding pause (third plot); and the relationship between the firing rate and the duration of the preceding pause (right plot). Third row, Histograms of the R2 values of the linear regressions for all GPe pausers. The histograms include data from all of the monkeys (n = 119 GPe pausers). All R2 values are not significantly different from zero; thus, no linear relationship was found between any of the examined parameters and the duration of the pause.
All four methods for pause detection were assessed visually by marking the detected pauses on raster plots, as shown in Figure 1. The fourth method (“surprise method”) seemed to be the best method because of its ability to disregard single sporadic spikes in relatively long intervals, and hence is the one used in this manuscript. However, we compared the outcomes of the four pause analysis methods to control for differences. Most of our results were not significantly affected by the method used for detecting pauses (data not shown).
Identification of pauser cells.
The next step was to develop objective criteria for the definition of pausers. As in previous studies, pausers were first detected by a human expert. S.E. screened the raster displays of all recorded GPe neurons and graded each of the neurons according to its subjective definition as pauser. The range of the scaling was 1–5, with 5 representing an “ideal pauser” and 1 representing a unit that was not considered to be a pauser. The visual grading of the cells was verified by one of the other authors. Examples of graded cells are shown in Figure 2. The distribution of neuron grading in our database is shown in Figure 3a. We considered cells that were graded 4 or 5 as real pausers and compared the results of several automated methods (see below) to this “gold standard.”
Figure 2.

Raster plots of four GPe neurons with different degrees of pause activity. Each raster plot contains 200 s of continuous data. Each vertical line represents a spike. The time course of the raster plots is from left to right and from top to bottom. Each neuron was graded manually from 1 to 5, where 1 is a neuron that looks least like a pauser and 5 is a neuron that looks most like a pauser. Examples of the raw analog data appear beneath each raster plot (top, 10 s segment of the line marked by an asterisk; bottom, 2 s segment from the segment above). Examples of 100 equally spaced spike waveforms with their corresponding isolation scores (IS) (range, 0–1) are shown next to each analog segment.
Figure 3.

Grading and automatic methods for defining a pauser. a, Distribution of manual grading of pause activity of the cells by manual assessment. The cells were graded from 1 to 5 by observing their raster plots. Cells that were graded 4 or 5 were considered to be pausers. Gray levels code for different monkeys. b, ROCs of different methods for detecting pausers. The ROC was plotted by using the manual grading (1–3, nonpauser; 4–5, pauser) as a gold standard. Each curve represents a different method for defining pausers, and each point represents a different threshold. The ROC was calculated on the pooled 212 cells from all monkeys. From right to left, A random test for defining pausers (used as a control method); the skewness of the ISI histogram; the variance to mean ratio of the ISI distribution (coefficient of dispersion); and the percentage of minutes that contain at least two pauses detected by maximizing the surprise function. An arrow marks the threshold (80%) chosen for detecting pausers according to the surprise method.
We examined several methods for automated detection of pausers: (1) the skewness of the ISI histogram. Pausers are expected to have higher skewness values than nonpausers (Schonewille et al., 2006); (2) the coefficient of dispersion (CD; the variance to the mean ratio of the ISI distribution), which is a measure of aggregation of spikes (Cocatre-Zilgien and Delcomyn, 1992). A CD equal to 0 indicates a uniform distribution, whereas a CD equal to 1 is found in a Poissonian distribution. GP cells tend to have low CD values because of the combination of their high basal firing rate and the refractory period. However, pausers are expected to have higher CD values than nonpausers; (3) the fraction of minutes, out of the recording time of the cell, in which at least two pauses were detected (by the surprise maximization algorithm; see above). This threshold of two pauses per minute was selected based on our assessment of the raster displays and is in line with a previous report of pauser activity (DeLong, 1971) that indicated an average pause rate of nine per minute and a range of 1–10 per minute.
All of the neurons in the database were pooled and scored according to each of the three automated pauser detection methods described above. As a control method, we added a random test in which each cell had a 0.5 probability of being identified as a pauser regardless of its firing pattern. The results were plotted on a receiver operating characteristic (ROC) curve (Fig. 3b), which is used to compare different tests over a spectrum of different threshold values for each test (Green and Swets, 1966) to the visual-grading (“gold-standard”) score. In the ROC curve, the sensitivity (true positive rate) of a specific threshold is plotted against the “1-specificity” value (false-positive rate). The different thresholds for plotting the ROC curve were determined by the scores of each cell in our database for each of the automated pauser detection methods. The ROC analysis indicates that the best criterion for defining a cell as a pauser is the percentage of minutes in which there are at least two pauses. We therefore used this criterion for our definition of pausers in this manuscript. We used a threshold of 80% (i.e., at least 80% of the 1 min bins of the recording contain at least two pauses) to define a pauser. The yield of this threshold was a sensitivity (correct hit; e.g., a cell that was graded 4–5 by visual examination would be automatically identified as a pauser) of 0.9 and a specificity (correct rejection; e.g., a cell that was graded 1–3 by the visual examination would not be identified as a pauser) of 0.79. We used the automated method rather than the human grading of pausers to avoid any systemic bias in our results. The automated method is based on objective criteria and preserves similar discrimination to our visual-grading assessment.
Statistical analysis of the temporal profile of pauses.
The mean firing rate of pausers was calculated in two ways: (1) the total number of spikes divided by the total recording time (“uncorrected firing rate”), and (2) the total number of spikes in the nonpause segments divided by the total recording time of the nonpause segments (“corrected firing rate”).
An ISI histogram was calculated for each neuron in several bin sizes (1, 10, and 50 ms). The interpause interval (IPI) was defined as the duration between the end of a pause and the beginning of the following pause. We used an additional definition of the IPI as the duration between the beginning of a pause and the beginning of the next pause. An IPI histogram based on both of these definitions was calculated in a bin size of 1 s. Only pausers with at least 200 pauses were used for calculating the IPI histograms. The fit of the IPI distribution to an exponential distribution was assessed by calculating the linear regression of the log of the IPI distribution (R2 values >0.7 were considered significant). To study the relationships between the firing rate around the pause and the pause duration, the firing rate was estimated by counting the number of spikes in 500 ms segments before and after the pause and normalizing these values to spikes per second. For a more detailed evaluation of the temporal changes in firing rate around the pause, we calculated peristimulus time histograms (PSTHs) in which the spikes of a pauser were aligned to the beginning and the end of the pauses of the cell. Significant changes in firing rate around the pause in the PSTH were assessed by comparing the firing rate in the 500 ms segment before the pause to the preceding 500 ms segment and by comparing the firing rate in the 500 ms after the pause to the following 500 ms segment (t test; p < 0.01).
To assess the change in the spike waveform before and after the pause, we calculated the peak-to-peak amplitude and duration of the spike waveforms along 500 ms segments before and after the pause. The amplitude and the duration of a spike waveform were defined as the distance between the maximal point to the minimal point of a spike (peak-to-peak) on the voltage axis (amplitude) or on the time axis (duration). After averaging the results from each pauser in 10 ms bins, we obtained histograms that describe the mean change of the amplitude and the duration of the waveforms of a single pauser before and after the pause. The baseline amplitude and duration of the spike waveform were estimated by calculating the mean and the variability of all histogram bins. The values in each histogram were expressed as changes (in percentages) of the baseline value, enabling us to calculate a mean histogram of all of the pausers. We considered a change in the spike waveform significant only if the bin value was different from the baseline value by at least 2.5 SDs (p < 0.01).
Synchronization of pauses of different cells was estimated by plotting a cross-correlogram in which the trigger was the onset of a pause of one cell and the reference was the onset of a pause of another cell. Only pairs of pausers with >50 pauses for each pauser, which were recorded simultaneously and fulfilled the isolation criteria for at least 600 s, were included. These correlograms were calculated in bins of 250 ms for ± 30 s offset. The correlograms were normalized to pauses per minute values. A cross-correlogram was considered to have a significant peak or trough only if there were at least three consecutive bins where the probability of obtaining each one was <0.01 under a Poissonian distribution with a pause rate equal to the baseline pause frequency. The baseline pause frequency was estimated by calculating the expected pause frequency using 10% of the bins from each edge of the correlogram.
Pause-to-spike correlations were calculated with ± 1000 ms offset, using 20 ms bins. Only pauser-neuron pairs with >50 pauses and 500 spikes, which were recorded simultaneously and fulfilled the isolation criteria for at least 300 s, were included. A cross-correlogram was considered to have a significant peak or trough only if there were at least three consecutive bins where the probability of obtaining each one was <0.01 under a Poissonian distribution with a spike rate equal to the baseline firing rate. The baseline expected firing rate was estimated by calculating the mean firing rate using 10% of the bins from each edge of the correlogram.
Assessment of behavioral activity.
The quantification of the level of behavioral activity during the recording sessions was based on calculating the number of behavioral events in 0.5 min segments for each of the recorded neurons.
The neuronal response to behavioral activity was estimated by generating raster plots and PSTHs of two kinds: (1) PSTHs in which pauses were aligned to behavioral events calculated in bins of 1 s and in a time frame of 10 s before the behavioral event and 20 s after; and (2) PSTHs in which spikes were aligned to behavioral events calculated in a time frame of 1 s before the behavioral event and 2 s after. Only cells that were recorded with at least 20 repetitions of at least one behavioral event were included in this analysis. The behavioral events included button pressing and reward delivery (monkeys S, Cu, Y, and Cl) as well as visual cues that represented different probabilities of future reward delivery (monkeys Y and Cl). A significant peak in the PSTH between pauses and behavioral events was defined as a bin value with p < 0.005 under a Poissonian distribution with a pause rate equal to the baseline pause frequency (the threshold for statistical significance was chosen based on our subjective assessment of significant peaks). The baseline pause frequency was estimated by calculating the expected pause frequency using 10% of the bins from each edge of the pause PSTH. “Behavioral pauses” were defined as pauses that appeared during a time frame of a significant peak in the pause PSTH in a range of 2 s before or after the behavioral event. If a significant peak was detected in a 1–2 s bin before or after the behavioral event, pauses in the adjacent 0–1 s bin were added to the behavioral pauses. The behavioral pauses of a single pauser from different behavioral events were pooled, and the remainder of the pauses was defined as “spontaneous pauses.” A “behavioral pauser” was defined as a pauser with at least 20 behavioral pauses.
Numerical simulation of pause activity.
To investigate the relationships between the shape of the autocorrelogram and the pause parameters, we analyzed autocorrelograms of simulated pausers. The neurons were modeled as a realization of a Poisson process with a constant firing probability (p) for each time bin (Δt) and an absolute (zero firing probability) refractory period with a length of τref bins. Pauses were generated as another Poisson process with a constant probability for initiating a pause (p′, p′≪p) for each time bin (Δt). The duration of the pause was derived from a normal distribution (μd, σd). The simulations in this manuscript were obtained by using the following values: p = 0.1; τref = 5 ms; Δt = 1 ms. We used three different values for p′: 0.000083333, 0.00016667, and 0.00025, which correspond to the typical values of 5, 10, and 15 pauses per minute (DeLong, 1971). We used three different values for the mean pause duration (μd): 300, 500, and 700 ms, with σd = 20 ms. These parameters yielded neurons with firing rates of 50–60 Hz. The length of the simulated spike trains was 106 bins = 1000 s, similar to the recording periods of our neurons (Table 1).
Results
The pauser database
Our neural data were composed of 212 HFD GPe neurons in five monkeys and 52 control GPi and SNr HFD neurons. The average recording time of the GPe neurons equals 31.98 min, yielding on average 107,680 spikes/neuron. Only very well-isolated neurons (isolation quality >0.8; stable firing rate) were included in the database. The mean signal-to-noise ratio of the GPe spikes in our database equals 3.38 (noise was defined as 5 × SD of background activity to comply with the peak-to-peak definition of the signal), and the average fraction of ISIs shorter than 2 ms out of the total ISIs equals 0.2%. Details of individual monkey data are given in Table 1. All examples of single neuron analyses in this manuscript are accompanied by a display of a 10 s segment of the raw data and/or high-resolution 100 superimposed spike waveforms randomly selected with approximate equal spacing from the whole recording segment.
Many (119; 56.13%) of the GPe-HFD neurons were classified as pausers by the pause surprise algorithm (for details, see Materials and Methods). For each of the monkeys, we calculated the mean pause duration, the pause frequency, and the mean IPI. A summary of these parameters appears in Table 2. Pausers do not have any specific spatial distribution in GPe and were found with equal frequency throughout the GPe volume explored in this study. Finally, we compared the firing rates of pausers and nonpauser GPe neurons (Table 3). No significant difference was found between the firing rate of the pauser group and the nonpauser group.
Table 2.
A summary of the quantitative parameters of pausers and their pauses (the pause database)
| Monkey | Number of detected pausers (% of GPe neurons) | Number of pauses/pauser (mean ± STD) | Duration of pause (seconds) (mean ± SEM) | Frequency of pauses (per minute) (mean ± SEM) | Interpause interval (seconds) (mean ± SEM) |
|---|---|---|---|---|---|
| Monkey S | 17 (29.82%) | 403.76 ± 16.79 | 0.57 ± 0.02 | 11.19 ± 1.48 | 6.57 ± 1.13 |
| Monkey Cu | 50 (71.43%) | 298.90 ± 4.09 | 0.70 ± 0.03 | 8.80 ± 0.66 | 7.63 ± 0.50 |
| Monkey Y | 12 (50%) | 473.25 ± 23.84 | 0.61 ± 0.06 | 9.33 ± 1.56 | 7.62 ± 1.12 |
| Monkey Cl | 8 (32.0%) | 391.63 ± 27.8 | 0.49 ± 0.04 | 12.86 ± 3.38 | 6.70 ± 1.61 |
| Monkey P | 32 (88.89%) | 276.56 ± 4.35 | 0.56 ± 0.02 | 21.30 ± 1.82 | 3.10 ± 0.37 |
| Total | 119 (56.13%) | 331.69 ± 20.16 | 0.62 ± 0.02 | 12.83 ± 0.81 | 6.19 ± 0.36 |
Mean and STD/SEM values were calculated separately for each monkey. The total row was calculated by taking the value of each neuron as one entry.
Table 3.
Firing rate of pausers and nonpauser GPe cells
| Monkey | Firing rate of pausers (spikes/s) (mean ± STD) | Corrected firing rate of pausersa (spikes/s) (mean ± STD) | Firing rate of nonpausers (spikes/s) (mean ± STD) |
|---|---|---|---|
| S | 47.82 ± 18.33 | 53.25 ± 18.41 | 49.31 ± 17.68 |
| Cu | 60.98 ± 15.06 | 67.48 ± 15.12 | 59.00 ± 16.66 |
| Y | 47.12 ± 13.88 | 51.59 ± 14.21 | 67.28 ± 24.62 |
| Cl | 38.59 ± 17.12 | 44.1 ± 21.5 | 62.09 ± 18.73 |
| P | 54.19 ± 15.51 | 68.41 ± 18.22 | 58.21 ± 13.05 |
| Total | 54.37 ± 16.89 | 62.52 ± 18.48 | 56.43 ± 19.33 |
aCorrected firing rates were calculated as the number of spikes in the nonpause segments divided by the recording time of the nonpause segments. None of the results of the pausers group was significant relative to the nonpausers group (Student's t test, p > 0.01).
We used the same methods to detect pausers in 52 well-isolated neurons of the output structures of the basal ganglia: the GPi and the SNr. We analyzed 34 cells from monkeys Cu and monkey P that were identified as GPi neurons and 18 cells from monkey P that were identified as SNr neurons. These neurons were recorded mostly in nonbehaving periods. Only three cells (5.77%; two GPi cells and one SNr cell) were identified as pausers by the automated pause surprise method. This is in line with the subjective judgment of a human expert (S.E.), who classified four GPi/SNr neurons as pausers. Only two GPi/SNr neurons were identified as pausers by both the pause surprise procedures and the human expert.
Defining and characterizing pallidal pauses raises the hypothesis that the firing pattern of pallidal HFD neurons also includes segments of bursting activity, which could represent another dynamical state similar to the pausing activity. We used the original Poisson-surprise method (Legendy and Salcman, 1985) (surprise threshold, 10; minimal number of intervals for defining a burst, 5) to detect bursts in pallidal cells of monkey P. Small bursts were detected during the high-frequency discharge periods, but their duration was much shorter than the pause duration (data not shown).
Basic phenomenology of pauses
The first-order statistics of the temporal pattern of firing of the pausers examined here is consistent with the qualitative description in previous reports (DeLong, 1971). The mean pause duration was equal to 0.62 ± 0.02 s (mean ± SEM; n = 39,471 pauses; see Table 2 for information on individual monkeys), which is significantly longer than the mean ISI of these neurons (18.39 ms) (Table 3). Nevertheless, pausers are usually characterized by a heavy-tailed ISI histogram (Fig. 4b). Only 10.08% (12 of 119) of the pausers displayed a clearly identifiable bimodal distribution in their ISI histogram (Fig. 4b, second and bottom rows). However, ISI bimodality may be underdetected by our recording settings (note that the average 30 min recording of a pauser with 10 pauses/minute yields only 300 pauses vs 100,000 ordinary ISIs on average).
Calculating the autocorrelograms of spiking activity of pausers on a large time scale (1000 ms and more) revealed a typical peak in the autocorrelogram with a moderate slope (Fig. 4b). To investigate the relationships between the shape of the autocorrelogram and the pause parameters, we analyzed autocorrelograms of simulated pausers (for details, see Materials and Methods). The autocorrelograms of the simulated pausers (Fig. 5) revealed the same broad peaks as the real data (Fig. 4b). The simulation also showed that an increase in pause frequency led to a higher peak in the autocorrelogram, whereas an increase in the mean pause duration resulted in broader peaks (Fig. 5).
Figure 5.

Autocorrelograms of simulated pausers. a, Raster plots of simulated pausers. From left to right, A neuron with a pause frequency of five pauses per minute and a mean duration (dur.) of 300 ms; a neuron with a pause frequency of 10 pauses per minute and a mean duration of 500 ms; a neuron with a pause frequency of 15 pauses per minute with a mean duration of 700 ms. b, A matrix of autocorrelograms of the simulated pausers. An increase in the mean duration of the pause results in broader peaks, whereas an increase in the pause frequency (freq.) increases the peak of the autocorrelogram. Ordinate, Normalized firing rate in spikes per second. Abscissa: bin size, 1 ms; range, ± 2 s. The t = 0 values were omitted from the autocorrelograms.
The mean pause frequency was 12.83/min (for details, see Table 2). The distribution of the IPI of pausers was calculated for 80 pausers with a large number (>200) of pauses (12, 30, 12, 6, and 20 pausers from monkey S, Cu, Y, Cl, and P, respectively). Most (64 of 80) of the pausers displayed an exponential distribution in the IPI histogram (Fig. 4c) as expected for a Poisson (random) process of pauses but not for processes governed by slow periodic oscillations (Goldberg et al., 2003; Hashimoto and Kita, 2006). Some of the cells had a low probability of pausing in the first seconds after a pause. However, this might be explained by our pause-detecting method, which merges neighboring pauses and therefore lowers the probability of finding two adjacent pauses. Similar results were obtained when the IPI was defined as the duration from the beginning of one pause to the beginning of the following one. However, as expected from this definition, the beginning of a pause was followed by a short period of low probability of pausing.
Relationships between discharge parameters and pauses
The long and high-quality recordings of GPe pausers enabled us to describe the relationships between pauses and discharge parameters of the cell and by that to test the null hypothesis that pauses are triggered by intrinsic processes of the pallidal cells. Such processes may include slow inactivation of inward currents or the augmentation of slow outward currents (e.g., as a result of the accumulation of intracellular calcium or the slow dynamics of the outward currents). Although we are unable to address directly the question of intrinsic versus network origin, a relationship between pause properties (e.g., its frequency and duration) and certain parameters of the neuronal discharge (e.g., the duration of the high-frequency burst that precedes the pause or the average discharge rate of the cells) would support an intrinsic source of pallidal pauses. Conversely, if the pauses are induced synaptically, their duration and frequency should probably not depend on the average firing rate of the cell or the time that has elapsed since the last pause. To avoid an a priori dependency across the tested parameters (e.g., an increase in the pause frequency and duration causes, by definition, a decrease in the firing rate of the cell), we calculated a corrected firing rate (in the IPIs) for each cell (Table 3). No significant linear relationship was found between the mean corrected firing rate of GPe pausers and the following three pause parameters: (1) the frequency of pauses, (2) the mean pause duration, and (3) the percentage of time the cell was in a pause (Fig. 6a). In addition, we specifically examined the relationships in each pauser between the temporal discharge parameters (IPI duration and IPI firing rate in the 500 ms segments flanking the pause) and pause duration (Fig. 6b). None of the cells exhibited any significant linear relationship between the firing rate or the IPI duration around the pause and the pause duration (Fig. 6b, bottom row).
Although the previous analysis enables us to rule out any linear correlation between the pause duration and the average firing rates, we may have neglected fast (<500 ms) changes in the firing rate both before and after the pause. To examine the changes in firing rates before and after the pause more closely, we calculated PSTHs in which the spikes of a pauser were aligned to the beginning and the end of its pauses (Fig. 7a). Pauses were found to be accompanied by various changes in firing rate (Fig. 7b). These changes tended to be symmetric (73 of 119 pausers) (e.g., a cell with an increased spike rate before the pause usually displayed an elevated firing rate after the pause). Only 36.13% (43 of 119) of the cells displayed a decrease in firing rate before the pause, as expected if pauses are triggered by an intrinsic reduction in excitability (such as slow inactivation of voltage-dependent channels or accumulation of intracellular ions).
Figure 7.
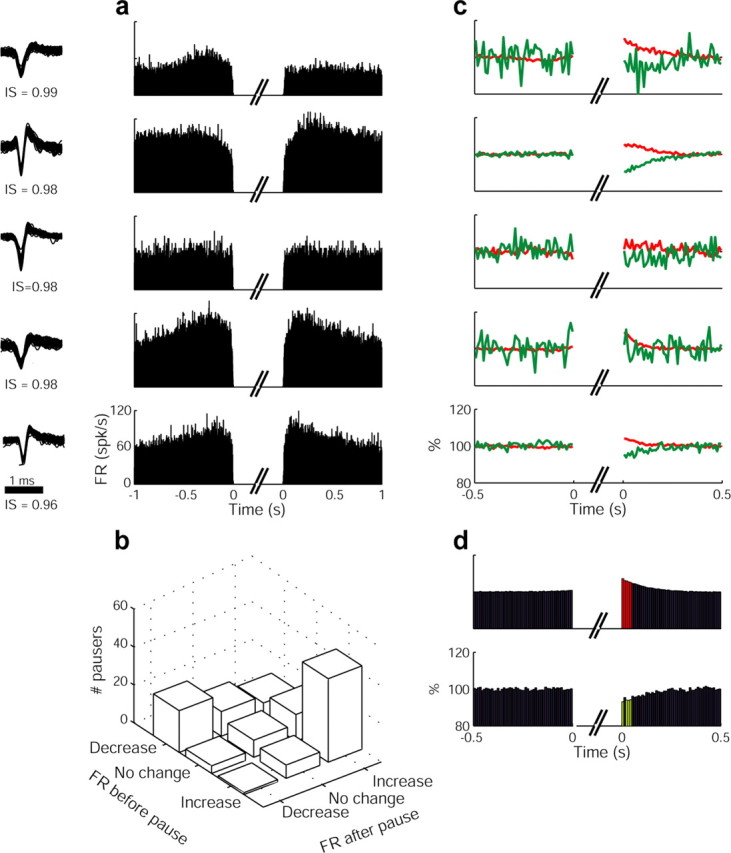
Temporal changes of firing rates and spike waveforms before and after the pause. a, Examples from five different cells (cell/monkey) of firing rate (FR) changes around the pause. Each row displays two PSTHs calculated for the same cell: the firing rate of the cell aligned to the pause onset (left) and to the pause offset (right). b, A summary of the distribution of changes in firing rate before and after the pause. The plot includes data from all of the monkeys (n = 119 GPe pausers). c, Examples of waveform changes around the pause (each example corresponds to the same pauser shown on the left). Red line, Amplitude of the spike; green line, duration of the spike. Data are calculated and averaged over 10 ms bins. d, The mean change of the spike waveform before and after the pause. The histograms include data from all of the monkeys (n = 119 GPe pausers). Top, Amplitude changes; bottom, duration changes; red, significant positive changes; green, significant negative changes; IS, isolation score.
In addition to discharge rate, the shape of the action potential (Matsumura et al., 1995; de Polavieja et al., 2005; Gold et al., 2006) is also thought to reflect intrinsic changes in neuronal excitability (e.g., availability of sodium channels). We used the peak-to-peak amplitude and duration of the recorded spikes to trace any changes in spike shape before and after the pause. Figure 7c depicts five examples of the normalized characteristics of these spike shape parameters. The average (Fig. 7d) amplitude and duration of the spike was not consistently modulated before the pause; however, after the pause, a clear increase in amplitude paralleled by decreased duration appeared and decayed exponentially over ∼100 ms. Thus, the waveform analysis is sensitive enough to reveal changes in the spike shape (hence, underscoring the reliability of this analysis), yet these changes were found only after the pause. These after-pause changes probably reflect a decrease in inactivation of the sodium conductance, leading to larger amplitude and briefer action potentials. In contrast, no changes were observed in the spike waveform before the pause, suggesting that the pauses are probably not triggered by intrinsic processes such as slow inactivation of sodium currents.
The biophysical dynamics of burst and bistability cellular phenomena have been studied at many different levels (Bertram et al., 1995; Izhikevich, 2000; Borisyuk and Rinzel, 2005). The lack of consistent changes in discharge rate before the pause rules out square-wave and parabolic but not elliptic bursting behavior. Simple dynamical models (Bertram et al., 1995) do not treat the spike shape; however, spike shape is expected to be correlated with changes in discharge rate. Our results, showing no significant decrease in discharge rate before and after the pause, but significant change in shape only after the pause, may be better understood in the future by implementing more complex biophysical models of GPe neurons that have many fast variables (Izhikevich, 2000; Terman et al., 2002).
Cross-correlation analysis of pauses
If GPe pauses are not triggered by an intrinsic cellular process, they may be generated by global changes in the extracellular medium (Stokes and Rinzel, 1993) or by synchronized inputs. The synchronized inputs may be GABAergic from the striatum (Chan et al., 2004; Rav-Acha et al., 2005) or glutamatergic from the subthalamic nucleus leading to a GPe population burst followed by afterhyperpolarization. We therefore tested whether the pauses of one GPe neuron were synchronized with pauses or spikes of other simultaneously recorded GPe cells (Fig. 8a). Almost all of the cross-correlograms (53 of 55; 96.36%) between the pauses of simultaneously recorded pairs of pausers were flat (Fig. 8b). Two pauser pairs were recorded by the same electrode, and neither of these pairs was correlated. In addition, we calculated cross-correlograms between the start of pauses of one cell and the spikes of other simultaneously recorded cells (Fig. 8c). Again, the vast majority of these pause-spike cross-correlograms (182 of 185, 98.38% different electrode pairs; 6 of 7, 85.71% same-electrode pairs) were flat. Similar results were obtained when the center of the pause was chosen as the trigger point instead of the beginning of the pause.
Figure 8.

Pauses of simultaneously recorded pallidal cells are not synchronized. a, Examples of raw simultaneous recordings from four electrodes (Monkey Cu). Isolation scores (IS) and 100 superimposed spike waveforms of 1.5 ms, equally spaced and randomly selected from the whole recording period of the cell are shown on the right. b, Pause-to-pause cross-correlograms. The cross-correlograms (bottom left triangle) show the pause frequency of a pauser aligned to the pause onset of another pauser. Abscissa, Lag shift in seconds (range, ± 30 s; bin size, 250 ms; no smoothing). Ordinate, Normalized pause frequency in pauses per minute. In the top right half, the ordinate is given in STD units around the mean. Both parts represent the correlations of the same neurons (mirror imaged). c, Pause-to-spike cross-correlograms between pairs of pallidal cells recorded simultaneously. The cross-correlograms show the firing rate of a cell aligned to the pause onset of a pauser. Columns represent different pausers as triggers. Abscissa, Lag shift in seconds (range, ± 1 s; bin size, 20 ms; no smoothing). Ordinate, Normalized firing rate in spikes per second (spk/s). The pause is seen in the diagonal, which displays the autocorrelograms of pausers in which the firing rate of the cell is aligned to the pause onset of the same cell.
Pause activity and behavior
Having arrived at the conclusion that pauses are probably not triggered by global changes in the extracellular medium or by synchronized driving inputs, we further considered the possibility that they might be triggered by more subtle neural network effects as can be seen during normal behavior. Previous studies (DeLong, 1971) of the GPe have indicated that most of the pauses cannot be unequivocally linked to behavioral events (e.g., instructional cues, limb movements, or reward licking movements). Nevertheless, many GPe neurons encode such events, and their high-frequency discharge enables them to encode them both by increases and decreases in their discharge rate (Turner and Anderson, 1997; Arkadir et al., 2004). Several (21 of 67; 31.34%) of our pausers that were recorded while the monkeys were engaged in a behavioral paradigm exhibited a “pause response” aligned with a behavioral event (Fig. 9a). The raster plots of the spikes of these neurons show that these cells tended to pause in most of the trials incorporating the behavioral trigger event (Fig. 9b). We can therefore divide the pauses of these neurons into behaviorally locked or spontaneous pauses and compare their characteristics (Fig. 9c). In most of these instances (14 of 21; 66.67%), the pause duration distribution of the behavioral pauses was very similar to that of the spontaneous pauses. In two pausers, a clear right-shift or bimodality was found in the pause duration distribution of the behavioral pauses compared with the spontaneous pauses (Fig. 9c, left column). In another five cells, differences between the duration distributions of the spontaneous versus the behaviorally locked pauses were noted but were less pronounced. Although the duration of the behavioral pauses could be modulated by the identity of the behavioral event (Arkadir et al., 2004), these data indicate that both spontaneous and behaviorally locked pauses are drawn from the same heavy-tailed ISI distribution and are probably generated by the same mechanisms.
Figure 9.
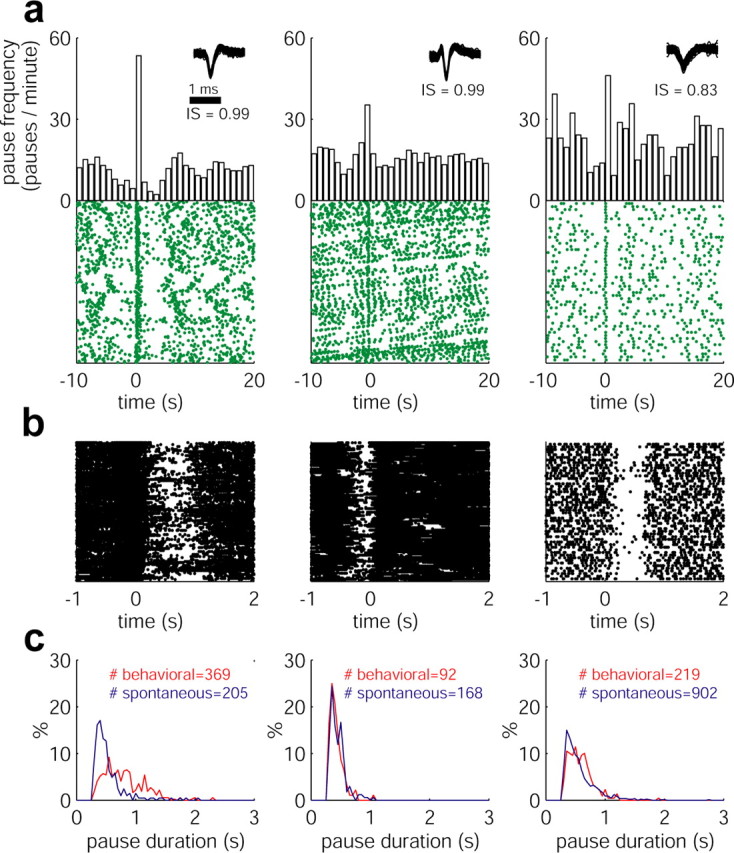
Examples of behaviorally locked pauses. a, Raster plots and PSTHs of pauses of different cells that depict behaviorally locked pauses. Each (green) point in the raster plots represents a pause. The raster plots were calculated on a long time scale (30 s). The raster plots are aligned to different behavioral events. From left to right, Reward delivery, Monkey S (278 trials); button press, Monkey S (232 trials); cue predicting a reward probability of 100%, Monkey Y (52 trials). IS, Isolation score. b, Short scale (3 s) raster plots of the spikes aligned to the same behavioral events as in a. The same number of trials is shown. c, Comparison between the duration of spontaneous pauses and behavioral pauses of each of the three cells. Behaviorally locked pauses were detected according to the significant peaks of the PSTH shown in a. Blue, Spontaneous pauses; red, behavioral pauses.
The behavior-pause correlation analysis described above suggests that at least some GPe pauses can be triggered by behavioral events and therefore probably by basal ganglia network activity. We therefore searched for context effects that could modulate the frequency and the duration of the spontaneous GPe pauses. In some of the GPe cells, the initiation of behavioral activity caused a clear decrease in the frequency and duration of the pauses (Fig. 10). To further examine the relationships between behavioral activity and pauses, we quantified, for each monkey, the number of behavioral events (button pressing and reward delivery) during the recording sessions. The percentage of pausers of the recorded GPe neurons varied considerably across the monkeys, ranging from 30 to 90%. This percentage was inversely correlated to motor activity and involvement in the behavioral task (Fig. 11a, left). The possible relationship between pauses and a nonbehaving state may seem to contradict the finding of behaviorally locked pauses (Fig. 9). However, the behaviorally locked pauses do not significantly affect the statistics of the spontaneous pauses, because the frequency of the behavioral events (triggered by the behavioral tasks) and therefore the frequency of the behaviorally locked pauses is smaller than that of the spontaneous pauses, and because in many cases a behaviorally locked pause response did not occur in every trial (Fig. 9). To avoid a possible masking effect of the behavioral pausers on the spontaneous pausers (i.e., pausers without behaviorally locked pauses), we analyzed the latter group separately. We calculated the percentage of spontaneous pausers from the total GPe population for each monkey. The inverse relationship between the motor activity in the behavioral task and the percentage of spontaneous pausers is obvious (Fig. 11a, right). We further used this population of 98 “pure” spontaneous pausers to evaluate the dynamic relationships of behavioral activity and the pause phenomenon. We divided the data into 0.5 min segments and counted the number of behavioral events, the number of pauses, and their mean duration in each of the segments. The scatter plots (Fig. 11b) show that the frequency of pauses as well as their duration tended to be greater in segments of recording corresponding to periods in which the animal did not perform the behavioral task (Schonewille et al., 2006). Similar results were obtained with 1 min segments.
Figure 10.
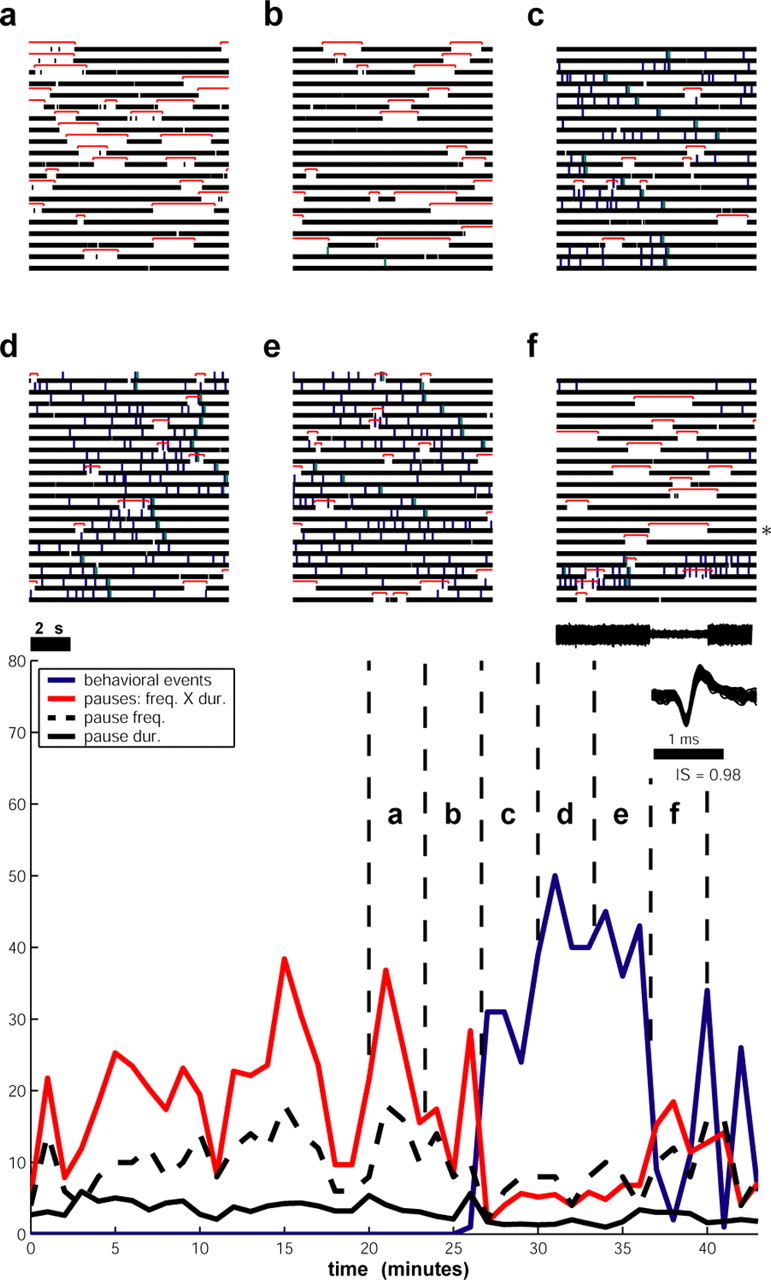
An example of a pauser demonstrating a decrease in pause frequency (freq.) and duration (dur.) during a period of behavioral activity. a–f, Continuous raster plots (cell from Monkey Cu). Each raster plot contains 200 s of continuous data. Pauses are indicated by the top red lines. Behavioral events are indicated by rectangles above the spikes (blue, button pressing; green, reward delivery). The time course is from left to right and from top to bottom, and each block spans 200 s. The bottom figure depicts the relationships between behavioral events (blue) and pauses (red) in the same cell over time. Markings were added to time segments that correspond to the raster plots given above. The recorded data were binned to 60 s segments. The behavioral activity was evaluated by counting the number of behavioral events in each bin. The pause activity was evaluated by multiplying the number of pauses and the mean pause duration in each bin; both of these variables are also shown separately with black solid (mean pause duration) and dashed (mean pause frequency) lines. Note that the mean pause duration could be <1 s, and therefore the multiplication result (red line) does not necessarily surpass its separate components (black lines).
Figure 11.

Population analysis of the relationships between pauses and behavioral activity. a, Bar histograms of the fraction of pausers, which were detected in each monkey (black columns) along with a quantitative measure of the behavioral (bhv.) activity in the same monkey (white columns). The behavioral activity was evaluated by calculating the median number of behavioral events in 0.5 min segments. Note that in monkeys Cu and P, in which the highest percentage of pausers was found, the median number of behavioral events was zero. The left histogram includes data from all of the monkeys (n = 212 cells; 119 pausers); the right histogram includes only pausers that were not found to have behaviorally locked pauses (n = 191 cells; 98 spontaneous pausers). b, Scatter diagrams of the relationships between the number of behavioral events in 0.5 min segments and the number of pauses (top) or the mean duration of the pause in these segments (bottom). Frequent and especially longer pauses tended to appear in segments in which the number of behavioral events was zero. The diagram includes the pooled data of the five monkeys excluding pausers that were found to have behaviorally locked pauses (n = 98 GPe spontaneous pausers).
Discussion
We studied the activity of 212 well-isolated HFD neurons of the primate GPe and applied quantitative criteria to assess their isolation quality and pause definition. Compared with the early descriptions (DeLong, 1971), we report a smaller but highly variable (30–90% among monkeys) percentage of pausers from the total number of recorded GPe-HFD neurons per monkey.
Pausers are usually found in the GPe and not in the output nuclei of the basal ganglia
Spontaneous pauses are considered to be a typical property of the GPe, whereas the neurons of the GPi and the SNr, which share many morphological, physiological, and biochemical characteristics with GPe neurons are reported to discharge at similar rates but without these spontaneous pauses (DeLong, 1971). Our results support this description, as only 5.8% of the neurons in the GPi and the SNr were defined as pausers by our automatic method. Most GPi/SNr neurons were recorded in nonbehaving periods (in which the percentage of GPe pausers tends to be higher), further supporting the notion of spontaneous pauses as a hallmark of GPe activity. Nevertheless, the small percentage of GPe pausers in some of the monkeys, especially the monkeys that were engaged in a behavioral task, could have made it difficult to differentiate the GPe and the GPi merely in terms of firing pattern characteristics. The presence of pauses mainly in the GPe and not in the output structures of the basal ganglia might be related to the higher presence of “complex endings” and “thin processes” in the GPe dendrites compared with the GPi (Francois et al., 1984) or to the different degrees of internuclei axonal collateralization in these structures (Wu et al., 2000) or alternatively to the different afferent connectivity of these nuclei..
Do the pauses have an intrinsic origin?
One main question addressed in this study was whether the spontaneous pauses of GPe neurons are triggered by intrinsic or neural-network processes. Our null hypothesis was that spontaneous pauses are a result of intrinsic properties of the high-frequency discharging GPe cells, slow global changes in the extracellular medium, or synchronized inputs to the GPe. Certain predicted traits of GPe discharge would support this hypothesis: (1) a decreased firing rate and spike amplitude before the pause, (2) a linear relationship between the discharge intensity and pause duration, (3) correlations in the timing of pauses of different neurons, and (4) different characteristics of spontaneous versus behaviorally triggered pauses. Our failure to confirm any of these predictions and the lack of pauses in intracellular studies of GPe cells in normal conditions (Kita and Kitai, 1991; Nambu and Llinas, 1994; Cooper and Stanford, 2000; Chan et al., 2004; Rav-Acha et al., 2005) may suggest that pauses are triggered by the unsynchronized network activity of the basal ganglia circuitry. It is also possible that this network activity interacts with certain membrane properties and states of the cell. Our data do not enable us to address such compelling questions as whether the GPe pauses represent a bistable membrane phenomenon with ultrafast dynamics of channel gating, or which mechanisms are involved in their termination (Coombes and Bressloff, 2005; Loewenstein et al., 2005; Hashimoto and Kita, 2006; Schonewille et al., 2006; Izhikevich, 2007).
Relationship to behavioral events
Our results imply that a larger percentage of pausers with longer pause durations can be detected in a nonbehavioral state (Fig. 11). This finding can help account for the discrepancies between different qualitative descriptions of the firing pattern of GPe neurons hinted at in previous studies. DeLong's (1971) early description was obtained during “periods of rest,” and a similar proportion of pausers was reported while recording in a “quiet waking state” (Filion, 1979) and during “spontaneous activity” in which the monkey was not engaged in a behavioral task (DeLong et al., 1985). In contrast, other studies conducted while monkeys were engaged in a behavioral paradigm have reported shorter durations (Anderson, 1977) as well as smaller percentages of pauses and pausers (Georgopoulos et al., 1983). The examples of behavioral pauses (Fig. 9) shown in this paper could suggest that pauses have a more complex interaction with behavioral events than described above. It is possible that the GPe behaviorally locked pauses are created by selective modulation (resetting) of the timing of spontaneous pauses.
What is the source and significance of the pallidal pauses?
If pallidal pauses are indeed triggered by network activity, the next step is to identify a network pause-generator. Pallidal pauses may be related to one of the following network sources: the subthalamic nucleus (STN) glutamatergic projection (Plenz and Kitai, 1999), the GABAergic striatal projections (Tremblay and Filion, 1989), or the GPe intranuclear GABAergic connections (Francois et al., 1984; Wu et al., 2000). STN inactivation (Nambu et al., 2000) as well as AMPA antagonist injections to the GPe (Kita et al., 2004) produce prominent and very long pauses in the GPe neurons. Thus, a reduction of STN tonic activity may be responsible for the pauses; however, physiological studies of STN activity in behaving primates have not found a suppression of firing rates with similar duration to the GPe pauses (Wichmann et al., 1994). The effect of GABAergic inhibition of pallidal neurons has been tested in several studies in which GABAA antagonists were injected into the GPe in awake monkeys and usually caused an increase in the firing rate with prominent pauses (Matsumura et al., 1995; Kita et al., 2004) (but see Galvan et al., 2005). Indeed, recent in vitro studies of striatopallidal GABAergic projections have reported that stimulation of the striatum caused the neurons of the GPe rodent homolog to pause and hence reset their autonomous firing (Chan et al., 2004; Rav-Acha et al., 2005). Thus, although at this stage it is impossible to identify a single trigger of the GPe pauses, it is clear that the rich neuronal network of the basal ganglia can play a key role in their generation.
As in the GPe, neuronal responses to behavioral events with suppression or complete cessation (behaviorally locked pauses) of firing rate have been described in the SNr and the GPi, where they are believed to be involved in facilitating movements (Hikosaka and Wurtz, 1983). The reverse idea, namely that pauses of GPe neurons suppress movements by increasing inhibition of these basal ganglia output structures, has also been put forward (Turner and Anderson, 1997). However, GPi and SNr activity does not mirror GPe activity, and their spontaneous activity is not interrupted by 0.5–1 s bursts. Finally, pallidal pauses may promote a burst of firing in the STN neurons in response to excitatory signals of cortical origin and hence disinhibit these cells during movement (Parent and Hazrati, 1995).
In conclusion, our results do not support an intrinsic cellular mechanism or slow global changes in the extracellular medium as triggers of pallidal pauses. In addition, the probability of GPe cells to pause spontaneously is inversely related to the degree of the monkey's motor activity. We therefore propose that spontaneous pauses reflect a network property that is related to low-arousal periods. According to recent studies, humans and animals tend to increase their exploratory behavior during periods of low arousal while not engaged in a particular task (Aston-Jones and Cohen, 2005). Thus, a possible explanation of the significance of GPe pauses in view of our results could be related to their role in explorative behavior during low-arousal periods. In contrast, the GPe pauses may enable a learning window for consolidation of recent striatal activations (Foster and Wilson, 2006) by virtue of their back projections to the parvalbumin-containing, fast-spiking striatal interneurons (Koos and Tepper, 1999; Koos et al., 2004).
Footnotes
This work was supported in part by a Center of Excellence Grant administered by the Israel Science Foundation and by a Hebrew University Netherlands Associations “Fighting against Parkinson” grant (H.B.), the Foulkes Foundation Fellowship, a Fellowship from the Myers-JDC-Brookdale Institute of Gerontology and Human Development, and ESHEL, the Association for the Planning and Development of Services for the Aged in Israel (S.E.). We thank Assaf Ariel for preliminary analysis of the data, K. Doya for suggesting the possible relationships between pauses and exploratory behavior, Y. Yarom and C. Wilson for fruitful discussions, I. Bar–Gad for help with simulations, O. Levine for preprocessing the data, G. Goelman for MRI, V. Sharkansky for technical assistance, and E. Singer for language editing.
References
- Albin RL, Young AB, Penney JB. The functional anatomy of basal ganglia disorders. Trends Neurosci. 1989;12:366–375. doi: 10.1016/0166-2236(89)90074-x. [DOI] [PubMed] [Google Scholar]
- Anderson ME. Discharge patterns of basal ganglia neurons during active maintenance of postural stability and adjustment to chair tilt. Brain Res. 1977;143:325–338. doi: 10.1016/0006-8993(78)90572-3. [DOI] [PubMed] [Google Scholar]
- Arkadir D, Morris G, Vaadia E, Bergman H. Independent coding of movement direction and reward prediction by single pallidal neurons. J Neurosci. 2004;24:10047–10056. doi: 10.1523/JNEUROSCI.2583-04.2004. [DOI] [PMC free article] [PubMed] [Google Scholar]
- Aston-Jones G, Cohen JD. An integrative theory of locus coeruleus-norepinephrine function: adaptive gain and optimal performance. Annu Rev Neurosci. 2005;28:403–450. doi: 10.1146/annurev.neuro.28.061604.135709. [DOI] [PubMed] [Google Scholar]
- Bertram R, Butte MJ, Kiemel T, Sherman A. Topological and phenomenological classification of bursting oscillations. Bull Math Biol. 1995;57:413–439. doi: 10.1007/BF02460633. [DOI] [PubMed] [Google Scholar]
- Bolam JP, Hanley JJ, Booth PA, Bevan MD. Synaptic organisation of the basal ganglia. J Anat. 2000;196:527–542. doi: 10.1046/j.1469-7580.2000.19640527.x. [DOI] [PMC free article] [PubMed] [Google Scholar]
- Boraud T, Bezard E, Guehl D, Bioulac B, Gross C. Effects of L-DOPA on neuronal activity of the globus pallidus externalis (GPe) and globus pallidus internalis (GPi) in the MPTP-treated monkey. Brain Res. 1998;787:157–160. doi: 10.1016/s0006-8993(97)01563-1. [DOI] [PubMed] [Google Scholar]
- Borisyuk A, Rinzel J. Understanding neuronal dynamics by geometrical dissection of minimal models. In: Chow C, Gutkin B, Hansel D, Meunier C, Dalibard J, editors. Models and methods in neurophsics. Amsterdam: Elsevier; 2005. pp. 19–72. [Google Scholar]
- Chan CS, Shigemoto R, Mercer JN, Surmeier DJ. HCN2 and HCN1 channels govern the regularity of autonomous pacemaking and synaptic resetting in globus pallidus neurons. J Neurosci. 2004;24:9921–9932. doi: 10.1523/JNEUROSCI.2162-04.2004. [DOI] [PMC free article] [PubMed] [Google Scholar]
- Cocatre-Zilgien JH, Delcomyn F. Identification of bursts in spike trains. J Neurosci Methods. 1992;41:19–30. doi: 10.1016/0165-0270(92)90120-3. [DOI] [PubMed] [Google Scholar]
- Contreras CM, Mexicano G, Guzman-Flores CA. Stereotaxic brain atlas of the green monkey (Cercopithecus Aethiops Aethiops) Bol Est Med Biol Mex. 1981;31:383–428. [PubMed] [Google Scholar]
- Coombes S, Bressloff PC. Hackensack, NJ: World Scientific; 2005. Bursting–the genesis of rhythm in the nervous system. [Google Scholar]
- Cooper AJ, Stanford IM. Electrophysiological and morphological characteristics of three subtypes of rat globus pallidus neurone in vitro. J Physiol (Lond) 2000;527:291–304. doi: 10.1111/j.1469-7793.2000.t01-1-00291.x. [DOI] [PMC free article] [PubMed] [Google Scholar]
- DeLong MR. Activity of pallidal neurons during movement. J Neurophysiol. 1971;34:414–427. doi: 10.1152/jn.1971.34.3.414. [DOI] [PubMed] [Google Scholar]
- DeLong MR, Crutcher MD, Georgopoulos AP. Relations between movement and single cell discharge in the substantia nigra of the behaving monkey. J Neurosci. 1983;3:1599–1606. doi: 10.1523/JNEUROSCI.03-08-01599.1983. [DOI] [PMC free article] [PubMed] [Google Scholar]
- DeLong MR, Crutcher MD, Georgopoulos AP. Primate globus pallidus and subthalamic nucleus: functional organization. J Neurophysiol. 1985;53:530–543. doi: 10.1152/jn.1985.53.2.530. [DOI] [PubMed] [Google Scholar]
- de Polavieja GG, Harsch A, Kleppe I, Robinson HP, Juusola M. Stimulus history reliably shapes action potential waveforms of cortical neurons. J Neurosci. 2005;25:5657–5665. doi: 10.1523/JNEUROSCI.0242-05.2005. [DOI] [PMC free article] [PubMed] [Google Scholar]
- Fee MS, Mitra PP, Kleinfeld D. Variability of extracellular spike waveforms of cortical neurons. J Neurophysiol. 1996;76:3823–3833. doi: 10.1152/jn.1996.76.6.3823. [DOI] [PubMed] [Google Scholar]
- Filion M. Effects of interruption of the nigrostriatal pathway and of dopaminergic agents on the spontaneous activity of globus pallidus neurons in the awake monkey. Brain Res. 1979;178:425–441. doi: 10.1016/0006-8993(79)90704-2. [DOI] [PubMed] [Google Scholar]
- Filion M, Tremblay L. Abnormal spontaneous activity of globus pallidus neurons in monkeys with MPTP-induced parkinsonism. Brain Res. 1991;547:142–151. [PubMed] [Google Scholar]
- Foster DJ, Wilson MA. Reverse replay of behavioural sequences in hippocampal place cells during the awake state. Nature. 2006;440:680–683. doi: 10.1038/nature04587. [DOI] [PubMed] [Google Scholar]
- Francois C, Percheron G, Yelnik J, Heyner S. A Golgi analysis of the primate globus pallidus. I. Inconstant processes of large neurons, other neuronal types, and afferent axons. J Comp Neurol. 1984;227:182–199. doi: 10.1002/cne.902270205. [DOI] [PubMed] [Google Scholar]
- Galvan A, Villalba RM, West SM, Maidment NT, Ackerson LC, Smith Y, Wichmann T. GABAergic modulation of the activity of globus pallidus neurons in primates: in vivo analysis of the functions of GABA receptors and GABA transporters. J Neurophysiol. 2005;94:990–1000. doi: 10.1152/jn.00068.2005. [DOI] [PubMed] [Google Scholar]
- Georgopoulos AP, DeLong MR, Crutcher MD. Relations between parameters of step-tracking movements and single cell discharge in the globus pallidus and subthalamic nucleus of the behaving monkey. J Neurosci. 1983;3:1586–1598. doi: 10.1523/JNEUROSCI.03-08-01586.1983. [DOI] [PMC free article] [PubMed] [Google Scholar]
- Gerfen CR. Basal ganglia. In: Paxinos G, editor. The rat nervous system. London: Elsevier; 2004. pp. 455–508. [Google Scholar]
- Gold C, Henze DA, Koch C, Buzsaki G. On the origin of the extracellular action potential waveform: a modeling study. J Neurophysiol. 2006;95:3113–3128. doi: 10.1152/jn.00979.2005. [DOI] [PubMed] [Google Scholar]
- Goldberg JA, Boraud T, Maraton S, Haber SN, Vaadia E, Bergman H. Enhanced synchrony among primary motor cortex neurons in the 1-methyl-4-phenyl-1,2,3,6-tetrahydropyridine primate model of Parkinson's disease. J Neurosci. 2002;22:4639–4653. doi: 10.1523/JNEUROSCI.22-11-04639.2002. [DOI] [PMC free article] [PubMed] [Google Scholar]
- Goldberg JA, Kats SS, Jaeger D. Globus pallidus discharge is coincident with striatal activity during global slow wave activity in the rat. J Neurosci. 2003;23:10058–10063. doi: 10.1523/JNEUROSCI.23-31-10058.2003. [DOI] [PMC free article] [PubMed] [Google Scholar]
- Green DM, Swets JA. Signal detection theory and psychopysics. New York: Wiley; 1966. Statistical decision theory and psychophysical procedures; pp. 30–52. [Google Scholar]
- Haber SN, Gdowski MJ. The basal ganglia. In: Paxinos G, Mai LM, editors. The human nervous system. London: Elsevier; 2004. pp. 676–738. [Google Scholar]
- Hashimoto K, Kita H. Slow oscillatory activity of rat globus pallidus neurons in vitro. Eur J Neurosci. 2006;23:443–453. doi: 10.1111/j.1460-9568.2005.04582.x. [DOI] [PubMed] [Google Scholar]
- Heimer G, Bar-Gad I, Goldberg JA, Bergman H. Dopamine replacement therapy reverses abnormal synchronization of pallidal neurons in the 1-methyl-4-phenyl-1,2,3,6-tetrahydropyridine primate model of parkinsonism. J Neurosci. 2002;22:7850–7855. doi: 10.1523/JNEUROSCI.22-18-07850.2002. [DOI] [PMC free article] [PubMed] [Google Scholar]
- Hikosaka O, Wurtz RH. Visual and oculomotor functions of monkey substantia nigra pars reticulata. IV. Relation of substantia nigra to superior colliculus. J Neurophysiol. 1983;49:1285–1301. doi: 10.1152/jn.1983.49.5.1285. [DOI] [PubMed] [Google Scholar]
- Izhikevich EM. Neural excitabilty, spiking and bursting. Int J Bifurcat Chaos. 2000;10:1171–1266. [Google Scholar]
- Izhikevich EM. Cambridge, MA: MIT; 2007. Dyanamical system in neuroscience–the geometry of excitabilty and bursting. [Google Scholar]
- Kita H, Kitai ST. Intracellular study of rat globus pallidus neurons: membrane properties and responses to neostriatal, subthalamic and nigral stimulation. Brain Res. 1991;564:296–305. doi: 10.1016/0006-8993(91)91466-e. [DOI] [PubMed] [Google Scholar]
- Kita H, Nambu A, Kaneda K, Tachibana Y, Takada M. Role of ionotropic glutamatergic and GABAergic inputs on the firing activity of neurons in the external pallidum in awake monkeys. J Neurophysiol. 2004;92:3069–3084. doi: 10.1152/jn.00346.2004. [DOI] [PubMed] [Google Scholar]
- Koos T, Tepper JM. Inhibitory control of neostriatal projection neurons by GABAergic interneurons. Nat Neurosci. 1999;2:467–472. doi: 10.1038/8138. [DOI] [PubMed] [Google Scholar]
- Koos T, Tepper JM, Wilson CJ. Comparison of IPSCs evoked by spiny and fast-spiking neurons in the neostriatum. J Neurosci. 2004;24:7916–7922. doi: 10.1523/JNEUROSCI.2163-04.2004. [DOI] [PMC free article] [PubMed] [Google Scholar]
- Legendy CR, Salcman M. Bursts and recurrences of bursts in the spike trains of spontaneously active striate cortex neuron. J Neurophysiol. 1985;53:926–939. doi: 10.1152/jn.1985.53.4.926. [DOI] [PubMed] [Google Scholar]
- Levesque M, Parent A. The striatofugal fiber system in primates: a reevaluation of its organization based on single-axon tracing studies. Proc Natl Acad Sci USA. 2005;102:11888–11893. doi: 10.1073/pnas.0502710102. [DOI] [PMC free article] [PubMed] [Google Scholar]
- Loewenstein Y, Mahon S, Chadderton P, Kitamura K, Sompolinsky H, Yarom Y, Hausser M. Bistability of cerebellar Purkinje cells modulated by sensory stimulation. Nat Neurosci. 2005;8:202–211. doi: 10.1038/nn1393. [DOI] [PubMed] [Google Scholar]
- Martin RF, Bowden DM. Amsterdam: Elsevier; 2000. Primate brain maps: structure of the macaque brain. [Google Scholar]
- Matsumura M, Tremblay L, Richard H, Filion M. Activity of pallidal neurons in the monkey during dyskinesia induced by injection of bicuculline in the external pallidum. Neuroscience. 1995;65:59–70. doi: 10.1016/0306-4522(94)00484-m. [DOI] [PubMed] [Google Scholar]
- Mink JW, Thach WT. Preferential relation of pallidal neurons to ballistic movements. Brain Res. 1987;417:393–398. doi: 10.1016/0006-8993(87)90472-0. [DOI] [PubMed] [Google Scholar]
- Morris G, Arkadir D, Nevet A, Vaadia E, Bergman H. Coincident but distinct messages of midbrain dopamine and striatal tonically active neurons. Neuron. 2004;43:133–143. doi: 10.1016/j.neuron.2004.06.012. [DOI] [PubMed] [Google Scholar]
- Nadjar A, Brotchie JM, Guigoni C, Li Q, Zhou SB, Wang GJ, Ravenscroft P, Georges F, Crossman AR, Bezard E. Phenotype of striatofugal medium spiny neurons in parkinsonian and dyskinetic nonhuman primates: a call for a reappraisal of the functional organization of the basal ganglia. J Neurosci. 2006;26:8653–8661. doi: 10.1523/JNEUROSCI.2582-06.2006. [DOI] [PMC free article] [PubMed] [Google Scholar]
- Nambu A, Llinas R. Electrophysiology of globus pallidus neurons in vitro. J Neurophysiol. 1994;72:1127–1139. doi: 10.1152/jn.1994.72.3.1127. [DOI] [PubMed] [Google Scholar]
- Nambu A, Tokuno H, Hamada I, Kita H, Imanishi M, Akazawa T, Ikeuchi Y, Hasegawa N. Excitatory cortical inputs to pallidal neurons via the subthalamic nucleus in the monkey. J Neurophysiol. 2000;84:289–300. doi: 10.1152/jn.2000.84.1.289. [DOI] [PubMed] [Google Scholar]
- Parent A, Hazrati LN. Functional anatomy of the basal ganglia. II. The place of subthalamic nucleus and external pallidum in basal ganglia circuitry. Brain Res Brain Res Rev. 1995;20:128–154. doi: 10.1016/0165-0173(94)00008-d. [DOI] [PubMed] [Google Scholar]
- Plenz D, Kitai ST. A basal ganglia pacemaker formed by the subthalamic nucleus and external globus pallidus. Nature. 1999;400:677–682. doi: 10.1038/23281. [DOI] [PubMed] [Google Scholar]
- Rav-Acha M, Sagiv N, Segev I, Bergman H, Yarom Y. Dynamic and spatial features of the inhibitory pallidal GABAergic synapses. Neuroscience. 2005;135:791–802. doi: 10.1016/j.neuroscience.2005.05.069. [DOI] [PubMed] [Google Scholar]
- Schonewille M, Khosrovani S, Winkelman BH, Hoebeek FE, De Jeu MT, Larsen IM, Van der BJ, Schmolesky MT, Frens MA, De Zeeuw CI. Purkinje cells in awake behaving animals operate at the upstate membrane potential. Nat Neurosci. 2006;9:459–461. doi: 10.1038/nn0406-459. [DOI] [PubMed] [Google Scholar]
- Schultz W. Activity of pars reticulata neurons of monkey substantia nigra in relation to motor, sensory, and complex events. J Neurophysiol. 1986;55:660–677. doi: 10.1152/jn.1986.55.4.660. [DOI] [PubMed] [Google Scholar]
- Stanford IM. Independent neuronal oscillators of the rat globus pallidus. J Neurophysiol. 2003;89:1713–1717. doi: 10.1152/jn.00864.2002. [DOI] [PubMed] [Google Scholar]
- Stokes CL, Rinzel J. Diffusion of extracellular K+ can synchronize bursting oscillations in a model islet of Langerhans. Biophys J. 1993;65:597–607. doi: 10.1016/S0006-3495(93)81092-0. [DOI] [PMC free article] [PubMed] [Google Scholar]
- Szabo J, Cowan WM. A stereotaxic atlas of the brain of the cynomolgus monkey (Macaca fascicularis) J Comp Neurol. 1984;222:265–300. doi: 10.1002/cne.902220208. [DOI] [PubMed] [Google Scholar]
- Terman D, Rubin JE, Yew AC, Wilson CJ. Activity patterns in a model for the subthalamopallidal network of the basal ganglia. J Neurosci. 2002;22:2963–2976. doi: 10.1523/JNEUROSCI.22-07-02963.2002. [DOI] [PMC free article] [PubMed] [Google Scholar]
- Tremblay L, Filion M. Responses of pallidal neurons to striatal stimulation in intact waking monkeys. Brain Res. 1989;498:1–16. doi: 10.1016/0006-8993(89)90394-6. [DOI] [PubMed] [Google Scholar]
- Tuckwell HC. Introduction to theoretical neurobiology. Cambridge: Cambridge UP; 1998. Analysis of stochastic neuronal activity; pp. 191–246. [Google Scholar]
- Turner RS, Anderson ME. Pallidal discharge related to the kinematics of reaching movements in two dimensions. J Neurophysiol. 1997;77:1051–1074. doi: 10.1152/jn.1997.77.3.1051. [DOI] [PubMed] [Google Scholar]
- Turner RS, Anderson ME. Context-dependent modulation of movement-related discharge in the primate globus pallidus. J Neurosci. 2005;25:2965–2976. doi: 10.1523/JNEUROSCI.4036-04.2005. [DOI] [PMC free article] [PubMed] [Google Scholar]
- Wichmann T, Bergman H, DeLong MR. The primate subthalamic nucleus. I. Functional properties in intact animals. J Neurophysiol. 1994;72:494–506. doi: 10.1152/jn.1994.72.2.494. [DOI] [PubMed] [Google Scholar]
- Wu Y, Richard S, Parent A. The organization of the striatal output system: a single-cell juxtacellular labeling study in the rat. Neurosci Res. 2000;38:49–62. doi: 10.1016/s0168-0102(00)00140-1. [DOI] [PubMed] [Google Scholar]