

Abstract
Retinal ganglion cells fire spikes to an appropriate contrast presented over their receptive field center. These center responses undergo dynamic changes in sensitivity depending on the ongoing level of contrast, a process known as “contrast gain control.” Extracellular recordings suggested that gain control is driven by a single wide-field mechanism, extending across the center and beyond, that depends on inhibitory interneurons: amacrine cells. However, recordings in salamander suggested that the excitatory bipolar cells, which drive the center, may themselves show gain control independently of amacrine cell mechanisms. Here, we tested in mammalian ganglion cells whether amacrine cells are critical for gain control over the receptive field center. We made extracellular and whole-cell recordings of guinea pig Y-type cells in vitro and quantified the gain change between contrasts using a linear–nonlinear analysis. For spikes, tripling contrast reduced gain by ∼40%. With spikes blocked, ganglion cells showed similar levels of gain control in membrane currents and voltages and under conditions of low and high calcium buffering: tripling contrast reduced gain by ∼20–25%. Gain control persisted under voltage-clamp conditions that minimize inhibitory conductances and pharmacological conditions that block inhibitory neurotransmitter receptors. Gain control depended on adequate stimulation, not of ganglion cells but of presynaptic bipolar cells. Furthermore, horizontal cell measurements showed a lack of gain control in photoreceptor synaptic release. Thus, the mechanism for gain control over the ganglion cell receptive field center, as measured in the subthreshold response, originates in the presynaptic bipolar cells and does not require amacrine cell signaling.
Keywords: adaptation, whole-cell recording, amacrine cell, bipolar cell, intracellular recording, vision
Introduction
The visual system continually adjusts its sensitivity to the statistics of the immediate environment, and this process of adaptation starts in the retina. The retina adapts to encode the wide range of lighting conditions (∼108 levels) given the narrow range of spiking output (∼102 levels) of ganglion cells. Ganglion cells adapt to the mean luminance through “light adaptation,” but also to the dynamic range of luminance through “contrast adaptation” (Walraven et al., 1990; Troy and Enroth-Cugell, 1993; Demb, 2002; Baccus and Meister, 2004; Mante et al., 2005). Contrast adaptation increases sensitivity at low contrast, presumably to increase the signal-to-noise ratio, and decreases sensitivity at high contrast to avoid response saturation. Recordings in salamander showed that contrast adaptation is absent at the output of cone synapses and thus emerges within the retinal circuit (Rieke, 2001; Baccus and Meister, 2002).
After a change in contrast, ganglion cells express at least two adaptive mechanisms. One mechanism causes a slow shift in the membrane potential (∼10 s) (Baccus and Meister, 2002; Solomon et al., 2004; Manookin and Demb, 2006). A second mechanism represents a true “gain control” and rapidly modifies the slope of the stimulus–response relationship (∼100 ms) (Shapley and Victor, 1978; Victor, 1987; Chander and Chichilnisky, 2001; Kim and Rieke, 2001; Baccus and Meister, 2002; Zaghloul et al., 2005; Bonin et al., 2006). Here we used stimulus conditions that emphasize the second mechanism, “contrast gain control,” and further focused on the receptive field center. To center stimulation, gain control appears first in the subthreshold response, with additional gain control arising during spike generation (Kim and Rieke, 2001, 2003; Zaghloul et al., 2005).
We hypothesized that gain control in the subthreshold response of mammalian ganglion cells depends on amacrine cells. With ∼30 distinct types, amacrine cells are the predominant inhibitory interneuron and could therefore drive gain control through synaptic inhibition (Vaney, 1990; MacNeil and Masland, 1998; Wassle, 2004). Furthermore, extracellular recordings showed that gain control extends broadly over the receptive field center and surround, consistent with a wide-field amacrine cell mechanism (Shapley and Victor, 1979; Enroth-Cugell and Jakiela, 1980). Moreover, ganglion cell types that express strong gain control (i.e., Y-type/α cells) receive a majority of synapses from amacrine cells (∼80%) (Shapley and Victor, 1978; Freed and Sterling, 1988; Kolb and Nelson, 1993; Weber and Stanford, 1994).
Evidence against the amacrine cell hypothesis comes from a study in salamander: gain control in ganglion cell synaptic currents were primarily explained by gain control in presynaptic (excitatory) bipolar cells, even with amacrine cell synapses blocked (Kim and Rieke, 2001; Rieke, 2001). However, other salamander recordings showed relatively little gain control in bipolar cell responses compared with that in the ganglion cell membrane potential, suggesting that amacrine cells cause additional gain control at the ganglion cell level (Baccus and Meister, 2002). Here, we studied gain control over the receptive field center in mammalian ganglion cells and tested the role of both intrinsic properties and presynaptic mechanisms driven by amacrine and bipolar cells.
Materials and Methods
Electrophysiology.
We recorded from Y-type ganglion cells and horizontal cells in an in vitro, whole-mount preparation of the guinea pig retina. The preparation of the retina has been described previously and conforms to National Institutes of Health and University of Michigan guidelines (Demb et al., 1999; Manookin and Demb, 2006). The retina was continuously superfused (∼5 ml min−1) with Ames medium, bubbled with 95% O2/5% CO2, and warmed to 33–36°C. All chemicals were purchased from Sigma-Aldrich (St. Louis, MO) unless indicated otherwise.
We made loose-patch extracellular and whole-cell intracellular recordings in ganglion cells with 3–7 MΩ glass pipettes, as described previously (Manookin and Demb, 2006). We targeted the largest cells in the ganglion cell layer (20–25 μm diameter) and used standard paradigms to test for the expected properties: center–surround receptive field organization and nonlinear responses to a high spatial frequency grating (Hochstein and Shapley, 1976; Demb et al., 2001). Loose-patch electrodes were filled with Ames medium. For whole-cell recordings, we used either a K-based intracellular solution [in mm: 140 K-methylsulfate, 3 NaCl, 10 HEPES, 0.1 EGTA, 5 lidocaine N-ethyl bromide (QX-314-Br), 2 ATP-Mg, and 0.3 GTP-Na, titrated to pH 7.3 with NaOH] or a Cs-based solution [in mm: 120 Cs-methanesulfonate, 5 tetraethylammonium (TEA)-Cl, 3 NaCl, 10 HEPES, 10 BAPTA (Invitrogen, Eugene, OR), 2 QX-314-Br, 2 ATP-Mg, 0.3 GTP-Na, and 0.1% Lucifer yellow, titrated to pH 7.3 with NaOH]. The K-based solution was used for both current- and voltage-clamp conditions, whereas the Cs-based solution was used for voltage clamp only. The reversal potential for GABA and glycine receptors (EGABA/glycine) would be approximately −73 mV if the channels were permeable only to Cl− or approximately −67 mV if they were equally permeable to Cl− and Br− (Bormann et al., 1987; Robertson, 1989).
We recorded intracellularly from horizontal cells with intracellular electrodes (50–200 MΩ) filled with 1.5 m potassium acetate and a fluorescent dye for visualization after recording (Alexa Fluor 488 or 568; Invitrogen). To target horizontal cells, we advanced the electrode, from the ganglion cell layer, until we reached the outer plexiform layer. We used a full-field square-wave stimulus to facilitate searching for the cell; when we penetrated a horizontal cell, we saw a change in the resting potential (−38.8 ± 6.5; n = 8) and the typical shape of the step response (see Fig. 7C) (Lankheet et al., 1992; Dacey et al., 1996). Not all horizontal cells were stained, and not all recorded cells could be identified as A type or B type. However, another series of experiments in which cells were injected with Neurobiotin and imaged with confocal microscopy showed a 3:1 bias for recording A-type cells relative to B-type cells (n = 36 cells) (B. Borghuis, unpublished observations).
Figure 7.
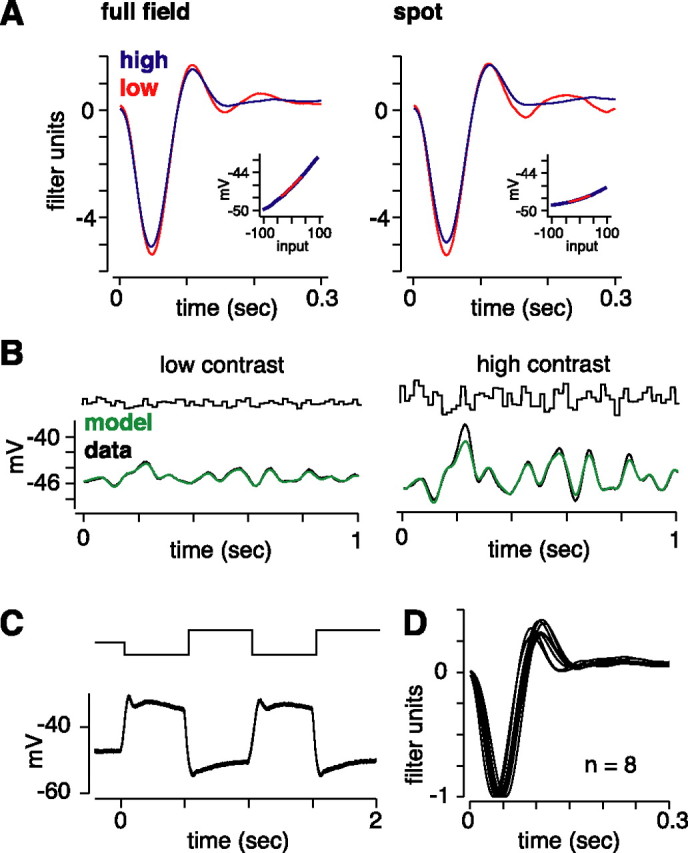
Gain control is not apparent at the output of photoreceptor synaptic release. A, Linear filters and static nonlinearity (inset) for a horizontal cell stimulated with either a full-field stimulus (3 × 3 mm) or the typical spot (0.5 mm diameter). The full field yielded a larger response amplitude, as reflected in the nonlinearity, but both stimuli evoked only a negligible gain change (full-field stimulus gain change of 0.95; spot, 0.94). B, LN model fit (green) to high- and low-contrast data (black; same format as in Fig. 1D). C, Response of a horizontal cell to a full-contrast, 2 Hz step stimulus (full field) shows the typical step response. D, All horizontal cells (n = 8) showed a similar shape in their linear filters (shown here normalized to the peak negative response).
Data were sampled at 10 kHz using equipment and methods described previously (Manookin and Demb, 2006). Data were analyzed using programs written in Matlab (The Mathworks, Natick, MA). We corrected the holding potential for voltage-clamp recordings using the following formula: Vh_corrected = Vh − (Ileak × Rs × (1 − Rs_correct)) + jp, where Vh is the recorded holding potential (in millivolts), Ileak is the mean leak current (in nanoamperes), Rs is the series resistance (in megaohms), Rs_correct is the series resistance compensation (0.3–0.5), and jp is the calculated junction potential (−9 mV). The average corrected holding potentials for voltage-clamp recordings near rest were −70.5 ± 0.7 mV (OFF cells, n = 49) and −49.8 ± 1.2 mV (ON cells, n = 28); the more depolarized potential for ON cells probably reflects a greater degree to which the Cs and TEA in the pipette solution blocked K+ channels. Near Vrest, holding currents were −16.8 ± 8.5 pA (OFF) and −40.3 ± 14.0 pA (ON). Input resistance, measured during a 20 mV command step from the resting potential, was 37.1 ± 1.3 MΩ (OFF) and 31.5 ± 4.0 MΩ (ON).
In one condition, GABAA/B/C and glycine receptor antagonists [100 μm bicuculline (Tocris, Ellisville, MO), 100 μm (3-aminopropyl)(diethoxymethyl)phosphonic acid (CGP35348), 100 μm (1,2,5,6-tetrahydropyridin-4-yl)methylphosphinic acid (TPMPA), and 2 μm strychnine (Fisher, Hampton, NH), respectively] were added to the bath to block amacrine synapses onto ganglion cells or bipolar cells (see Results). For this condition, we typically recorded only one cell per preparation to avoid long-term changes caused by the drugs that did not readily reverse.
Visual stimulus.
Visual stimuli were programmed and presented as described previously (Demb et al., 1999; Manookin and Demb, 2006). The primary stimulus was a 0.5-mm-diameter spot, centered on the cell body. The spot intensity was drawn from a Gaussian distribution with a mean equal to the mean luminance of the monitor: 103–104 photoisomerizations per middle-wavelength-sensitive cone or rod per second, which is within the mesopic range (Yin et al., 2006). The SD of the Gaussian was either 0.1 or 0.3 times the mean luminance, for low and high contrast, respectively. These SD values represent the contrast value. At high contrast, the Gaussian distribution could extend for 3.3 SDs in either direction. Distribution values >3.3 SDs from the mean were assigned to the maximum or minimum intensity. Thus, a 0.3 contrast represents a near-maximal value given the requirement of having a range that covers ∼6 SDs in the Gaussian distribution. Below, we present the stimulus in contrast units, where intensity values have been normalized between −1 and +1, with a mean of 0, by subtracting the mean intensity and then dividing by the mean intensity.
Intensity values were updated either on every frame (60 Hz) or on every third frame (20 Hz). This stimulus approximates white noise (Zaghloul et al., 2005). The two contrast values were alternated every 10 s (20 s cycle) for 10–20 cycles. The first 7 s of each half-cycle were different on every cycle, whereas the last 3 s of each half-cycle were the same on every cycle. Data from the first 7 s were used to build a model for the response of the cell [the linear–nonlinear (LN) model, described below], whereas data from the last 3 s were used to test the predictive ability of the model (see below and Fig. 1E). In some cases, we analyzed a subset of the 10 or 20 cycles if we detected instability; we looked across cycles for sudden, dramatic changes in the spike rate or SD of the subthreshold response to the repeated stimulus. Furthermore, in some cases, we subtracted a linear drift from the current trace before further analyzing the data. For one experiment (see Fig. 4C,D), we measured the response to a spot (0.5 mm diameter, 30% contrast, 2 Hz square wave) or a square-wave grating, windowed in an annulus (1.5/3.0 mm inner/outer diameter, 100% contrast, 6.7 cycles mm−1, 2 Hz square wave), while altering the holding potential.
Figure 1.

Quantifying response gain with random flicker stimulation and the LN analysis. A, Random flicker stimulation and response. The intensity of a spot (0.5 mm diameter; top row) was modulated by drawing values randomly from a Gaussian distribution. The response of the cell was measured by extracellular recording of spikes (middle row) or whole-cell recording of membrane currents (bottom row; Vhold = −73 mV). B, The LN model. The stimulus is convolved with a linear filter (L), and the product is passed through a static nonlinearity (N), resulting in the LN model for both spikes (top row) and membrane currents (bottom row). C, Linear filter and static nonlinearity for the cell in A. The nonlinearities align (see Materials and Methods), and the effect of increasing contrast from low to high is reflected solely in the filters. For both spikes and membrane currents, high contrast reduces the gain (height of the filter) and decreases the integration time (zero-crossing of the filter; see Materials and Methods). The green line in the nonlinearity plot is a fitted cumulative Gaussian used to generate the LN model output in D. D, Testing the LN model. The format is the same as in A. Data are from the repeat segment of the stimulus (see Materials and Methods), averaged over 10 (currents) or 20 trials (spikes; bin size, 20 ms). The LN model predictions (green line), constructed from a separate data set, correspond closely to the data. E, Diagram of the stimulus cycle. The contrast alternated between 10 s of high contrast and 10 s of low contrast. The first 7 s of each half-cycle were unique for each cycle; the model was built from data collected between 2 and 7 s (model-building period). The last 3 s of each half-cycle were repeated across cycles; the model was tested against data collected during the last 2.5 s (model-testing period).
Figure 4.

Contrast gain control does not depend on feedforward inhibition at the ganglion cell. A, Linear filters and static nonlinearities (inset) for an OFF cell at a holding potential near Vrest (Vhold = −64 mV) and a hyperpolarized potential nearer to the apparent reversal for inhibition (Vhold = −72 mV). The relative gain at high contrast was similar near Vrest (0.72) and at the hyperpolarized potential (0.67). B, The gain change was similar near Vrest and the hyperpolarized potential, suggesting that gain control does not depend on feedforward inhibition onto the ganglion cell dendrites. The spot intensity was updated at 60 Hz (circles) or 20 Hz (triangles). C, Demonstration of the apparent reversal for inhibition. The response to a contrast-reversing spot was measured at several holding potentials in an OFF cell (same cell as in A). Leak-subtracted responses are shown in the inset for Vhold = −84 mV (black) or −44 mV (red). The current amplitude for the ON response (gray bar) in this OFF cell showed an apparent reversal potential of −80 mV. D, Data are presented in the same format as in C for a contrast-reversing grating in the receptive field periphery (see Materials and Methods). The apparent reversal potential for the outward currents evoked by contrast reversal of the grating was −79 mV.
Analysis: the LN model.
To interpret data recorded to the flickering spot, we used the LN cascade analysis (Chichilnisky, 2001). The analysis was performed on spike, current, and voltage recordings in ganglion cells and on voltage recordings in horizontal cells. In the LN analysis, a linear filter represents the impulse response function of the cell, the theoretical response to a brief light flash. The same filter, plotted in reverse, represents the “weighting function” of the cell. The linear prediction of the response (i.e., the linear model) at any point in time is calculated by multiplying the stimulus by the weighting function and summing the result (Carandini et al., 2005). The linear filter is computed by cross-correlating the stimulus and the response (Chichilnisky, 2001).
The linear model fails to perfectly capture the response but can be improved significantly by including a static nonlinearity (Chichilnisky, 2001; Carandini et al., 2005). The static nonlinearity translates the linear model values into actual output values and can account for rectification and saturation in the response. The nonlinearity is computed by plotting the (binned) average output value (in spikes per second, nanoamperes, or millivolts) for each input value of the linear model, as described previously (Chander and Chichilnisky, 2001; Kim and Rieke, 2001; Baccus and Meister, 2002; Zaghloul et al., 2005).
The LN model is unique only up to a scale factor. Thus, the y-axis of the linear filter and the x-axis of the nonlinearity can be scaled by the same factor without changing the output of the model (Chander and Chichilnisky, 2001; Kim and Rieke, 2001; Baccus and Meister, 2002; Zaghloul et al., 2005). We first scaled the high-contrast nonlinearity (stretched the x-axis) so that it aligned to the low-contrast nonlinearity and then scaled the high-contrast filter (stretched the y-axis) by the same factor. Thus, the gain change is represented solely by the difference between the linear filters. To scale the low- and high-contrast nonlinearities into alignment, we performed the following procedure: (1) we removed the difference in y-intercept between the two nonlinearities (although this was generally small: 2.0 ± 1.6 pA, n = 67; or 1.4 ± 1.2 mV, n = 9); (2) we took the high- and low-contrast data that were within the same range, on the x-axis, and rebinned the data into 100 bins each; and (3) we compared the mean-squared error (MSE) between the two sets of 100 bins. We then rescaled the high-contrast data (by stretching the data on the x-axis) and repeated steps 2 and 3 above. After performing this for a wide range of scale factors (approximately twofold gain change in either direction), we fit a third-order polynomial to the graph of scale factor versus MSE and found the minimum of this function, or the approximate optimal scale factor. We then repeated this last step for a narrower range of scale factors and used the minimum of this fit as the optimal scale factor. This scale factor was then used to scale the y-axis of the high-contrast linear filter, as described above. This fitting procedure is a nonparametric method for scaling the two nonlinearities into alignment, because it does not assume a functional form for the shape of the nonlinearity.
We measured the gain change between the low- and high-contrast filters by taking the ratio of the filter peaks (high/low), as described previously (Chander and Chichilnisky, 2001; Kim and Rieke, 2001). We also compared the SD of the linear models computed using the two filters (convolved with the same input stimulus) and took the ratio high/low (Baccus and Meister, 2002); this method yielded nearly identical results to those obtained using the first method (Zaghloul et al., 2005). The change in kinetics was measured by comparing the zero-crossing of the filters (high/low) (Chander and Chichilnisky, 2001; Kim and Rieke, 2001; Zaghloul et al., 2005) or by taking the Fourier transform of the filters and computing the phase shift of frequencies in the range of 4–8 Hz (Shapley and Victor, 1978).
Validating the LN model.
The LN model is useful to the extent that it provides a good representation of the data (Carandini et al., 2005). We tested the predictive ability of the LN model, in every cell, by building the model from one set of data and testing the model on a second set of data. For this purpose, the nonlinearity (after scaling the two contrast functions into alignment, as described above) was fit with a cumulative Gaussian, to generate predictions for all values of the input (Chichilnisky, 2001; Zaghloul et al., 2005). The model-building data were taken from the response 2–7 s after the contrast switch (across 10–20 cycles). The model-testing data were taken from the last 2.5 s of each half-cycle, during the repeated stimulus (see above and Fig. 1E). The predictive ability was measured in two ways: (1) comparing the average correlation (r) between each trial of the repeated stimulus and either the LN model or the maximum likelihood (ML) prediction; the ML prediction, for a given trial, was the average response to the other 9–19 trials (Chichilnisky, 2001; Kim and Rieke, 2001; Rieke, 2001; Zaghloul et al., 2003); and (2) comparing the explained variance (r2) between the model and the average of the repeated stimulus.
Based on the first measure, we selected cells for the study in which the LN model prediction of the membrane currents was, for every condition analyzed, at least 85% as good as the ML prediction. For the membrane currents, recorded in the standard condition (0.5-mm-diameter spot; 0.1 vs 0.3 contrast; holding potential near Vrest), this percentage was, on average, 92.0 ± 0.4% (high contrast) or 97.8 ± 0.5% (low contrast; n = 77); for spikes, this percentage was 80.7 ± 1.0% (high contrast) or 89.2 ± 1.5% (low contrast; n = 53). Thus, the LN model provided a good description of the response. For comparison with future studies, we present the average r for the LN model prediction [n = 53 cells with both spike and membrane current responses: 0.87 ± 0.01 (high contrast, currents), 0.85 ± 0.02 (low contrast, currents), 0.67 ± 0.01 (high contrast, spiking), 0.65 ± 0.02 (low contrast, spiking)] and the average r2 values [0.83 ± 0.01 (high contrast, currents), 0.89 ± 0.01 (low contrast, currents), 0.62 ± 0.01 (high contrast, spiking), 0.69 ± 0.02 (low contrast, spiking)].
Data are reported as mean ± SEM. Samples were compared with one-tailed t tests, unless indicated otherwise.
Results
Contrast gain control in spiking and membrane current responses of mammalian ganglion cells
We recorded from Y-type (brisk-transient) ganglion cells (n = 49 OFF-center and 28 ON-center) in the intact, in vitro guinea pig retina (Demb et al., 1999, 2001). Y-type cells, and homologous cells in other species, show strong contrast gain control (Shapley and Victor, 1978; Benardete et al., 1992; Chander and Chichilnisky, 2001). For a given cell, we first recorded spiking responses with a patch electrode in the loose-patch configuration. Then, with a second electrode, we made whole-cell recordings, under either voltage clamp or current clamp (see Materials and Methods). The main visual paradigm was a “switching experiment” in which a randomly flickering spot was projected onto the photoreceptors. Intensity values were drawn from a Gaussian distribution with an SD of 0.1 (low contrast) or 0.3 (high contrast) times the mean (see Materials and Methods). We quantified the gain change between conditions using an LN cascade analysis (Fig. 1) (see Materials and Methods). This analysis quantifies a gain change in the presence of nonlinearities in the spiking or subthreshold response (Chander and Chichilnisky, 2001; Chichilnisky, 2001; Kim and Rieke, 2001).
To compare our results with previous studies, we first measured the gain change for spiking responses. This was done by taking the ratio of the peaks of the linear filters measured at the two contrast levels (see Materials and Methods). Tripling contrast reduced the gain of the spiking response to 0.59 ± 0.011 (mean ± SEM; n = 53). In other words, at high contrast, the cell was, on average, only 59% as sensitive as at low contrast. This level of gain control is consistent with previous studies (Benardete and Kaplan, 1999; Chander and Chichilnisky, 2001; Kim and Rieke, 2001). In the same cells recorded under voltage clamp, tripling contrast reduced the gain of the membrane current response to 0.77 ± 0.014 (n = 53). ON cells (n = 16) and OFF cells (n = 37) showed similar relative gain changes in spiking (ON, 0.56 ± 0.017; OFF, 0.60 ± 0.013, p < 0.10, two-tailed), whereas OFF cells showed a larger gain change than ON cells in membrane currents (ON, 0.86 ± 0.03; OFF, 0.74 ± 0.012; p < 0.01, two-tailed) (Fig. 2B). This asymmetry between ON and OFF cell currents resembles the asymmetry shown in salamander (Kim and Rieke, 2001; Rieke, 2001). Thus, ganglion cells showed one level of adaptation in the membrane currents and an additional level of adaptation in the conversion from synaptic currents to a spiking response (Kim and Rieke, 2001; Zaghloul et al., 2005).
Figure 2.

Contrast gain control in the spiking response is partially explained by gain control in the synaptic currents. A, Linear filters and static nonlinearities (inset) from extracellular and voltage-clamp recordings of an ON cell (Vhold = −54 mV). The relative gain at high contrast showed more gain control in the spiking response (0.59) relative to the current response (0.80). B, Relative gain at high contrast for spiking and current responses for 53 cells. Gain control was larger for spiking responses relative to current responses. C, Relative integration time for high:low contrast. Integration time was measured by the zero-crossing of the linear filter. High contrast reduced the integration time for OFF cells; the effect was larger for spikes.
Tripling contrast also decreased the integration time of the filter. The integration time was defined as the time required for the filter to cross zero after the initial response (Fig. 2C). We measured the effect of contrast as the zero-crossing at high contrast relative to that at low contrast. OFF cells shortened their integration time at high contrast both for spiking responses (0.87 ± 0.005; n = 37; p < 0.001) and membrane current responses (0.91 ± 0.004; p < 0.001), whereas ON cells did not (spiking, 1.03 ± 0.01; membrane currents, 1.02 ± 0.01; n = 16). This OFF/ON asymmetry agrees with some previous studies in salamander and primate (Chander and Chichilnisky, 2001; Kim and Rieke, 2001) but not with others in primate and cat (Shapley and Victor, 1978; Benardete and Kaplan, 1999). We further examined the effect of contrast on OFF cell kinetics by computing the Fourier transform of the spike filters and measuring the average phase shift for frequencies of 4–8 Hz (Zaghloul et al., 2005). Over this frequency range, phases were advanced at high contrast by 0.41 ± 0.02 π radians, similar to previous studies (Shapley and Victor, 1978; Benardete and Kaplan, 1999; Zaghloul et al., 2005). In the analyses below, we studied the subthreshold response and focused on the gain change at high contrast, because there were measurable effects in both OFF and ON cells.
Contrast gain control does not depend on voltage- or calcium-dependent mechanisms intrinsic to the ganglion cell
We next asked whether the subthreshold mechanism for gain control in the ganglion cell reflects gain control exclusively at the level of synaptic inputs or whether voltage- or calcium-dependent mechanisms in the ganglion cell contribute. We compared gain control in the subthreshold response, in the same cells, under voltage clamp and current clamp (n = 9) (Fig. 3). These recordings used a K-based intracellular solution with QX-314 to block spiking and improve voltage clamp and low-calcium buffering (0.1 mm EGTA). If a voltage-dependent mechanism in the ganglion cell played a role in gain control, then gain control should be stronger under current-clamp conditions, but in fact, if anything, the reverse was true. Gain control was 0.79 ± 0.05 under current clamp and 0.75 ± 0.04 under voltage clamp. Gain control in the subthreshold voltage response measured here (with QX-314 in the pipette) was similar to that found previously in subthreshold responses measured in the presence of spiking (∼0.82) (Zaghloul et al., 2005). We conclude that the gain control in ganglion cell subthreshold responses reflects gain control at the level of synaptic input and does not depend on voltage-dependent mechanisms in the ganglion cell.
Figure 3.

Contrast gain control does not depend on intrinsic voltage-dependent mechanisms in the ganglion cell. A, Linear filters and static nonlinearities (inset) for an OFF cell recorded under voltage-clamp (Vhold = −72 mV) or current-clamp (K+-based pipette solution with QX-314) conditions. The gain change was similar under voltage clamp (0.76) and current clamp (0.78). B, Relative gain at high contrast for voltage-clamp versus current-clamp conditions. The gain change was similar under the two conditions, suggesting that gain control does not depend on a voltage-dependent mechanism in the ganglion cell.
The above comparison of current-clamp and voltage-clamp measurements rules out an additional mechanism for gain control. If gain control were caused by a tonic inhibitory synapse at the ganglion cell dendrites, it would cause “shunting” under current clamp. However, such a mechanism would have no effect under voltage clamp: a tonic inhibitory conductance would add to the modulated contrast signal without causing shunting. Thus, similar gain control under current clamp and voltage clamp rules out a mechanism driven by tonic inhibition.
We next asked whether a calcium-dependent mechanism in the ganglion cell contributes to gain control. Calcium influx can be driven by synaptic activity, even under voltage-clamp conditions, and indeed a calcium-dependent mechanism alters ganglion cell sensitivity in salamander (Cohen, 2000; Akopian and Witkovsky, 2001). We compared the above voltage-clamp recordings with low-calcium buffering to other voltage-clamp recordings made with a Cs-based pipette solution and high-calcium buffering (10 mm BAPTA; see Materials and Methods). Recordings with high BAPTA showed a gain control of 0.79 ± 0.014 (n = 62), which was not significantly different from the above recordings with low buffering. Therefore, we could rule out a calcium-dependent mechanism for gain control in the ganglion cell.
Contrast gain control was slightly larger with increased stimulus power at low temporal frequencies
We tested whether the magnitude of contrast gain control would be larger with increased power at low temporal frequencies (Shapley and Victor, 1978). For the above recordings, we used a flickering stimulus in which the spot intensity was updated on every frame, at 60 Hz. For a subset of cells, we compared this condition to a second one in which the intensity was updated on every third frame, at 20 Hz. This 20 Hz stimulus increased the stimulus power (squared Fourier amplitudes) at the low temporal frequency range (1–10 Hz) to which the cell is most sensitive by ∼2.2-fold (Zaghloul et al., 2005). For cells recorded under both conditions (n = 3 ON cells and 7 OFF cells), high contrast reduced the gain in either case, and the effect was significantly larger with the 20 Hz stimulus (0.72 ± 0.04) compared with the 60 Hz stimulus (0.76 ± 0.04; difference of 0.049 ± 0.021; p < 0.05). Although the difference between conditions was significant, the magnitude of this difference (∼20%) was relatively small. Therefore, it is unlikely that the mechanisms for gain control differ for the two conditions, and in the following experiments, we combined data recorded at the two presentation rates.
Contrast gain control does not depend on feedforward inhibition of ganglion cells
We next tested whether amacrine cells drive contrast gain control by making feedforward inhibitory synapses onto the ganglion cell. Above, we ruled out a mechanism driven by tonic inhibition. Here, we consider a mechanism driven by phasic inhibition: a mechanism active only at high contrast, where inhibitory conductances are timed to counteract excitatory conductances. Such a mechanism would be present under voltage-clamp conditions, except when inhibitory conductances are nulled by recording near the reversal potential for inhibition.
We calculated a reversal for the GABA and glycine receptor channels (EGABA/glycine) that was approximately −70 mV (see Materials and Methods). We also considered the problem of space clamp with the large cells under study (∼0.5 mm diameter) (Demb et al., 2001). Because of an inadequate space clamp, a holding potential negative to EGABA/glycine at the soma could be required to bring the dendrites to EGABA/glycine. Therefore, we made a functional estimate of the reversal for inhibition (Einhibit) by voltage clamping OFF cells at a series of holding potentials and using paradigms known to elicit direct inhibition. These responses include the inhibitory “ON” response to a contrast-reversing spot and the frequency-doubled response to a contrast-reversing grating in the receptive field periphery (Demb et al., 1999; Roska and Werblin, 2003; Zaghloul et al., 2003) (Fig. 4C,D). Based on the reversal potential for these responses, we estimated Einhibit to be approximately −80.3 ± 1.5 mV (n = 5).
We measured contrast gain control with Vhold near to or positive to the resting potential (Vrest) (−54.6 ± 2.8 mV; n = 32) versus near Einhibit (−70.7 ± 1.9 mV). The recording near Einhibit yielded, in OFF-center cells, rectified outward currents in the nonlinear component of the LN model. The rectification of outward currents suggests that inhibitory influences were mostly nulled. At the same time, inward currents became larger than those measured at Vrest, consistent with the expected increased driving force on excitatory currents (Fig. 4A). However, contrast gain control was similar near Vrest (0.77 ± 0.02) and near Einhibit (0.76 ± 0.02; n = 32). This was true both for OFF cells (Vrest, 0.75 ± 0.02; Einhibit, 0.71 ± 0.02; n = 20) and for ON cells (Vrest, 0.82 ± 0.04; Einhibit, 0.84 ± 0.04; n = 12). Even if we are off in our estimate of Einhibit, our results still imply that gain control was equal at the two holding potentials, for which inhibitory influences must be rather unequal. Thus, feedforward inhibition at the ganglion cell does not drive contrast gain control.
Contrast gain control does not require inhibitory synapses
To further test a possible role for amacrine cells in contrast gain control, we blocked inhibitory synapses pharmacologically. We applied to the bath simultaneously antagonists to GABAA/B/C and glycine receptors (bicuculline, CGP35348, TPMPA, and strychnine, respectively; see Materials and Methods). Applying these drugs caused, after 2 min, a large steady inward current accompanied by spontaneous “bursting” in OFF cells (n = 18) (Fig. 5C). The steady inward current presumably reflects the reduced inhibition of the ganglion cell plus the reduced inhibition of bipolar terminals, which would result in increased glutamate release. This increased glutamate release apparently occurs in bursts under these extreme conditions (Fig. 5C). This bursting was not evident in ON cells (n = 9).
Figure 5.

Contrast gain control does not depend on amacrine cell synaptic input. A, Linear filters and static nonlinearities (inset) for an OFF cell without and with bath-applied GABAA/B/C and glycine receptor antagonists (100 μm bicuculline, 100 μm CGP35348, 100 μm TPMPA, and 2 μm strychnine, respectively). The drugs increased the amplitude of responses, as reflected in the nonlinearity, but the gain change (0.61) was not reduced from control conditions (0.73; Vhold = −68 mV). B, Relative gain at high contrast was similar in control conditions and after adding the drugs. Vhold was near Vrest in all cases. The spot intensity was updated at 60 Hz (circles) or 20 Hz (triangles). Plotted are 31 recordings from 27 cells. C, Recording of membrane current during the wash-in of the receptor antagonists. The antagonists caused an inward current accompanied by bursting. Insets show periods of 5 s. D, Responses to low and high contrast before (black) and after (red) adding the receptor antagonists. The antagonists increased the response, but response modulations were similar to control conditions. Spontaneous bursting was less prominent in the presence of dynamic visual stimulation compared with the mean luminance condition in C.
Despite the bursting behavior, the visual response of a ganglion cell could still be modulated, and contrast gain control was measured using the standard analysis (Fig. 5D). Adding the drugs caused, in OFF-center cells, a suppression of the outward currents in the nonlinearity of the LN model (Fig. 5A); this suppression was expected, because this component of the model is driven by inhibitory synapses onto the ganglion cell (Zaghloul et al., 2003) (Fig. 4A). There was also a general increase in responsiveness (measured as the SD of membrane currents), from 146 ± 10 to 278 ± 26 pA (n = 27). However, on average, gain control was similar under initial conditions (0.76 ± 0.02) and after applying the drugs (0.73 ± 0.02); the difference between conditions was 0.026 ± 0.027 (NS). This was true both for OFF cells (control, 0.72 ± 0.011; drugs, 0.73 ± 0.03; n = 18) and for ON cells (control, 0.84 ± 0.05; drugs, 0.74 ± 0.03; n = 9). Although the average response showed no effect of the drugs, the data showed considerable scatter for this comparison, and we inspected individual cells where the drug reduced the level of gain control. For one of these extreme cases, the shape of the low contrast filter became considerably altered in the presence of the drugs, losing its biphasic quality. However, this was an exception, and, as stated above, all cells used in the analysis met a basic criterion regarding LN model performance (see Materials and Methods). Therefore, our conclusion is based on the average effect, which should be robust to any noise created by the extreme nature of the pharmacological condition. The results suggest that contrast gain control in ganglion cells depends neither on feedforward inhibition onto ganglion cells nor on feedback inhibition onto the bipolar terminal. Rather, the mechanism for gain control is most likely explained by gain control in bipolar cells.
Evidence that the mechanism for gain control requires adequate stimulation of bipolar cells
If gain control measured in the ganglion cell arises in presynaptic bipolar cells, then this gain control should depend on adequate stimulation of the bipolar cells only. To test this, we compared gain control across three stimulus conditions. The first condition was the standard condition: a spot that covered the ganglion cell receptive field center (0.5 mm diameter) and the overlying ∼100 bipolar cells, presented at 0.1 or 0.3 contrast. The second and third conditions were designed to generate relatively small responses in the ganglion cell but different response levels in bipolar cells. The second stimulus was the spot described above presented at lower contrast levels (0.03 and 0.1), which should generate relatively small responses in both the ganglion cell and the ∼100 bipolar cells. The third stimulus was a small spot (0.1 mm diameter) at higher contrast levels (0.1 or 0.3), which should generate a relatively small response in the ganglion cell but large responses in the centralmost approximately four bipolar cells. Here, we assumed that bipolar cells are spaced at ∼30 μm and have receptive fields of ∼100 μm (Dacey et al., 2000).
As expected, the standard condition yielded a larger response amplitude (SD of membrane currents, 143 ± 23 pA) than either the low-contrast (52 ± 4 pA) or small-spot conditions (31 ± 4 pA) (Fig. 6B). Gain control was similar for the standard condition (0.74 ± 0.03) and the small-spot condition (0.77 ± 0.03; n = 6); the difference between conditions was 0.028 ± 0.034 (NS). However, gain control was absent for the low-contrast condition (0.97 ± 0.02; not significantly different from 1.0) (Fig. 6C). Thus, gain control depended on local contrast, rather than stimulus size or the response amplitude in the ganglion cell. We conclude that gain control in the synaptic inputs to the ganglion cell depends on adequate stimulation of presynaptic bipolar cells.
Figure 6.

Evidence that contrast gain control depends on adequate bipolar cell stimulation rather than ganglion cell stimulation. A, Linear filters and static nonlinearities (inset) for the large spot with high- and low-contrast levels and the small spot with higher contrast levels. Gain control was present for the large and small spots, with higher contrasts, but was absent for the large spot, with lower contrasts. B, Response amplitude (SD of current response) for both contrast levels and the three conditions in A. Shown above the bars are diagrams of the stimuli (0.5 or 0.1 mm diameter) relative to a typical ganglion cell dendritic tree. C, Gain change at high contrast depended on the contrast level, not spot size.
Contrast gain control is not present at the level of photoreceptor synaptic release
The above results imply that bipolar cells are responsible for contrast gain control in ganglion cells. We next asked whether this gain control originates in bipolar cells or whether bipolar cells relay gain control present at the photoreceptor synaptic output. Similar to bipolar cells, horizontal cells are postsynaptic to photoreceptors. Therefore, if photoreceptors show gain control, then this should be evident in horizontal cell responses. We recorded horizontal cells intracellularly (see Materials and Methods) and used the standard switching experiment (0.1 and 0.3 contrast) and LN analysis (Fig. 7). A full-field stimulus (3 × 3 mm) generated large responses, whereas the standard spot stimulus (0.5 mm diameter) generated smaller responses. Both stimuli yielded similar results (Fig. 7A): contrast gain control in horizontal cells was negligible, adapting at high contrast to 0.97 ± 0.014 (n = 8) for the full-field stimulus and 0.97 ± 0.02 (n = 5) for the spot. We did not confirm horizontal cell type (A type or B type; see Materials and Methods), but because both types sample from the same photoreceptors, our results demonstrate that gain control is absent at the level of photoreceptor synaptic release. This implies that gain control at the output of photoreceptors cannot explain the effect measured in bipolar cell glutamate release (i.e., as reflected by the excitatory currents in ganglion cells). Our results support the hypothesis that contrast gain control over the ganglion cell receptive field center originates in bipolar cells, either at the level of their voltage responses or at the level of synaptic release.
Discussion
We demonstrated contrast gain control in membrane currents of mammalian retinal ganglion cells (Figs. 1, 2). Gain control in subthreshold responses did not depend on intrinsic voltage- or calcium-dependent properties of ganglion cells (Figs. 2, 3), implicating a presynaptic mechanism. Voltage-clamp analysis ruled out a role of direct inhibitory synapses from amacrine cells (Figs. 3, 4). Furthermore, gain control persisted while amacrine cell synapses were blocked (Fig. 5), suggesting a mechanism in bipolar cells. Covarying the stimulation area and contrast suggested gain control in ganglion cells depends on adequate stimulation, not of ganglion cells but of bipolar cells (Fig. 6). Gain control in bipolar cells is not driven by gain control present in the synaptic release of cones, because horizontal cells, another postsynaptic target of cones, did not show gain control (Fig. 7). Our results suggest that, over the receptive field center, gain control in the subthreshold response of a ganglion cell reflects gain control of its excitatory bipolar cell inputs.
Our results do not support our initial hypothesis that gain control in ganglion cells arises from synaptic interactions with amacrine cells. This might seem surprising in light of the correlation between mammalian ganglion cell types that show strong gain control and those that receive a large degree of amacrine cell input (Shapley and Victor, 1978; Freed and Sterling, 1988; Benardete et al., 1992; Kolb and Nelson, 1993; Weber and Stanford, 1994; Jacoby et al., 1996, 2000). Our results are consistent, however, with studies in salamander, which showed that gain control in ganglion cells can be explained primarily by gain control in presynaptic bipolar cells (Kim and Rieke, 2001; Rieke, 2001).
Our findings lead to a new hypothesis about mammalian retinal circuitry: the ∼10 types of bipolar cells are likely to be distinguished from one another by their degree of gain control (Wassle, 2004). For example, primate midget (parvocellular-pathway) ganglion cells lack gain control, and this is presumably explained not by their lack of specialized amacrine cell input, but rather by a lack of gain control in their presynaptic midget bipolar cell inputs (Benardete et al., 1992). Parasol (magnocellular-pathway) ganglion cells show strong gain control, and this is presumably explained by gain control present in their presynaptic diffuse bipolar cell inputs (Jacoby et al., 1996, 2000; Benardete and Kaplan, 1999; Chander and Chichilnisky, 2001). In the cat, Y-type (α) ganglion cells show stronger gain control than X-type (β) cells (Shapley and Victor, 1978). For the ON pathway, Y-type cells collect exclusively from the b1 bipolar type, whereas X-type cells collect from b1 as well as two other types, b2 and b3 (Freed and Sterling, 1988; Cohen and Sterling, 1992). We propose that b1 cells adapt strongly, whereas b2 and b3 types adapt weakly or not at all. Thus, an X-type cell would show less adaptation than a Y-type cell because it collects partially from nonadapting bipolar inputs. Additional evidence for nonadapting bipolar cells comes from recordings of nonadapting salamander amacrine cells, which themselves must receive input from nonadapting bipolar cells (Baccus and Meister, 2002).
Two spatial mechanisms for contrast gain control in ganglion cells
Our study argues against the hypothesis that gain control is driven by a single wide-field mechanism. This hypothesis was supported by previous studies showing that adaptive signals can arise from peripheral regions of the receptive field, over several millimeters on the retina, well beyond the receptive field center (Shapley and Victor, 1979, 1981; Enroth-Cugell and Jakiela, 1980; Bonin et al., 2005). We do not dispute the original observations or the ability of the previous models to explain the data; rather, we conclude that there are (at least) two cellular mechanisms for gain control. For example, our study suggests that gain control over the receptive field center arises from a bipolar cell mechanism, but this mechanism could not explain wide-field gain control signals. Wide-field signals must arise from a distinct amacrine cell mechanism, because only amacrine cells are capable of transmitting signals over such long distances (Stafford and Dacey, 1997; Cook and McReynolds, 1998; Demb et al., 1999; Taylor, 1999; Flores-Herr et al., 2001; Volgyi et al., 2001). These amacrine cells are themselves driven by bipolar cells, and so it is not surprising that the spatial tuning of gain-control mechanisms would be similar over the ganglion cell receptive field center and periphery (Shapley and Victor, 1978, 1979).
These synaptic mechanisms for gain control would be combined with an additional intrinsic mechanism for gain control at the level of ganglion cell spike generation (Fig. 2) (Kim and Rieke, 2001; Zaghloul et al., 2005). This intrinsic mechanism, in salamander, could be explained by slow inactivation of sodium channels (Kim and Rieke, 2003). A similar mechanism may underlie the intrinsic mechanism for gain control in mammalian cells. However, if this were true, one would need to understand why certain mammalian ganglion cell types, including primate P cells, express sodium channels but nonetheless lack contrast gain control (Benardete et al., 1992). The bipolar cell mechanism depends on local contrast changes over its narrow receptive field, whereas the ganglion cell mechanism depends on its own firing rate and thus on more global contrast changes across its wide receptive field.
Bipolar cell roles in contrast gain control and slow contrast adaptation
Similar to gain control in the present study, the major component of slow contrast adaptation in ganglion cells also arises in bipolar cells (Brown and Masland, 2001; Manookin and Demb, 2006). After a period of high contrast, ganglion cells show a prominent afterhyperpolarization that could be explained primarily by reduced bipolar cell glutamate release (Baccus and Meister, 2002; Manookin and Demb, 2006). This apparent drop in glutamate release persisted while blocking amacrine cell input, suggesting that it was not driven by synaptic inhibition of bipolar terminals. However, three results suggest that this mechanism for slow adaptation differs from the present mechanism for gain control. First, gain control in the present study could be driven by a relatively low spatial frequency stimulus (spot of 0.5 mm diameter), whereas slow adaptation required a relatively high-frequency stimulus (optimal grating, ∼0.1 mm bar width) (Manookin and Demb, 2006). Furthermore, gain control was apparent in both ON and OFF cells in the present study (Fig. 2), whereas slow adaptation was prominent in OFF cells but much weaker in ON cells (Manookin and Demb, 2006). Finally, using the LN analysis, gain control can be modeled as a change in the linear filter, whereas the mechanism for slow contrast adaptation can be modeled as a tonic shift in the membrane potential (Fairhall et al., 2001; Baccus and Meister, 2002).
The next goal will be to elucidate the mechanism for contrast gain control in mammalian bipolar cells. Presently, there are several hypotheses. First, in salamander, there is evidence that bipolar cell gain control represents an intrinsic, voltage-independent mechanism at the dendrites, because (1) gain control was similar under current- and voltage-clamp conditions and (2) gain control was blocked, in OFF cells, by dialyzing the cell with a calcium buffer (Rieke, 2001); a similar mechanism in mammals may involve receptor desensitization (DeVries, 2001). Second, voltage-dependent mechanisms could induce gain control in bipolar cells (Mao et al., 1998). Finally, a gain-control mechanism could act at the point of bipolar cell synaptic release (Palmer et al., 2003a,b; Singer and Diamond, 2006; Veruki et al., 2006). Such a synaptic mechanism would explain why one study found much stronger gain control in ganglion cell membrane potential than in bipolar cells, recorded in the same preparation (Baccus and Meister, 2002). Recordings of bipolar cells in the intact mammalian retina have been extremely limited, given the difficulty in obtaining stable recordings and identifying the bipolar cell type (Dacey et al., 2000). Here, we have shown that amacrine cell signaling is not critical for gain control, and therefore one could justify further study in the mammalian retinal slice, where identification of cone-bipolar cell types is more routine (Li and DeVries, 2006).
Footnotes
This work was supported by National Institutes of Health Grants T32-EY13934, EY14454, EY07003, and EY00828. J.B.D. was supported by a Research to Prevent Blindness Career Development Award and an Alfred P. Sloan Research Fellowship. We thank Daniel Green for reading a draft of this manuscript.
References
- Akopian A, Witkovsky P. Intracellular calcium reduces light-induced excitatory post-synaptic responses in salamander retinal ganglion cells. J Physiol (Lond) 2001;532:43–53. doi: 10.1111/j.1469-7793.2001.0043g.x. [DOI] [PMC free article] [PubMed] [Google Scholar]
- Baccus SA, Meister M. Fast and slow contrast adaptation in retinal circuitry. Neuron. 2002;36:909–919. doi: 10.1016/s0896-6273(02)01050-4. [DOI] [PubMed] [Google Scholar]
- Baccus SA, Meister M. Retina versus cortex; contrast adaptation in parallel visual pathways. Neuron. 2004;42:5–7. doi: 10.1016/s0896-6273(04)00187-4. [DOI] [PubMed] [Google Scholar]
- Benardete EA, Kaplan E. The dynamics of primate M retinal ganglion cells. Vis Neurosci. 1999;16:355–368. doi: 10.1017/s0952523899162151. [DOI] [PubMed] [Google Scholar]
- Benardete EA, Kaplan E, Knight BW. Contrast gain control in the primate retina: P cells are not X-like, some M cells are. Vis Neurosci. 1992;8:483–486. doi: 10.1017/s0952523800004995. [DOI] [PubMed] [Google Scholar]
- Bonin V, Mante V, Carandini M. The suppressive field of neurons in lateral geniculate nucleus. J Neurosci. 2005;25:10844–10856. doi: 10.1523/JNEUROSCI.3562-05.2005. [DOI] [PMC free article] [PubMed] [Google Scholar]
- Bonin V, Mante V, Carandini M. The statistical computation underlying contrast gain control. J Neurosci. 2006;26:6346–6353. doi: 10.1523/JNEUROSCI.0284-06.2006. [DOI] [PMC free article] [PubMed] [Google Scholar]
- Bormann J, Hamill OP, Sakmann B. Mechanism of anion permeation through channels gated by glycine and gamma-aminobutyric acid in mouse cultured spinal neurones. J Physiol (Lond) 1987;385:243–286. doi: 10.1113/jphysiol.1987.sp016493. [DOI] [PMC free article] [PubMed] [Google Scholar]
- Brown SP, Masland RH. Spatial scale and cellular substrate of contrast adaptation by retinal ganglion cells. Nat Neurosci. 2001;4:44–51. doi: 10.1038/82888. [DOI] [PubMed] [Google Scholar]
- Carandini M, Demb JB, Mante V, Tolhurst DJ, Dan Y, Olshausen BA, Gallant JL, Rust NC. Do we know what the early visual system does? J Neurosci. 2005;25:10577–10597. doi: 10.1523/JNEUROSCI.3726-05.2005. [DOI] [PMC free article] [PubMed] [Google Scholar]
- Chander D, Chichilnisky EJ. Adaptation to temporal contrast in primate and salamander retina. J Neurosci. 2001;21:9904–9916. doi: 10.1523/JNEUROSCI.21-24-09904.2001. [DOI] [PMC free article] [PubMed] [Google Scholar]
- Chichilnisky EJ. A simple white noise analysis of neuronal light responses. Network. 2001;12:199–213. [PubMed] [Google Scholar]
- Cohen E, Sterling P. Parallel circuits from cones to the On-beta ganglion cell. Eur J Neurosci. 1992;4:506–520. doi: 10.1111/j.1460-9568.1992.tb00901.x. [DOI] [PubMed] [Google Scholar]
- Cohen ED. Light-evoked excitatory synaptic currents of X-type retinal ganglion cells. J Neurophysiol. 2000;83:3217–3229. doi: 10.1152/jn.2000.83.6.3217. [DOI] [PubMed] [Google Scholar]
- Cook PB, McReynolds JS. Lateral inhibition in the inner retina is important for spatial tuning of ganglion cells. Nat Neurosci. 1998;1:714–719. doi: 10.1038/3714. [DOI] [PubMed] [Google Scholar]
- Dacey D, Packer OS, Diller L, Brainard D, Peterson B, Lee B. Center surround receptive field structure of cone bipolar cells in primate retina. Vision Res. 2000;40:1801–1811. doi: 10.1016/s0042-6989(00)00039-0. [DOI] [PubMed] [Google Scholar]
- Dacey DM, Lee BB, Stafford DK, Pokorny J, Smith VC. Horizontal cells of the primate retina: cone specificity without spectral opponency. Science. 1996;271:656–659. doi: 10.1126/science.271.5249.656. [DOI] [PubMed] [Google Scholar]
- Demb JB. Multiple mechanisms for contrast adaptation in the retina. Neuron. 2002;36:781–783. doi: 10.1016/s0896-6273(02)01100-5. [DOI] [PubMed] [Google Scholar]
- Demb JB, Haarsma L, Freed MA, Sterling P. Functional circuitry of the retinal ganglion cell's nonlinear receptive field. J Neurosci. 1999;19:9756–9767. doi: 10.1523/JNEUROSCI.19-22-09756.1999. [DOI] [PMC free article] [PubMed] [Google Scholar]
- Demb JB, Zaghloul K, Haarsma L, Sterling P. Bipolar cells contribute to nonlinear spatial summation in the brisk-transient (Y) ganglion cell in mammalian retina. J Neurosci. 2001;21:7447–7454. doi: 10.1523/JNEUROSCI.21-19-07447.2001. [DOI] [PMC free article] [PubMed] [Google Scholar]
- DeVries SH. Exocytosed protons feedback to suppress the Ca2+ current in mammalian cone photoreceptors. Neuron. 2001;32:1107–1117. doi: 10.1016/s0896-6273(01)00535-9. [DOI] [PubMed] [Google Scholar]
- Enroth-Cugell C, Jakiela HG. Suppression of cat retinal ganglion cell responses by moving patterns. J Physiol (Lond) 1980;302:49–72. doi: 10.1113/jphysiol.1980.sp013229. [DOI] [PMC free article] [PubMed] [Google Scholar]
- Fairhall AL, Lewen GD, Bialek W, de Ruyter Van Steveninck RR. Efficiency and ambiguity in an adaptive neural code. Nature. 2001;412:787–792. doi: 10.1038/35090500. [DOI] [PubMed] [Google Scholar]
- Flores-Herr N, Protti DA, Wassle H. Synaptic currents generating the inhibitory surround of ganglion cells in the mammalian retina. J Neurosci. 2001;21:4852–4863. doi: 10.1523/JNEUROSCI.21-13-04852.2001. [DOI] [PMC free article] [PubMed] [Google Scholar]
- Freed MA, Sterling P. The ON-alpha ganglion cell of the cat retina and its presynaptic cell types. J Neurosci. 1988;8:2303–2320. doi: 10.1523/JNEUROSCI.08-07-02303.1988. [DOI] [PMC free article] [PubMed] [Google Scholar]
- Hochstein S, Shapley RM. Linear and nonlinear spatial subunits in Y cat retinal ganglion cells. J Physiol (Lond) 1976;262:265–284. doi: 10.1113/jphysiol.1976.sp011595. [DOI] [PMC free article] [PubMed] [Google Scholar]
- Jacoby R, Stafford D, Kouyama N, Marshak D. Synaptic inputs to ON parasol ganglion cells in the primate retina. J Neurosci. 1996;16:8041–8056. doi: 10.1523/JNEUROSCI.16-24-08041.1996. [DOI] [PMC free article] [PubMed] [Google Scholar]
- Jacoby RA, Wiechmann AF, Amara SG, Leighton BH, Marshak DW. Diffuse bipolar cells provide input to OFF parasol ganglion cells in the macaque retina. J Comp Neurol. 2000;416:6–18. doi: 10.1002/(sici)1096-9861(20000103)416:1<6::aid-cne2>3.0.co;2-x. [DOI] [PMC free article] [PubMed] [Google Scholar]
- Kim KJ, Rieke F. Temporal contrast adaptation in the input and output signals of salamander retinal ganglion cells. J Neurosci. 2001;21:287–299. doi: 10.1523/JNEUROSCI.21-01-00287.2001. [DOI] [PMC free article] [PubMed] [Google Scholar]
- Kim KJ, Rieke F. Slow Na+ inactivation and variance adaptation in salamander retinal ganglion cells. J Neurosci. 2003;23:1506–1516. doi: 10.1523/JNEUROSCI.23-04-01506.2003. [DOI] [PMC free article] [PubMed] [Google Scholar]
- Kolb H, Nelson R. OFF-alpha and OFF-beta ganglion cells in cat retina: II. Neural circuitry as revealed by electron microscopy of HRP stains. J Comp Neurol. 1993;329:85–110. doi: 10.1002/cne.903290107. [DOI] [PubMed] [Google Scholar]
- Lankheet MJ, Prickaerts JH, van de Grind WA. Responses of cat horizontal cells to sinusoidal gratings. Vision Res. 1992;32:997–1008. doi: 10.1016/0042-6989(92)90001-y. [DOI] [PubMed] [Google Scholar]
- Li W, DeVries SH. Bipolar cell pathways for color and luminance vision in a dichromatic mammalian retina. Nat Neurosci. 2006;9:669–675. doi: 10.1038/nn1686. [DOI] [PubMed] [Google Scholar]
- MacNeil MA, Masland RH. Extreme diversity among amacrine cells: implications for function. Neuron. 1998;20:971–982. doi: 10.1016/s0896-6273(00)80478-x. [DOI] [PubMed] [Google Scholar]
- Manookin MB, Demb JB. Presynaptic mechanism for slow contrast adaptation in mammalian retinal ganglion cells. Neuron. 2006;50:453–464. doi: 10.1016/j.neuron.2006.03.039. [DOI] [PubMed] [Google Scholar]
- Mante V, Frazor RA, Bonin V, Geisler WS, Carandini M. Independence of luminance and contrast in natural scenes and in the early visual system. Nat Neurosci. 2005;8:1690–1697. doi: 10.1038/nn1556. [DOI] [PubMed] [Google Scholar]
- Mao BQ, MacLeish PR, Victor JD. The intrinsic dynamics of retinal bipolar cells isolated from tiger salamander. Vis Neurosci. 1998;15:425–438. doi: 10.1017/s0952523898153051. [DOI] [PubMed] [Google Scholar]
- Palmer MJ, Taschenberger H, Hull C, Tremere L, von Gersdorff H. Synaptic activation of presynaptic glutamate transporter currents in nerve terminals. J Neurosci. 2003a;23:4831–4841. doi: 10.1523/JNEUROSCI.23-12-04831.2003. [DOI] [PMC free article] [PubMed] [Google Scholar]
- Palmer MJ, Hull C, Vigh J, von Gersdorff H. Synaptic cleft acidification and modulation of short-term depression by exocytosed protons in retinal bipolar cells. J Neurosci. 2003b;23:11332–11341. doi: 10.1523/JNEUROSCI.23-36-11332.2003. [DOI] [PMC free article] [PubMed] [Google Scholar]
- Rieke F. Temporal contrast adaptation in salamander bipolar cells. J Neurosci. 2001;21:9445–9454. doi: 10.1523/JNEUROSCI.21-23-09445.2001. [DOI] [PMC free article] [PubMed] [Google Scholar]
- Robertson B. Characteristics of GABA-activated chloride channels in mammalian dorsal root ganglion neurones. J Physiol (Lond) 1989;411:285–300. doi: 10.1113/jphysiol.1989.sp017574. [DOI] [PMC free article] [PubMed] [Google Scholar]
- Roska B, Werblin F. Rapid global shifts in natural scenes block spiking in specific ganglion cell types. Nat Neurosci. 2003;6:600–608. doi: 10.1038/nn1061. [DOI] [PubMed] [Google Scholar]
- Shapley RM, Victor JD. The effect of contrast on the transfer properties of cat retinal ganglion cells. J Physiol (Lond) 1978;285:275–298. doi: 10.1113/jphysiol.1978.sp012571. [DOI] [PMC free article] [PubMed] [Google Scholar]
- Shapley RM, Victor JD. Nonlinear spatial summation and the contrast gain control of cat retinal ganglion cells. J Physiol (Lond) 1979;290:141–161. doi: 10.1113/jphysiol.1979.sp012765. [DOI] [PMC free article] [PubMed] [Google Scholar]
- Shapley RM, Victor JD. How the contrast gain control modifies the frequency responses of cat retinal ganglion cells. J Physiol (Lond) 1981;318:161–179. doi: 10.1113/jphysiol.1981.sp013856. [DOI] [PMC free article] [PubMed] [Google Scholar]
- Singer JH, Diamond JS. Vesicle depletion and synaptic depression at a mammalian ribbon synapse. J Neurophysiol. 2006;95:3191–3198. doi: 10.1152/jn.01309.2005. [DOI] [PubMed] [Google Scholar]
- Solomon SG, Peirce JW, Dhruv NT, Lennie P. Profound contrast adaptation early in the visual pathway. Neuron. 2004;42:155–162. doi: 10.1016/s0896-6273(04)00178-3. [DOI] [PubMed] [Google Scholar]
- Stafford DK, Dacey DM. Physiology of the A1 amacrine: a spiking, axon-bearing interneuron of the macaque monkey retina. Vis Neurosci. 1997;14:507–522. doi: 10.1017/s0952523800012165. [DOI] [PubMed] [Google Scholar]
- Taylor WR. TTX attenuates surround inhibition in rabbit retinal ganglion cells. Vis Neurosci. 1999;16:285–290. doi: 10.1017/s0952523899162096. [DOI] [PubMed] [Google Scholar]
- Troy JB, Enroth-Cugell C. X and Y ganglion cells inform the cat's brain about contrast in the retinal image. Exp Brain Res. 1993;93:383–390. doi: 10.1007/BF00229354. [DOI] [PubMed] [Google Scholar]
- Vaney DI. The mosaic of amacrine cells in the mammalian retina. In: Osborne NN, Chader G, editors. Progress in retinol research. Vol 9. Oxford: Pergamon; 1990. pp. 49–100. [Google Scholar]
- Veruki ML, Morkve SH, Hartveit E. Activation of a presynaptic glutamate transporter regulates synaptic transmission through electrical signaling. Nat Neurosci. 2006;9:1388–1396. doi: 10.1038/nn1793. [DOI] [PubMed] [Google Scholar]
- Victor JD. The dynamics of the cat retinal X cell centre. J Physiol (Lond) 1987;386:219–246. doi: 10.1113/jphysiol.1987.sp016531. [DOI] [PMC free article] [PubMed] [Google Scholar]
- Volgyi B, Xin D, Amarillo Y, Bloomfield SA. Morphology and physiology of the polyaxonal amacrine cells in the rabbit retina. J Comp Neurol. 2001;440:109–125. doi: 10.1002/cne.1373. [DOI] [PubMed] [Google Scholar]
- Walraven J, Enroth-Cugell C, Hood DC, Macleod DI, Schnapf JL. The control of visual sensitivity: receptoral and postreceptoral processes. In: Spillmann L, Werner JS, editors. Visual perception: the neurophysiological foundations. San Diego: Academic; 1990. pp. 53–101. [Google Scholar]
- Wassle H. Parallel processing in the mammalian retina. Nat Rev Neurosci. 2004;5:747–757. doi: 10.1038/nrn1497. [DOI] [PubMed] [Google Scholar]
- Weber AJ, Stanford LR. Synaptology of physiologically identified ganglion cells in the cat retina: a comparison of retinal X- and Y-cells. J Comp Neurol. 1994;343:483–499. doi: 10.1002/cne.903430310. [DOI] [PubMed] [Google Scholar]
- Yin L, Smith RG, Sterling P, Brainard DH. Chromatic properties of horizontal and ganglion cell responses follow a dual gradient in cone opsin expression. J Neurosci. 2006;26:12351–12361. doi: 10.1523/JNEUROSCI.1071-06.2006. [DOI] [PMC free article] [PubMed] [Google Scholar]
- Zaghloul KA, Boahen K, Demb JB. Different circuits for ON and OFF retinal ganglion cells cause different contrast sensitivities. J Neurosci. 2003;23:2645–2654. doi: 10.1523/JNEUROSCI.23-07-02645.2003. [DOI] [PMC free article] [PubMed] [Google Scholar]
- Zaghloul KA, Boahen K, Demb JB. Contrast adaptation in subthreshold and spiking responses of mammalian Y-type retinal ganglion cells. J Neurosci. 2005;25:860–868. doi: 10.1523/JNEUROSCI.2782-04.2005. [DOI] [PMC free article] [PubMed] [Google Scholar]