

Abstract
Glutamate uptake by astrocytes is fundamentally important in the regulation of CNS function. Disruption of uptake can lead to excitotoxicity and is implicated in various neurodegenerative processes as well as a consequence of hypoxic/ischemic events. Here, we investigate the effect of hypoxia on activity and expression of the key glutamate transporters excitatory amino acid transporter 1 (EAAT1) [GLAST (glutamate-aspartate transporter)] and EAAT2 [GLT-1 (glutamate transporter 1)]. Electrogenic, Na+-dependent glutamate uptake was monitored via whole-cell patch-clamp recordings from cortical astrocytes. Under hypoxic conditions (2.5 and 1% O2 exposure for 24 h), glutamate uptake was significantly reduced, and pharmacological separation of uptake transporter subtypes suggested that the EAAT2 subtype was preferentially reduced relative to the EAAT1. This suppression was confirmed at the level of EAAT protein expression (via Western blots) and mRNA levels (via real-time PCR). These effects of hypoxia to inhibit glutamate uptake current and EAAT protein levels were not replicated by desferrioxamine, cobalt, FG0041, or FG4496, agents known to mimic effects of hypoxia mediated via the transcriptional regulator, hypoxia-inducible factor (HIF). Furthermore, the effects of hypoxia were not prevented by topotecan, which prevents HIF accumulation. In stark contrast, inhibition of nuclear factor-κB (NF-κB) with SN50 fully prevented the effects of hypoxia on glutamate uptake and EAAT expression. Our results indicate that prolonged hypoxia can suppress glutamate uptake in astrocytes and that this effect requires activation of NF-κB but not of HIF. Suppression of glutamate uptake via this mechanism may be an important contributory factor in hypoxic/ischemic triggered glutamate excitotoxicity.
Keywords: glia, glutamate transport, hypoxia, patch clamp, astrocyte, transcription
Introduction
Evidence emerging within the last decade has shown that astrocytes serve multiple, previously unrecognized roles within the CNS to ensure neuronal activity is optimized. Such activities include regulation of local blood flow (Zonta et al., 2003), synaptic activity (Araque et al., 2001; Volterra and Steinhauser, 2004), and glutamate release (Bezzi et al., 2004; Chen et al., 2005). However, the most fundamental and best described role is the uptake of glutamate to prevent tonic activation of synaptic receptors and aid in the prevention of excitotoxicity (Bergles and Jahr, 1997; Anderson and Swanson, 2000; Carmignoto, 2000; Fellin et al., 2006). To date, five distinct high-affinity, Na+-dependent glutamate transporters have been identified to serve this purpose: excitatory amino acid transporter 1 (EAAT1) [GLAST (glutamate-aspartate transporter)] and EAAT2 [glutamate transporter 1 (GLT-1)], which are predominantly expressed in astrocytes, along with EAAT3 [EAAC1 (excitatory amino acid carrier 1)], EAAT4, and EAAT5, which are expressed in neurones (for review, see Sims and Robinson, 1999). Of the astrocyte glutamate transporters, EAAT1 predominates in the cerebellum and EAAT2 in the cerebral cortex and hippocampus (Lehre et al., 1995; Lehre and Danbolt, 1998), and splice variants of these subtypes add to the complexity of this family of transporters (Danbolt, 2001; Schmitt et al., 2002; Rozyczka and Engele, 2005).
Disruption of electrogenic glutamate uptake has been implicated in several neurodegenerative diseases (Harris et al., 1996; Springer et al., 1997; Lin et al., 1998; Rossi et al., 2000). For example, amyotrophic lateral sclerosis has been linked to reduced levels of the GLT protein (Milton et al., 1997; Maragakis and Rothstein, 2004), although this is not uncontested (Fray et al., 1998). EAAT2 protein levels are reduced in the brain in various models of central ischemia and/or trauma (Torp et al., 1995; Martin et al., 1997; Rao et al., 1998; Raghavendra et al., 2000; Rebel et al., 2005). In contrast, the expression of EAAT1 and EAAT3 has been reported as either decreased (Martin et al., 1997; Fujita et al., 1999) or increased (Yan et al., 1998; Gottlieb et al., 2000; Tao et al., 2001). That these results are not consistent is possibly attributable to the variety of animal models used, coupled with the fact that glutamate transporter proteins are regulated at various levels (e.g., DNA transcription, mRNA splicing) (Gegelashvili and Schousboe, 1998).
Hypoxia and/or ischemia can induce the release of several neurotransmitters (Nilsson and Lutz, 1991; Richter et al., 1997), including glutamate (Nicholls and Attwell, 1990). Such increased levels of glutamate, and the subsequent activation of ionotropic NMDA receptors, are primarily responsible for neuronal damage that occurs as a consequence of ischemic or hypoxic episodes (Simon et al., 1984; Rothman and Olney, 1986; Sattler et al., 2000). Glutamate homeostasis is therefore pivotal to prevent neuronal death after hypoxic/ischemic episodes. However, to date, the effects of hypoxia/ischemia on glutamate transporters have not been studied in detail. Here, we investigate the effects of chronic hypoxia on glutamate uptake and suggest that glutamate transporter expression is directly downregulated by hypoxia.
Materials and Methods
Cell culture.
To obtain primary cultures of astrocytes, cerebral cortices were removed from 6- to 8-d-old Wistar rats and placed in ice-cold PBS containing the following: 10 mm NaH2PO4, 2.7 mm KCl, 137 mm NaCl, 14 mm glucose, 1.5 mm MgSO4, and 3 mg/ml bovine serum albumin. Meninges were removed and cortices were minced with a mechanical tissue chopper (McIlwain; Vibratome Company, St. Louis, MO) and dispersed into the same buffer containing 0.25 μg/ml trypsin, at 37°C for 15 min. Trypsin digestion was halted by the addition of an equal volume of buffer supplemented with 16 μg/ml soy bean trypsin inhibitor (type I-S; Sigma, Poole, Dorset, UK), 0.5 μg/ml DNase I (EC 3.1.21.1 type II from bovine pancreas; 125 kU/ml; Sigma, St. Louis, MO) and 1.5 mm MgSO4. The digested tissue was then pelleted by centrifugation at 1300 rpm (1000 × g) for 1 min, and the supernatant was poured off before resuspending the cell pellet in 2 ml of buffer solution containing 100 μg/ml soy bean trypsin inhibitor, 0.5 μg/ml DNase I, and 1.5 mm MgSO4. Tissue was subsequently triturated gently three times with a fire-polished Pasteur pipette. After allowing larger pieces of tissue to settle for 5 min, the cloudy cell suspension was pipetted off into media. The culture medium consisted of Eagle's minimal essential medium supplemented with 10% fetal calf serum (v/v) and 1% (v/v) penicillin-streptomycin (Invitrogen, Paisley, UK). The cell suspension was then aliquoted into 75 cm2 flasks and also onto glass coverslips in six-well tissue culture plates. Cells were then kept in a humidified incubator at 37°C (95% air; 5% CO2). Only primary cell cultures were used. Four to 6 h after plating, cells were washed with fresh media to remove nonadhered cells. This resulted in a culture of primarily type I cortical astrocytes as confirmed by glial fibrillary acidic protein immunohistochemistry (data not shown). Culture medium was exchanged every 7 d and cells were grown in culture for up to 14 d. All recordings were made from cells between days 7–14. In some cases, cells were exposed to various degrees of chronic hypoxia; they were subcultured in an identical way to control cells but, 24 h before experimentation, were transferred to a humidified incubator equilibrated with 2.5% O2, 5% CO2, and 2.5% N2, or 1% O2, 5% CO2, and 2.5% N2. Please note these levels of hypoxia reflect cellular O2 levels and should not be confused with levels of hypoxia reported as inspired in whole-organism studies. Corresponding control cells were maintained in a 95% air, 5% CO2 incubator for the same period.
Electrophysiology.
Fragments of coverslip with attached cells were transferred to a continuously perfused (3–5 ml/min) recording chamber mounted on the stage of an Olympus (Tokyo, Japan) CK40 inverted microscope. Whole-cell patch-clamp recordings were then obtained, and astrocytes were voltage-clamped at −70 mV. The standard perfusate, pH 7.4, was composed of the following (in mm): 150 NaCl, 5 KCl, 2 MgCl2, 10 HEPES, 2 CaCl2, and 10 d-glucose. To evoke excitatory amino acid induced currents, d-glutamate and l-aspartate (both from Sigma) were added at the given concentrations to the perfusate. To investigate the Na+ dependence of the currents recorded, Na+ in the extracellular solution was replaced with choline (150 mm). Patch pipettes had resistances of 5–6 MΩ, and tight seals were obtained before breaking into the whole-cell configuration. Series resistance was periodically monitored throughout the duration of experiments, and if a significant increase occurred (>20%), the experiment was terminated. The intracellular solution, pH 7.25, consisted of the following (in mm): 140 KA (in which A is SCN−, NO3−, or CH3O3S−), 5 EGTA, 1 MgCl2, 0.5 CaCl2, 10 HEPES, 3 MgATP, and 0.3 NaGTP. Signals were acquired using a Multiclamp 700A amplifer (Molecular Devices, Foster City, CA) controlled by Clampex 9.0 software via a Digidata 1322A interface (Molecular Devices). 6-Nitro-7-sulfamoylbenzo(f)quinoxaline-2,3-dione (NBQX), AP-5, (R,S)-α-methyl-4-carboxyphenylglycine (MCPG), l-threo-β-benzyloxyaspartate (l-TBOA), and dihydrokainic acid (DHK) (all from Tocris, Bristol, UK) were prepared as stock solutions and frozen. They were diluted to the given concentration in the extracellular solution and applied to the bathing medium. For the nuclear factor-κB (NF-κB) experiments, SN50, SN50M (Calbiochem, La Jolla, CA), and caffeic acid phenethyl ester (CAPE) (Biomol, Plymouth Meeting, PA) were made as stocks and added to the culture media to give a final concentration as stated. Off-line analysis was performed using the data analysis package Clampfit 9 (Molecular Devices), and data are expressed as mean ± SEM. Values of p are from two-tailed Student's t test, where p < 0.05 was considered significant.
Western blotting.
For Western blotting, astrocytes were grown to confluence as detailed above in 75 cm2 flasks, washed free of media in ice-cold PBS, and then lysed in 800 μl of M-PER mammalian protein extraction reagent (Perbio Science, Tattenhall, Cheshire, UK) containing Complete Mini protease inhibitors (Roche Diagnostics, Lewes, East Sussex, UK). Protein levels of the cell lysates were then determined using a BCA assay kit according to the manufacturer's instructions (Pierce, Rockford, IL). A total of 25 μl of sample buffer [125 mm Tris-HCl, pH 6.8, 2% (w/v) SDS, 20% (w/v) glycerol, 20 μg/μl bromophenol blue, and 10% β-mercaptoethanol] was then added to 50 μl of each cell lysate. Samples (10–20 μg of protein) were then loaded onto 12.5%, 0.75-mm-thick polyacrylamide-SDS gels and separated at 36 mA for 1 h before being transferred onto polyvinyl difluoride membranes (30 V overnight). Membranes were blocked with 5% nonfat milk protein in PBS-Tween (0.05%) for 1 h and immunostained with antibodies raised against the C termini of rat EAAT1 (Abcam, Cambridge, UK; raised in rabbit against a 16 aa sequence), EAAT2 (Abcam; raised in rabbit against a 20 aa sequence), and EAAT3 (Alpha Diagnostic, San Antonio, TX; raised in rabbit against a 14 aa sequence). All antibodies were used at 1:1000 dilution for 3 h. Blots were then washed and incubated with anti-rabbit Ig conjugated to horseradish peroxidase (1:2000; Amersham Biosciences, Little Chalfont, Bucks, UK), and bands were visualized using the enhanced chemiluminescence (ECL) detection system and hyperfilm ECL (Amersham Biosciences). Band intensities were measured using the Scion Image analysis software. Full-length immunoblots for EAAT1 and EAAT2 can be viewed in the supplemental figure (available at www.jneurosci.org as supplemental material).
Real-time PCR.
Total RNA was extracted from cells using an Aurum RNA isolation kit (Bio-Rad, Hertfordshire, UK), according to the manufacturer's instructions. One microliter of total RNA was reverse transcribed using an iScript cDNA synthesis kit and random primers (Bio-Rad). Real-time PCR was performed using the ABI 7500 sequence detection system (Applied Biosystems, Foster City, CA) and gene-specific primers and TaqMan probes. Probes to EAAT1 (Rn00570130; Applied Biosystems), EAAT2 (Rn00568080; Applied Biosystems), and β-actin (Rn006967869; Applied Biosystems; for an endogenous control) were used. Reactions for each cDNA were performed in duplicate and were set up in a reaction volume of 20 μl containing TaqMan Universal PCR Master Mix (Applied Biosystems). The PCR program consisted of 50 cycles, each cycle consisting of a denaturation step at 95°C for 15 s followed by 60°C for 1 min to allow extension and amplification of the target sequence. At this point, fluorescence was measured. Experiments were repeated with the cDNA from three different brains, using a minimum of three flasks for each animal. Data were analyzed using the ABI 7500 sequence detection system software. The amount of EAAT1 and EAAT2 mRNA in normoxic and hypoxic conditions were normalized to β-actin and determined relative to a normoxic calibrator using the ΔΔCT method.
Immunocytochemistry.
Astrocytes were rinsed three times with PBS and then fixed with 4% paraformaldehyde in 0.1 m phosphate buffer for 20 min. They were then washed three times in PBS before incubation in primary antibodies raised in mouse against the C termini of EAAT1, -2, or -3 (Novocastra, Newcastle, UK; 1:20 in PBS and 0.1% Triton X-100) for 1 h at room temperature (21–24°C). The coverslips were then washed in PBS, incubated with a biotinylated anti-mouse antibody (1:250 in PBS; Jackson ImmunoResearch, West Grove, PA) for 2 h, washed in PBS, and then incubated in streptavidin ALEXA555 (1:1000 in PBS; Invitrogen) for 1 h. The coverslips were mounted onto glass slides using Vectashieid mounting medium (Vector Laboratories, Burlingame, CA), and the edges were sealed with nail varnish. Slides were viewed under a Zeiss (Oberkochen, Germany) Axioskop microscope equipped with epifluorescence, and images were captured using an Aquis digital imaging system (Synoptics, Cambridge, UK). Images were taken for each condition using the same brightness, gamma, and contrast settings.
For the NF-κB studies, incubation with was overnight at 4°C using primary antibody raised in rabbit against p65 subunit (Santa Cruz Biotechnologies, Santa Cruz, CA; 1:200). Coverslips were then washed three times in PBS and incubated for 1 h at room temperature with anti-rabbit secondary antibody conjugated to Alexa Fluor 488 (1:1000 in PBS). Slides were then mounted on glass slides using Vectashield mounting medium containing 4′,6′-diamidino-2-phenylindole (DAPI) (Vector Laboratories), and the edges were sealed with nail varnish. Cells were examined on a Zeiss laser-scanning confocal microscope (LSM 510). Fluaphores were excited by sequential scanning with argon and UV lasers, and the composite images were produced using Zeiss AIM software.
Statistical analyses.
Results are expressed as the mean ± SEM of n experiments. Where there were several experimental groups, significance was determined by one-way ANOVA followed by Dunnett's test. Where two groups were involved, significance was determined using two-tailed unpaired t test. Statistical significance was considered at p < 0.05.
Results
Electrogenic, Na+-dependent glutamate uptake in primary cultures of astrocytes
Whole-cell patch-clamp recordings, using SCN− as the permeant anion, were obtained from type I cortical astrocytes cultured under normoxic conditions (mean capacitance, 16.1 ± 0.4 pF; input resistance, 43.7 ± 7.3 MΩ; n = 67). In the presence of the ionotropic (20 μm NBQX and 100 μm AP-5) and metabotropic (1 mm MCPG) glutamate receptor antagonists, bath application of 10 μm l-glutamate induced an inward current of mean amplitude −447.2 ± 29.5 pA (holding potential, −70 mV) in 92% (72 of 78) of these astrocytes (Fig. 1A), corresponding to a glutamate-induced current density of −28.9 ± 1.3 pA/pF (Fig. 1D,F). When Na+ was replaced by choline in the extracellular solution, glutamate failed to produced an inward current (Fig. 1A) (representative of 10 such experiments). Exposure of cells to 10 μm d-glutamate also failed to generate inward current (n = 8) (data not shown). The amplitude of glutamate-evoked currents also displayed pronounced voltage dependence (Fig. 1B). The amplitude of inward currents generated by glutamate uptake under these experimental conditions relies on anion efflux, and so is influenced by anion species. In accordance with others (Wadiche et al., 1995), inclusion of thiocyanate SCN− within the patch pipette amplified the transporter current because of its high permeability to the anion pore associated with the transporter. Similarly, less permeant anions (NO3− and MES) showed a smaller glutamate-induced current density (Fig. 1C,D). All of these properties indicate that the inward current recorded was carried by Na+-dependent glutamate transporters.
Figure 1.
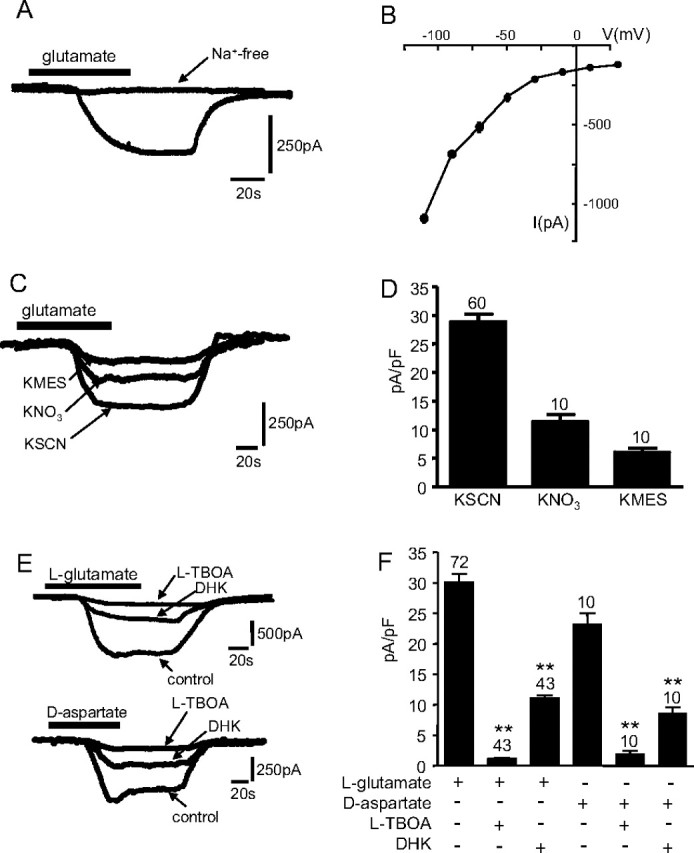
A, Example inward current evoked by exposure of an astrocyte to 10 μm l-glutamate (applied for the period indicated by the horizontal bar). Also shown is a representative trace of a lack of inward current evoked by glutamate in the absence of extracellular Na+ (replaced with choline). Holding potential, −70 mV. Calibration applies to both traces. B, Current–voltage relationships evoked in astrocytes by application of 10 μm glutamate. Each point plots mean current (±SEM), taken from six to nine cells in each case. C, Example currents recorded as in A with extracellular Na+ present, using equimolar amounts of the various permeant anions indicated in the pipette solution. Calibration applies to all traces. D, Mean (with SEM error bars, taken from number of cells indicated above each error bar) inward current densities evoked by glutamate in the presence of the different anions. E, Top traces, Examples of glutamate-evoked currents recorded in the absence (control) or presence of 100 μm TBOA or 500 μm DHK, as indicated. Calibration applies to all traces. Bottom traces, As top, except that inward currents were evoked by d-aspartate rather than glutamate. Calibration applies to all traces. F, Mean (with SEM error bars, taken from number of cells indicated above each error bar) inward current densities evoked by 10 μm glutamate (open bars) or 10 μm aspartate (solid bars) in the absence or presence of uptake inhibitors TBOA (100 μm) or DHK (500 μm). *p < 0.05, **p < 0.01 compared with respective controls; unpaired t test.
The relative contributions of individual transporters to the whole-cell, glutamate-evoked current was investigated using available pharmacological tools and SCN− as the anion in the patch pipette. Bath application of the nonselective inhibitor l-TBOA at a supramaximal concentration of 100 μm significantly reduced current density by >90%, from −26.4 ± 6.3 to −2.1 ± 0.2 pA/pF (n = 43; p < 0.001) (Fig. 1C,E). This further supported the conclusion that the glutamate-induced inward currents arose because of electrogenic glutamate uptake. To determine the contribution of EAAT2 to the sodium-dependent transporter current, the glutamate-induced current was measured in the presence of DHK. DHK inhibits the EAAT subtypes to varying degrees: EAAT1, IC50 of >10 mm; EAAT2, IC50 of 10–50 μm; EAAT3, IC50 of 1.2 mm (Garlin et al., 1995; Dowd et al., 1996). For these studies, EAAT2 contribution was evaluated using DHK at a concentration of 500 μm. Bath application of DHK before application of glutamate only partially reduced current amplitudes, to −13.2 ± 0.7 pA/pF (n = 43; p < 0.001) (Fig. 1E,F). We estimated (using the degree of blockade observed with DHK as an indicator of EAAT2 activity and TBOA as an indicator of total transporter activity) that ∼53% of current was attributable to transport of glutamate via EAAT2, whereas the EAAT1 and EAAT3 subtypes contribute 46% (Fig. 1F). Given the discrepancies in the IC50 values depending on system used, we also performed experiments using different concentrations of agonist and antagonist to verify the contribution of EAAT subtypes. Using 0.5 mm glutamate and 300 μm DHK, we observed similar contributions for the DHK-sensitive and -insensitive component (DHK sensitive, 55.8%; DHK insensitive, 43.1%), although a contribution from an as-yet-unidentified DHK-sensitive glutamate transporter cannot be ruled out.
Previous studies indicate that different excitatory amino acids have been shown to elicit transporter currents with different kinetics (Bergles and Jahr, 1997; Wadiche and Kavanaugh, 1998). d-Aspartate-induced currents show a larger steady-state component than l-glutamate-evoked currents if the transporter subtype involved is EAAT1. However, in EAAT2-expressing cells, d-aspartate and l-glutamate induce transporter currents with similar magnitude (Bergles et al., 1997, 2002; Bergles and Jahr, 1998; Glowatzki et al., 2006). Therefore, to provide additional evidence of the contribution of EAAT1 and EAAT2, we examined the d-aspartate-induced currents in our cortical astrocytes. Under normoxic conditions, d-aspartate (10 μm) evoked a current density of similar magnitude as l-glutamate (23.8 ± 4.1 pA/pF; n = 10), of which 46% was blocked by the EAAT2 antagonist DHK (500 μm) (Fig. 1E, bottom traces; F).
EAAT3 transports cysteine with a greater affinity than the EAAT1 transporter subtype (Aoyama et al., 2006), so to try and discriminate between EAAT1 and EAAT3, we examined cysteine uptake. Exposure of cells to 10 mm cysteine evoked currents of mean density 3.6 ± 0.9 pA/pF (n = 15). These were almost completely abolished by TBOA (100 μm; 0.3 ± 0.03 pA/pF; p < 0.05) or by DHK (500 μm; 0.3 ± 0.05; p < 0.05), suggesting that EAAT2 is the predominant transporter subtype involved in cysteine uptake in cortical astrocytes. These data are in general agreement with known contributions of both EAAT1 and EAAT2 to glutamate uptake in the cortex (Rothstein et al., 1994).
Chronic hypoxic reduces the glutamate transporter current
To investigate any potential modulation of glutamate uptake by chronic hypoxia, we exposed cells for 24 h either to normoxia (21% O2) or to two levels of hypoxia: 2.5% O2 and 1% O2. Such exposure had no significant effect on cell capacitance (2.5% O2, 18.2 ± 0.8 pF, n = 26; 1% O2, 16.9 ± 1.1 pF, n = 28; p > 0.05) or input resistance (2.5% O2, 39.1 ± 8.3 MΩ, n = 14; 1% O2, 42.6 ± 5.5 MΩ, n = 13; p > 0.05). However, glutamate-evoked current density was significantly reduced after exposure to chronic hypoxia for 24 h (Fig. 2A). A study of the time course of the effects of hypoxia (1% O2) revealed that significant reductions in current density were only apparent after 16 h (p < 0.05) and were maximal at 24 h with no additional reduction at the 48 h time point (Fig. 2B). As in normoxically cultured astrocytes, 100 μm l-TBOA almost fully abolished currents evoked by glutamate in both groups of hypoxic cells (i.e., 2.5 and 1% O2) (Fig. 2C,D), again indicating that this current was mediated by glutamate transport. For cells cultured in 2.5% O2, application of the EAAT2 selective blocker, DHK (500 μm), revealed partial inhibition (Fig. 2C,E) similar to that observed in normoxically cultured cells (Fig. 1). The degree of inhibition suggested that the relative contributions of EAAT2 (55%) and EAAT1 (41%) are similar under these hypoxic conditions when compared with normoxic cells. In contrast, in astrocytes cultured for 24 h in 1% O2, DHK (500 μm) only reduced glutamate-evoked current by ∼14% (Fig. 2D), suggesting that the EAAT2-mediated component of glutamate transport was more severely impaired by hypoxia than the component attributable to EAAT1. Given this observed preferential suppression of EAAT2 activity under severe hypoxia, we sought to provide additional evidence using d-aspartate as the agonist for transport activity. The d-aspartate-evoked current density was significantly reduced when cells were exposed to hypoxia (1%; −15.7 ± 1.6 pA/pF; n = 10; p < 0.05, when compared with normoxic controls). However, when compared with the glutamate-evoked current density under hypoxia, the aspartate current density was larger. This observation suggests an alteration in the contribution of the EAAT subtypes to the transporter current in severe hypoxia. The greater aspartate-induced current density suggests an increased contribution from the EAAT1 subtype under hypoxia in comparison with normoxia. To investigate whether this suppression of uptake was a true reflection of the stoichiometric current, these experiments were repeated using CH3O3S− within the patch pipette. A similar reduction under hypoxic conditions was observed (1%; −3.2 ± 0.5 pA/pF; n = 10; p < 0.05, when compared with normoxic controls). These results suggest that chronic hypoxia suppresses glutamate uptake and that more severe hypoxia (1% O2) preferentially suppresses uptake via the EAAT2 subtype.
Figure 2.

A, Mean (with SEM error bars taken from number of cells indicated above each bar) current densities evoked by 10 μm l-glutamate in cells cultured under normoxic conditions (N) or in 2.5 or 1% O2, as indicated. **p < 0.01. The inset shows superimposed example inward currents evoked by exposure of astrocytes to glutamate (applied for the period indicated by the horizontal bar). Cells were either cultured normoxically or under the two levels of hypoxia indicated. Holding potential, −70 mV. Calibration applies to all traces. B, Plot of mean current densities (±SEM) (taken from the number of cells indicated above each point) evoked by 10 μm glutamate after varying periods of time cultured at 1% O2 (0–48 h). C, D, Example currents recorded as in A except that cells were cultured either in 2.5% O2 (C) or 1% O2 (D), in the absence (control) or presence of 100 μm TBOA or 500 μm DHK, as indicated. Calibration applies to all traces. E, Plot of mean (with SEM error bars, taken from number of cells indicated above each bar) percentage of current carried by all transporters (taken as total current minus current seen in the presence of TBOA; open bars), by EAAT1 (taken as residual current recorded in the presence of DHK), and by EAAT2 (the DHK-sensitive component). *p < 0.05, significant reduction compared with percentage contribution under normoxic conditions.
Chronic hypoxia decreases EAAT1 and EAAT2 protein levels
To explore possible mechanisms underlying hypoxic suppression of glutamate transport in astrocytes, we examined the distribution of these transporters immunocytochemically. As illustrated in Figure 3A (representative of three such experiments), EAAT1 (top left) was particularly prominent in “hot spots” close to the plasma membrane. EAAT2 distribution (top center) was more general throughout the cytoplasm, whereas EAAT3 (top right) was mostly confined to the perinuclear region of the cell. The presence of EAAT3 protein in our astrocytes was surprising given that it is believed to be a neurone-specific transporter, although studies have previously localized EAAT3 protein in glial cells (Conti et al., 1998; Kugler and Schmitt, 1999). In addition, the lack of EAAT3 staining at the plasma membrane suggests a nonfunctional role, and the perinuclear staining may represent a transporter pool readily available for trafficking to the plasma membrane. This nonfunctional hypothesis is consistent with the lack of functional cysteine uptake for this transporter (see above). We found no immunoreactivity to EAAT4 in astrocytes, although the same anti-EAAT4 antibody displayed positive reactivity in primary cultures of neurons (data not shown). After 24 h exposure to 1% O2 (example images are shown in Fig. 3A, bottom traces), there was a noticeable reduction in immunoreactivity for EAAT1 (bottom left) and EAAT2 (bottom center), but the EAAT3 images (bottom right) appeared unaffected. We also determined the protein levels of all three transporters, EAAT1, EAAT2, and EAAT3, using Western blots. Figure 3B shows that hypoxia differentially modulated the levels of each of the three transporters. For EAAT1 (left), hypoxia reduced protein levels in a graded manner, with values seen in cells cultured under 1% O2 (29 ± 7.3%) approximately one-half of those seen at 2.5% O2 (55 ± 7.2%). Like EAAT1 levels, those of EAAT2 were reduced by ∼50% (56 ± 5.4%) when astrocytes were cultured in 2.5% O2 (center), but no additional significant reduction was seen in cells cultured under 1% O2 (51 ± 6.6%). In additional contrast, levels of EAAT3 protein were unaffected by the most severe hypoxic conditions examined (1% O2; 101.2 ± 0.95%; right). These findings show a clear selective and differential regulation of EAAT protein, in agreement with our functional studies (Fig. 2). This suppression of glutamate uptake is therefore not attributable to a generalized suppression of protein expression or function. Indeed, outward K+ current amplitudes recorded in these astrocytes were unaffected in these cells (data not shown). Furthermore, we previously showed that identical exposures of astrocytes to hypoxia can increase expression of certain proteins (e.g., presenilin-1) (Smith et al., 2004).
Figure 3.
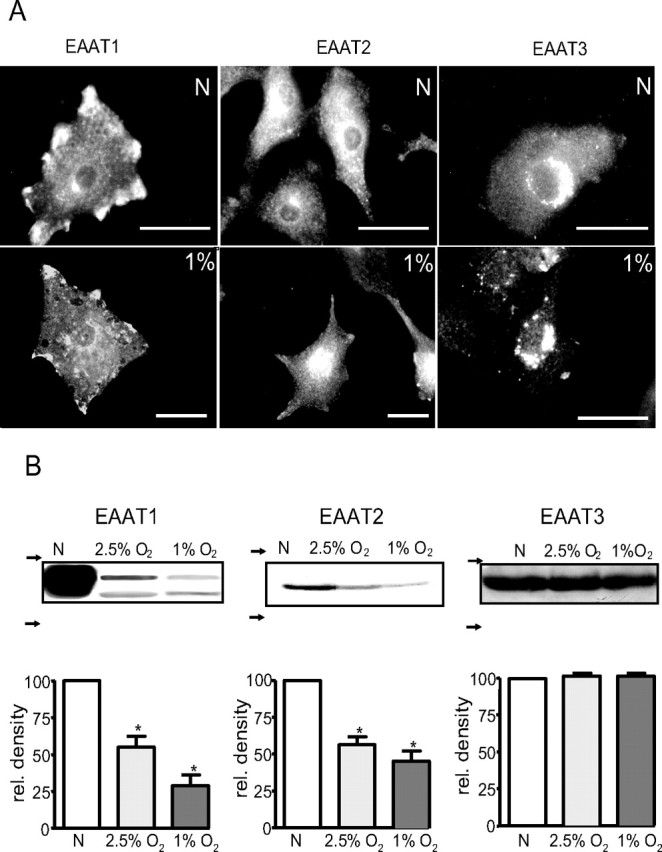
A, Representative images of astrocytes immunostained for EAAT1 (left), EAAT2 (center), and EAAT3 (right). Cells were cultured either normoxically (N) (top images) or in an atmosphere of 1% O2 (bottom images) for 24 h before immunostaining. Scale bars, 40 μm (in each case). B, Western blot detection of EAAT1 (left), EAAT2 (center), and EAAT3 (right). In each case, representative blots are shown above bar graphs that illustrate relative protein levels expressed after normalization of densitometric analyses relative to control (normoxic levels of protein). *p < 0.01 compared with control levels. The arrows to the left of each blot indicate position of molecular weight markers (top, 75 kDa; bottom, 50 kDa).
Alterations in protein expression levels can arise as a result of one or more of a variety of possible mechanisms. We examined the possibility that hypoxia acted at the transcriptional level by determining relative mRNA levels using real-time PCR. Data are shown in Figure 4 for EAAT1 (Fig. 4A) and EAAT2 (Fig. 4B) mRNA, after normalization to β-actin mRNA levels. EAAT1 mRNA levels were reduced to 61.2 ± 7.1 and 30.3 ± 8.9% of normoxic levels after 24 h of 2.5 and 1% O2 respectively. EAAT2 mRNA was reduced to 46.8 ± 6.5 and 27.3 ± 7.5% of normoxic levels by the same exposures. Thus, clearly in both cases there was a graded inhibition of EAAT mRNA with hypoxia, with the differential effects of 2.5 and 1% O2 being greater for EAAT1. These data strongly suggest that reduced glutamate uptake into astrocytes after hypoxic episodes involved suppression of transcription of both EAAT1 and EAAT2.
Figure 4.

A, Mean ± SEM values from three experiments showing relative gene expression of EAAT1 in astrocytes incubated in either normoxic (N) or hypoxic conditions (2.5% O2 or 1% O2) for 24 h. B, As A, but relative expression levels for EAAT2 are shown. In each case, hypoxia significantly (*p < 0.05; **p < 0.01) downregulated EAAT gene expression.
NF-κB but not hypoxia-inducible factor mediates hypoxic suppression of EAAT1 and EAAT2
Studies of O2-dependent regulation of transcription have often demonstrated an involvement of the transcriptional regulator hypoxia-inducible factor (HIF). HIFα is stabilized under hypoxic conditions, permitting dimerization with the β subunit and thereby permitting binding to DNA. This effect of hypoxia can be mimicked experimentally, and we took such an approach to investigate an involvement of HIF in hypoxic suppression of EAAT expression in astrocytes. Firstly, normoxic cells were exposed to desferrioxamine (DFO), a compound known to mimic effects of hypoxia through HIF signaling (An et al., 1998). In these experiments, DFO (10 or 100 μm; 24 h) had no significant effect on the glutamate-evoked current density (Fig. 5A). Furthermore, there was no significant change in the relevant contributions of the EAAT proteins between 100 μm DFO-treated and control cells, as determined pharmacologically (EAAT1, 40.2 ± 3.8 to 39.2 ± 4.1%; EAAT2, 56.8 ± 3.6 to 57.5 ± 4.5%; n = 12; p > 0.05). FG4496 and FG0041, prolyl hydroxylase inhibitors that prevent HIFα being targeted for ubiquitination, thereby stabilizing HIF-mediated transcription in normoxia (Ivan et al., 2002), were also without significant effect on glutamate-evoked current densities (Fig. 5A). In addition, topotecan, which prevents HIF-1α accumulation in hypoxia (Rapisarda et al., 2004), was without effect on glutamate-evoked currents (Fig. 5B, top traces). Cells treated with topotecan (250 μm) did not show a reduction in the glutamate-evoked current density (normoxia, 24.2 ± 1.5 pA/pF; topotecan, 25.1 ± 1.9 pA/pF; n = 10; p > 0.05) as observed in hypoxia. Topotecan also had no effect on the ability of hypoxia (1% O2) to suppress glutamate current density (11.6 ± 0.7 pA/pF; n = 10). In support of these functional data, FG4496 and DFO were also without effect on protein levels for EAAT1 or EAAT2, as determined in Western blots (Fig. 5C). Additionally, exposure of cells to cobalt, another HIF stabilizing agent (100 μm; 24 h), also had no effect on protein levels (Fig. 5C). Collectively, results presented in Figure 5 strongly suggest that HIF is not involved in hypoxic suppression of glutamate transporters.
Figure 5.

A, Mean current densities ± SEM (taken from number of cells indicated above each bar) evoked by exposure of astrocytes to 10 μm glutamate. Cells were maintained under normoxic conditions in the absence (open bar) or presence (shaded bar) for 24 h of HIF stabilizers DFO, FG4496 (20 μm), or FG0041 (20 μm). B, Example 10 μm glutamate-evoked currents illustrating a lack of effect of topotecan (250 μm) on currents evoked under normoxic conditions (top traces) and a lack of effect of topotecan on hypoxic suppression of currents (bottom traces). C, Relative band densities (percentage of control normoxic densities) for EAAT1 and EAAT2 in Western blots of extracts from cells cultured in the presence of cobalt (100 μm), FG4496 (20 μm), and DFO (100 μm). Each bar is the mean ± SEM taken from three separate blots. glut., Glutamate; topo, topotecan.
Although HIF is the best known O2-dependent transcriptional regulator, other regulators are also modulated by hypoxia (Cummins and Taylor, 2005). Of these, we have previously suggested that NF-κB mediates some effects of hypoxia in the O2 sensing cell line, PC12 (Green and Peers, 2002). Previous studies have implicated NF-κB in suppression as well as activation of EAAT2 expression through different mechanisms (Sitcheran et al., 2005). To investigate a role for NF-κB, astrocytes were preincubated in 1% hypoxia as described previously, in the additional presence of SN50 (5 μm), an inhibitor of NF-κB activation. As before, 1% hypoxia in the absence SN50 reduced the transporter current density (Fig. 6A,C). However, those cells preincubated with SN50 did not show a significant decrease in the glutamate-evoked current density (Fig. 6A, top traces; C) when compared with normoxic controls. However, some studies have suggested that SN-50 acts as a nonspecific inhibitor of NF-κB (Boothby, 2001). Therefore, we used a compound known to specifically inhibit NF-κB translocation to the nucleus, CAPE (Carrasco-Legleu et al., 2004). Cells incubated under 1% hypoxia in the presence of CAPE (10 μm) did not show the significant reduction in glutamate-evoked current density as previously seen in the absence of CAPE (Fig. 6B,C). This suggested that inhibition of NF-κB activation prevents the reduction in glutamate uptake activity seen in hypoxia. As a control, cells were preincubated with the inactive form of SN50, SN50M (5 μm), for 24 h under identical hypoxic conditions. SN50M did not prevent the reduction in the glutamate transporter current observed in hypoxia (Fig. 6A, bottom traces; C). Given that SCN− amplifies the transporter current, we used MES within the patch pipette to examine the role of NF-κB in modulation of the stoichiometric current. Here again, CAPE reversed the suppression of uptake activity under hypoxia (1% hypoxia, 3.9 ± 0.6 pA/pF; 1% hypoxia plus CAPE, 5.6 ± 0.4 pA/pF; n = 10; p < 0.05). These data suggest that NF-κB plays a vital role in hypoxic suppression of glutamate uptake via the glutamate transporters. In additional support of this, Western blots indicated that SN50 fully reversed hypoxic suppression of EAAT1 and EAAT2 protein levels (Fig. 7A). Finally, we used immunocytochemistry to explore the effects of hypoxia on the intracellular distribution of NF-κB. Representative images are shown in Figure 7B. Under normoxic conditions (Fig. 7B, top images), immunoreactivity for NF-κB (stained green) was largely cytoplasmic, and only low levels were observed in nuclei (stained blue). After a 24 h period of exposure to 1% O2, there was a marked redistribution of NF-κB such that cytoplasmic levels decreased and nuclear levels dramatically increased (Fig. 7B, middle images). This hypoxic redistribution was prevented when cells were cultured under hypoxic conditions but in the additional presence of 5 μm SN50 (Fig. 7B, bottom images). Collectively, our findings indicate that hypoxia suppresses glutamate transporter expression via inhibition of NF-κB translocation.
Figure 6.
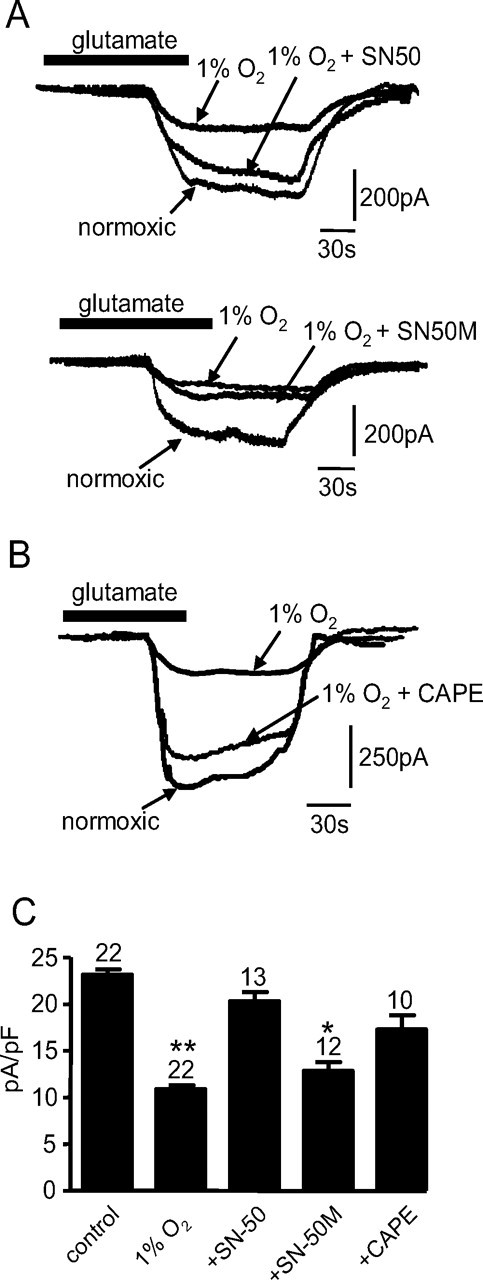
A, Top traces, Superimposed example inward currents evoked by exposure of astrocytes to 10 μm l-glutamate (applied for the period indicated by the horizontal bar). Cells were either cultured normoxically, or in 1% O2 in the absence or presence of 5 μm SN50, as indicated. Calibration applies to all traces. Bottom traces, As top, except that the inactive SN50 analog, SN50M (5 μm), was present for the experiment indicated. B, Superimposed example inward currents evoked by exposure of astrocytes to 10 μm l-glutamate as in A, except that hypoxic cells were cultured in the absence or presence of 10 μm CAPE. C, Mean (with SEM error bars taken from number of cells indicated above each bar) current densities evoked by glutamate in cells cultured under conditions indicated in A and B. *p < 0.05; **p < 0.01.
Figure 7.
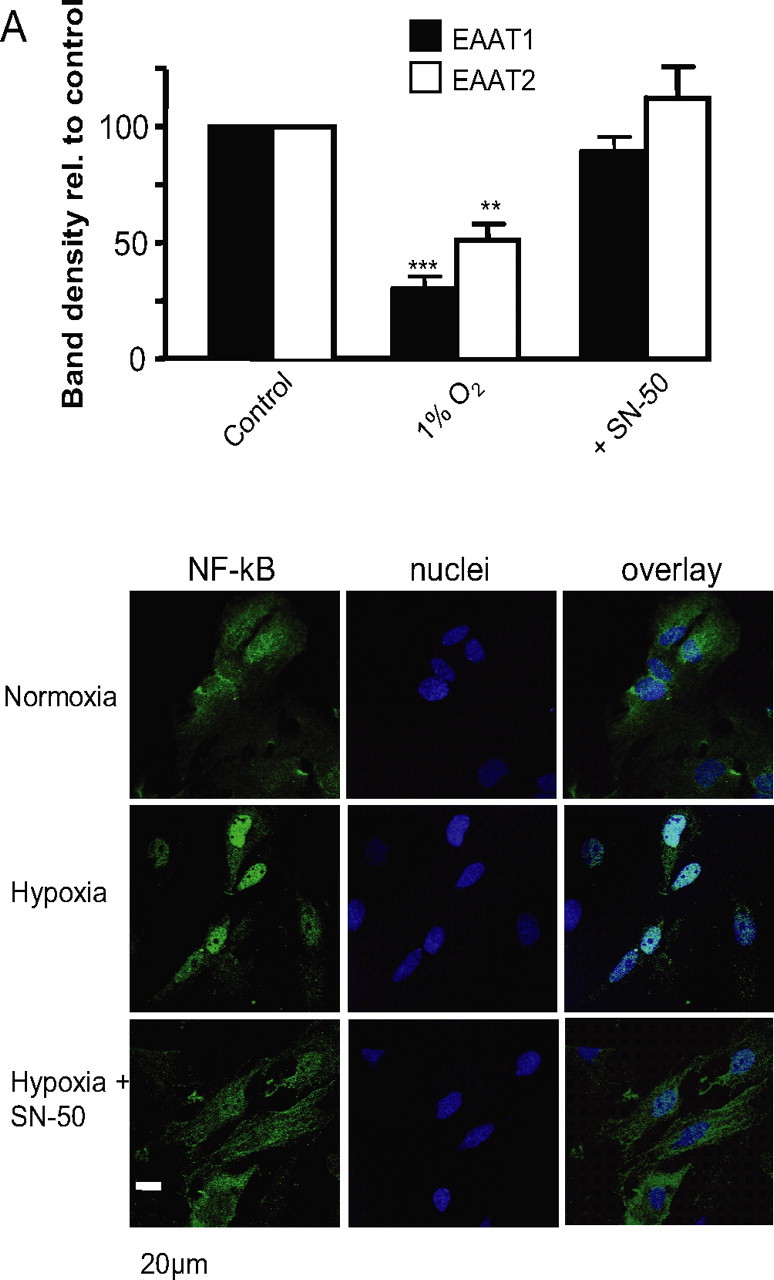
A, Relative band densities (percentage of control normoxic densities) for EAAT1 and EAAT2 in Western blots of extracts from cells cultured in normoxia, 1% O2 and 1% O2 in the additional presence of 5 μm SN50. Each bar is the mean ± SEM taken from three separate blots. **p < 0.01; ***p < 0.001. B, Representative example images of astrocytes immunostained for NF-κB (green; left traces) and also stained with the nuclear dye DAPI (blue; middle traces). Overlaid images are shown on the right. Cells were cultured either normoxically (top images) or in 1% O2 in the absence (middle traces) or presence (bottom traces) of 5 μm SN50. Scale bar applies to all images.
Discussion
Normal brain function is critically dependent on O2 availability; reduction of O2 levels can precipitate neuronal dysfunction and, over the longer term, predispose individuals to neurological disorders such as dementias. Hypoxia in the brain can be acute and severe, for example, as a result of a stroke, or can be milder but sustained, as a result of other cardiorespiratory disorders (or residence at high altitude). Because regulation of glutamate homeostasis by astrocytes is key to normal synaptic neurotransmission and indeed to coordination of neural networks (Fellin et al., 2006), several studies have examined how such uptake is modulated by hypoxia/ischemia (Torp et al., 1995; Martin et al., 1997; Rao et al., 1998; Fujita et al., 1999; Gottlieb et al., 2000; Raghavendra et al., 2000; Tao et al., 2001; Rebel et al., 2005). However, although some of these studies have identified alterations in EAAT protein and mRNA levels, results are variable and no mechanism or functional consequences have been provided. To address this, we specifically investigated the effects of hypoxia alone on astrocytic glutamate transport.
Our initial observations were that hypoxia (2.5 and 1% O2) produced a marked, graded inhibition of glutamate uptake. Of the three transporters, EAAT1–3 we found to be present in our astrocytes (Figs. 2, 3), only EAAT1 and EAAT2 appeared to contribute significantly to uptake currents, and indeed although EAAT3 protein was detectable (Fig. 3B), it appeared to localize to the perinuclear region of the cell (Fig. 3A). Hypoxia was selective in its modulation of EAAT1 and -2; at 2.5% O2, similar degrees of inhibition were found for the two transporters, but at 1% O2, inhibition of EAAT2 function appeared to be more pronounced than inhibition of EAAT1.
This selectivity of the effect of 1% O2 in itself argues against hypoxic suppression of glutamate uptake arising as a result of cell depolarization. Thus, although uptake depends on maintenance of a strong transmembrane Na+ electrochemical driving force, and so depolarization would decrease this force, such an effect would not be markedly selective for one uptake carrier over the other. Furthermore, we have previously shown that similar periods of hypoxia do not alter membrane potential significantly in these cells (Smith et al., 2003). Instead, our data are strongly supportive of the idea that hypoxia suppresses expression of glutamate transporters, rather than altering the activity of transporters already expressed. Thus, we found hypoxia to inhibit EAAT1 and EAAT2 at the protein and mRNA level (Figs. 3, 4).
HIF has received much attention in recent years as a major, O2-dependent regulator of transcription (Schofield and Ratcliffe, 2004; Semenza, 2004). HIF activation requires stabilization of the α subunit by prevention of its degradation, which occurs rapidly in normoxia because of proline hydroxylation-mediated targeting to the von Hippel–Lindau (VHL) factor, permitting proteosomal degradation. Asparagine hydroxylation also contributes to degradation (Masson and Ratcliffe, 2003; Cummins and Taylor, 2005). Stabilization of the α subunit permits dimerization with the β subunit, recruitment of additional factors, and hence initiation of transcription. This pathway is well characterized in numerous cell types, and may well be ubiquitous. Experimentally, the HIFα subunit can be stabilized by numerous agents, including the iron chelator DFO (An et al., 1998), cobalt [which mimics hypoxia by causing the stabilization of HIF-α by occupying the VHL-binding domain (Yuan et al., 2003)], and FG compounds, which are proline hydroxylase inhibitors (Ivan et al., 2002). Clearly, these agents were without effect on glutamate uptake or EAAT1 and EAAT2 protein levels (Fig. 5). Furthermore, topotecan, which prevents accumulation of HIFα during hypoxia (Belozerov and Van Meir, 2005), was also without effect on uptake. Collectively, these findings argue against a significant role for HIF in hypoxic suppression of glutamate uptake.
Although HIF is regarded as the principal, ubiquitous transcription factor activated by hypoxia, it is by no means the only such factor (Cummins and Taylor, 2005). NF-κB is another widespread transcription factor that appears to be activated by hypoxia at least in non-neuronal/astrocyte tissues (Cummins and Taylor, 2005). We showed that it accounts for some of the actions of hypoxia in PC12 cells (Green and Peers, 2002). Furthermore, NF-κB is recruited to the EAAT2 promoter in vitro and in vivo in response to both EGF (epidermal growth factor) and TNFα (tumor necrosis factor α), and both of these signals induce the predominant p65–p50 heterodimer (Sitcheran et al., 2005). Figures 6 and 7 present data that argue strongly that NF-κB activation is required for hypoxic downregulation of EAAT1 and EAAT2. Thus, NF-κB inhibition prevents hypoxic suppression of glutamate uptake as determined electrophysiologically, and suppresses EAAT1 and EAAT2 protein levels (Fig. 7A), presumably by inhibiting hypoxic activation/nuclear translocation of NF-κB (Fig. 7B). Given that glutamate release, a consequence of ischemic events, in itself can also activate NF-κB, this could be proposed as a mechanism of action. However, previous studies have shown that glutamate cannot activate the translocation of NF-κB within astrocytes (Guerrini et al., 1995). Thus, NF-κB inhibition prevented the effects of hypoxia on these transporters, as determined at the functional and protein expression levels. The mechanism of NF-κB activation remains unresolved and merits additional investigation.
The implications for the present findings are striking: we previously reported that hypoxia promotes formation of amyloid-β peptides of Alzheimer's disease in astrocytes (Smith et al., 2004), and these peptides can activate NF-κB in these cells (Akama et al., 1998). Furthermore, the toxic fragment of these peptides (Aβ25–35) can suppress glutamate uptake in astrocytes (Harris et al., 1996). Thus, in both neurodegenerative diseases and cardiorespiratory diseases leading to central hypoxia, suppression of astrocyte glutamate uptake, via NF-κB-mediated inhibition of EAAT protein expression, is likely to be a critical factor in excitotoxicity and neuronal damage or death. Thus, inhibition of this suppression of transporter expression represents a potential future therapeutic target.
Footnotes
This work was supported by the Alzheimer's Society (United Kingdom), The Alzheimer's Research Trust, and The Medical Research Council.
References
- Akama KT, Albanese C, Pestell RG, Van Eldik LJ. Amyloid beta-peptide stimulates nitric oxide production in astrocytes through an NFkappaB-dependent mechanism. Proc Natl Acad Sci USA. 1998;95:5795–5800. doi: 10.1073/pnas.95.10.5795. [DOI] [PMC free article] [PubMed] [Google Scholar]
- An WG, Kanekal M, Simon MC, Maltepe E, Blagosklonny MV, Neckers LM. Stabilization of wild-type p53 by hypoxia-inducible factor 1alpha. Nature. 1998;392:405–408. doi: 10.1038/32925. [DOI] [PubMed] [Google Scholar]
- Anderson CM, Swanson RA. Astrocyte glutamate transport: review of properties, regulation, and physiological functions. Glia. 2000;32:1–14. [PubMed] [Google Scholar]
- Aoyama K, Suh SW, Hamby AM, Liu J, Chan WY, Chen Y, Swanson RA. Neuronal glutathione deficiency and age-dependent neurodegeneration in the EAAC1 deficient mouse. Nat Neurosci. 2006;9:119–126. doi: 10.1038/nn1609. [DOI] [PubMed] [Google Scholar]
- Araque A, Carmignoto G, Haydon PG. Dynamic signaling between astrocytes and neurons. Annu Rev Physiol. 2001;63:795–813. doi: 10.1146/annurev.physiol.63.1.795. [DOI] [PubMed] [Google Scholar]
- Belozerov VE, Van Meir EG. Hypoxia inducible factor-1: a novel target for cancer therapy. Anticancer Drugs. 2005;16:901–909. doi: 10.1097/01.cad.0000180116.85912.69. [DOI] [PubMed] [Google Scholar]
- Bergles DE, Jahr CE. Synaptic activation of glutamate transporters in hippocampal astrocytes. Neuron. 1997;19:1297–1308. doi: 10.1016/s0896-6273(00)80420-1. [DOI] [PubMed] [Google Scholar]
- Bergles DE, Jahr CE. Glial contribution to glutamate uptake at Schaffer collateral-commissural synapses in the hippocampus. J Neurosci. 1998;18:7709–7716. doi: 10.1523/JNEUROSCI.18-19-07709.1998. [DOI] [PMC free article] [PubMed] [Google Scholar]
- Bergles DE, Dzubay JA, Jahr CE. Glutamate transporter currents in Bergmann glial cells follow the time course of extrasynaptic glutamate. Proc Natl Acad Sci USA. 1997;94:14821–14825. doi: 10.1073/pnas.94.26.14821. [DOI] [PMC free article] [PubMed] [Google Scholar]
- Bergles DE, Tzingounis AV, Jahr CE. Comparison of coupled and uncoupled currents during glutamate uptake by GLT-1 transporters. J Neurosci. 2002;22:10153–10162. doi: 10.1523/JNEUROSCI.22-23-10153.2002. [DOI] [PMC free article] [PubMed] [Google Scholar]
- Bezzi P, Gundersen V, Galbete JL, Seifert G, Steinhauser C, Pilati E, Volterra A. Astrocytes contain a vesicular compartment that is competent for regulated exocytosis of glutamate. Nat Neurosci. 2004;7:613–620. doi: 10.1038/nn1246. [DOI] [PubMed] [Google Scholar]
- Boothby M. Specificity of SN50 for NF-kappa B? Nat Immunol. 2001;2:471–472. doi: 10.1038/88652. [DOI] [PubMed] [Google Scholar]
- Carmignoto G. Reciprocal communication systems between astrocytes and neurones. Prog Neurobiol. 2000;62:561–581. doi: 10.1016/s0301-0082(00)00029-0. [DOI] [PubMed] [Google Scholar]
- Carrasco-Legleu CE, Marquez-Rosado L, Fattel-Fazenda S, Arce-Popoca E, Perez-Carreon JI, Villa-Trevino S. Chemoprotective effect of caffeic acid phenethyl ester on promotion in a medium-term rat hepatocarcinogenesis assay. Int J Cancer. 2004;108:488–492. doi: 10.1002/ijc.11595. [DOI] [PubMed] [Google Scholar]
- Chen X, Wang L, Zhou Y, Zheng LH, Zhou Z. “Kiss-and-run” glutamate secretion in cultured and freshly isolated rat hippocampal astrocytes. J Neurosci. 2005;25:9236–9243. doi: 10.1523/JNEUROSCI.1640-05.2005. [DOI] [PMC free article] [PubMed] [Google Scholar]
- Conti F, DeBiasi S, Minelli A, Rothstein JD, Melone M. EAAC1, a high-affinity glutamate tranporter, is localized to astrocytes and gabaergic neurons besides pyramidal cells in the rat cerebral cortex. Cereb Cortex. 1998;8:108–116. doi: 10.1093/cercor/8.2.108. [DOI] [PubMed] [Google Scholar]
- Cummins EP, Taylor CT. Hypoxia-responsive transcription factors. Pflügers Arch. 2005;450:363–371. doi: 10.1007/s00424-005-1413-7. [DOI] [PubMed] [Google Scholar]
- Danbolt NC. Glutamate uptake. Prog Neurobiol. 2001;65:1–105. doi: 10.1016/s0301-0082(00)00067-8. [DOI] [PubMed] [Google Scholar]
- Dowd LA, Coyle AJ, Rothstein JD, Pritchett DB, Robinson MB. Comparison of Na+-dependent glutamate transport activity in synaptosomes, C6 glioma, and Xenopus oocytes expressing excitatory amino acid carrier 1 (EAAC1) Mol Pharmacol. 1996;49:465–473. [PubMed] [Google Scholar]
- Fellin T, Pascual O, Haydon PG. Astrocytes coordinate synaptic networks: balanced excitation and inhibition. Physiology (Bethesda) 2006;21:208–215. doi: 10.1152/physiol.00161.2005. [DOI] [PubMed] [Google Scholar]
- Fray AE, Ince PG, Banner SJ, Milton ID, Usher PA, Cookson MR, Shaw PJ. The expression of the glial glutamate transporter protein EAAT2 in motor neuron disease: an immunohistochemical study. Eur J Neurosci. 1998;10:2481–2489. doi: 10.1046/j.1460-9568.1998.00273.x. [DOI] [PubMed] [Google Scholar]
- Fujita H, Sato K, Wen TC, Peng Y, Sakanaka M. Differential expressions of glycine transporter 1 and three glutamate transporter mRNA in the hippocampus of gerbils with transient forebrain ischemia. J Cereb Blood Flow Metab. 1999;19:604–615. doi: 10.1097/00004647-199906000-00003. [DOI] [PubMed] [Google Scholar]
- Garlin AB, Sinor AD, Sinor JD, Jee SH, Grinspan JB, Robinson MB. Pharmacology of sodium-dependent high-affinity l-[3H]glutamate transport in glial cultures. J Neurochem. 1995;64:2572–2580. doi: 10.1046/j.1471-4159.1995.64062572.x. [DOI] [PubMed] [Google Scholar]
- Gegelashvili G, Schousboe A. Cellular distribution and kinetic properties of high-affinity glutamate transporters. Brain Res Bull. 1998;45:233–238. doi: 10.1016/s0361-9230(97)00417-6. [DOI] [PubMed] [Google Scholar]
- Glowatzki E, Cheng N, Hiel H, Yi E, Tanaka K, Ellis-Davies GC, Rothstein JD, Bergles DE. The glutamate-aspartate transporter GLAST mediates glutamate uptake at inner hair cell afferent synapses in the mammalian cochlea. J Neurosci. 2006;26:7659–7664. doi: 10.1523/JNEUROSCI.1545-06.2006. [DOI] [PMC free article] [PubMed] [Google Scholar]
- Gottlieb M, Domercq M, Matute C. Altered expression of the glutamate transporter EAAC1 in neurons and immature oligodendrocytes after transient forebrain ischemia. J Cereb Blood Flow Metab. 2000;20:678–687. doi: 10.1097/00004647-200004000-00005. [DOI] [PubMed] [Google Scholar]
- Green KN, Peers C. Divergent pathways account for two distinct effects of amyloid b peptides on exocytosis and Ca2+ currents: involvement of ROS and NFκB. J Neurochem. 2002;81:1043–1051. doi: 10.1046/j.1471-4159.2002.00907.x. [DOI] [PubMed] [Google Scholar]
- Guerrini L, Blasi F, is-Donini S. Synaptic activation of NF-kappa B by glutamate in cerebellar granule neurons in vitro. Proc Natl Acad Sci USA. 1995;92:9077–9081. doi: 10.1073/pnas.92.20.9077. [DOI] [PMC free article] [PubMed] [Google Scholar]
- Harris ME, Wang Y, Pedigo NW, Jr, Hensley K, Butterfield DA, Carney JM. Amyloid beta peptide (25–35) inhibits Na+-dependent glutamate uptake in rat hippocampal astrocyte cultures. J Neurochem. 1996;67:277–286. doi: 10.1046/j.1471-4159.1996.67010277.x. [DOI] [PubMed] [Google Scholar]
- Ivan M, Haberberger T, Gervasi DC, Michelson KS, Gunzler V, Kondo K, Yang H, Sorokina I, Conaway RC, Conaway JW, Kaelin WG., Jr Biochemical purification and pharmacological inhibition of a mammalian prolyl hydroxylase acting on hypoxia-inducible factor. Proc Natl Acad Sci USA. 2002;99:13459–13464. doi: 10.1073/pnas.192342099. [DOI] [PMC free article] [PubMed] [Google Scholar]
- Kugler P, Schmitt A. Glutamate transporter EAAC1 is expressed in neurons and glial cells in the rat nervous system. Glia. 1999;27:129–142. doi: 10.1002/(sici)1098-1136(199908)27:2<129::aid-glia3>3.0.co;2-y. [DOI] [PubMed] [Google Scholar]
- Lehre KP, Danbolt NC. The number of glutamate transporter subtype molecules at glutamatergic synapses: chemical and stereological quantification in young adult rat brain. J Neurosci. 1998;18:8751–8757. doi: 10.1523/JNEUROSCI.18-21-08751.1998. [DOI] [PMC free article] [PubMed] [Google Scholar]
- Lehre KP, Levy LM, Ottersen OP, Storm-Mathisen J, Danbolt NC. Differential expression of two glial glutamate transporters in the rat brain: quantitative and immunocytochemical observations. J Neurosci. 1995;15:1835–1853. doi: 10.1523/JNEUROSCI.15-03-01835.1995. [DOI] [PMC free article] [PubMed] [Google Scholar]
- Lin CL, Bristol LA, Jin L, Dykes-Hoberg M, Crawford T, Clawson L, Rothstein JD. Aberrant RNA processing in a neurodegenerative disease: the cause for absent EAAT2, a glutamate transporter, in amyotrophic lateral sclerosis. Neuron. 1998;20:589–602. doi: 10.1016/s0896-6273(00)80997-6. [DOI] [PubMed] [Google Scholar]
- Maragakis NJ, Rothstein JD. Glutamate transporters: animal models to neurologic disease. Neurobiol Dis. 2004;15:461–473. doi: 10.1016/j.nbd.2003.12.007. [DOI] [PubMed] [Google Scholar]
- Martin LJ, Brambrink AM, Lehmann C, Portera-Cailliau C, Koehler R, Rothstein J, Traystman RJ. Hypoxia-ischemia causes abnormalities in glutamate transporters and death of astroglia and neurons in newborn striatum. Ann Neurol. 1997;42:335–348. doi: 10.1002/ana.410420310. [DOI] [PubMed] [Google Scholar]
- Masson N, Ratcliffe PJ. HIF prolyl and asparaginyl hydroxylases in the biological response to intracellular O2 levels. J Cell Sci. 2003;116:3041–3049. doi: 10.1242/jcs.00655. [DOI] [PubMed] [Google Scholar]
- Milton ID, Banner SJ, Ince PG, Piggott NH, Fray AE, Thatcher N, Horne CH, Shaw PJ. Expression of the glial glutamate transporter EAAT2 in the human CNS: an immunohistochemical study. Brain Res Mol Brain Res. 1997;52:17–31. doi: 10.1016/s0169-328x(97)00233-7. [DOI] [PubMed] [Google Scholar]
- Nicholls D, Attwell D. The release and uptake of excitatory amino acids. Trends Pharmacol Sci. 1990;11:462–468. doi: 10.1016/0165-6147(90)90129-v. [DOI] [PubMed] [Google Scholar]
- Nilsson GE, Lutz PL. Release of inhibitory neurotransmitters in response to anoxia in turtle brain. Am J Physiol. 1991;261:R32–R37. doi: 10.1152/ajpregu.1991.261.1.R32. [DOI] [PubMed] [Google Scholar]
- Raghavendra R, V, Rao AM, Dogan A, Bowen KK, Hatcher J, Rothstein JD, Dempsey RJ. Glial glutamate transporter GLT-1 down-regulation precedes delayed neuronal death in gerbil hippocampus following transient global cerebral ischemia. Neurochem Int. 2000;36:531–537. doi: 10.1016/s0197-0186(99)00153-9. [DOI] [PubMed] [Google Scholar]
- Rao VL, Baskaya MK, Dogan A, Rothstein JD, Dempsey RJ. Traumatic brain injury down-regulates glial glutamate transporter (GLT-1 and GLAST) proteins in rat brain. J Neurochem. 1998;70:2020–2027. doi: 10.1046/j.1471-4159.1998.70052020.x. [DOI] [PubMed] [Google Scholar]
- Rapisarda A, Uranchimeg B, Sordet O, Pommier Y, Shoemaker RH, Melillo G. Topoisomerase I-mediated inhibition of hypoxia-inducible factor 1: mechanism and therapeutic implications. Cancer Res. 2004;64:1475–1482. doi: 10.1158/0008-5472.can-03-3139. [DOI] [PubMed] [Google Scholar]
- Rebel A, Koehler RC, Martin LJ. In situ immunoradiographic method for quantification of specific proteins in normal and ischemic brain regions. J Neurosci Methods. 2005;143:227–235. doi: 10.1016/j.jneumeth.2004.11.003. [DOI] [PubMed] [Google Scholar]
- Richter DW, Lalley PM, Pierrefiche O, Haji A, Bischoff AM, Wilken B, Hanefeld F. Intracellular signal pathways controlling respiratory neurons. Respir Physiol. 1997;110:113–123. doi: 10.1016/s0034-5687(97)00077-7. [DOI] [PubMed] [Google Scholar]
- Rossi DJ, Oshima T, Attwell D. Glutamate release in severe brain ischaemia is mainly by reversed uptake. Nature. 2000;403:316–321. doi: 10.1038/35002090. [DOI] [PubMed] [Google Scholar]
- Rothman SM, Olney JW. Glutamate and the pathophysiology of hypoxic–ischemic brain damage. Ann Neurol. 1986;19:105–111. doi: 10.1002/ana.410190202. [DOI] [PubMed] [Google Scholar]
- Rothstein JD, Martin L, Levey AI, Dykes-Hoberg M, Jin L, Wu D, Nash N, Kuncl RW. Localization of neuronal and glial glutamate transporters. Neuron. 1994;13:713–725. doi: 10.1016/0896-6273(94)90038-8. [DOI] [PubMed] [Google Scholar]
- Rozyczka J, Engele J. Multiple 5′-splice variants of the rat glutamate transporter-1. Brain Res Mol Brain Res. 2005;133:157–161. doi: 10.1016/j.molbrainres.2004.09.021. [DOI] [PubMed] [Google Scholar]
- Sattler R, Xiong Z, Lu WY, MacDonald JF, Tymianski M. Distinct roles of synaptic and extrasynaptic NMDA receptors in excitotoxicity. J Neurosci. 2000;20:22–33. doi: 10.1523/JNEUROSCI.20-01-00022.2000. [DOI] [PMC free article] [PubMed] [Google Scholar]
- Schmitt A, Asan E, Lesch KP, Kugler P. A splice variant of glutamate transporter GLT1/EAAT2 expressed in neurons: cloning and localization in rat nervous system. Neuroscience. 2002;109:45–61. doi: 10.1016/s0306-4522(01)00451-1. [DOI] [PubMed] [Google Scholar]
- Schofield CJ, Ratcliffe PJ. Oxygen sensing by HIF hydroxylases. Nat Rev Mol Cell Biol. 2004;5:343–354. doi: 10.1038/nrm1366. [DOI] [PubMed] [Google Scholar]
- Semenza GL. Hydroxylation of HIF-1: oxygen sensing at the molecular level. Physiology (Bethesda) 2004;19:176–182. doi: 10.1152/physiol.00001.2004. [DOI] [PubMed] [Google Scholar]
- Simon RP, Swan JH, Griffiths T, Meldrum BS. Blockade of N-methyl-d-aspartate receptors may protect against ischemic damage in the brain. Science. 1984;226:850–852. doi: 10.1126/science.6093256. [DOI] [PubMed] [Google Scholar]
- Sims KD, Robinson MB. Expression patterns and regulation of glutamate transporters in the developing and adult nervous system. Crit Rev Neurobiol. 1999;13:169–197. doi: 10.1615/critrevneurobiol.v13.i2.30. [DOI] [PubMed] [Google Scholar]
- Sitcheran R, Gupta P, Fisher PB, Baldwin AS. Positive and negative regulation of EAAT2 by NF-kappaB: a role for N-myc in TNFalpha-controlled repression. EMBO J. 2005;24:510–520. doi: 10.1038/sj.emboj.7600555. [DOI] [PMC free article] [PubMed] [Google Scholar]
- Smith IF, Plant LD, Boyle JP, Skinner RA, Pearson HA, Peers C. Chronic hypoxia potentiates capacitative Ca2+ entry in type I cortical astrocytes. J Neurochem. 2003;85:1109–1116. doi: 10.1046/j.1471-4159.2003.01785.x. [DOI] [PubMed] [Google Scholar]
- Smith IF, Boyle JP, Green KN, Pearson HA, Peers C. Hypoxic remodeling of Ca2+ mobilization in type I cortical astrocytes: involvement of ROS and pro-amyloidogenic APP processing. J Neurochem. 2004;88:869–877. doi: 10.1046/j.1471-4159.2003.02212.x. [DOI] [PubMed] [Google Scholar]
- Springer JE, Azbill RD, Mark RJ, Begley JG, Waeg G, Mattson MP. 4-Hydroxynonenal, a lipid peroxidation product, rapidly accumulates following traumatic spinal cord injury and inhibits glutamate uptake. J Neurochem. 1997;68:2469–2476. doi: 10.1046/j.1471-4159.1997.68062469.x. [DOI] [PubMed] [Google Scholar]
- Tao F, Lu SD, Zhang LM, Huang YL, Sun FY. Role of excitatory amino acid transporter 1 in neonatal rat neuronal damage induced by hypoxia-ischemia. Neuroscience. 2001;102:503–513. doi: 10.1016/s0306-4522(00)00485-1. [DOI] [PubMed] [Google Scholar]
- Torp R, Lekieffre D, Levy LM, Haug FM, Danbolt NC, Meldrum BS, Ottersen OP. Reduced postischemic expression of a glial glutamate transporter, GLT1, in the rat hippocampus. Exp Brain Res. 1995;103:51–58. doi: 10.1007/BF00241964. [DOI] [PubMed] [Google Scholar]
- Volterra A, Steinhauser C. Glial modulation of synaptic transmission in the hippocampus. Glia. 2004;47:249–257. doi: 10.1002/glia.20080. [DOI] [PubMed] [Google Scholar]
- Wadiche JI, Kavanaugh MP. Macroscopic and microscopic properties of a cloned glutamate transporter/chloride channel. J Neurosci. 1998;18:7650–7661. doi: 10.1523/JNEUROSCI.18-19-07650.1998. [DOI] [PMC free article] [PubMed] [Google Scholar]
- Wadiche JI, Amara SG, Kavanaugh MP. Ion fluxes associated with excitatory amino acid transport. Neuron. 1995;15:721–728. doi: 10.1016/0896-6273(95)90159-0. [DOI] [PubMed] [Google Scholar]
- Yan YP, Yin KJ, Sun FY. Effect of glutamate transporter on neuronal damage induced by photochemical thrombotic brain ischemia. NeuroReport. 1998;9:441–446. doi: 10.1097/00001756-199802160-00016. [DOI] [PubMed] [Google Scholar]
- Yuan Y, Hilliard G, Ferguson T, Millhorn DE. Cobalt inhibits the interaction between hypoxia-inducible factor-alpha and von Hippel-Lindau protein by direct binding to hypoxia-inducible factor-alpha. J Biol Chem. 2003;278:15911–15916. doi: 10.1074/jbc.M300463200. [DOI] [PubMed] [Google Scholar]
- Zonta M, Angulo MC, Gobbo S, Rosengarten B, Hossmann KA, Pozzan T, Carmignoto G. Neuron-to-astrocyte signaling is central to the dynamic control of brain microcirculation. Nat Neurosci. 2003;6:43–50. doi: 10.1038/nn980. [DOI] [PubMed] [Google Scholar]