

Abstract
Recovery of function after stroke is thought to be dependent on the reorganization of adjacent, surviving areas of the brain. Macroscopic imaging studies (functional magnetic resonance imaging, optical imaging) have shown that peri-infarct regions adopt new functional roles to compensate for damage caused by stroke. To better understand the process by which these regions reorganize, we used in vivo two-photon imaging to examine changes in dendritic and vascular structure in cortical regions recovering from stroke. In adult control mice, dendritic arbors were relatively stable with very low levels of spine turnover (<0.5% turnover over 6 h). After stroke, however, the organization of dendritic arbors in peri-infarct cortex was fundamentally altered with both apical dendrites and blood vessels radiating in parallel from the lesion. On a finer scale, peri-infarct dendrites were exceptionally plastic, manifested by a dramatic increase in the rate of spine formation that was maximal at 1–2 weeks (5–8-fold increase), and still evident 6 weeks after stroke. These changes were selective given that turnover rates were not significantly altered in ipsilateral cortical regions more distant to the lesion (>1.5 mm). These data provide a structural framework for understanding functional and behavioral changes that accompany brain injury and suggest new targets that could be exploited by future therapies to rebuild and rewire neuronal circuits lost to stroke.
Keywords: stroke, ischemia, dendrite, spines, angiogenesis, two-photon imaging, photothrombosis, forelimb, cortex, plasticity
Introduction
The majority of people that survive a stroke will experience some form of sensory, motor, or cognitive impairment. However, over the ensuing weeks to months after stroke, it is well known that many of these individuals will experience at least some restitution of function in the affected areas (Carmichael, 2006). Although the adult brain appears capable of adapting to injury, the neurobiological mechanisms of this process are not well understood. Accumulating evidence has suggested that adjacent, surviving regions (i.e., peri-infarct) of the brain may be critically involved in this process (Cramer and Chopp, 2000; Carmichael, 2006). Studies have indicated this is an exceptionally fertile area for plasticity, because there are robust changes in the expression of growth promoting or inhibiting proteins involved in neuronal rewiring (Carmichael, 2003b; Li and Carmichael, 2006; Zhao et al., 2006). Functionally, peri-infarct regions appear to undergo large-scale changes in neuronal response properties. For example, electrophysiological and imaging studies have shown that peri-infarct regions become more active or responsive to stimulation of somatic regions that they are not typically associated with, suggesting that peri-infarct cortex may take over the function of brain regions lost to stroke (Nudo et al., 1996; Dijkhuizen et al., 2001; Wei et al., 2001; Jaillard et al., 2005). Further, the functional reorganization of peri-infarct cortex correlates temporally with behavioral recovery (Dijkhuizen et al., 2001; Gonzalez and Kolb, 2003), and behavioral deficits in gross sensorimotor function induced by cortical lesions can be reinstated with the ablation of perilesional regions (Castro-Alamancos and Borrel, 1995). However, the structural mechanisms that underlie these functional changes in the peri-infarct cortex have not been resolved.
Most excitatory synapses in the brain terminate onto dendritic protrusions called spines (Harris, 1999). Previous work has indicated that dendritic spines are relatively stable entities in the adult brain (Grutzendler et al., 2002; Trachtenberg et al., 2002), but are capable of undergoing change, particularly after manipulations of sensory experience or synaptic activity (Kirov and Harris, 1999; Trachtenberg et al., 2002; Majewska and Sur, 2003; Kleim et al., 2004; Mizrahi et al., 2004; Rensing et al., 2005; Zuo et al., 2005b; Holtmaat et al., 2006). Because of the potentially malleable nature of dendritic spines, they likely represent a key substrate of neuronal plasticity that underlies brain rewiring and recovery after injury. Indeed, there have been postmortem histological studies showing that stroke or brief ischemia can induce changes in dendritic branch complexity and spine density (Gonzalez and Kolb, 2003; Corbett et al., 2006). However, these studies provide only endpoint measures of reorganization, without providing information on the process of how these changes came about (Misgeld and Kerschensteiner, 2006). Here, we used two-photon microscopy to monitor real-time changes in dendritic structure in the living brain after stroke. Our results indicate that cerebral infarction induces robust changes in the architecture of peri-infarct apical dendrites and vasculature, and greatly enhances the rate of dendritic spinogenesis.
Materials and Methods
Transgenic Mice.
For in vivo imaging of cortical dendrites, adult C57BL6 (∼2.5–7 months of age) male transgenic mice expressing yellow fluorescent protein (YFP) were used in this study (YFP-H line) (Feng et al., 2000). These mice are particularly useful for imaging of dendritic structure because only a subset of neurons in layer 5 of the cortex are labeled and YFP filling of these neurons has Golgi-like detail (see Fig. 4). Mice were housed singly or in pairs, they were maintained on a 12 h light/dark cycle and given standard laboratory diet and water ad libitum. All experiments were conducted in accordance with the guidelines set forth by the Canadian Council for Animal Care.
Figure 4.

Time-lapse imaging of apical dendrites reveals heightened levels of spine formation in peri-infarct cortex. A, Maximal intensity z projection of 30 planar images (taken 1 μm apart, at 0 h) depicting the Golgi-like detail of YFP-labeled dendrites. In this field of view, a dendritic spine formed (box labeled B) and another retracted (box labeled C) over the imaging period. B, C, Time-lapse images (taken 1 h apart) showing the formation and retraction, respectively, of a dendritic spine. D, Relative to controls, the rate of spine formation was significantly increased in peri-infarct cortex at 1, 2, and 6 weeks after stroke. Spine elimination, although elevated, was not significantly different from control levels. E, Relative to controls, spine density was significantly reduced at 1 and 2 weeks, but appeared to recover by 6 weeks. *p < 0.05; **p < 0.005.
Photothrombosis.
To induce cerebral infarction, we used a modified version of the photothrombotic method originally described by Watson et al. (1985). This model was selected because it is minimally invasive and produces highly localized and reproducible lesions (Maxwell and Dyck, 2005). Briefly, animals were anesthetized with an injection of ketamine/xylazine (100 mg/kg ketamine, 10 mg/kg xylazine, i.p.) and fitted to a stereotaxic frame. Body temperature was maintained at 37°C using a heated blanket with feedback from a rectal probe coupled to a temperature regulator. A midline incision of the scalp was made and the skull overlying the forelimb region of cortex was exposed. Pilot experiments using EEG recordings or intrinsic signal optical imaging verified that this region corresponded to the cortical representation of the forelimb (data not shown). To facilitate photoactivation in the forelimb region of cortex (∼1.5 to 3 mm lateral; −0.5 to 1 mm anterior of bregma), a 1.5 × 1.5 mm region of skull was thinned to ∼50% of original thickness using a high-speed dental drill. Mice were given an injection of 1% (w/v) solution of Rose Bengal (i.p. 100 mg/kg) in PBS. For the initiation of photoactivation, the thinned region of skull was illuminated with a collimated beam of green laser light (532 nm, 17 mW; diameter ∼1.5 mm) for 15 min. Sham surgery controls were treated in an identical manner with the omission of either laser illumination or Rose Bengal injection. In either case, we did not observe any damage or structural alterations to dendritic fields related to the sham surgery. After surgery, mice were returned to their home cages and were allowed to recover.
Imaging experiments.
After a specified recovery period (1, 2, or 6 weeks), mice were anesthetized with 15% (w/v) urethane dissolved in distilled water (1.25 g/kg; supplemented at 0.25 g/kg when needed). A 3 × 3 mm piece of skull over the posterior–medial edge of the infarct was thinned with a dental drill and removed with forceps. To minimize movement artifact (caused by breathing and heart rate), the exposed brain was covered with 1.3% low-melt agarose (at 37–38°C; type 3-A; A9793; Sigma, St. Louis, MO) dissolved in a HEPES-buffered artificial CSF, and sealed with a custom cut glass coverslip. The skull was fastened to a steel plate over a large surface area with cyanoacrylate glue and dental cement, which was then directly screwed onto a metal plate that could be mounted onto the microscope. Any data collected from experiments in which movement artifact became a serious issue (e.g., if the steel plate became unfixed to the skull) or if breathing was labored and irregular, were not used in the analysis.
Two-photon imaging experiments were performed using a modified Olympus (Tokyo, Japan) BX50W1 upright microscope equipped with a Ti:sapphire Coherent (Santa Clara, CA) Mira 900 mode-locked laser that was tuned to 900 nm for YFP excitation. The laser produced 100 fs pulses at a rate of 76 MHz and was pumped by a 5 W Verdi argon laser. Excitation power measured at the back aperture of the objective was typically between 20 to 35 mW and was adjusted to achieve near identical levels of fluorescence within each imaging session. Images were acquired with either a 40 or 60× Olympus IR-LUMPLanFl water-immersion objective [numerical aperture (NA) of 0.8 or 0.9, respectively], using custom software routines (IgorPro; Wavemetrics, Eugene, OR) interfacing with a 16-bit data acquisition card (PCI-6110; National Instruments, Austin, TX) in a standard desktop personal computer.
To assess dendritic spine turnover, the apical dendritic tufts of YFP-labeled neurons were imaged every hour for a 6 and occasionally 7 h period. Over the course of this period, we did not observe any considerable changes in the overall shape (such as beading) or intensity of fluorescence within dendritic structures that may be indicative of photo-toxicity or bleaching. Any experiments in which image quality deteriorated over the 6 h imaging period were excluded from the analysis. To image peri-infarct dendrites and vasculature, the infarct border was initially identified by the absence of YFP fluorescence (note the sharp border shown in Figs. 2, 5). Using an x–y motorized stage to track the distance from the infarct border in micrometers (MS-2000; Applied Scientific Instruments, Eugene, OR), a region of cortex within 100–500 μm from the posterior-medial edge of the infarct would be selected and then imaged to a depth of 100 μm from the pial surface. This region of cortex corresponds to layer 1 of the primary motor/hindlimb sensorimotor cortex and has been implicated previously in cortical reorganization and recovery after focal brain injury (Castro-Alamancos and Borrel, 1995; Werhahn et al., 2003). In a few instances, we imaged regions of cortex beyond 500 μm from the infarct border to determine whether changes in dendritic and blood vessel structure were restricted to peri-infarct cortex (see Figs. 3G, 5). High-resolution image stacks consisted of 100 optical sections, taken 1 μm apart, covering an area of 140 × 140 μm (1024 × 1024 pixels, 0.137 μm per pixel), averaging three images per section. A median filter (radius, 1) was applied to each image to reduce photon or photomultiplier tube noise. We should note that averaging three images per optical section and applying a median filter did not noticeably reduce the clarity of images or our ability to detect spines, given that we found identical numbers of spines using frame averaging or by applying a filter (supplemental Fig. 1, available at www.jneurosci.org as supplemental material).
Figure 2.

Dendritic structure and function in peri-infarct cortex. A, Low-magnification brightfield image of the brain's surface in a YFP-transgenic mouse, two weeks after photothrombotic injury. In this case, the cortical infarction (top left in cranial window) occurred just medial and anterior of the forelimb (FL) and hindlimb (HL) representation of the sensorimotor cortex. B, C, To assess whether peri-infarct cortex was viable, functionally responsive cortex, we imaged intrinsic optical signals after stimulating the contralateral forelimb and hindlimb. After somatic stimulation, certain parts of the cortex appear darker, which is indicative of regionally elevated levels of deoxyhemoglobin (which absorbs the light) as a result of increased neuronal activity (Grinvald et al., 1986). The darker regions were in register with stereotaxic coordinates for forelimb and hindlimb regions. D, Enlarged view of boxed area in A showing cortical areas responsive to forelimb (green) and hindlimb (red) stimulation, superimposed over a brightfield image of the cortical surface. E, To compare the borders of functionally responsive tissue with cortical dendritic structure, the apical dendrites in hindlimb cortex (boxed area in D) were imaged in vivo and tiled together (z projections consisting of 50 planar images, 2 μm apart). As shown in D and E, the border between functionally responsive and nonresponsive cortical tissue corresponds well with the infarct border revealed by YFP-labeled dendrites.
Figure 5.

Dendritic spine formation is elevated specifically within peri-infarct areas. Representative example of a fixed brain section from a YFP-transgenic mouse (sagittal plane, 2 weeks after stroke) where spine turnover was assessed near and far from the infarct border (sites demarcated with DiI, red-orange color). Inset, Graph showing increased levels of spine formation in regions proximal, but not distal to the infarct. *p < 0.05. HPC, Hippocampus.
Figure 3.
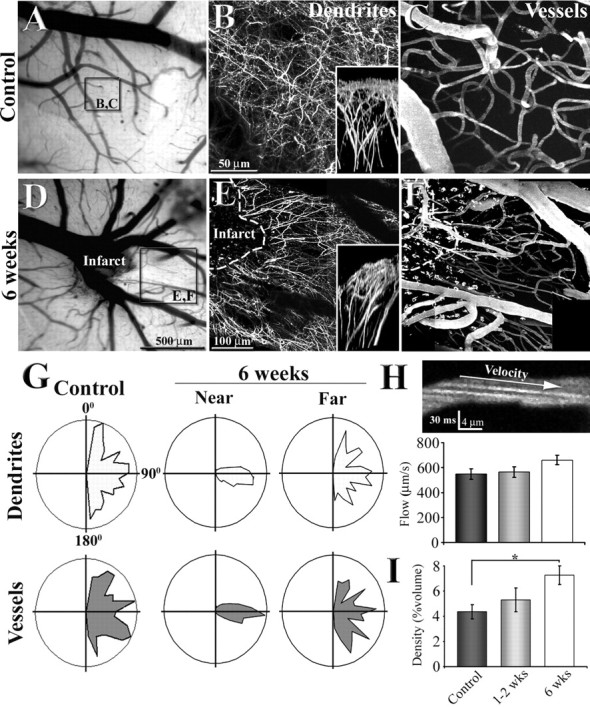
Reorganization of apical dendritic tufts and flowing vasculature in peri-infarct cortex. A, D, Low-magnification brightfield images showing the surface of the brain and vessels through the cranial window. B, C, E, F, Maximal intensity z projections of 80 planar sections (taken 2 μm apart) illustrating the organization of dendritic tufts and vasculature in a control (B, C) and 6 weeks after photothrombotic stroke (E, F). Insets in B and E show a side view of the apical dendritic tufts projected in the y–z axis. G, Polar plots showing the orientation of dendritic and vascular segments in control (n = 3) and regions near and far from the infarct border (n = 3; near, <250 μm; far, 500–800 μm). Note that 6 weeks after stroke, dendrites and vessels run in parallel with each other at a 90–100 angle in regions close to, but not further away from the infarct border. H, A sample image showing the arc created by flowing Texas Red labeled plasma (offset by negatively stained red blood cells) in the lumen of the capillary. Using the slope of these arcs to assess blood velocity, we found no significant differences in capillary blood flow velocity between control and peri-infarct regions. I, Graph showing a progressive increase in blood vessel density in peri-infarct cortex over time. *p < 0.05.
The resolution of in vivo images was assessed by pressure injection of 0.1 μm green fluorescent beads (Invitrogen, Eugene, OR) into layer 1 of the cortex through a glass micropipette (∼1 μm tip diameter) into a live animal. Using a 60× water objective (NA, 0.9), we captured high-resolution images stacks of fluorescent beads, using parameters identical to those for the time-lapse imaging of dendritic spines. The point spread function of a single fluorescent bead was assessed by plotting pixel intensity values in the x–y, and z dimensions. We then determined the width of intensity value distributions at half maximal intensity. Using this approach, we estimated that the resolution of in vivo images was 0.65 ± 0.035 μm in the x–y plane and 5.3 ± 0.23 μm in the axial plane (n = 10 beads).
After each experiment, the imaged area was demarcated by applying 0.5% DiI (Invitrogen) dissolved in DMSO to the cortical surface. Mice were overdosed with anesthetic and perfused with PBS followed by 4% paraformaldehyde in PBS. After 2 d of immersion fixation, brains were sunk in a 30% sucrose solution and cut frozen at 50 μm in the coronal or sagittal plane with a sliding microtome. Every fourth section was mounted on a glass slide and coverslipped with Fluoromount-G mounting solution (Southern Biotechnology Associates, Birmingham, AL). Sections were imaged using a Zeiss (Oberkochen, Germany) LSM Meta 510 confocal microscope equipped with a 20× objective (NA, 0.5), an argon laser tuned to 514 nm, and emission filters set to 530–560 nm.
For intrinsic optical imaging (Grinvald et al., 1986), the cortical surface was illuminated by red and green sets of light-emitting diodes (LEDs) mounted around the microscope objective driven by a regulated direct current power supply (Circuit Test, Burnaby, British Columbia, Canada). The green LED light source was used for visualizing the surface of the cortex and pattern of vessels. The red LED light source (center at 635 nm) was used for intrinsic signal optical imaging. For imaging of functional maps, the depth of focus was set to 200 μm below the cortical surface to reduce the contribution of large surface vessels. Image acquisition was performed using XCAP-standard version 2.2 imaging software (EPIX, Buffalo Grove, IL) with a charge-coupled device camera (XC ST70; Sony, Tokyo, Japan) through a 2.5× Zeiss Plan Neofluor 0.075 NA objective. We typical imaged an area of 3.1 × 2.3 mm with a pixel size of 4.1 μm. Each data collection session consists of 10 trials taken at 20 s apart. During each trial, 50 control images were collected over 1.67 s before, and another 50 images were collected (1.67 s) after contralateral limb stimulation. Eight-bit images in repeated trials were integrated in 16 bits and then a 32-bit ratio image depicting changes in 635 nm reflectance after stimulation was created (integrated stimulated image over 1.67 s divided by integrated baseline image over 1.67 s). We typically performed two sets of 10 stimulus trials to generate functional maps of forelimb and hindlimb cortex. Limb stimulation was produced by a pencil lead affixed to the skin of the contralateral forepaw or hindpaw under the control of a stereo speaker driven by an isolated pulse stimulator (Model 2100; A-M Systems, Everett, WA). Vibrotactile stimuli were delivered at 100 Hz for 1 s. Image acquisition, limb stimulation, and LED illumination were synchronized using transistor-transistor logic signals.
Data analysis.
Analysis of 16-bit image stacks was performed using NIH Image J or Igor Pro software. Because of lower two-photon resolution in the axial plane, only dendritic spines projecting laterally were included in the analysis. To assess spine formation or elimination over the imaging session, an observer blind to experimental condition compared maximal intensity image projections of dendritic segments (consisting of three to 10 sections) taken at 0 and 6 h to detect potential candidates of spine turnover. To definitively determine whether a candidate spine had formed or retracted, the spine would be located in the original three-dimensional image stack and a montage of the spine at each time point (using average intensity projections of three to five optical sections) would be generated to recreate the process of spine formation or elimination (see Fig. 4B,C). Using this approach, we could also exclude a small number of cases where spines transiently formed or disappeared before the end of the imaging period.
For a spine to be considered new or lost, it had to meet several criteria. First, it had to clearly protrude out of the shaft by at least four pixels (∼0.55 μm), or had to retract completely into the shaft of the dendrite by the end of the 6 h imaging session. Second, it had to be clearly identifiable (i.e., show high signal-to-noise ratio) without any large changes in image quality over the 6 h imaging period. For example, any spines from images that did not appear sharp or crisp, perhaps because of sudden movement, were excluded from the analysis. Third, it could not be part of a dendritic segment that appeared to have significantly rotated or shifted, as judged by any gross changes in the appearance of neighboring spines or branches. And finally, because it is difficult to distinguish dendritic filopodium from thin structures with optical microscopy (Knott et al., 2006), long-thin structures (present at the first time point) that turned into a shorter, more spine-like structure were not scored as “new” spines. Furthermore, a newly formed spine had to still be present by the end of the 6 h imaging session; therefore no transient spines were scored.
In addition to meeting the criteria mentioned above, some spines were subjected to an additional analysis that sought to rule out the possibility that newly formed spines may represent pre-existing spines on the shaft that happened to twist or rotate into the horizontal plane of view during the imaging experiment. This was done by generating an average intensity z projection of the dendritic spine and shaft at each time point in the imaging experiment. All spines included in this analysis appeared at the 4 h time point so that we could measure shaft fluorescence before and after spine formation. Our logic was that if a new spine was merely caused by a rotation of an existing spine, its contribution to the average shaft fluorescence (measured over a relatively large z volume) would be reduced when it rotated out of the region used for calculation of the shaft intensity. Each average intensity z projection consisted of five optical sections, spaced 1 μm apart. The first optical section (i.e., above the dendrite) was positioned just before the dendrite came into sharp focus and the last section was taken just after the dendrite went out of focus. The total fluorescence in the dendritic shaft (at the base of the spine) and spine were measured at each time point and normalized to adjacent segments of the dendrite to control for slight differences in signal intensity or image quality between time points. Data from multiple animals and spine appearances were pooled to increase statistical power and a one-way ANOVA was then calculated to determine whether there was a significant loss in shaft fluorescence, particularly at the 4 h mark of the experiment when the spine appeared.
Measurements of spine length (from spine head to shaft) were performed using Igor Pro (Wavemetrics). After manually drawing a line through the center of the spine to the shaft of the dendrite, custom-written software would then automatically plot the pixel intensity values (16 bit grayscale) averaged over three pixels in the x–y plane and three image sections in the z plane (supplemental Fig. 2, available at www.jneurosci.org as supplemental material). The beginning and end of each spine (i.e., where signal intensity changed ∼50%) were assigned by identifying zero crossings in the second order derivative of the intensity values along this transect (Marr and Hildreth, 1980). Calculated border positions were overlaid on the image as each transect was drawn, so any erroneous values could be immediately corrected.
The orientation of dendrites and vasculature in control (n = 3) and peri-infarct cortex (n = 3 mice at 6 weeks poststroke) were quantified by breaking up each component into 15–30 μm straight-line segments. The angle for each line segment was then assigned to a bin between 0 and 180° (10° per bin). Frequencies within each bin were normalized to the total number of segments measured in each animal. To provide a common frame of reference for dendritic and vascular orientation across different animals, the site of infarction was put in the “9:00 o'clock” position, and dendrites and vessels proximal (<250 μm) or distal (between 500 and 800 μm) to the infarct border were assessed. Polar plots shown in Figure 3G represent the relative frequency of angles for dendritic and vascular segments. An F test was used to determine whether there was a significant difference in the variance between control and 6 week distributions.
Multigroup comparisons were made using an ANOVA with post hoc t tests. A p value ≤0.05 was considering statistically significant, except for multiple post hoc comparisons, in which case the Bonferroni correction was used to set the α level. All data are expressed as the mean ± SE.
Results
To determine the effect of stroke on dendritic structure, adult transgenic mice expressing YFP (YFP-H line, >2.5 months) (Feng et al., 2000) were subjected to targeted photothombotic stroke and allowed to recover for 1, 2, or 6 weeks (for experimental overview, see Fig. 1A). Damage was localized to the forelimb sensorimotor cortex because previous studies have shown that survivable stroke in humans are usually small in size (Carmichael, 2005), and that this type of lesion reliably produces a transient loss of function in contralateral forelimb that is accompanied by gradual restoration of function (Wood et al., 1996; Gonzalez and Kolb, 2003; Shanina et al., 2006). Typically, photothrombotic stroke produced a bowl shaped region of dead tissue (i.e., an infarct) that extended from the pial surface to layer 6, with an average volume of 0.97 ± 0.11 mm3 (n = 9) (Fig. 1B,C). The lesion displayed a very sharp transition zone between dead and surviving tissue (Fig. 1B,C) and appeared to stabilize within the first week after ischemia, given that lesion volume did not increase between 1 and 2 weeks poststroke (0.975 vs 0.974 mm3, respectively; p = 0.49).
Figure 1.

A, Summary of experimental design. B, Representative example of cortical infarction induced by photothrombosis 1 week earlier. Nissl-stained coronal sections, ∼300 μm apart, are arranged in an anterior–posterior manner. In most cases, the infarct zone was centered over the forelimb representation of the sensorimotor cortex and spanned all cortical layers, leaving the white matter intact. C, Coronal section showing the expression of YFP labeling in the cortex. Note that labeling is confined primarily to layer 5 neurons (green), which possess a long apical dendrite that extends to the pial surface and branches laterally. These apical dendritic tufts in peri-infarct cortex were repeatedly imaged to assess dendritic spine turnover and were subsequently marked by DiI injection (red).
To verify the functional competency of peri-infarct cortical neurons, we used intrinsic signal optical imaging at 2 and 6 weeks poststroke to map sensory evoked responses to mechanical stimulation of the contralateral forelimb and hindlimb (Fig. 2A). At both time points, cortical territory adjacent to the infarct border clearly exhibited a hemodynamic response to stimulation of the contralateral forelimb and hindlimb (Fig. 2B,C), indicative of sensory-evoked increases in neuronal activity (Grinvald et al., 1986). Moreover, the border between YFP-labeled dendrites and the infarct zone corresponded with the border between functionally responsive tissue and the presumptive infarct zone (Fig. 2, compare D, E). Collectively, these observations justified our imaging of dendrites within 100–500 μm of the infarct border because they constitute a functionally viable and potentially important site for brain recovery.
Reorganization of apical dendrites and vasculature in peri-infarct cortex
After 1, 2, or 6 weeks of recovery, the apical dendritic tufts of layer 5 neurons and the surrounding vasculature were imaged by injecting YFP-transgenic mice (i.v., n = 14 mice) with a red fluorescent dextran that labels blood plasma (Texas Red; molecular weight, 70 kDa; Invitrogen). In control mice, the apical dendritic tufts and vasculature had a tortuous appearance, intertwined with one another without any obvious spatial relationship (Fig. 3B,C,G). In contrast, these components in peri-infarct areas exhibited a markedly different pattern of organization relative to controls. In this case, the dendrites and vasculature appeared to run in parallel with each other, radiating outward from the edge of the infarct border (Fig. 3E,F). This change in organization was apparent, albeit subtle, 2 weeks after stroke (Fig. 2E) and became more striking by 6 weeks (Fig. 3E,F). As indicated by the polar plots in Figure 3G, the overwhelming majority of dendritic and vascular segments in peri-infarct cortex (near, <250 μm of infarct border) were oriented at 90–100° from the infarct rim. Quantitatively, the distributions of blood vessel and dendrite orientation near the infarct border at 6 weeks were significantly different from controls (blood vessels, F(17,17) = 14.02, p < 0.0001; dendrites, F(17,17) = 15.20, p < 0.0001) (Figure 3G). This effect was restricted to areas proximal to the infarct border, given that the orientation of blood vessels and dendrites further away (far, between 500 and 800 μm) were comparable with that observed in controls (blood vessels, F(17,17) = 1.62, p = 0.32; dendrites, F(17,17) = 1.77, p = 0.24) (Figure 3G).
In addition to viewing the overall structure of peri-infarct vasculature, we were able to quantify blood flow velocity by measuring the arc of fluorescently labeled plasma (Fig. 3H) moving through the lumen of capillaries (Kleinfeld et al., 1998; Schaffer et al., 2006). From this, we found that blood-flow velocity was comparable between control and peri-infarct regions at 1–2 or 6 weeks after stroke (F(2,11) = 1.97; p = 0.19) (Fig. 3H). Consistent with previous reports describing robust angiogenesis in peri-infarct regions (Wei et al., 2001; Lin et al., 2002), the density of blood vessels in the peri-infarct cortex (expressed as the percentage of total volume occupied by vessels) increased over time (F(2,11) = 4.12; p = 0.04) (Fig. 3I), particularly by the 6 week time period (7.25% at 6 weeks vs 4.36% in controls; t(8) = 3.14; p < 0.01).
Dendritic spine turnover in peri-infarct cortex
By viewing images in the axial plane, we noticed that the apical dendrites of neurons immediately adjacent to the lesion displayed a slanted orientation (Fig. 3B,E, compare insets). This change in the overall appearance of dendrites proved to be particularly problematic, especially for repeated imaging of the same dendrites before and after stroke. Given the likelihood that these large-scale changes in dendritic geometry would lead to erroneous estimates of spine turnover, which requires some constancy in the appearance of neighboring structures, we chose to evaluate spine turnover with an acute rather than chronic imaging session. Other reasons for using acute imaging in this study was the inability to predict exactly where the infarct rim would reside and concern that evolution of stroke damage may be difficult to differentiate from time dependent changes in the quality of the craniotomy.
To examine changes in the rate of dendritic spine turnover after stroke, we imaged the apical dendritic tufts of layer 5 cortical neurons every hour for a 6 and occasionally 7 h period. Over this time, we could unambiguously identify a small fraction of dendritic spines that had either formed or retracted (Fig. 4B,C). On average, these dynamic spines tended to be slightly shorter in length than stable spines (1.03 ± 0.04 μm vs 1.21 ± 0.01 μm, respectively). The appearance or disappearance of a spine would occur over a fairly short period of time, usually within 1 to 3 h (Fig. 4B,C). In some cases, spine turnover would be associated with a subtle engorgement of the dendritic shaft. In Figure 4, B and C, one can note a subtle swelling of the shaft just preceding the formation of a spine or after its retraction. It is important to note that these occasional swellings associated with spine turnover were not related to any local trauma or phototoxicity-induced beading (Zhang et al., 2005), because YFP intensity in adjacent dendritic segments did not change significantly over the 6 h period (F(6,26) = 0.70; p = 0.65). Furthermore, to rule out the possibility that these bright spots on the shaft where spines formed were not actually pre-existing spines that happened to rotate into the horizontal plane of imaging thereby giving the appearance of a newly formed spine, we measured the intensity of YFP in the shaft where spines emerged at each time point. This was done because the z resolution of in vivo two-photon microscopy (see Materials and Methods) is not sufficient to distinguish spines (∼1 μm) that project axially into the imaging plane. However, these spines would contribute to the integrated shaft fluorescence. Our analysis demonstrated that YFP fluorescence levels in the shaft (where the spine emerged) did not drop significantly at the time of spine formation or during the entire imaging session (F(6,26) = 0.58; p = 0.74; n = 6 cases of spine formation). Furthermore, manually rotating a fixed YFP-positive brain section on a glass slide by up to 40° did not cause spines to appear or disappear after rotation. Collectively, these analyses (manual rotation and integrated shaft fluorescence) support the idea that newly appearing spines were not attributable to pre-existing spines that rotate into the horizontal plane of view.
Consistent with previous reports (Grutzendler et al., 2002; Trachtenberg et al., 2002; Zuo et al., 2005a), dendritic spines were relatively stable in control mice during acute imaging. On average, only 0.14 and 0.19% of the total population of spines were formed or eliminated, respectively, over the 6 h period of imaging (Fig. 4D) (n = 6 mice; 4266 spines). After stroke, however, the average rate of spine formation increased significantly (Fig. 4D) (F(3,13) = 8.83; p < 0.005) in peri-infarct regions at 1 week (1.37%; n = 4 mice; 1590 spines; t(8) = 4.85; p < 0.005), 2 weeks (0.93%; n = 4 mice; 1566 spines; t(8) = 4.43; p < 0.005), and even 6 weeks (0.75%; n = 3 mice; 1788 spines; t(7) = 6.17; p < 0.005). Levels of spine elimination in peri-infarct cortex, although somewhat elevated, were not significantly greater than controls (F(3,13) = 2.11; p = 0.148). Although changes in dendritic spine turnover may not translate precisely with changes in spine density, especially considering that some spines have short half-lives (Holtmaat et al., 2005), we did find that increased turnover after stroke correlated with the recovery of spine density levels. Relative to control animals (2.23 spines/10 μm; n = 6 mice), spine density dropped significantly 1 week after stroke (1.81 spines/10 μm; n = 4 mice; t(8) = 4.17; p < 0.01). Two weeks after stroke (1.88 spines/10 μm; n = 4 mice) spine density increased slightly relative to 1 week (t(6) = 0.89; p = 0.2). By 6 weeks (2.08 spines/10 μm; n = 5 mice), spine density had increased further and was comparable with that found in controls (t(8) = 1.43; p = 0.09).
Previous studies in rats and nonhuman primates have indicated that areas far from the site of cortical infarction can undergo considerable changes in structure and function (Frost et al., 2003; Dancause et al., 2005). This raises the question of whether changes in spine turnover are specific to peri-infarct cortex, or could be distributed among more remote cortical regions. To address this question, we compared dendritic spine turnover in cortical regions close to and far away from a cerebral infarction induced 2 weeks earlier (Fig. 5) (n = 3 mice; near, 0.33 ± 0.05 mm from infarct edge; far, 1.65 ± 0.09 mm corresponding to the trunk representation of the somatosensory cortex). Our results indicate that rates of spine formation but not elimination were significantly elevated in regions near the infarct, but not in more distant areas (spines gained, 0.85 vs 0.22%, t(3) = 4.87, p < 0.01; spines lost, 0.68 vs 0.18%, t(3) = 1.92, p = 0.08). In fact, turnover rates in cortical regions distant from the lesion were comparable with that found in controls (p > 0.05) (compare Figs. 4D, 5). We should note that these observations do not rule out the possibility that turnover rates may change in other cortical areas (e.g., contralateral sensory/motor cortex) that share extensive connections with forelimb cortex and become more relied on after unilateral stroke (Jones and Schallert, 1994; Biernaskie et al., 2005).
Discussion
The development of two-photon imaging techniques (Denk and Svoboda, 1997) coupled with the introduction of transgenic mice that possess prelabeled cortical neurons (Feng et al., 2000), has enabled investigators to visualize real-time changes in the structure of dendritic spines in vivo. Data generated from these studies has shown that although dendritic spines can be driven to change by developmental or experiential factors, the majority of dendritic spines in adult control animals, especially over shorter imaging periods (across hours), are relatively stable (Grutzendler et al., 2002; Trachtenberg et al., 2002; Majewska and Sur, 2003; Zuo et al., 2005a). Here, we have confirmed these observations showing that the majority of dendritic spines in adult control animals were stable over the 6 h imaging period. Furthermore, we found that rates of spine formation versus elimination in control animals were balanced over this period of time. This finding is supported by longitudinal imaging studies showing that spine densities remain constant over several weeks in adult mice (Holtmaat et al., 2005; Zuo et al., 2005a; Holtmaat et al., 2006).
After stroke, the brain must undergo considerable modifications if it is to successfully adapt to new challenges brought about by injury. One mechanism through which this may occur is by rearranging existing dendritic arbors or by making new synaptic contacts. In accordance with this, postmortem investigations have reported that cortical injury significantly alters branch complexity, spine density, and synapse number in peri-infarct cortical dendrites (Gonzalez and Kolb, 2003; Ito et al., 2006). Histochemical markers of axonal sprouting and presynaptic terminals such as GAP-43 and synaptophysin, respectively, become progressively enriched in the peri-infarct cortex (Stroemer et al., 1995), suggesting that peri-infarct regions may be a prime site of synaptic reorganization after stroke. However, virtually nothing is known about the process by which these changes came about, given that histological studies cannot provide information on moment-to-moment changes in structure. Here, we have extended these observations to the in vivo preparation and found that dendritic spines become exceptionally malleable after stroke. This change in dendrite stability was manifested by a significant increase in dendritic spine formation that peaked at 1–2 weeks, persisted for up to 6 weeks, and was specific to the peri-infarct cortex. This finding correlates spatially with other reports showing that stroke induces significant changes in the functional representation of peri-infarct regions (Dijkhuizen et al., 2001; Wei et al., 2001), as well as temporally with the time course of behavioral recovery of forepaw function (Shanina et al., 2006). Although a causal link between increased dendritic spine formation and recovery of function has not been clearly established, it is tempting to speculate that changes in the rate of spine formation during recovery may represent a critical period for which the brain may be particularly amenable to therapeutic interventions. Incidentally, previous work has shown that rehabilitative therapies are most beneficial when initiated shortly after injury (within 1–2 weeks), and become less efficacious over time (Biernaskie et al., 2004; Ploughman and Corbett, 2004).
What neurobiological mechanisms are responsible for enhanced dendritic spine plasticity after stroke? It is well established that stroke induces sequential waves of gene expression in peri-infarct cortex that involve a number of factors such as GAP-43, chondroitin sulfate proteoglycans, matrix metalloproteinases, ephrins, and semaphorin, all of which can regulate neuronal structure in some manner (Carmichael et al., 2005; Zhao et al., 2006). Stroke is also accompanied by profound physiological and behavioral changes. For example, focal infarction causes an increase in spontaneous firing rates and excitatory postsynaptic potentials in peri-infarct neurons (Carmichael, 2003), concomitant with a reduction in inhibitory currents and receptors (Neumann-Haefelin et al., 1995; Redecker et al., 2002). Behaviorally, animals alter their usual patterns of limb use and motor sequences to compensate for the loss of function in affected limbs (Farr and Whishaw, 2002). Considering recent in vivo data showing that spine turnover rates are augmented by proconvulsive drugs (Rensing et al., 2005), NMDA receptor antagonists (Zuo et al., 2005b), or changes in sensory experience (Oray et al., 2004; Zuo et al., 2005b; Holtmaat et al., 2006), it is likely that multiple factors contribute to spine plasticity after stroke.
The results of our study also suggest that stroke induces significant changes in the organization of apical dendritic arbors and vasculature. The fact that these changes became more salient over time (especially by 6 weeks), correlated with the appearance of a cortical “dimple” that forms when dead tissue and debris in the core of the infarct have been removed, and a prominent scar forms (Fig. 3). This temporal correlation, in tandem with our side view projections showing slanted dendritic stalks immediately next to the lesion (Fig. 3), would suggest that peri-infarct regions were subject to strong mechanical forces. One might expect that the progressive contortion of structures over time would have significant functional consequences that could impact recovery (perhaps even negatively), particularly for dendrites trying to maintain connections with presynaptic terminals that may have arisen from distant regions of the brain. In conjunction with mechanical forces, stroke may also trigger the growth and/or retraction of dendrites and blood vessels. Indeed there is substantial support for the idea that blood vessels proliferate in peri-infarct regions (Wei et al., 2001; Lin et al., 2002; Tomita et al., 2005), and that dendrites in the adult brain are capable of remodeling (Tailby et al., 2005; Lee et al., 2006). However, how these two processes relate to one another is unknown and should warrant additional investigation. Of note, accumulating evidence has suggested that many of the molecular mechanisms responsible for the development and patterning of vasculature are also important for neuronal wiring (Carmeliet and Tessier-Lavigne, 2005).
To determine how stroke affects the structure of peri-infarct neurons, we used the photothrombotic method. This model of stroke involves the systemic administration of a light-sensitive dye that can be rapidly and reliably photoactivated, leading to clot formation within discrete brain regions in a relatively noninvasive manner (Watson et al., 1985). Consequently, a number of investigators have used this method to study neurochemical and electrophysiological changes that take place in peri-infarct regions (Neumann-Haefelin et al., 1995; Redecker et al., 2002; Carmichael, 2003a). However one potential drawback of this method is that it does not permit controlled reperfusion, thereby raising the question of whether the structural changes observed in the present study would be found in other models of stroke. It should be noted that some spontaneous reperfusion does occur within photothrombotic models, which can lead to the recovery of dendritic spines temporarily lost to ischemia (Zhang et al., 2005). Although it is conceivable that the time course or magnitude of changes in spine turnover may differ depending on the model of stroke, we doubt that the direction of stroke-induced changes in turnover (i.e., increased spine formation during recovery) would be different. Consistent with this idea, other groups using different models of stroke and histological assays have found that spine density drops initially after stroke and gradually recovers over time (Corbett et al., 2006; Ito et al., 2006). In addition, recent data from our laboratory has shown that the dendritic morphology of acutely ischemic layer 5 neurons in photothrombotic models is very similar to that observed in a middle cerebral artery occlusion model (Enright et al., 2007).
Here, we provided real-time evidence for the reorganization of synaptic circuits in brain tissues recovering from stroke in vivo. Our results suggest that adjacent, surviving cortical areas undergo an extensive period of dendritic remodelling for many weeks after stroke. The reorganization of dendrites was most evident in regions proximal to the stroke and appears to be closely tied to the pattern of neighboring, possibly new vasculature. Given the fundamental importance of dendrites and spines in neurotransmission and synaptic plasticity, our data suggest that these macroscopic and microscopic changes in dendrite structure may subserve functional and/or behavioral changes that accompany stroke. Moreover, the ability to observe heightened rates of spine production within an experiment suggests new possibilities where brain stimulation or movement-induced therapies could be tuned to optimize synaptic reorganization and facilitate recovery of function.
Footnotes
This work was supported by the Natural Sciences and Engineering Research Council of Canada and Canadian Institutes of Health Research (CIHR) postdoctoral fellowships to C.E.B., CIHR Operating Grant MOP49586 to T.H.M., and funds from the Canadian Stroke Network (T.H.M.). T.H.M. is a Michael Smith Foundation for Health Research senior scholar. We thank Carrie Wang, Charles Wong, and Bill Olin for assisting in data analysis, Ian Winship and Gautam Awatramani for comments on this manuscript, Lauren Enright and Alaa El-Husseini for use of the confocal microscope, Heidi Erb for genotyping mice, Shawn Zhang and PuMin Wang for tail vein injections, and Alexander Goroshkov for technical assistance with the two-photon microscope.
References
- Biernaskie J, Chernenko G, Corbett D. Efficacy of rehabilitative experience declines with time after focal ischemic brain injury. J Neurosci. 2004;24:1245–1254. doi: 10.1523/JNEUROSCI.3834-03.2004. [DOI] [PMC free article] [PubMed] [Google Scholar]
- Biernaskie J, Szymanska A, Windle V, Corbett D. Bi-hemispheric contribution to functional motor recovery of the affected forelimb following focal ischemic brain injury in rats. Eur J Neurosci. 2005;21:989–999. doi: 10.1111/j.1460-9568.2005.03899.x. [DOI] [PubMed] [Google Scholar]
- Carmeliet P, Tessier-Lavigne M. Common mechanisms of nerve and blood vessel wiring. Nature. 2005;436:193–200. doi: 10.1038/nature03875. [DOI] [PubMed] [Google Scholar]
- Carmichael ST. Plasticity of cortical projections after stroke. Neuroscientist. 2003a;9:64–75. doi: 10.1177/1073858402239592. [DOI] [PubMed] [Google Scholar]
- Carmichael ST. Gene expression changes after focal stroke, traumatic brain and spinal cord injuries. Curr Opin Neurol. 2003b;16:699–704. doi: 10.1097/01.wco.0000102621.38669.77. [DOI] [PubMed] [Google Scholar]
- Carmichael ST. Rodent models of focal stroke: size, mechanism, and purpose. NeuroRx. 2005;2:396–409. doi: 10.1602/neurorx.2.3.396. [DOI] [PMC free article] [PubMed] [Google Scholar]
- Carmichael ST. Cellular and molecular mechanisms of neural repair after stroke: making waves. Ann Neurol. 2006;59:735–742. doi: 10.1002/ana.20845. [DOI] [PubMed] [Google Scholar]
- Carmichael ST, Archibeque I, Luke L, Nolan T, Momiy J, Li S. Growth-associated gene expression after stroke: evidence for a growth-promoting region in peri-infarct cortex. Exp Neurol. 2005;193:291–311. doi: 10.1016/j.expneurol.2005.01.004. [DOI] [PubMed] [Google Scholar]
- Castro-Alamancos MA, Borrel J. Functional recovery of forelimb response capacity after forelimb primary motor cortex damage in the rat is due to the reorganization of adjacent areas of cortex. Neuroscience. 1995;68:793–805. doi: 10.1016/0306-4522(95)00178-l. [DOI] [PubMed] [Google Scholar]
- Corbett D, Giles T, Evans S, McLean J, Biernaskie J. Dynamic changes in CA1 dendritic spines associated with ischemic tolerance. Exp Neurol. 2006;202:133–138. doi: 10.1016/j.expneurol.2006.05.020. [DOI] [PubMed] [Google Scholar]
- Cramer SC, Chopp M. Recovery recapitulates ontogeny. Trends Neurosci. 2000;23:265–271. doi: 10.1016/s0166-2236(00)01562-9. [DOI] [PubMed] [Google Scholar]
- Dancause N, Barbay S, Frost SB, Plautz EJ, Chen D, Zoubina EV, Stowe AM, Nudo RJ. Extensive cortical rewiring after brain injury. J Neurosci. 2005;25:10167–10179. doi: 10.1523/JNEUROSCI.3256-05.2005. [DOI] [PMC free article] [PubMed] [Google Scholar]
- Denk W, Svoboda K. Photon upmanship: why multiphoton imaging is more than a gimmick. Neuron. 1997;18:351–357. doi: 10.1016/s0896-6273(00)81237-4. [DOI] [PubMed] [Google Scholar]
- Dijkhuizen RM, Ren J, Mandeville JB, Wu O, Ozdag FM, Moskowitz MA, Rosen BR, Finklestein SP. Functional magnetic resonance imaging of reorganization in rat brain after stroke. Proc Natl Acad Sci USA. 2001;98:12766–12771. doi: 10.1073/pnas.231235598. [DOI] [PMC free article] [PubMed] [Google Scholar]
- Enright LE, Zhang S, Murphy TH. Fine mapping of the spatial relationship between acute ischemia and dendritic structure indicates selective vulnerability of layer V neuron dendritic tufts within single neurons in vivo. J Cereb Blood Flow Metab. 2007 doi: 10.1038/sj.jcbfm.9600428. in press. [DOI] [PubMed] [Google Scholar]
- Farr TD, Whishaw IQ. Quantitative and qualitative impairments in skilled reaching in the mouse (Mus musculus) after a focal motor cortex stroke. Stroke. 2002;33:1869–1875. doi: 10.1161/01.str.0000020714.48349.4e. [DOI] [PubMed] [Google Scholar]
- Feng G, Mellor RH, Bernstein M, Keller-Peck C, Nguyen QT, Wallace M, Nerbonne JM, Lichtman JW, Sanes JR. Imaging neuronal subsets in transgenic mice expressing multiple spectral variants of GFP. Neuron. 2000;28:41–51. doi: 10.1016/s0896-6273(00)00084-2. [DOI] [PubMed] [Google Scholar]
- Frost SB, Barbay S, Friel KM, Plautz EJ, Nudo RJ. Reorganization of remote cortical regions after ischemic brain injury: a potential substrate for stroke recovery. J Neurophysiol. 2003;89:3205–3214. doi: 10.1152/jn.01143.2002. [DOI] [PubMed] [Google Scholar]
- Gonzalez CL, Kolb B. A comparison of different models of stroke on behaviour and brain morphology. Eur J Neurosci. 2003;18:1950–1962. doi: 10.1046/j.1460-9568.2003.02928.x. [DOI] [PubMed] [Google Scholar]
- Grinvald A, Lieke E, Frostig RD, Gilbert CD, Wiesel TN. Functional architecture of cortex revealed by optical imaging of intrinsic signals. Nature. 1986;324:361–364. doi: 10.1038/324361a0. [DOI] [PubMed] [Google Scholar]
- Grutzendler J, Kasthuri N, Gan WB. Long-term dendritic spine stability in the adult cortex. Nature. 2002;420:812–816. doi: 10.1038/nature01276. [DOI] [PubMed] [Google Scholar]
- Harris KM. Structure, development, and plasticity of dendritic spines. Curr Opin Neurobiol. 1999;9:343–348. doi: 10.1016/s0959-4388(99)80050-6. [DOI] [PubMed] [Google Scholar]
- Holtmaat A, Wilbrecht L, Knott GW, Welker E, Svoboda K. Experience-dependent and cell-type-specific spine growth in the neocortex. Nature. 2006;441:979–983. doi: 10.1038/nature04783. [DOI] [PubMed] [Google Scholar]
- Holtmaat AJ, Trachtenberg JT, Wilbrecht L, Shepherd GM, Zhang X, Knott GW, Svoboda K. Transient and persistent dendritic spines in the neocortex in vivo. Neuron. 2005;45:279–291. doi: 10.1016/j.neuron.2005.01.003. [DOI] [PubMed] [Google Scholar]
- Ito U, Kuroiwa T, Nagasao J, Kawakami E, Oyanagi K. Temporal profiles of axon terminals, synapses and spines in the ischemic penumbra of the cerebral cortex: ultrastructure of neuronal remodeling. Stroke. 2006;37:2134–2139. doi: 10.1161/01.STR.0000231875.96714.b1. [DOI] [PubMed] [Google Scholar]
- Jaillard A, Martin CD, Garambois K, Lebas JF, Hommel M. Vicarious function within the human primary motor cortex? A longitudinal fMRI stroke study. Brain. 2005;128:1122–1138. doi: 10.1093/brain/awh456. [DOI] [PubMed] [Google Scholar]
- Jones TA, Schallert T. Use-dependent growth of pyramidal neurons after neocortical damage. J Neurosci. 1994;14:2140–2152. doi: 10.1523/JNEUROSCI.14-04-02140.1994. [DOI] [PMC free article] [PubMed] [Google Scholar]
- Kirov SA, Harris KM. Dendrites are more spiny on mature hippocampal neurons when synapses are inactivated. Nat Neurosci. 1999;2:878–883. doi: 10.1038/13178. [DOI] [PubMed] [Google Scholar]
- Kleim JA, Hogg TM, VandenBerg PM, Cooper NR, Bruneau R, Remple M. Cortical synaptogenesis and motor map reorganization occur during late, but not early, phase of motor skill learning. J Neurosci. 2004;24:628–633. doi: 10.1523/JNEUROSCI.3440-03.2004. [DOI] [PMC free article] [PubMed] [Google Scholar]
- Kleinfeld D, Mitra PP, Helmchen F, Denk W. Fluctuations and stimulus-induced changes in blood flow observed in individual capillaries in layers 2 through 4 of rat neocortex. Proc Natl Acad Sci USA. 1998;95:15741–15746. doi: 10.1073/pnas.95.26.15741. [DOI] [PMC free article] [PubMed] [Google Scholar]
- Knott GW, Holtmaat A, Wilbrecht L, Welker E, Svoboda K. Spine growth precedes synapse formation in the adult neocortex in vivo. Nat Neurosci. 2006;9:1117–1124. doi: 10.1038/nn1747. [DOI] [PubMed] [Google Scholar]
- Lee WC, Huang H, Feng G, Sanes JR, Brown EN, So PT, Nedivi E. Dynamic remodeling of dendritic arbors in GABAergic interneurons of adult visual cortex. PLoS Biol. 2006;4:e29. doi: 10.1371/journal.pbio.0040029. [DOI] [PMC free article] [PubMed] [Google Scholar]
- Li S, Carmichael ST. Growth-associated gene and protein expression in the region of axonal sprouting in the aged brain after stroke. Neurobiol Dis. 2006;23:362–373. doi: 10.1016/j.nbd.2006.03.011. [DOI] [PubMed] [Google Scholar]
- Lin TN, Sun SW, Cheung WM, Li F, Chang C. Dynamic changes in cerebral blood flow and angiogenesis after transient focal cerebral ischemia in rats. Evaluation with serial magnetic resonance imaging. Stroke. 2002;33:2985–2991. doi: 10.1161/01.str.0000037675.97888.9d. [DOI] [PubMed] [Google Scholar]
- Majewska A, Sur M. Motility of dendritic spines in visual cortex in vivo: changes during the critical period and effects of visual deprivation. Proc Natl Acad Sci USA. 2003;100:16024–16029. doi: 10.1073/pnas.2636949100. [DOI] [PMC free article] [PubMed] [Google Scholar]
- Marr D, Hildreth E. Theory of edge detection. Proc R Soc Lond B Biol Sci. 1980;207:187–217. doi: 10.1098/rspb.1980.0020. [DOI] [PubMed] [Google Scholar]
- Maxwell KA, Dyck RH. Induction of reproducible focal ischemic lesions in neonatal mice by photothrombosis. Dev Neurosci. 2005;27:121–126. doi: 10.1159/000085983. [DOI] [PubMed] [Google Scholar]
- Misgeld T, Kerschensteiner M. In vivo imaging of the diseased nervous system. Nat Rev Neurosci. 2006;7:449–463. doi: 10.1038/nrn1905. [DOI] [PubMed] [Google Scholar]
- Mizrahi A, Crowley JC, Shtoyerman E, Katz LC. High-resolution in vivo imaging of hippocampal dendrites and spines. J Neurosci. 2004;24:3147–3151. doi: 10.1523/JNEUROSCI.5218-03.2004. [DOI] [PMC free article] [PubMed] [Google Scholar]
- Neumann-Haefelin T, Hagemann G, Witte OW. Cellular correlates of neuronal hyperexcitability in the vicinity of photochemically induced cortical infarcts in rats in vitro. Neurosci Lett. 1995;193:101–104. doi: 10.1016/0304-3940(95)11677-o. [DOI] [PubMed] [Google Scholar]
- Nudo RJ, Wise BM, SiFuentes F, Milliken GW. Neural substrates for the effects of rehabilitative training on motor recovery after ischemic infarct. Science. 1996;272:1791–1794. doi: 10.1126/science.272.5269.1791. [DOI] [PubMed] [Google Scholar]
- Oray S, Majewska A, Sur M. Dendritic spine dynamics are regulated by monocular deprivation and extracellular matrix degradation. Neuron. 2004;44:1021–1030. doi: 10.1016/j.neuron.2004.12.001. [DOI] [PubMed] [Google Scholar]
- Ploughman M, Corbett D. Can forced-use therapy be clinically applied after stroke? An exploratory randomized controlled trial. Arch Phys Med Rehabil. 2004;85:1417–1423. doi: 10.1016/j.apmr.2004.01.018. [DOI] [PubMed] [Google Scholar]
- Redecker C, Wang W, Fritschy JM, Witte OW. Widespread and long-lasting alterations in GABA(A)-receptor subtypes after focal cortical infarcts in rats: mediation by NMDA-dependent processes. J Cereb Blood Flow Metab. 2002;22:1463–1475. doi: 10.1097/01.WCB.0000034149.72481.BD. [DOI] [PubMed] [Google Scholar]
- Rensing N, Ouyang Y, Yang XF, Yamada KA, Rothman SM, Wong M. In vivo imaging of dendritic spines during electrographic seizures. Ann Neurol. 2005;58:888–898. doi: 10.1002/ana.20658. [DOI] [PubMed] [Google Scholar]
- Schaffer CB, Friedman B, Nishimura N, Schroeder LF, Tsai PS, Ebner FF, Lyden PD, Kleinfeld D. Two-photon imaging of cortical surface microvessels reveals a robust redistribution in blood flow after vascular occlusion. PLoS Biol. 2006;4:e22. doi: 10.1371/journal.pbio.0040022. [DOI] [PMC free article] [PubMed] [Google Scholar]
- Shanina EV, Schallert T, Witte OW, Redecker C. Behavioral recovery from unilateral photothrombotic infarcts of the forelimb sensorimotor cortex in rats: role of the contralateral cortex. Neuroscience. 2006;139:1495–1506. doi: 10.1016/j.neuroscience.2006.01.016. [DOI] [PubMed] [Google Scholar]
- Stroemer RP, Kent TA, Hulsebosch CE. Neocortical neural sprouting, synaptogenesis, and behavioral recovery after neocortical infarction in rats. Stroke. 1995;26:2135–2144. doi: 10.1161/01.str.26.11.2135. [DOI] [PubMed] [Google Scholar]
- Tailby C, Wright LL, Metha AB, Calford MB. Activity-dependent maintenance and growth of dendrites in adult cortex. Proc Natl Acad Sci USA. 2005;102:4631–4636. doi: 10.1073/pnas.0402747102. [DOI] [PMC free article] [PubMed] [Google Scholar]
- Tomita Y, Kubis N, Calando Y, Tran Dinh A, Meric P, Seylaz J, Pinard E. Long-term in vivo investigation of mouse cerebral microcirculation by fluorescence confocal microscopy in the area of focal ischemia. J Cereb Blood Flow Metab. 2005;25:858–867. doi: 10.1038/sj.jcbfm.9600077. [DOI] [PubMed] [Google Scholar]
- Trachtenberg JT, Chen BE, Knott GW, Feng G, Sanes JR, Welker E, Svoboda K. Long-term in vivo imaging of experience-dependent synaptic plasticity in adult cortex. Nature. 2002;420:788–794. doi: 10.1038/nature01273. [DOI] [PubMed] [Google Scholar]
- Watson BD, Dietrich WD, Busto R, Wachtel MS, Ginsberg MD. Induction of reproducible brain infarction by photochemically initiated thrombosis. Ann Neurol. 1985;17:497–504. doi: 10.1002/ana.410170513. [DOI] [PubMed] [Google Scholar]
- Wei L, Erinjeri JP, Rovainen CM, Woolsey TA. Collateral growth and angiogenesis around cortical stroke. Stroke. 2001;32:2179–2184. doi: 10.1161/hs0901.094282. [DOI] [PubMed] [Google Scholar]
- Werhahn KJ, Conforto AB, Kadom N, Hallett M, Cohen LG. Contribution of the ipsilateral motor cortex to recovery after chronic stroke. Ann Neurol. 2003;54:464–472. doi: 10.1002/ana.10686. [DOI] [PubMed] [Google Scholar]
- Wood NI, Sopesen BV, Roberts JC, Pambakian P, Rothaul AL, Hunter AJ, Hamilton TC. Motor dysfunction in a photothrombotic focal ischaemia model. Behav Brain Res. 1996;78:113–120. doi: 10.1016/0166-4328(95)00237-5. [DOI] [PubMed] [Google Scholar]
- Zhang S, Boyd J, Delaney K, Murphy TH. Rapid reversible changes in dendritic spine structure in vivo gated by the degree of ischemia. J Neurosci. 2005;25:5333–5338. doi: 10.1523/JNEUROSCI.1085-05.2005. [DOI] [PMC free article] [PubMed] [Google Scholar]
- Zhao BQ, Wang S, Kim HY, Storrie H, Rosen BR, Mooney DJ, Wang X, Lo EH. Role of matrix metalloproteinases in delayed cortical responses after stroke. Nat Med. 2006;12:441–445. doi: 10.1038/nm1387. [DOI] [PubMed] [Google Scholar]
- Zuo Y, Lin A, Chang P, Gan WB. Development of long-term dendritic spine stability in diverse regions of cerebral cortex. Neuron. 2005a;46:181–189. doi: 10.1016/j.neuron.2005.04.001. [DOI] [PubMed] [Google Scholar]
- Zuo Y, Yang G, Kwon E, Gan WB. Long-term sensory deprivation prevents dendritic spine loss in primary somatosensory cortex. Nature. 2005b;436:261–265. doi: 10.1038/nature03715. [DOI] [PubMed] [Google Scholar]