

Abstract
Early hallmarks of Alzheimer's disease include the loss of synapses, which precedes the loss of neurons and the pathological phosphorylation and aggregation of tau protein. Mitochondrial dysfunction has been suggested as a reason, but evidence on the role of tau was lacking. Here, we show that transfection of tau in mature hippocampal neurons leads to an improper distribution of tau into the somatodendritic compartment with concomitant degeneration of synapses, as seen by the disappearance of spines and of presynaptic and postsynaptic markers. This is accompanied by transport inhibition of vesicles and organelles, concomitant with an increase and bundling of microtubules. Mitochondria degenerate, thus causing ATP levels to decrease. The tau-induced synaptic decay can be relieved by the activation of the kinase MARK2 (microtubule-associated protein/microtubule affinity regulating kinase 2)/Par-1 (protease-activated receptor 1), which can remove tau from the microtubule tracks and reverses the transport block. This leads to the rescue of dendritic spines, synapses, mitochondrial transport and ATP levels.
Keywords: Alzheimer's disease, axonal traffic, microtubules, mitochondria, neurons, synapses, tau
Introduction
Early changes in Alzheimer's disease (AD) brains include missorting of tau and loss of synapses. This precedes the anomalous aggregation of proteins (amyloid plaques, neurofibrillary tangles) and is correlated with cognitive dysfunction (Terry et al., 1991; Coleman and Yao, 2003). The reasons for synaptic loss are not well understood. The amyloid hypothesis holds that toxic aggregates of the Aβ peptide lead to the dysfunction of synapses (Hardy and Selkoe 2002; Spires and Hyman, 2004). The role of tau in this context has not been clear. Normal tau is a highly soluble microtubule (MT)-associated protein in axons, but in Alzheimer's disease and other tauopathies it accumulates in the somatodendritic compartment where it eventually aggregates (Delacourte and Buee, 2000). Furthermore, the distribution of neurofibrillary tau deposits correlates closely with the neuronal loss and the clinical progression of AD (Braak and Braak, 1991).
Dendritic spines, the postsynaptic parts of synapses, extend from the surfaces of the dendritic processes of neurons. Their morphology varies from small mushroom shaped extensions to “neckless” (stubby) spines and filopodia-like spines which occur mostly during spine morphogenesis. The function of spines in neurons is to propagate signal inputs (Yuste and Bonhoeffer, 2004). Spines are devoid of microtubules but rich in actin (Hering and Sheng, 2001; Matus, 2000). Nevertheless, microtubules also play a role in postsynaptic function, notably as tracks for the transport of synaptic components and organelles. Thus, activity-dependent fusion of vesicles into the dendritic membrane is blocked by depolymerization of microtubules, and microtubule motors are responsible for dendritic transport of glutamate receptor subunits and other cargoes (Setou et al., 2000).
In transgenic mice, overexpression of tau leads to pathology, as seen by missorting of tau into dendrites, tau hyperphosphorylation, aggregation, and synaptic and neuronal loss (Duff and Sulemen, 2004; LaFerla and Oddo, 2005). Analogous findings have been reported for overexpression of tau in Drosophila (Wittmann et al., 2001; Chee et al., 2005). We showed previously that elevated tau leads to inhibition of anterograde traffic of vesicles and organelles in chick retinal ganglion cells. This is explained by an interference between tau and microtubule motors and can be relieved by kinases such as microtubule-associated protein (MAP)/microtubule affinity regulating kinase 2 (MARK2)/protease-activated receptor 1 (PAR-1), which phosphorylate tau in the microtubule-binding domain and cause its detachment from microtubules (Mandelkow et al., 2004). Because of the inhibitory effect of tau on traffic, we suspected that tau might also affect synapses. Here, we demonstrate a dramatic loss of synaptic markers and morphological changes caused by tau, illustrated by the disappearance of spines in mature hippocampal neurons. Postsynaptic markers such as the scaffolding protein PSD95, neuroligin, AMPA and NMDA receptor (NMDAR) subunits decrease in tau-transfected neurons, as well as presynaptic proteins such as bassoon and piccolo. This degeneration is accompanied by the dysfunction of mitochondria. The damage can be prevented by MARK2/PAR-1, which preserves dendritic spines and synapses.
Materials and Methods
Cloning.
Adenoviruses were generated as described previously (Stamer et al., 2002). Briefly, the SalI–XbaI fragment containing the cDNAs [blue fluorescent protein (CFP)-htau40, CFP-ht40/KXGA (Ser to Ala mutations in all four KXGS motifs in the repeat domain) mutant, and yellow fluorescent protein (YFP)-MARK2 wild-type] were subcloned into the restriction sites of the pShuttle vector under control of the human cytomegalovirus promotor. Plasmids were linearized with PmeI and cotransfected with the pAdEasy 1 vector into Escherichia coli BJ 5183 for homologous recombination. Plasmid DNA was amplified in E. coli DH10B and digested with PacI to cut out the entire recombinant adenoviral DNA, which was transfected into human embryonic kidney 293 (HEK293) cells using Lipofectamine (Invitrogen, Karlsruhe, Germany). Generation of viruses in HEK293 cells was monitored by fluorescence microscopy. Cells were harvested, resuspended in PBS, and lysed by three freeze–thaw cycles. Cell debris and nuclei were removed by centrifugation, and the virus suspension purified by two CsCl gradient centrifugations. CsCl was removed by gel filtration and equilibrated in storage buffer containing (in mm) 10 Tris/Cl, 135 NaCl, 3 KCl, 1 MgCl2, 10% glycerol, pH 8.0.
Cell culture.
Hippocampal neurons were isolated from embryonic day 18 (E18) Sprague Dawley rats, plated on poly-d-lysine (50 μg/ml)-coated cover glass for immunofluorescence (IF) or on coated plastic for protein biochemistry at a density of 20,000 cells/cm2. Cultures were treated after 4 d with 5 μg/ml cytosine arabinoside (Sigma, Munich, Germany) to reduce glial growth. Cells were maintained in NeuroBasal medium with B27 (Invitrogen) for 3–4 weeks. Cultures were then transfected with adenovirus and harvested or fixed up to 9 d after transfection. Cells were transfected with tau, MARK2/Par-1, or GFP (green fluorescent protein) using adenovirus. Ten microliters of virus suspension was added per 1.5 × 10⁵ cells and incubated for 1–10 d. Cells were fixed for immunofluorescence or harvested for SDS-PAGE. For adenoviral transfection of CFP-htau40 or YFP-MARK2, a 100-fold multiplicity of infection (3 × 10⁷ infectious particles) was applied to primary neurons. For double transfections, 3 × 10⁷ particles of each recombinant adenovirus were added. After 4 h incubation, the viral suspensions were removed.
Immunostaining and labeling.
Cells were fixed in methanol or 4% paraformaldehyde and incubated with the following antibodies: neuroligin mouse IgG (Synaptic Systems, Goettingen, Germany), 1:1000 for WB; PSD95 rabbit IgG (MA1-045) (Affinity BioReagents, Golden, CO), 1:500 for WB, 1:50 for IF; synaptophysin mouse IgG (Sigma), 1:10,000 for Western blot (WB), 1:2000 for IF; GluR1 rabbit IgG (Millipore, Schwalbach, Germany), 1:500 for WB, 1:1000 for IF; NMDAR1 mouse IgG (BD PharMingen, Heidelberg, Germany), 1:500 for WB, 1:200 for IF; Bassoon IgG mouse (gift from Drs. Altrock and E. Gundelfinger, Magdeburg, Germany), 1:2000 for WB; Piccolo polyclonal rabbit serum IgG (Synaptic Systems), 1:2000 for WB, 1:200 for IF; anti active-caspase-3 (CM1; BD PharMingen), 1:500 for IF; poly(ADP-ribose) polymerase (PARP) (Cell Signaling Technologies, Frankfurt am Main, Germany), 1:1000 for WB; drebrin mouse (Nventa, San Diego, CA), 1:300 for WB, 1:30 for IF; 12E8 (Elan, South San Francisco, CA), 1:1000 for WB, 1:5000 IF; and anti-human tau (K9JA; DAKO, Hamburg, Germany), 1:3000 for WB. All fluorescently (cyanine 5, tetramethylrhodamine isothiocyanate)-labeled secondary antibodies were from Dianova (Hamburg, Germany). For staining of active and inactive mitochondria, the medium was removed and replaced with medium containing MitoTracker Red 589 (Invitrogen) alone at a final concentration of 12 nm or together with MitoFluor Far Red 680 (Invitrogen) for active mitochondria at a final concentration of 50 nm. Cells were incubated for 2 h under growth conditions, then the MitoTracker solution was replaced with fresh prewarmed medium and mitochondria were observed.
Image analysis.
Hippocampal neurons were observed with a 63× objective on an LSM510 Meta confocal microscope (Zeiss, Jena, Germany) using lasers, beam splitters, and filters according to the fluorophores. For time-lapse imaging of spines and mitochondria, cells were plated on glass bottom dishes. Cells were kept at 37°C by air heating and supplied with 5% CO2. For the analysis of spine morphology and density, confocal stacks were taken and spines counted and measured. The lengths of analyzed dendrites varied between 30 and 80 μm. Measurements were taken for untransfected cells [number of mushroom spines (msp), 39; number of spiny spines (spsp), 0; total dendrite number (tdn), 4; number of independent experiments (ex), 2; total dendrite length (tdl), 130.8 μm], tau-transfected cells (msp, 8; spsp, 3; tdn, 18; ex, 4; tdl, 835.4 μm), tau plus MARK (msp, 45; spsp, 131; tdn, 8; ex, 6; tdl, 393.8 μm), tau 4 d plus MARK 2 d (msp, 129; spsp, 21; tdn, 14; ex, 4; tdl, 630.1 μm), MARK (msp, 19; spsp, 52; tdn, 4; ex, 2; tdl, 178.1 μm), and KXGA plus MARK (msp, 30; spsp, 21; tdn, 15; ex, 24; tdl, 752.8 μm).
Spine densities for each dendrite were measured and the average was plotted in Figure 2D. The error bars are SEs resulting from the spine densities per dendrite.
Figure 2.

MARK2 prevents spine loss and preserves spine density caused by Tau expression. A, Transfection by CFP-tau and YFP-MARK2 for 3 d prevents loss of spines (arrowheads). B, Transfection by YFP-MARK2 for 3 d causes elongation of spines and distribution of F-actin into the dendritic shaft and along spines (staining by YFP-MARK2, phalloidin, and merge). C, Transfection of CFP-Tau/KXGA (lacking phosphorylation sites by MARK2), doubly transfected with MARK2, cannot rescue spine morphology. D, E, Quantification of spine density and morphology. Image stacks were taken of each dendrite with the confocal microscope. The spine density changes significantly in tau-transfected and tau/KXGA transfected neurons. The number of mushroom-spines and spiny spines is significantly reduced. Neurons transfected with tau plus MARK2 for 4 d show an increase in density and length of spiny spines and therefore a 30% increase in total length, but only a minor increase in the length of mushroom spines and no significant difference in their density. Cells transfected for 2 d with tau and then for 2 more days with MARK2 also showed an increase in the number of spiny spines compared with control. Mushroom spine length and density was comparable with control. Spine density was strongly reduced in tau-transfected neurons, but higher in neurons transfected with tau plus MARK2 because of an increase in the number of spiny spines. In cells transfected first with tau and 2 d later with MARK2, the density of spines was similar to control, and the number of spiny spines was not elevated. Spiny spines increase with transfection of MARK2 alone and mushroom spines decrease. Scale bars: A–C, 10 μm. Error bars indicate SE.
Western blot analysis.
Neuronal cultures grown on plastic dishes were scraped into lysis buffer, concentrations were determined, and equal amounts subjected to SDS-PAGE. Quantification was done by densitometry using NIH Image, and normalized by the concentration of actin. Densities of untransfected cultures were set to 100%.
Cell treatment and ATP determination.
ATP depletion of cell cultures required inhibition of the glycolytic and oxidative energy metabolism, accomplished by washing cultures with glucose-free PBS with 0.5 mm CaCl2 and 1.0 mm MgCl2. Cultures were then kept in this buffer containing 1.0 μm or 0.1 μm antimycin (Sigma) for 2.5 h. Control cultures were kept in buffer without antimycin. For quantification of ATP, we used the sensitive ATP determination kit (Biaffin, Kassel, Germany) optimized for a total content of 0.1–100 pmol ATP (Sakakibara et al., 1999). Cells were plated at a density of 20,000 cells/cm2, cultured for 23–25 d, and transfected for 3 d with either tau alone or MARK2 plus tau. Cultures were kept in media until the ATP measurement or in glucose-free PBS supplemented with 0.5 mm CaCl2 and 1.0 mm MgCl2 for 2.5 h. Measurements were done in triplicate. Before harvesting, the cells were washed once with PBS. One-hundred microliters of lysis buffer was added, scraped into tubes, and immediately frozen in liquid nitrogen. They were then thawed at 37°C and spun down. The supernatant was transferred into a fresh tube. Ten microliters of lysate were diluted to 1000 μl with water. Thirty microliters of the lysate were mixed with 30 μl of reagent. After 10 s, the ATP content was determined using a luminometer (Eppendorf, Hamburg, Germany) at 562 nm and integrated over 20 s. All ATP measurements were normalized by the protein concentration. Values of untransfected cultures were set to 100%.
Electron microscopy.
Neurons were grown on glass-bottom dishes for 3–4 weeks and infected. Cultures were fixed in 2.5% glutaraldehyde for 1 h, washed with 0.15 m cacodylate, and imaged. Transfected cells were marked and postfixed for 1 h with 1% osmium tetroxide and 1% uranyl acetate, dehydrated with increasing concentrations of ethanol, and embedded using Epon 812 (Fluka, Neu-Ulm, Germany). After curing the resin, cells of interest were located by phase contrast microscopy, circled with a needle, mounted and sectioned either parallel or perpendicular to the long axis of the processes at a thickness of 50–80 nm, and viewed with a Phillips (Einhoven, The Netherlands) CM12 electron microscope.
Results
Missorting of tau and effects on synapses
In a normal differentiated neuron, tau is confined to axons whereas MAP2 occurs in the somatodendritic compartment (Binder et al., 1985). To assess the effect of tau on synapses, we transfected hippocampal neurons containing mature synapses [25 d in vitro (div)] with adenovirus encoding CFP-tagged htau40, the longest isoform in the human CNS. After 24 d of culturing of cells, Tau is only present in the axons and MAP2 only in the dendrites of hippocampal neurons (Fig. 1A). Within 1 d after transfection the CFP-tagged tau appears in the entire neuron, axons as well as somatodendritic compartment (Fig. 1B). This results in a dramatic change in the postsynaptic dendritic spines. Initially, the dendrites contain well defined mushroom spines filled with F-actin (as seen by phalloidin staining) (Fig. 1C). After 18 h of tau expression, tau is found along the whole dendrite including the mushroom spine heads (Fig. 1D). The tau in spines is mostly detached from microtubules because microtubules are absent from spines. After 30 h, the spines change to a filopodia-like appearance and decrease in density. Finally, after 2–4 d of tau expression, the dendrites are nearly devoid of spines and have a smooth shaft, in strong contrast to untransfected cells (Fig. 1E, bottom). F-Actin (stained by phalloidin) retracts into the dendritic shaft and cell body, and in addition F-actin shows an irregular accumulation in the cell body (Fig. 1F). After 5–6 d, the cell processes disintegrate and cells degenerate and die.
Figure 1.
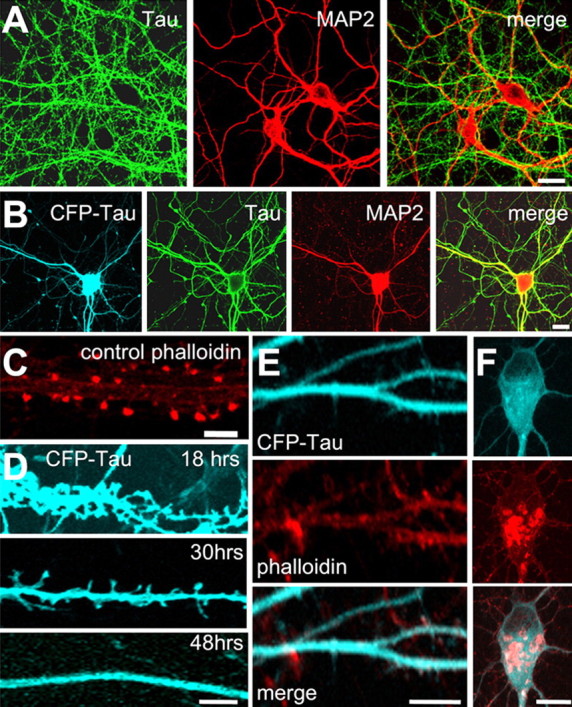
Tau distribution and changes in dendritic spine morphology after expression of tau. A, Untransfected hippocampal neurons. K9JA, an antibody for total Tau is localized only in axons, whereas MAP2 visualized by MAP2 clone HM2 antibody (Sigma) only localizes in dendrites. B, Expression of CFP-tau in hippocampal neurons leads to missorting into dendrites. CFP-tau appears in the soma and dendrites and colocalizes with MAP2 (HM2 antibody). C, Phalloidin fluorescence illustrates the concentration of F-actin in spine heads. D, After tau expression, CFP-tau appears along the dendrites and also in dendritic spines, followed by their disappearance (shown at 18, 30, and 48 h after transfection). E, F, Transfection by CFP-Tau for 3 d causes loss of spines and accumulation of F-actin in the dendritic shaft (E) and cell body (F) (staining by CFP-tau, phalloidin, and merge). Scale bars, 10 μm.
Tau-induced degeneration of spines can be rescued by MARK2
Because tau can inhibit axonal transport by interfering with the attachment of microtubule motors, and because phosphorylation of tau in the repeat domain by the protein kinase MARK2/Par-1 can detach tau from microtubules (Stamer et al., 2002; Mandelkow et al., 2004), we suspected that the tau-induced synaptic decay was related to a transport defect in dendrites and axons that could be rescued by MARK2. To test this we transfected neurons with tau and MARK2 by adenovirus in different intervals. In contrast to transfection with tau alone, neurons transfected simultaneously with CFP-tau and YFP-MARK2 and observed after 3–4 d maintain numerous mushroom-shaped spines and many spiny spines. The mushroom-shaped spines contain actin, tau, and MARK2 (Fig. 2A, arrow). As a control, in neurons transfected with MARK2/PAR-1 alone, the spines appear filopodia-like, typical for spine morphogenesis. Actin-phalloidin label is seen in the shaft as well as in the elongated spines and filopodia-like structures (Fig. 2B).
Spine density and length was assessed by counting mushroom-shaped spines and spiny spines per micrometer of dendrite (Fig. 2D,E). In control cells, essentially all observed spines are mushroom-shaped, whereas in tau-transfected neurons hardly any spines are seen with F-actin staining after 4 d of transfection, leaving mostly bare dendritic shafts. The density of spiny spines (lacking spine heads) increases dramatically for MARK2-transfected cells and for cells transfected with tau plus MARK2. Therefore, the total spine density (with or without spine heads) increases significantly for singly MARK2-transfected and doubly tau plus MARK2-transfected cells (Fig. 2D). When cells are incubated with CFP-tau adenovirus for 2 d before adding YFP-MARK2 adenovirus for an additional 2 d, MARK2 can surprisingly rescue spine morphology and density nearly to control levels. However, an expression of tau alone longer than 2 d cannot be rescued by MARK2. Typically, the protection of synapses and cell integrity by MARK2 against tau-induced damage is temporary and lasts for ∼4 d. After that, cell processes and eventually cells disintegrate and die. By comparison, untransfected cells survive up to 6 weeks. As a control, transfection of tau-KXGA mutant (which lacks the KXGS sites phosphorylatable by MARK2) into neurons also leads to a loss of spines, similar to wild-type tau, but in this case the loss cannot be rescued by MARK2 because the KXGA mutant of tau cannot be phosphorylated by MARK2 (Fig. 2C–E).
Phosphorylation of tau by MARK2
Normal differentiated neurons show tau only in the axon, and this tau has no detectable phosphorylation in the repeat domain by immunofluorescence (KXGS motifs, visualized by 12E8 antibody) (Fig. 3A). In contrast, cells transfected with CFP-tau show elevated tau (missorted into the somatodendritic compartment), and this tau already contains substantial phosphorylation at KXGS motifs (Fig. 3B). When MARK2 is cotransfected together with tau (Fig. 3C), phosphorylation of tau in the repeat domain increases strongly, concomitant with an increase in soluble cytoplasmic tau, which can diffuse into dendritic spines (Fig. 1C).
Figure 3.

Phosphorylation of tau in transfected neurons. Neuronal cultures at 25 div were transfected with tau for 2 d and then analyzed by immunofluorescence and Western blotting. A, Control cells (top) stained for total tau (antibody K9JA) and with antibody 12E8, which is sensitive to phosphorylated KXGS motifs in tau repeat domain. No antibody signal is detected for 12E8. B, After transfection with CFP-tau, cell bodies and all neurites show tau and react with 12E8 antibody. C, Double transfection with tau plus MARK2 reveal both proteins throughout the neurons and a strong 12E8 reaction. D, Western blots show reaction with the pan-tau antibody K9JA (transfected human htau40, top band; endogenous rat tau, bottom bands). E, Using the same membrane, the 12E8 reaction reveals phosphorylation at the KXGS motifs after transfection with tau, and especially with tau plus MARK2. Bottom bands are actin loading controls. Scale bar: (in C) A–C, 10 μm.
Quantification of untransfected cells shows the typical superposition of several endogenous rat tau isoforms (Fig. 3D, lane 1). Transfection with exogenous htau40 results in an additional band, distinguishable by its higher relative molecular weight because of the CFP label (lane 2). Its expression is approximately equal to endogenous tau (correcting for the fraction of transfected cells, ∼60%). Pronounced changes occur in the phosphorylation state (at the KXGS motifs) as judged by antibody 12E8 (Fig. 3E). Endogenous tau shows a low level of phosphorylation (lane 1), transfected human tau shows an enhanced level (lane 2), but with MARK2 (lane 3), the phosphorylation is dramatically enhanced for all tau species (sixfold, compared with expression of tau only). This illustrates that the rescue by MARK2 of the tau-induced synapse decay is strongly correlated with the higher level of tau phosphorylation in KXGS motifs and, thus, with tau's detachment from microtubules.
Loss of synaptic markers with tau and rescue with MARK2
Because the shape and density of synapses changes with tau expression, we investigated the influence on synaptic markers. As a control, Figure 4A illustrates the juxtaposition of synaptophysin (a presynaptic marker) with AMPA receptors (AMPAR, postsynaptic) and actin-phalloidin along dendrites. Likewise, there is a tight colocalization with postsynaptic markers PSD95 and AMPAR with F-actin. Actin and synaptophysin are prominent around the cell body (Fig. 4B). In contrast, when tau is expressed for 3 d, PSD95, actin-phalloidin, and AMPAR are strongly reduced (Fig. 4C). Synaptophysin-containing structures remain numerous along the dendrites. AMPAR and synaptophysin accumulations are seen in the cell body, indicating a transport defect in the cells (Fig. 4D). This confirms the general observation that most synaptic markers are strongly reduced after tau expression (Fig. 5A–D). The density of synapses along the dendrites (∼0.3–0.4 per micrometer in controls) (Fig. 4G) decreases sharply after tau expression; however, it stays at control values after coexpression of tau plus MARK2. Classification into shaft and spine synapses reveals that spine synapses disappear almost completely after tau expression, but are maintained in the presence of MARK2 (Fig. 4H). A remnant of a spine is seen in Figure 4I, but no PSD is detectable in this section or adjacent ones (open arrow), and the spine apparatus is dilated (filled arrow). Almost all observed synapses (98%) are shaft synapses which appear functional and have visible PSDs (Fig. 4J, open arrow). In doubly transfected cultures (tau plus MARK2) the relationship between shaft and spine synapses are comparable with control values. The tau-induced suppression of synaptic markers is in remarkable contrast to the rescue achieved by cotransfection with MARK2, illustrated here for the case of AMPAR, PSD95 (postsynaptic), and synaptophysin (presynaptic) (Fig. 4E).
Figure 4.
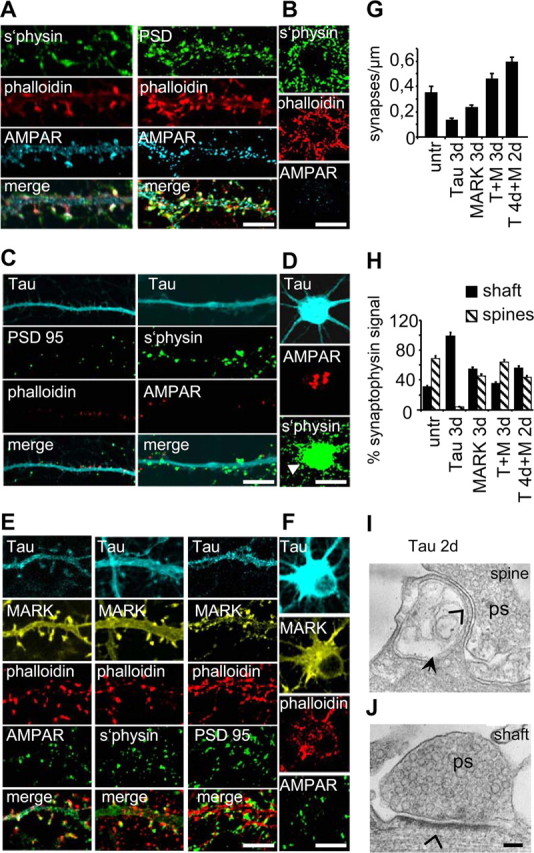
Immunofluorescence of presynaptic and postsynaptic proteins in transfected neurons. A Control cultures 25 div stained for AMPAR, PSD95, synaptophysin, and F-actin (phalloidin). B, No abnormal accumulation of markers seen in cell bodies of control cells. C, Tau-transfected neurons show strong reduction in AMPAR, PSD95, and synaptophysin after 3 d. D, A robust accumulation (arrowhead) of AMPAR and synaptophysin is seen in the cell bodies. E, F, In neurons transfected with tau plus MARK2, staining of all markers is similar to control in dendrites and cell bodies. G, Synapse densities determined from phalloidin (spine, postsynaptic) and synaptophysin positive puncta after 3 d of transfection. Tau transfected neurons show less synapses than doubly transfected neurons. H, Classification of synaptophysin-positive puncta reveal less shaft-synapses than spine-synapses in control cells. Tau transfected cells display only shaft synapses and tau plus MARK2 transfected cultures are similar to controls. I, Ultrathin section of a remnant of a spine 2 d after tau transfection. No PSD is detectable here nor in adjacent sections (open arrowhead) and the spine apparatus appears dilated (filled arrow). ps, Presynapse with vesicles. J, However, shaft synapses appear functional with visible PSD (open arrowhead). Scale bars: A–F, 10 μm; I, J, 150 nm. Error bars indicate SE.
Figure 5.

Presynaptic and postsynaptic proteins are reduced by tau expression but preserved by transfection of tau plus MARK2. A, Western blots showing that postsynaptic proteins neuroligin and PSD95 are reduced in tau-expressing cultures and that loss is prevented by double transfection of tau plus MARK2. The PSD95 antibody (MA1–045) detects a ∼95 kDa protein and a slightly larger species from rat brain extracts. Actin is shown as a control. B, C, Postsynaptic receptors NMDAR1, AMPAR, and the presynaptic proteins bassoon and piccolo are reduced in tau-expressing cultures during a time course of 2–3 d and rescued with double transfection of tau plus MARK2. Synaptophysin shows no overall change after tau transfection but accumulates in the cell body (Fig. 4D). D, Densitometric analysis of the Western blots for synaptic proteins (neuroligin, PSD95, drebrin, AMPAR, NMDAR1, piccolo, bassoon), all normalized to β-actin. The first bracket shows the reduction of protein levels after tau expression, compared with untransfected controls (n = number of culture preparations). The second set of parentheses shows the rescue in tau plus MARK2 transfected cultures: neuroligin (27 ± 3%; n = 10; *p < 0.001) (116 ± 23%; n = 7; *p < 0.05), PSD95 (17 ± 7%; n = 4; *p < 0.001) (88 ± 4%; n = 3; *p < 0.03), drebrin (30 ± 9%; n = 4; *p < 0.001) (115 ± 7%; n = 2; *p < 0.02), AMPAR (32 ± 8%; n = 5; *p < 0.001) (84 ± 8%; n = 5; *p < 0.005), NMDAR1 (26 ± 9%; n = 4; *p < 0.001) (77 ± 9%; n = 3; p > 0.05), piccolo (22 ± 13%; n = 2; *p < 0.001) (73 ± 18%; n = 2; p > 0.05), bassoon (26 ± 10%; n = 3; *p < 0.001) (77 ± 16%; n = 3; p > 0.05). E, F, Apoptotic markers are not significantly increased in tau-transfected neurons. E, Control cultures (25 div) stained for the markers annexin, active caspase, and DAPI. An increase of fragmented nuclei in tau-transfected neurons after 3 and 5 d of transfection is seen but no increase in annexin or active caspase. Doubly transfected neurons (tau plus MARK2) display no increase in these markers after 3 d, but a strong increase in staining after 5 d of transfection. F, PARP is downregulated in tau transfected neurons, but not degraded. In contrast, in doubly transfected neurons (tau plus MARK2), both the intact 116 kDa form and 85 kDa fragment of PARP are seen after 4 d of transfection. The control shows a cell extract of Jurkat cells induced to undergo Fas-mediated apoptosis by treatment with anti-human Fas mAb, clone DX2 (BD Biosciences, Franklin Lakes, NJ). Error bars indicate SE.
The picture emerging from the immunofluorescence data are confirmed by Western blot analysis of neuronal proteins (Fig. 5A–D). Neuroligin and PSD95 (cell adhesion and scaffolding molecules in postsynaptic densities) decrease after tau expression, whereas in doubly transfected cultures (tau plus MARK2) the levels are preserved (Fig. 5A). Postsynaptic AMPA and NMDA receptors are reduced in tau-transfected neurons, whereas cotransfection with tau and MARK2 keeps the levels of the receptor subunits stable (Fig. 5B).
To understand the effect of tau on presynapses, we studied proteins of the presynaptic active zone such as bassoon and piccolo, two proteins of the cytoskeletal matrix colocalizing at active zones (Dresbach et al., 2001). A clear decrease is seen in tau-transfected cultures after 2–4 d of transfection, but not in doubly transfected cultures (tau plus MARK2) (Fig. 5C,D). Thus, presynapses seem to be affected by tau and MARK2 directly at the active zone. In contrast, synaptophysin, a vesicle-bound presynaptic protein does not change with tau expression, but rather accumulates in the cell body.
Tau-induced synapse loss is not caused by apoptosis
There is a debate on how apoptosis or necrosis contribute to cell death in neurodegenerative diseases. Furthermore, neuronal cell processes can enter a preapoptotic state before their decay (Berliocchi et al., 2005; Mattson and Magnus, 2006). Because tau causes a loss of synapses, we hypothesized that this might be a prelude to apoptosis, and therefore searched for apoptotic markers (Fig. 5E,F). Tau-transfected hippocampal neurons show only a slight increase of DNA fragmentation [4,6-diamidino-2-phenylindole (DAPI) staining] starting 5 d after transfection. Staining for active caspase-3 and the early apoptotic marker annexin does not increase in tau-transfected neurons. An increase of the number of caspase-3- and annexin-positive cells is observed in doubly transfected neurons (tau plus MARK2) 5 d after transfection (Fig. 5E). The cleavage of the nuclear protein PARP by caspases is a further marker of apoptosis. In tau-transfected cells a downregulation of PARP is observed, but no cleavage up to 6 d (Fig. 5F). In tau plus MARK2-transfected cells a low level of PARP cleavage is seen starting at day 4. Thus, apoptotic effects do not explain the tau-induced decay of synapses shortly after transfection.
Movement of mitochondria is perturbed in tau-transfected neurons
Defects in mitochondrial metabolism have been proposed to underlie neurodegenerative diseases, and proper mitochondrial localization is a prerequisite for neuronal function because of the high demand for energy and calcium regulation at synapses (Beal, 2005; Li et al., 2004). In previous studies, we showed that elevated tau is capable of inhibiting the transport of mitochondria (Stamer et al., 2002). Because the dynamics of spines depends critically on the assembly and disassembly of the actin cytoskeleton, and because actin polymerization is a major cause for ATP consumption in cells (Sarmiere and Bamburg, 2004), we hypothesized that the loss of synapses might be related to dysfunctional mitochondria. We stained neurons with marker dyes reporting on total mitochondria and on their state of activity. Control neurons display the normal uniform distribution of active mitochondria in cell bodies and dendrites (Fig. 6A,B), but neurons transfected with tau are mostly devoid of mitochondria in the processes and cell bodies after 3 d (Fig. 6C,D). In contrast, tau plus MARK2 doubly transfected cells show again a normal distribution of active mitochondria (Fig. 6E).
Figure 6.

Expression of tau, but not of tau plus MARK2 reduces mitochondrial density and movement in neuronal dendrites and cell bodies. Confocal stacks with optical slices of 1 μm were taken and evaluated. A, Cell body of an untransfected neuron stained with MitoTracker 589 (top center: x–y plane; above, x–z plane; left, y–z plane). B, D, and E show only one optical slice of 1 μm. B, Mitochondria occur throughout the cell body and dendrites. C, After 3d days of tau transfection, the cell body is devoid of mitochondria. D, Dendrites of tau transfected cells display a loss of mitochondria 3 d after transfection. E, A neuron transfected with tau plus MARK2. MitoTracker 589 (all mitochondria) and MitoFluor Far Red 680 (active mitochondria) were added to the culture to visualize active and inactive mitochondria. Doubly transfected cells do not show a loss of mitochondria or membrane potential after 3 d of transfection. F, Kymographs showing that in untransfected cultures (top), mitochondria can perform saltatory movements in both directions (prox, proximal; dist, distal) (horizontal arrow, 10 μm; vertical arrow, 1 min). In neurons transfected with tau (middle), mitochondria show almost no movement (time point was chosen at 2 d after transfection to visualize mitochondria before they disappear). Doubly transfected neurons (bottom) display saltatory movements in both directions, comparable with control. G, Quantification of stationary mitochondria (immobile >10 min), and anterograde and retrograde movements of mitochondria in dendrites. Transfection of tau for 2 d increases the fraction of immobile mitochondria to ∼100%, but movement is partially rescued in doubly transfected cells. Conversely, the mobile fraction decreases strongly after tau-transfection in both directions (middle and left), but is rescued by tau plus MARK2 transfection. (Number of mitochondria in three different neurons each: control, nstatic = 18, nantero = 12, nretro = 9; Tau, nstatic = 25, nantero = 2, nretro = 2; MARK2 plus tau, nstatic = 22, nantero = 7, nretro = 9.) Scale bars: (in C, E) A–E, 10 μm. Error bars indicate SE.
The change in the distribution of mitochondria in dendrites corresponds to a change in mobility. Untransfected cultures display saltatory movements of mitochondria in both directions (Fig. 6F, top), which are supported mostly by microtubule-dependent motor proteins (Hollenbeck and Saxton, 2005; Hirokawa, 1998). In contrast, in tau-transfected cells, the movement of mitochondria is strongly inhibited. At 2 d after transfection, the mitochondria become mostly stationary (Fig. 6F, center) and subsequently disintegrate (Fig. 8K). However, in doubly transfected neurons (tau plus MARK2) the saltatory movement remains mostly intact (Fig. 6F, bottom). Quantification shows that in control cells, 45% of the mitochondria are stationary (within an observation window of 3 h); this fraction rises to 85% with tau transfection but becomes normal again (∼60%) with tau plus MARK2 (Fig. 6G).
Figure 8.
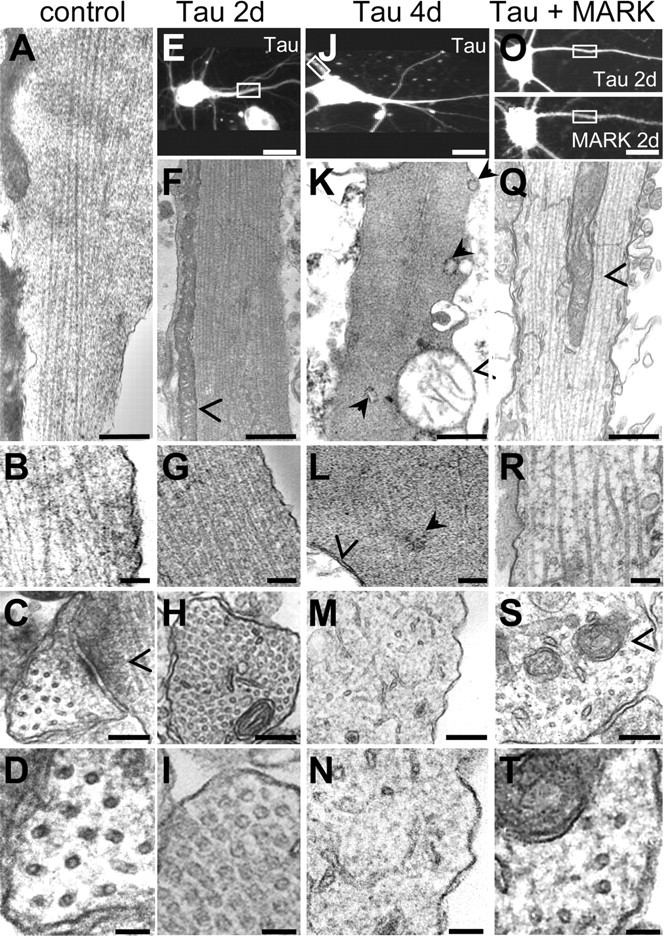
Thin sectioning electron microscopy of tau-transfected and tau plus MARK2 transfected dendrites. A–D, Electron micrographs of longitudinal and cross sections of control dendrites. A, B, Longitudinal sections of dendrites. Microtubule density is ∼120/μm2, corresponding to typical spacings of ∼90 nm center to center (leaving a space of ∼75 nm between microtubule walls). C, D, Cross sections; open arrowhead indicates shaft synapse. E–I, Transfection with tau for 2 d: microtubule density increases strongly to ∼400/μm2 (spacing center to center, ∼50 nm; separation of ∼25 nm between walls). Mitochondria are elongated and are pushed to the periphery (open arrowheads). J–N, Transfection with tau for 4 d: most microtubules have depolymerized, mitochondria have rounded up, lost their cristae, and are in the process of degeneration. K, Filled arrows point to dilated endoplasmic reticulum. L, Open arrowhead, Mitochondrial membrane; filled arrow, free ribosomes. O–T, Transfection of tau plus MARK2 for 2 d results in normal-looking dendrites with loosely spaced microtubules similar to control and healthy mitochondria in the center. Open arrowhead, Mitochondria. C–D, I–H, M–N, and S–T show corresponding cross-sections. E, J, O, P, Parent cells of longitudinally sectioned dendrites. Scale bars: A, F, K, Q, 500 nm; B, G, L, R, 200 nm; C, H, M, S, 100 nm; D, I, N, T, 50 nm; E, J, O, P, 10 μm.
Tau causes the loss of ATP in neurons
To ensure the functioning of cell processes, mitochondria must be able to move to the sites of high ATP consumption (Hollenbeck and Saxton, 2005). Because mitochondria become immobile after tau transfection, we suspected a deficit in ATP supply and therefore checked ATP levels of cells. In the case of untransfected cell cultures, if the medium is replaced by Ringer solution for 2.5 h to shut down ATP production through glycolysis, the ATP concentration drops to 50%, indicating that mitochondrial and glycolytic ATP synthesis each contribute about equally to ATP production (a typical observation for neuronal cultures) (Fig. 7A). When the cell culture is transfected with tau for 3 d, the total ATP level drops to ∼40%. The transfection rate is around 60%; therefore, the data can be explained by assuming that the ATP production of transfected cells drops to a low value, so that the observed ATP levels are mostly generated by the untransfected cell fraction. When glycolysis is blocked (in Ringer solution) the ATP level drops to ∼20% in tau-transfected cultures, again compatible with the assumption that the 40% untransfected cells generate ATP at half speed (by mitochondria only). As control, if cultures are treated with antimycin (an inhibitor of mitochondrial respiration) plus Ringer solution, ATP levels become negligible within 2.5 h. In contrast, in tau-transfected culture the reduction of ATP levels (to ∼40%) can be fully rescued by cotransfection with MARK2 (Fig. 7A). This argues that the traffic inhibition by tau has a direct effect on cellular ATP levels and can be prevented by keeping traffic paths open via phosphorylation of tau.
Figure 7.
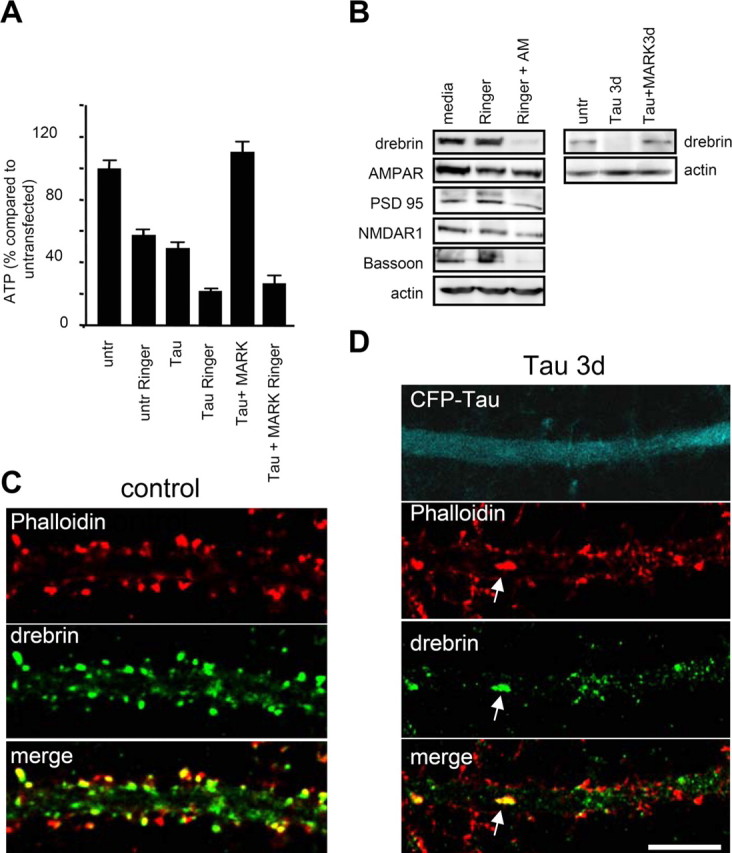
ATP decrease caused by tau transfection leads to a decrease in synaptic proteins. A, ATP levels in tau transfected and tau plus MARK2-transfected cultures. After 3 d of tau transfection, ATP decreases by one-half (50 ± 7%; n = 5; *p < 0.001), but remains high in tau plus MARK2 doubly transfected cultures (114 ± 7%; n = 3; *p < 0.05). To assess the amount of ATP synthesized by glycolysis, cultures were treated for 2.5 h with Ringer solution before ATP measurements. ATP levels of untreated cultures were reduced by one-half (57 ± 4%; n = 8; *p < 0.001), indicating that glycolysis and mitochondrial synthesis contribute about equally to the ATP production. Tau-transfected cultures in Ringer show an additional decrease by one-half. B, Energy deprivation with 1 μm antimycin (AM) and Ringer for 2.5 h cause a strong protein downregulation of drebrin, bassoon and a slight downregulation of NMDAR1, but not of PSD95 and AMPAR in Western blots. Tau expression also results in a reduction of drebrin after 3 d of transfection. Double transfection with tau and MARK2 prevents this loss. C, D, Immunostaining of drebrin in cultures transfected for 3 d (D) shows a strong reduction of drebrin staining compared with control (C). Drebrin staining disappears from the spines and often colocalizes with F-actin in the dendritic shaft (arrow). Scale bar, 10 μm. Error bars indicate SE.
Next, we compared the effects of tau transfection and ATP reduction on synaptic proteins. Figure 7B shows the example of drebrin, an F-actin binding protein which plays a role in spine morphogenesis. After tau transfection for 2–3 d, drebrin disappears from the spines and a small fraction clusters together with F-actin in the dendritic shaft (Fig. 7D). The displacement of drebrin and loss of spines can be prevented by cotransfection of tau plus MARK2 up to 3 d after expressing tau. Importantly, the changes in synaptic proteins are closely correlated with the level of ATP, illustrated in Figure 7B for the cases of drebrin, AMPAR, NMDAR, PSD95, and the presynaptic protein bassoon. Treatment of the cultures with Ringer solution for 2.5 h (to suppress glycolysis) has little effect on protein levels, but treatment with antimycin (to inhibit mitochondria) in addition to suppression of glycolysis leads to a marked reduction of drebrin and bassoon within 2.5 h (AMPAR, PSD95, and NMDAR have a slower response) (Fig. 7B, left). A comparable strong reduction of drebrin is achieved by expression of tau for 3 d, whereas expression of tau plus MARK2 leaves the protein near its control levels (Fig. 7B, right).
Microtubule bundling, traffic inhibition, mitochondrial and synaptic decay
To elucidate the nature of the synaptic decay, we performed ultrathin sections of the transfected cells for electron microscopy (Fig. 8). The boxed areas (Fig. 8E,J,O,P) show fluorescence images of the cells from which the sections were derived. Figure 8A–D corresponds to untransfected cells, E–I to tau-transfection for 2 d, J–N to tau-transfection for 4 d, and O–T to transfection with tau plus MARK2 for 2 d. The control cells (left) show the typical appearance of microtubules running along the length of the dendrite, separated by a wide distance (typically ∼100–150 nm center-to-center, or ∼75–125 nm wall-to-wall, sufficient for the passing of vesicles and organelles). Cross sections reveal an irregular lattice with a density of ∼100 MT/μm2, in good agreement with the literature (Bartlett and Banker, 1984; Baas et al., 1991; Chen, et al., 1992) (Fig. 8D, bottom). The mitochondria have the typical healthy appearance with well developed cristae and are positioned throughout the volume of the dendrites (data not shown). This picture changes dramatically when tau is expressed for ∼2 d (Fig. 8E–I). Microtubules begin to form bundles in the interior of the dendrites, gradually become more numerous, and eventually fill a large fraction of the dendritic volume in a densely packed manner (fourfold compaction, ∼400 MT/μm2, center-to-center spacing decreasing to ∼50–75 nm, leaving only a distance of ∼25–50 nm between walls). Mitochondria still have a healthy appearance but are pushed outside the microtubule bundles and to the walls of the dendrites, as if the bundles were too dense for entry (Fig. 8F). Even before the point of bundle formation, the movements of mitochondria are already strongly reduced, as judged by comparing live cell movement assays with ultrathin sectioning of the same areas. At later time points (4 d, where cell processes begin to degenerate), the microtubules have mostly disintegrated (Fig. 8J–N) and mitochondria are swollen and have lost their internal structure, typical of their decay. By remarkable contrast, transfection of tau plus MARK2 prevents the appearance of microtubule bundles, the dislocation of mitochondria to the edges, and the subsequent disintegration of mitochondria and microtubules (Fig. 8O–T).
How could tau trigger the dramatic fourfold increase in microtubules, which corresponds to a local tubulin concentration of >2 mm? To check this, we determined the tubulin concentration in the cell population. It increases approximately twofold after 2 d of tau transfection (data not shown). Because only ∼50% of the cells are transfected, the increase per transfected cell is approximately fourfold, in good agreement with the observed increase in local density of microtubules. The additional generation of tubulin is consistent with the observation that tubulin synthesis is autoregulated via the stability of its mRNA (Cleveland et al., 1983). Thus, stabilization of microtubules (by tau in this case) lowers the pool of unpolymerized tubulin, and this in turn enhances the rate of tubulin production.
Discussion
Loss of synapses represents an early change in AD (Terry et al., 1991; Coleman and Yao, 2003). This occurs in brain regions (entorhinal region, hippocampus) characterized also by anomalous changes in tau protein, and the progression of tau pathology closely parallels the clinical stages of the disease [Braak stages (Braak and Braak, 1991)]. The abnormal aggregation of tau in dystrophic neurites or neurofibrillary tangles is the most conspicuous change; this is preceded by more subtle changes, such as missorting of tau into the somatodendritic compartment, enhanced phosphorylation, and pathological conformation (Delacourte and Buee, 2000). The toxic effect of tau on neurons is frequently ascribed to its aggregated state, however, it is unclear how the early synaptic decay could be caused by aggregation, which occurs much later. One possibility is the exposure of neurons to toxic oligomeric forms of the Aβ peptide, another might be some preaggregated oligomeric form of tau that is not well defined at present. In contrast, nonaggregated tau has usually been considered beneficial because it stabilizes microtubules (Garcia and Cleveland, 2001). Our previous results have suggested, however, that seemingly normal tau can cause cellular damage because it can inhibit microtubule-based transport (Stamer et al., 2002). This would be particularly pertinent for the extended axons and dendrites of neurons, which depend on efficient transport (Stokin and Goldstein, 2006).
We therefore set out to test the link between tau and synaptic decay. As a model system, we chose primary hippocampal neurons cultured for 25 d when numerous synapses have developed. We report here that elevation of tau indeed leads to missorting into the somatodendritic compartment and decay of synapses, thus recapitulating two early events in AD brains. What are the molecular events linking tau expression and synaptic decay? To develop a working model we note the following features: (1) the tau-induced decay affects nearly all presynaptic and postsynaptic markers tested, including the F-actin cytoskeleton which retracts from the dendritic spines and accumulates in shafts and cell bodies. The effect is therefore systemic and not specific for some interaction between tau and a synaptic protein. (2) Even at low levels of expression, tau penetrates into the somatodendritic compartment, showing that the normal sorting mechanism breaks down. (3) Transport processes are slowed down by tau. Because tau is also missorted, the inhibition of traffic affects all cell extensions, axons, and dendrites. (4) The phosphorylation of tau at the KXGS motifs of the repeat domain, which regulates its microtubule affinity, increases with tau expression (recapitulating similar events in AD). It indicates an altered balance of a signaling cascade, which involves MARK2 or a related kinase and lowers tau-microtubule interactions. However, this phosphorylation does not suffice to prevent the tau-induced traffic blockade. (5) Elevation of tau in dendrites and axons leads to an approximately fourfold increase of microtubules concomitant with MT bundling, swelling, and degeneration of mitochondria. (6) Tau causes a drastic decrease in ATP levels, which suffices to explain the decay of the highly ATP-dependent synapses. This effect can be mimicked by poisoning mitochondria. (7) Surprisingly, the tau-induced damage can be temporarily prevented or rescued by MARK2/Par-1. Because one of the main known functions of MARK2 is to phosphorylate the repeat domain of tau and detach it from microtubules, the protective effect of MARK2 indicates that tau-induced damage is closely related to tau-microtubule binding.
These observations can be explained by the combination of tau's ability to inhibit intracellular transport and its missorting at elevated concentration. The mechanisms for tau's sorting into axons in normal neurons and its missorting in pathological conditions are poorly understood. Tau moves by slow axonal transport (Mercken et al., 1995). Several hypotheses for sorting have been tested (axonal sorting of tau mRNA, preferential degradation in dendrites, selective stabilization or destabilization of tau by phosphorylation) (Hirokawa et al., 1996; Aronov et al., 2001; Kosik and Krichevsky, 2002); however, for our purposes it suffices to note that the capacity of the cell for axonal sorting is limited and therefore ceases to function when tau becomes elevated. As a result, tau, invades axons as well as dendrites and their spines and can exert its effects both presynaptically and postsynaptically. The accumulation in spines is suggestive of binding to the F-actin, reminiscent of tau in growth cones (Biernat et al., 2002; Timm et al., 2003). The inhibition of vesicle and organelle transport takes place because tau covers the microtubule surface, impedes the binding of motor proteins, and biases retrograde over anterograde movements (Stamer et al., 2002; Mandelkow et al., 2004). Within axons and dendrites, this deficiency becomes severe because diffusion of cell components is restricted and cannot offset a lack of active transport. Part of this transport defect could also be attributed to the increased microtubule density and bundling caused by elevated tau and upregulation of tubulin synthesis (Fig. 8E–I). This problem becomes most noticeable for large objects such as mitochondria. They are normally synthesized in or near the neuronal cell body and travel for long distances to fulfill the needs of neurites for ATP, calcium buffering, etc. Aging dysfunctional mitochondria are destroyed and their remnants transported back to the cell body by autophagic particles (Overly and Hollenbeck, 1996; Terman and Brunk, 2005). Thus, the inhibition of transport disrupts the supply lines for energy. The lack of ATP is most noticeable where the consumption is highest, in the synapses in which the remodeling of the actin cytoskeleton consumes a large fraction of the cellular energy (Sarmiere and Bamburg, 2004). Thus, mushroom spines disappear, the F-actin translocates into the dendritic shaft and cell body and tends to aggregate (Fig. 1). Likewise, synaptic markers retract from the synapses. Overall, the chain of events leads from the elevation of tau to the decay of synapses: elevated tau → tau missorting → inhibition of microtubule-based transport → mitochondrial dysfunction, changes in MT and F-actin cytoskeleton → synaptic decay.
These tau-induced effects can be prevented by MARK2 because the kinase detaches tau from microtubules, thus relieving the transport inhibition. The antagonistic action of tau and MARK2 shows that the health of synapses depends on functioning transport, which can be perturbed by tau but is normally regulated by tau kinases such as MARK2. Conversely, when tau is rendered nonphosphorylatable (as in the tau-KXGA mutants), MARK can no longer rescue the tau-induced traffic defects (Fig. 2C).
Overall, it appears that the traffic inhibition by tau takes place in several stages. First, the upregulation of tau causes the breakdown of axonal sorting and allows tau to enter dendrites. Second, tau bound to microtubules obstructs motor proteins and, thus, causes a slowdown of traffic (Seitz et al., 2002). Thirdly, by mopping up unpolymerized tubulin and promoting microtubule assembly, tau enhances the synthesis of tubulin, resulting in an increase of microtubules and their bundling, which fills up the cell processes and causes additional traffic obstruction (Fig. 8F–I). All three modes of action can be prevented by enhancing the level of MARK2, which phosphorylates tau and thus neutralizes its influence on microtubules.
In the context of our results, the previous study of Shahani et al. (2006) is of particular interest. These authors prepared hippocampal slices from mice and transfected them by Sindbis virus with tau or pseudophosphorylated tau (several Ser/Thr residues replaced by Glu). Although transfection with tau was well tolerated by the neurons, pseudophosphorylated tau variants caused apoptotic degeneration without major changes in spine density or morphology. Thus, their results differ in several aspects from ours. The most likely explanation is the difference in experimental system, for example, pure neuronal cultures without glia in our case versus a neuronal hippocampal tissue with a mixture of cell types maintaining their connectivities (Shahani et al., 2006), high tau expression in our case versus low tau expression, or use of different vectors. The comparison illustrates that the cellular environment exerts a major influence on the challenge of tau expression. In particular, the problem of an energy deficit, which causes the nonapoptic degeneration in our cell cultures, could be compensated in the multicellular system of a slice culture.
As concluding remarks we note that mitochondria, apart from generating chemical energy, contribute to calcium homeostasis, mediate apoptosis, and are sources of reactive oxygen species. These factors could contribute to synaptic decay, in addition to the rundown of ATP. It is even conceivable that tau binds directly to mitochondria and inhibits their functions, in analogy with the effects of SOD1 (superoxide dismutase 1) on mitochondria in amyotrophic lateral sclerosis (Liu et al., 2004). We also note that mutations in the tau gene cause dementias (e.g., FTDP-17 frontotemporal dementia with parkinsonism linked to chromosome 17). A puzzling feature is that the mutations can cause disease simply by shifting the tau isoform balance toward more four-repeat (4R) isoforms, even without changing tau protein (Lee et al., 2001). This is difficult to explain by loss of microtubules, because 4R-tau stabilizes microtubules better than 3R-tau. However, the important point may be that 4R-tau inhibits transport more efficiently and could therefore contribute to premature synapse loss, long before other events such as hyperphosphorylation and aggregation become prominent.
Footnotes
This work was supported in part by the Deutsche Forschungsgemeinschaft. We thank S. Hübschmann for excellent technical assistance, Dr. J. Biernat [Max-Planck Gesellschaft (MPG), Hamburg, Germany] for adenovirus for transfections, Dr. E. Gundelfinger (Leibniz Institute for Neurobiology, Magdeburg, Germany) and Dr. P. Seubert (Elan, South San Francisco, CA) for antibodies, and Dr. E. Mandelkow (MPG) for discussions throughout this work.
References
- Aronov S, Aranda G, Behar L, Ginzburg I. Axonal tau mRNA localization coincides with tau protein in living neuronal cells and depends on axonal targeting signal. J Neurosci. 2001;21:6577–6587. doi: 10.1523/JNEUROSCI.21-17-06577.2001. [DOI] [PMC free article] [PubMed] [Google Scholar]
- Baas PW, Pienkowski TP, Kosik KS. Processes induced by tau expression in Sf9 cells have an axon-like microtubule organization. J Cell Biol. 1991;115:1333–1344. doi: 10.1083/jcb.115.5.1333. [DOI] [PMC free article] [PubMed] [Google Scholar]
- Bartlett WP, Banker GA. An electron microscopic study of the development of axons and dendrites by hippocampal neurons in culture. II. Synaptic relationships. J Neurosci. 1984;4:1954–1965. doi: 10.1523/JNEUROSCI.04-08-01954.1984. [DOI] [PMC free article] [PubMed] [Google Scholar]
- Beal MF. Mitochondria take center stage in aging and neurodegeneration. Ann Neurol. 2005;58:495–505. doi: 10.1002/ana.20624. [DOI] [PubMed] [Google Scholar]
- Berliocchi L, Fava E, Leist M, Horvat V, Dinsdale D, Read D, Nicotera P. Botulinum neurotoxin C initiates two different programs for neurite degeneration and neuronal apoptosis. J Cell Biol. 2005;168:607–618. doi: 10.1083/jcb.200406126. [DOI] [PMC free article] [PubMed] [Google Scholar]
- Biernat J, Wu YZ, Timm T, Zheng-Fischhofer Q, Mandelkow E, Meijer L, Mandelkow EM. Protein kinase MARK/par-1 is required for neurite outgrowth and establishment of neuronal polarity. Mol Biol Cell. 2002;13:4013–4028. doi: 10.1091/mbc.02-03-0046. [DOI] [PMC free article] [PubMed] [Google Scholar]
- Binder LI, Frankfurter A, Rebhun L. The distribution of tau in the mammalian central nervous system. J Cell Biol. 1985;101:1371–1378. doi: 10.1083/jcb.101.4.1371. [DOI] [PMC free article] [PubMed] [Google Scholar]
- Braak H, Braak E. Neuropathological staging of Alzheimer-related changes. Acta Neuropathol (Berl) 1991;82:239–259. doi: 10.1007/BF00308809. [DOI] [PubMed] [Google Scholar]
- Chee FC, Mudher A, Cuttle MF, Newman TA, Mackay D, Lovestone S, Shepherd D. Over-expression of tau results in defective synaptic transmission in Drosophila neuromuscular junctions. Neurobiol Dis. 2005;20:918–928. doi: 10.1016/j.nbd.2005.05.029. [DOI] [PubMed] [Google Scholar]
- Chen J, Kanai Y, Cowan NJ, Hirokawa N. Projection domains of MAP2 and tau determine spacings between microtubules in dendrites and axons. Nature. 1992;360:674–677. doi: 10.1038/360674a0. [DOI] [PubMed] [Google Scholar]
- Cleveland DW, Pittenger MF, Feramisco JR. Elevation of tubulin levels by microinjection suppresses new tubulin synthesis. Nature. 1983;305:738–740. doi: 10.1038/305738a0. [DOI] [PubMed] [Google Scholar]
- Coleman PD, Yao PJ. Synaptic slaughter in Alzheimer's disease. Neurobiol Aging. 2003;24:1023–1027. doi: 10.1016/j.neurobiolaging.2003.09.001. [DOI] [PubMed] [Google Scholar]
- Delacourte A, Buee L. Tau pathology: a marker of neurodegenerative disorders. Curr Opin Neurol. 2000;13:371–376. doi: 10.1097/00019052-200008000-00002. [DOI] [PubMed] [Google Scholar]
- Dresbach T, Hempelmann A, Spilker C, tom Dieck S, Altrock WD, Zuschratter W, Garner CC, Gundelfinger ED. Functional regions of the presynaptic cytomatrix protein bassoon: significance for synaptic targeting and cytomatrix anchoring. Mol Cell Neurosci. 2003;23:279–291. doi: 10.1016/s1044-7431(03)00015-0. [DOI] [PubMed] [Google Scholar]
- Duff K, Suleman F. Transgenic mouse models of Alzheimer's disease: how useful have they been for therapeutic development? Brief Funct Genomic Proteomic. 3:47–59. doi: 10.1093/bfgp/3.1.47. [DOI] [PubMed] [Google Scholar]
- Garcia ML, Cleveland DW. Going new places using an old MAP: tau, microtubules and human neurodegenerative disease. Curr Opin Cell Biol. 2001;13:41–48. doi: 10.1016/s0955-0674(00)00172-1. [DOI] [PubMed] [Google Scholar]
- Hardy J, Selkoe DJ. The amyloid hypothesis of Alzheimer's disease: progress and problems on the road to therapeutics. Science. 2002;297:353–356. doi: 10.1126/science.1072994. [DOI] [PubMed] [Google Scholar]
- Hering H, Sheng M. Dendritic spines: structure, dynamics and regulation. Nat Rev Neurosci. 2001;2:880–888. doi: 10.1038/35104061. [DOI] [PubMed] [Google Scholar]
- Hirokawa N. Kinesin and dynein superfamily proteins and the mechanism of organelle transport. Science. 1998;279:519–526. doi: 10.1126/science.279.5350.519. [DOI] [PubMed] [Google Scholar]
- Hirokawa N, Funakoshi T, Sato-Harada R, Kanai Y. Selective stabilization of tau in axons and microtubule-associated protein 2c in cell-bodies and dendrites contributes to polarized localization of cytoskeletal proteins in mature neurons. J Cell Biol. 1996;132:667–679. doi: 10.1083/jcb.132.4.667. [DOI] [PMC free article] [PubMed] [Google Scholar]
- Hollenbeck PJ, Saxton WM. The axonal transport of mitochondria. J Cell Sci. 2005;118:5411–5419. doi: 10.1242/jcs.02745. [DOI] [PMC free article] [PubMed] [Google Scholar]
- Kosik KS, Krichevsky AM. The message and the messenger: delivering RNA in neurons. Science STKE. 2002;2002:PE16. doi: 10.1126/stke.2002.126.pe16. [DOI] [PubMed] [Google Scholar]
- LaFerla FM, Oddo S. Alzheimer's disease: Aβ, tau and synaptic dysfunction. Trends Mol Med. 2005;11:170–176. doi: 10.1016/j.molmed.2005.02.009. [DOI] [PubMed] [Google Scholar]
- Lee VM, Goedert M, Trojanowski JQ. Neurodegenerative tauopathies. Annu Rev Neurosci. 2001;24:1121–1159. doi: 10.1146/annurev.neuro.24.1.1121. [DOI] [PubMed] [Google Scholar]
- Li Z, Okamoto K, Hayashi Y, Sheng M. The importance of dendritic mitochondria in the morphogenesis and plasticity of spines and synapses. Cell. 2004;119:873–887. doi: 10.1016/j.cell.2004.11.003. [DOI] [PubMed] [Google Scholar]
- Liu J, Lillo C, Jonsson PA, Vande Velde C, Ward CM, Miller TM, Subramaniam JR, Rothstein JD, Marklund S, Andersen PM, Brannstrom T, Gredal O, Wong PC, Williams DS, Cleveland DW. Toxicity of familial ALS-linked SOD1 mutants from selective recruitment to spinal mitochondria. Neuron. 2004;43:5–17. doi: 10.1016/j.neuron.2004.06.016. [DOI] [PubMed] [Google Scholar]
- Mandelkow E-M, Thies E, Trinczek B, Biernat J, Mandelkow E. MARK/PAR-1 kinase is a regulator of microtubule-dependent transport in axons. J Cell Biol. 2004;167:99–110. doi: 10.1083/jcb.200401085. [DOI] [PMC free article] [PubMed] [Google Scholar]
- Mattson MP, Magnus T. Ageing and neuronal vulnerability. Nat Rev Neurosci. 2006;7:278–294. doi: 10.1038/nrn1886. [DOI] [PMC free article] [PubMed] [Google Scholar]
- Matus A. Actin-based plasticity in dendritic spine. Science. 2000;290:754–758. doi: 10.1126/science.290.5492.754. [DOI] [PubMed] [Google Scholar]
- Mercken M, Fischer I, Kosik KS, Nixon RA. Three distinct axonal transport rates for tau, tubulin, and other microtubule-associated proteins: evidence for dynamic interactions of tau with microtubules in vivo. J Neurosci. 1995;15:8259–8267. doi: 10.1523/JNEUROSCI.15-12-08259.1995. [DOI] [PMC free article] [PubMed] [Google Scholar]
- Overly CC, Hollenbeck PJ. Dynamic organization of endocytic pathways in axons of cultured sympathetic neurons. J Neurosci. 1996;16:6056–6064. doi: 10.1523/JNEUROSCI.16-19-06056.1996. [DOI] [PMC free article] [PubMed] [Google Scholar]
- Sakakibara T, Murakami S, Eisaki N, Nakajima M, Imai K. An enzymatic cycling method using pyruvate orthophosphate dikinase and firefly luciferase for the simultaneous determination of ATP and AMP. Anal Biochem. 1999;268:94–101. doi: 10.1006/abio.1998.3028. [DOI] [PubMed] [Google Scholar]
- Sarmiere PD, Bamburg JR. Regulation of the neuronal actin cytoskeleton by ADF/cofilin. J Neurobiol. 2004;58:103–117. doi: 10.1002/neu.10267. [DOI] [PubMed] [Google Scholar]
- Seitz A, Kojima H, Oiwa K, Mandelkow E-M, Song YH, Mandelkow E. Single-molecule investigation of the interference between kinesin and tau on microtubules. EMBO J. 2002;21:4896–4905. doi: 10.1093/emboj/cdf503. [DOI] [PMC free article] [PubMed] [Google Scholar]
- Setou M, Nakagawa T, Seog DH, Hirokawa N. Kinesin superfamily motor protein KIF17 and mLin-10 in NMDA receptor-containing vesicle transport. Science. 2000;288:1796–1802. doi: 10.1126/science.288.5472.1796. [DOI] [PubMed] [Google Scholar]
- Shahani N, Subramaniam S, Wolf T, Tackenberg C, Brandt R. Tau aggregation and progressive neuronal degeneration in the absence of changes in spine density and morphology after targeted expression of Alzheimer's disease-relevant tau constructs in organotypic hippocampal slices. J Neurosci. 2006;26:6103–6114. doi: 10.1523/JNEUROSCI.4245-05.2006. [DOI] [PMC free article] [PubMed] [Google Scholar]
- Spires TL, Hyman BT. Neuronal structure is altered by amyloid plaques. Rev Neurosci. 2004;15:267–278. doi: 10.1515/revneuro.2004.15.4.267. [DOI] [PubMed] [Google Scholar]
- Stamer K, Vogel R, Thies E, Mandelkow E, Mandelkow EM. Tau blocks traffic of organelles, neurofilaments, and APP vesicles in neurons and enhances oxidative stress. J Cell Biol. 2002;156:1051–1063. doi: 10.1083/jcb.200108057. [DOI] [PMC free article] [PubMed] [Google Scholar]
- Stokin GB, Goldstein LS. Axonal transport and Alzheimer's disease. Annu Rev Biochem. 2006;75:607–627. doi: 10.1146/annurev.biochem.75.103004.142637. [DOI] [PubMed] [Google Scholar]
- Terman A, Brunk UT. Autophagy in cardiac myocyte homeostasis, aging, and pathology. Cardiovasc Res. 2005;68:355–365. doi: 10.1016/j.cardiores.2005.08.014. [DOI] [PubMed] [Google Scholar]
- Terry RD, Masliah E, Salmon DP, Butters N, DeTeresa R, Hill R, Hansen LA, Katzman R. Physical basis of cognitive alterations in Alzheimer's disease: synapse loss is the major correlate of cognitive impairment. Ann Neurol. 1991;30:572–580. doi: 10.1002/ana.410300410. [DOI] [PubMed] [Google Scholar]
- Timm T, Li X, Biernat J, Jiao J, Mandelkow E, Vandekerckhove J, Mandelkow E-M. MARKK, a Ste-20-like kinase, activates the polarity-inducing kinase MARK/PAR-1. EMBO J. 2003;22:5090–5101. doi: 10.1093/emboj/cdg447. [DOI] [PMC free article] [PubMed] [Google Scholar]
- Wittmann CW, Wszolek MF, Shulman JM, Salvaterra PM, Lewis J, Hutton M, Feany MB. Tauopathy in Drosophila: neurodegeneration without neurofibrillary tangles. Science. 2001;293:711–714. doi: 10.1126/science.1062382. [DOI] [PubMed] [Google Scholar]
- Yuste R, Bonhoeffer T. Genesis of dendritic spines: insights from ultrastructural and imaging studies. Nat Rev Neurosci. 2004;5:24–34. doi: 10.1038/nrn1300. [DOI] [PubMed] [Google Scholar]