

Abstract
The cAMP-dependent protein kinase A (PKA) plays a ubiquitous role in the regulation of neuronal activity, but the dynamics of its activation have been difficult to investigate. We used the genetically encoded fluorescent probe AKAR2 to record PKA activation in the cytosol and the nucleus of neurons in mouse brain slice preparations, whereas the potassium current underlying the slow afterhyperpolarization potential (sAHP) in thalamic intralaminar neurons was used to monitor PKA activation at the membrane. Adenylyl cyclase was stimulated either directly using forskolin or via activation of 5-HT7 receptors. Both stimulations produced a maximal effect on sAHP, whereas in the cytosol, the amplitude of the 5-HT7 receptor-mediated response was half of that after direct adenylyl cyclase stimulation with forskolin. 5-HT7-mediated PKA responses were obtained in 30 s at the membrane, in 2.5 min in the cytosol, and in 13 min in the nucleus. Our results show in morphologically intact mammalian neurons the potential physiological relevance of PKA signal integration at the subcellular level: neuromodulators produce fast and powerful effects on membrane excitability, consistent with a highly efficient functional coupling between adenylyl cyclases, PKA, and target channels. Phosphorylation in the cytosol is slower and of graded amplitude, showing a differential integration of the PKA signal between the membrane and the cytosol. The nucleus integrates these cytosolic signals over periods of tens of minutes, consistent with passive diffusion of the free catalytic subunit of PKA into the nucleus, eventually resulting in a graded modulation of gene expression.
Keywords: neuromodulation, serotonin, PKA, cyclic AMP, genetically encoded fluorescent probe, FRET
Introduction
The importance of cAMP-dependent protein kinase A (PKA) has long been known in neurobiology, and the subcellular location of the kinase activity has important physiological significance: for example, PKA at the membrane will phosphorylate membrane channels and thus affect neuronal excitability, whereas in the cytosol, it will affect proteins of the cytoskeleton and metabolic enzymes. The translocation of the catalytic subunit of PKA into the nucleus results in the phosphorylation of nuclear factors, such as CREB (cAMP response element-binding protein), which regulate gene expression. A functional compartmentation of the cAMP/PKA signal has been demonstrated in cardiomyocytes (Steinberg and Brunton, 2001), and biochemical and functional data indicate that neurons also possess spatially restricted “signaling microdomains” (Carnegie and Scott, 2003). However, to date, the dynamics of PKA activity in different subcellular compartments and the effects of different extracellular signals on signaling pathway spatial and temporal dynamics have not been studied in live vertebrate neurons in a preparation preserving the anatomical organization of the tissue.
Several recently developed genetically encoded fluorescent probes use a tandem of green fluorescent protein-derived fluorophores, cyan fluorescent protein (CFP) and yellow fluorescent protein (YFP), sandwiching a domain with which conformational change is monitored by a modulation of fluorescence resonance energy transfer (FRET) efficacy (Zhang et al., 2002; Miyawaki, 2003; Sato and Umezawa, 2004). Among these, AKAR2 uses a phosphothreonine binding domain derived from yeast [forkhead associated domain 1 (FHA1)] and an optimized PKA substrate domain (Zhang et al., 2005). When phosphorylated by PKA, the substrate domain folds into the binding pocket of FHA domain, increasing FRET between CFP and YFP. This reporter is a substrate for the endogenous PKA and therefore reports intracellular activities of PKA. This probe allowed us to monitor in real time PKA activation in neurons in brain slice preparations, either in the cytosol or in the nuclear compartment.
One well established PKA effect on neuronal excitability is the modulation of the slow afterhyperpolarization potential (sAHP). The sAHP is mediated by a calcium-dependent potassium current activated after a train of action potentials: it hyperpolarizes the neuron for ∼5 s, preventing tonic firing (Lancaster and Adams, 1986; Nicoll, 1988; Sah, 1996). The sAHP is suppressed in response to several neuromodulators, resulting in a suppression of rythmic bursting ability, a process primarily controlled by PKA phosphorylation (Pedarzani and Storm, 1993) and counterbalanced by phosphatases (Pedarzani et al., 1998; Vogalis et al., 2006). A large sAHP is present in intralaminar thalamic neurons where it is under the strong negative control of serotonin 5-HT7 receptors coupled to the cAMP/PKA signaling cascade (Goaillard and Vincent, 2002) and thus provides a direct signal for monitoring PKA activity at the membrane.
By combining electrophysiology with imaging, we monitored PKA activity at the membrane, in the cytosol, and in the nucleus of neurons in brain slices. We observed that each of these compartments integrates the PKA signal with a specific efficacy and time course.
Materials and Methods
Subcloning and virus production.
We used the Sindbis virus as a vector (Bredenbeek et al., 1993; Ehrengruber et al., 1999; Shi et al., 1999). The coding sequences of AKAR2, AKAR2 Thr391 to Ala mutant (AKAR2mut), and AKAR2-NLS were subcloned into the viral vector pSinRep5 (Invitrogen, San Diego, CA). These constructs and the helper plasmid pDH26S (Invitrogen) were transcripted in vitro using the Megascript SP6 kit (Ambion, Austin, TX). Baby hamster kidney cells were electroporated with one specific RNA and the helper RNA (2.107 cells, 950 μF, 230 V) and grown for 24 h at 37°C in 5%CO2 in DMEM supplemented with 5% fetal calf serum before collecting cell supernatant containing the viruses (titer: 106–108 ml, i.p.).
Brain slices and infection.
We used 12- to 16-d-old C57BL/6 mice (Janvier, Le Genest Saint Isle, France). Coronal brain slices (220 μm thickness) were prepared in ice-cold solution (Meuth et al., 2002) containing 210 mm sucrose, 20 mm PIPES, 2.4 mm KCl, 10 mm MgCl2, 0.5 mm CaCl2, 10 mm glucose, and 45 μm indomethacin (Pakhotin et al., 1997), pH 7.3, using an HM650V Vibratome (Microm, Walldorf, Germany). Slices were kept at 32°C for 1 h in (in mm) 125 NaCl, 0.4 CaCl2, 1 MgCl2, 1.25 NaH2PO4, 26 NaHCO3, and 25 glucose, in 5%CO2/95%O2, and transferred for 1 h to a similar solution at room temperature in which the calcium was raised to 2 mm (standard extracellular solution). Brain slices were placed onto a millicell-CM membrane (Millipore, Bedford, MA) with a culture medium (50% minimum essential medium, 50% HBSS, 6.5 g/L glucose, and 100 U/ml penicillin/100 μg/ml streptomycin; Invitrogen). Infection was performed by adding ∼5.105 particles per slice. Slices were incubated overnight at 32°C in 5% CO2. During recordings, brain slices were perfused continuously at 2 ml/min with standard extracellular solution at 32°C. Slices were discarded after every agonist application.
Optical recordings on brain slices.
Images were obtained with an Olympus (Tokyo, Japan) BX50WI upright microscope with a 60× 0.9 numerical aperture water-immersion objective and a Micromax digital camera (Roper Scientific, Trenton, NJ). Illumination was a 100 W halogen light; exposure times were 0.5–2 s. In these conditions, the absolute intensity of the fluorophore remained stable throughout the experiment. We observed no change in ratio values when changing the acquisition rate, another indication that bleaching was not an issue. Images were acquired and analyzed using IPLab software (Scanalytics, Rockville, MD) with custom scripts. For each pixel, the ratio was calculated as the emission at 535 nm divided by the emission at 480 nm (F535/F480). The pseudocolor images were calculated to simultaneously display the F535/F480 ratio information, coded in hue, and the preparation fluorescence (averaged F480 and F535) was represented by the intensity. The calibration square on the image indicates the intensity on the horizontal axis and the ratio on the vertical axis. Excitation and dichroic filters were D436/20 and 505dclp for CFP (FRET) and HQ500/20 and Q515lp for YFP. Signals were acquired by alternating the emission filters (480/40 and HQ535/30) or using an emission splitter (Optosplit II; Cairn Research, Faversham, UK). All filters are from Chroma Technology (Brattleboro, VT). For uncaging experiments, brain slices were loaded overnight with 500 μm DMNB (4,5-dimethoxy-2-nitrobenzyl)–cAMP (Invitrogen) in the culture dish. Uncaging was performed with a 100 W Hg arc lamp with a 3–5 s exposure duration; the excitation filter and dichroic mirror were D365 and 380DCLP, respectively.
Patch-clamp recording.
The patch pipette solution contained (in mm) 130 potassium methane sulfonate, 10 HEPES, 1 EGTA, 5 MgCl2, 0.1 CaCl2, 4 ATP-Na, and 5 creatine phosphate, pH 7.35, with a liquid junction potential of +7 mV. RP-cAMPS (500 μm; Biolog, Bremen, Germany) was added to this solution when indicated. Pipettes had a resistance of 2–3 MΩ. Voltage-clamp recordings were obtained using an Axopatch 200B (Molecular Devices, Union City, CA) and Axograph software (Molecular Devices). I sAHP was activated by a train of 20–40 steps of 3 ms duration at a frequency of 80 Hz from a holding potential of −60 to +20 mV.
Drug application.
For all experiments performed on intralaminar thalamic neurons, drugs in standard extracellular solution were applied focally onto the field using a glass pipette (80–120 μm tip diameter) placed 400 μm away and 200 μm above the brain slice. A quartz capillary was used to deliver to the tip of the pipette a constant flow of the solution containing the agonist. In the control condition, the pipette is under continuous depression, preventing any leakage of the agonist. The agonist is ejected when this depression is suppressed, by closing an electrovalve. Time 0 is the electronic signal triggering the closure of this valve. The agonist could thus be applied rapidly to the neurons in fresh standard extracellular solution saturated with 5%CO2/95%O2. This system was tested by applying 10 mm tetraethylammonium (TEA) or 10 μm kainate: the 90% rise time was nonsignificantly different for both substances (9.2 ± 1 s, n = 4, and 6.0 ± 1.2 s, n = 5, respectively) and consistent with the free diffusion of small molecules in a brain slice (Nicholson, 2005). Drugs were from Sigma-Aldrich (St. Louis, MO) unless stated otherwise.
Differences were reported when p < 0.05 using the t test. Statistics given in the text are mean ± SEM unless stated otherwise.
Results
PKA responses in the somatosensory cortex
Fifteen hours after Sindbis virus infection, AKAR2 was present throughout the cytosol of cells (Fig. 1 A). NeuN (neuron-specific nuclear protein) immunolabeling showed that 93% of the AKAR2-expressing cells in our preparations were neurons (data not shown). We recorded cells in layer V displaying the typical pyramidal morphology. We first verified that AKAR2 was able to report the activation of PKA in somatosensory cortical brain slices after a direct stimulation of adenylyl cyclases. Forskolin (13 μm) produced a strong increase in the F535/480 emission ratio across the entire field (Fig. 1 A), consistent with a FRET increase. The addition of the phosphodiesterase inhibitor isobutyl-methyl-xanthine (IBMX; 200 μm) at the plateau of the forskolin response produced no additional increase (n = 7, three slices; data not shown). 1,9-Dideoxyforskolin (13 μm), a forskolin analog that does not activate adenylyl cyclases, produced no ratio change (n = 15 from two brain slices; data not shown).
Figure 1.
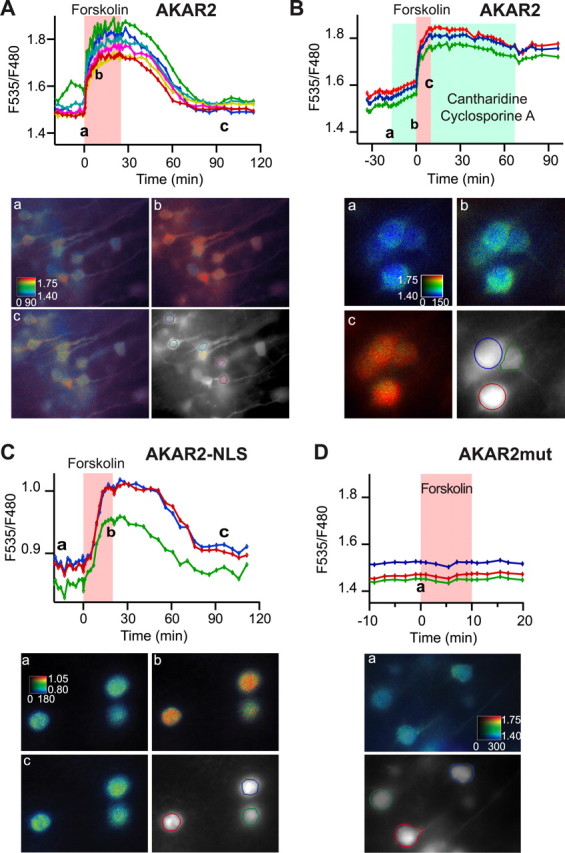
A–D, Somatosensory cortical brain slices expressing AKAR2 (A, C), AKAR2-NLS (B), and AKAR2mut (D) and their responses to forskolin application. Each trace indicates the F535/F480 emission ratio measured on one individual neuron. The ratio was averaged over the regions indicated by the colored contour drawn in the grayscale image. Pseudocolor images show for each pixel the F535/F480 ratio coded in hue and the F535 intensity coded in intensity. Images correspond to the data point indicated by the letters on the graph. Grayscale images show the F535 fluorescence. Forskolin (13 μm) was applied in the bath for the duration indicated by the red shade on the graph. Cantharidin (50 μm) and cyclosporin A (5 μm) were added to the bath solution for the duration indicated by the green shade in C. The calibration square represents horizontally the intensity in counts per pixel per second and represents vertically the F535/F480 emission ratio. The calibration square is 20 μm (A, D) or 10 μm (B, C) wide.
The ratio returned to baseline values after washout of forskolin and decreased from the end of forskolin application to 10% of the response in 48 ± 8 min (mean ± SD; n = 16 cells from five slices) (Fig. 1 A). We tested whether this recovery depended on dephosphorylation of AKAR2 by endogenous phosphatases. Bath application of 50 μm cantharidin and 5 μm cyclosporin A (inhibitors of phosphatases 2A and 2B, respectively) produced a linear increase in the baseline ratio (Fig. 1 B), indicating that at rest, AKAR2 is in equilibrium between phosphorylation and dephosphorylation. After forskolin washout, no recovery was obtained (n = 21, four slices). This indicates that the ratio recovery observed in Figure 1 A indeed resulted from dephosphorylation of the probe by PP2A and/or PP2B.
Because PKA exerts powerful effects on transcription factors, we monitored ratio changes specifically in the nucleus by targeting the probe to the nuclear compartment using a nuclear localization signal (NLS) (Zhang et al., 2005). With this probe, no fluorescence was present outside the nucleus. Forskolin increased the AKAR2-NLS ratio (Fig. 1 C) (n = 12, four slices), with an apparently slower onset than with AKAR2 (see Nucleus). The ratio returned to baseline with a 100% to 10% of 80 ± 10 min (mean ± SD; n = 11 cells from three slices) (Fig. 1 C). The baseline ratio of AKAR2-NLS was smaller than with AKAR2 (Fig. 1 A,C), an effect probably related to the different molecular environment in the nucleus.
The control probe called AKAR2mut was constructed by replacing threonine 391 with an alanine residue in the consensus phosphorylation site of AKAR2. Neurons expressing AKAR2mut displayed no change in emission intensities in response to forskolin (Fig. 1 D) (n = 29, six slices), confirming that the ratio change is indeed dependent on the phosphorylation of the probe. The small cell-to-cell variations in baseline ratios observed with the mutant probe are not indicative of PKA activity, and all further quantification will be performed on ratio variations measured as R/R0.
Similar responses to forskolin were obtained in other brain regions such as the striatum, the ventrobasal thalamus, and the reticular thalamic nucleus (data not shown), indicating that our method is applicable to various other brain regions.
Dynamics of PKA responses at the membrane in intralaminar thalamic neurons
We then wanted to monitor PKA activation at the membrane compartment where it modulates various membrane channels. One such PKA target is the sAHP, a potassium current involved in the repolarization after a spike train and which is suppressed after PKA activation. Neurons in intralaminar thalamic nuclei have a large PKA-sensitive sAHP that is suppressed after activation of the Gs-coupled 5-HT7 receptor (Goaillard and Vincent, 2002). In this preparation, we studied the coupling efficiency of the 5-HT7 receptor with the target potassium current and compared it with the effect of direct stimulation of adenylyl cyclases. The 5-HT7 receptors were activated by 5-carboxamidotryptamine (5-CT) at a 100 nm concentration, and the adenylyl cyclase was activated by forskolin at a 13 μm concentration. On neurons expressing AKAR2, both drugs decreased I sAHP by 83 ± 5% (n = 7) (Fig. 2 A,D) and 78 ± 4% (n = 9) (Fig. 2 B,D) respectively, values not statistically different and similar to previously published experiments (Goaillard and Vincent, 2002).
Figure 2.
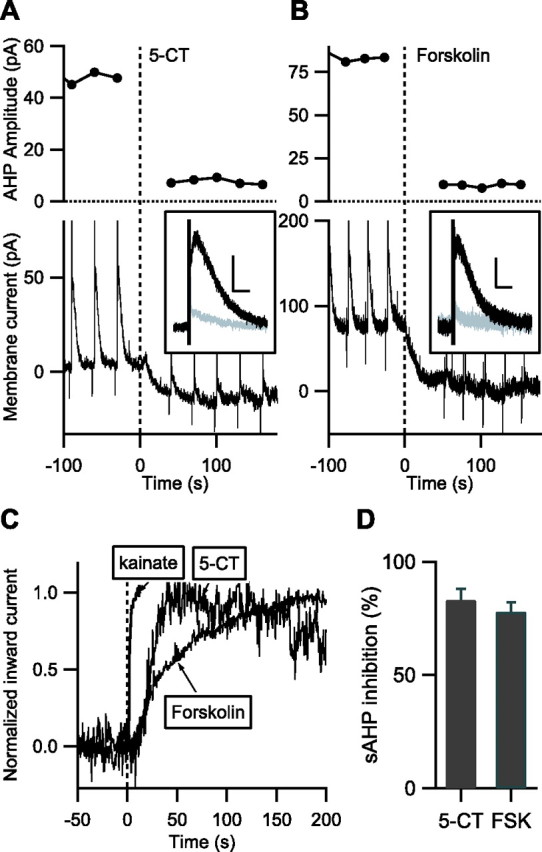
A, B, In intralaminar thalamic nuclei, the I sAHP and the tonic outward current are suppressed after fast focal application of 100 nm 5-CT (A) or 13 μm forskolin (B). Time 0 indicates the beginning of drug ejection. A, The top graph shows the amplitude of I sAHP. The bottom trace shows the whole-cell current with three sAHP protocols before and five sAHP protocols after bath application of 5-CT. The inset shows the averaged and baseline-subtracted currents from the trace presented above, before (black; 5 trials) and after (gray; 5 trials) 5-CT application. Calibration: 20 pA, 3 s. B, Same as A with 13 μm forskolin as the agonist. Calibration: 30 pA, 3 s. C, Average whole-cell current during fast application of 10 μm kainate, 100 nm 5-CT, and 13 μm forskolin. Traces are presented inverted for legibility. The response to kainate is an indicator of the time course of drug diffusion in the brain slice. D, Average effect of 5-CT and forskolin (FSK) on I sAHP amplitude.
The effect of 5-CT developed very rapidly, and the reduction in I sAHP amplitude was complete within 1 min. However, the sAHP protocol could not be recorded with <20 s intervals, and to increase the temporal resolution, we monitored the potassium current underlying the sAHP, which is partially active at resting potential. This tonic outward potassium current is also strongly sensitive to PKA (Lancaster and Batchelor, 2000; Goaillard and Vincent, 2002; Lancaster et al., 2006) and suppressed in parallel with I sAHP in response to either 5-CT or forskolin (Fig. 2 A,B, bottom traces). The tonic current recorded from neurons that did not express AKAR2 was thus used to report the kinetics of PKA activation at the membrane after fast focal application of 5-CT or forskolin. Only superficial neurons in the brain slice were recorded to minimize the diffusion time of the agonist through the tissue. The average current response (Fig. 2 C) had a 90% rise time of 32 s for 5-CT (n = 6) and 135 s for forskolin (n = 8). This time course was slower than the current responses to TEA or kainate applied by the same device (Fig. 2 C), which had 90% rise times of <10 s (see Materials and Methods) (Fig. 2 C). Because 5-CT was applied at 100 nm, well above the maximally active concentration (Goaillard and Vincent, 2002), the 5-HT7 receptors are probably activated earlier than the 10 s delay needed for reaching 90% of the final agonist concentration. Because forskolin may have nonspecific blocker effects on potassium channels, 1,9-dideoxyforskolin (13 μm) was tested as a control and produced no effect on neither the holding current nor the I sAHP (n = 4).
Cytosol
AKAR2 was then used to monitor PKA activation in the cytosol of intralaminar thalamic neurons. 5-CT and forskolin both increased the AKAR2 ratio (Fig. 3 A,B), but the responses to 5-CT were of significantly smaller amplitude than to forskolin (5.4 ± 0.9% ratio change, n = 30, eight slices, vs 13.1 ± 0.7%, n = 27, eight slices) (Fig. 3 D). Activation of 5-HT7 membrane receptors thus led to a partial effect in the cytosol, whereas it was maximal on target membrane currents. AKAR2 ratio responses were much slower than membrane current responses because the 90% rise time was 152 s for 5-CT and 373 s for forskolin (Fig. 3 C). We controlled that 5-CT and forskolin had no effect on the ratio in intralaminar thalamic brain slices expressing AKAR2mut (n = 21, three slices), showing that the ratio change obtained with AKAR2 depended on the phosphorylation of the threonine residue in the probe.
Figure 3.

Fast focal application of 5-CT and forskolin on intralaminar thalamic neurons expressing AKAR2. Each trace in A and B indicates the ratio change measured on one individual neuron shown in the grayscale image (F535 fluorescence). Scale bars: 10 μm. Time 0 is the beginning of the agonist application: A, 100 nm 5-CT; B, 13 μm forskolin. The cell indicated by the white outline and plotted as open circles was simultaneously recorded by patch clamp, and the inset shows its I sAHP before (black) and during (gray) forskolin application. Calibration: 20 pA, 3 s. C, Average ratio change during fast application of 5-CT and forskolin. The normalized and averaged responses to cAMP uncaging or intracellular perfusion with 8Br-cAMP are overlaid for comparison. D, Average ratio change in response to 5-CT or forskolin (FSK). Asterisk indicates that the difference is statistically significant.
These kinetics were measured on neurons that were left intact in the brain slice, except for three forskolin experiments in which one neuron was simultaneously recorded in whole-cell configuration (Fig. 3 B). The neurons recorded in whole-cell configuration exhibited the expected suppression in I sAHP (Fig. 3 B, inset), and the time course of their AKAR2 response was similar to that obtained from neighboring intact neurons (Fig. 3 B).
The implication of PKA in the AKAR2 response to 5-CT was tested by recording six intralaminar thalamic neurons in whole-cell configuration with an intracellular solution containing 500 μm RP-cAMPS, a cAMP analog that specifically blocks PKA. No ratio response to 100 nm 5-CT was detected in this condition.
We also verified that AKAR2 could report rapid PKA signals. The ratio response during whole-cell dialysis with 50 μm 8-Br-cAMP increased exponentially with a time constant of 15 s (n = 4) (Fig. 3 C), consistent with the diffusion of a small molecule from the patch pipette into the cytosol (Marty and Neher, 1995). Uniform and rapid release of caged cAMP by UV light triggered a yet faster ratio increase with negligible delay or rising phase (n = 3) (Fig. 3 C), showing that indeed the speed of AKAR2 phosphorylation by PKA is not the limiting factor in our kinetics measurements.
Nucleus
We then used AKAR2-NLS to measure PKA activation in the nucleus (Fig. 4 A,B). As in the cytosol, the PKA signal was significantly smaller in response to 5-CT than to forskolin (Fig. 4 D) (3.4 ± 0.3% ratio change, n = 93, seven slices vs 9.5 ± 0.6%, n = 42, three slices), showing that the relative amplitude of the PKA signal is transferred from the cytosol into the nucleus. The PKA signals appeared much slower in the nucleus than in the cytosol: the 90% rise time measured on the averaged traces was 13 min for 5-CT and 17 min for forskolin. The nucleus thus receives a PKA signal that has been temporally filtered on a time scale of tens of minutes, which is consistent with passive diffusion of the catalytic subunit of PKA into the nucleus.
Figure 4.

Fast focal application of 5-CT and forskolin on intralaminar thalamic neurons expressing AKAR2-NLS. Each trace in A and B indicates the ratio change measured on one individual neuron shown in the grayscale image (F535 fluorescence). Scale bars: 10 μm. Time 0 is the beginning of the agonist application: A, 100 nm 5-CT; B, 13 μm forskolin. C, Average ratio change during fast application of 5-CT and forskolin. D, Average ratio change in response to 5-CT or forskolin (FSK). Asterisk indicates that the difference is statistically significant.
The relative amplitude and time course for the three cellular compartments are overlaid for comparison in Figure 5 A.
Figure 5.

Summary. A, Kinetics of PKA responses at the membrane, in the cytosol, and in the nucleus in intralaminar thalamic neurons are overlaid for comparison. The thick trace represents the responses to 100 nm 5-CT. Dotted lines are responses to 13 μm forskolin, used to normalize the amplitude for the cytosol and nucleus. B, Schematic of the successive events. The gray dotted line delimits the region where the PKA signaling cascade is functionally coupled with the potassium channels.
Discussion
The subcellular organization of proteins involved in signal integration has been emphasized in a number of biochemical and functional studies, but little is known about these phenomenon when stimulating endogenous receptors in the context of a morphologically intact neuron. Our study focused on the coupling efficiency and kinetics of a PKA-mediated response at the membrane, in the cytosol, and in the nucleus. We observed that the coupling between the 5-HT7 receptor and the target channels is fast and efficient, whereas phosphorylation in the cytosol was slower and less efficient. The nucleus follows the cytosolic response on an even slower time scale.
AKAR2 in brain slices
To preserve the spatial organization of the signaling systems in the neurons, all of our experiments were performed on brain slice preparations. Among the various probes available for the cAMP/PKA cascade, AKAR2 is particularly suitable for physiological studies because it reports the phosphorylation level of soluble PKA substrates in the cell. In pyramidal cortical neurons, forskolin strongly increased the emission ratio, whereas the control inactive probe showed no change. Inhibition of most phosphodiesterases with IBMX did not potentiate the forskolin response, showing that stimulation by forskolin is sufficient to obtain maximal AKAR2 response. The ratio returned to baseline after forskolin was removed, and this recovery was prevented by phosphatase 2A and 2B inhibitors, showing that these phosphatases dephosphorylate AKAR2. Phosphorylated and nonphosphorylated forms of AKAR2 are thus in an equilibrium, and the ratio indicates the relative activity of PKA versus phosphatases. The ratio recovery took ∼10 times longer than the 6 min onset in the cytosol, indicating that when monitoring the forskolin response with AKAR2, PKA is much more efficient than phosphatases. In a first approximation, the effect of phosphatases on the onset of the PKA response in the cytosol can therefore be neglected. Photorelease of caged cAMP produced a ratio increase within a few seconds, showing that the phosphorylation reaction is not a limiting factor in our recordings.
The expression of AKAR2 may theoretically affect PKA responses by adding an additional load of PKA substrate. However, the I sAHP amplitude reduction described for intralaminar thalamic neurons was also measured in neurons expressing AKAR2 (Fig. 3 B), showing that PKA retained its ability to phosphorylate target proteins. This probe is thus a good indicator for monitoring PKA activation and steady-state equilibrium between phosphorylation and dephosphorylation in the physiological context of living neurons.
Amplitude
Our results show that the coupling efficiency of PKA to its targets stongly differs between the membrane and the cytosol. At the membrane, pharmacological stimulation of adenylyl cyclase by forskolin or activation through serotonergic G-protein-coupled receptors both suppress I sAHP, indicating a full effect of PKA on the channels. In contrast, in the cytosol, the PKA response to serotonergic stimulation is only about half of that obtained after direct pharmacological stimulation of adenylyl cyclase (Fig. 5 A). Thus, the neuromodulatory stimulus that produces a maximal effect on membrane channels may only be able to trigger a partial response in the cytosol, showing that membrane and cytosol integrate differently the same extracellular signal (Fig. 5 B). The nucleus responds as the cytosol in a graded way, indicating that the effect of PKA on gene expression will also be gradual, as has been reported in NIH3T3 or PC12 cells (Hagiwara et al., 1993).
Several hypotheses may explain the highly efficient coupling between adenylyl cyclases and the sAHP potassium channel. In neurons, a high surface/volume ratio in the dendrites may help keep the cyclases and potassium channels in close proximity while containing cAMP and free catalytic PKA subunit in a small volume. In addition, at the molecular level, protein–protein interactions may form highly organized “signaling microdomains” (Wong and Scott, 2004), maintaining a pool of activatable PKA in close vicinity to the target channels. Desensitization of the 5-HT7 receptor is one hypothesis that can explain the progressive reduction in cAMP synthesis compared with the nondesensitizing production triggered by forskolin.
Time course
Ninety percent of the 5-HT7 effect on the tonic potassium current was obtained within half a minute. This value is comparable with PKA effects observed in non-neuronal cells on endogenous channels (Goaillard et al., 2001; Cesetti et al., 2003), cyclic-nucleotide-gated channels (Rich et al., 2001), or membrane-targeted cAMP-sensitive fluorescent probes (DiPilato et al., 2004; Saucerman et al., 2006). Three seconds are required for the signal transduction from the activation of the receptor to the beginning of an effect on membrane channels in the β-adrenergic response in cardiocytes (Frace et al., 1993), and the phosphorylation of the target potassium channel by PKA takes 5 s, as shown by flash photolysis of caged cAMP in hippocampal neurons (Lancaster et al., 2006). This leaves ∼20 s for cAMP accumulation and PKA activation at the membrane.
The kinetics of the PKA signal in response to 5-CT were five times slower in the cytosol than at the membrane (Fig. 5 A). This is comparable with results obtained in adult frog cardiocytes (Goaillard et al., 2001) and somewhat slower than in neonatal rat cardiocytes (Saucerman et al., 2006). A slow propagation of the PKA signal has also been reported in invertebrate neurons: real-time monitoring of PKA dissociation after cAMP binding has shown that the signal is initiated in the dendrites and propagates toward the cell body on the time scale of minutes (Bacskai et al., 1993; Hempel et al., 1996). A recent report using both a cAMP sensor and AKAR2.2 in retinal ganglion cells describes cAMP events with faster onset time course of 15–20 s (Dunn et al., 2006). These events may be faster because they result from a global calcium signal that simultaneously activates calcium-sensitive adenylyl cyclases throughout the cell, a situation intrinsically different from signals triggered by Gs-coupled membrane receptors.
Several parameters are likely to determine the relatively slow kinetics of the PKA signal in the cytosol. cAMP diffusion from the membrane toward the cytosol can be one factor, but studies in frog olfactory cilia (Chen et al., 1999), cultured hippocampal neurons (Nikolaev et al., 2004), and cardiocytes (Saucerman et al., 2006) have shown a diffusion speed of tens of micrometers per second, which cannot account for the kinetic differences observed between the membrane compartment and the cytosol. Endogenous buffers may also contribute to slowing down the propagation of the signal, as suggested by modeling studies (Rich and Karpen, 2002; Saucerman et al., 2006). PKA activation can also determine the kinetics, and it has been shown that PKA dissociates slowly at nanomolar cAMP concentration (Rich and Karpen, 2002; Nikolaev et al., 2004). One hypothesis is that the cAMP concentration inside the cytosol actually remains very low after the activation of the adenylyl cyclases located at the membrane. Phosphodiesterases probably play a role in maintaining this low cAMP concentration in neurons because IBMX, a nonspecific blocker of phosphodiesterases, produces a strong AKAR2 ratio increase even in the absence of any agonist (our unpublished data). Phosphodiesterases have also been shown to play a major role in the confinement of the cAMP response in various other cell types (Jurevicius and Fischmeister, 1996; Rich et al., 2001; Rochais et al., 2004; Barnes et al., 2005). Furthermore, if cAMP concentration never reaches a concentration sufficient to activate PKA in the cytosol, the signal may be broadcasted by protein diffusion: either the free catalytic subunit of PKA diffuses from the membrane to the cytosol or AKAR2 diffuses from the cytosol to the cAMP signaling domains.
After the cytosol, the PKA signal propagates toward the nucleus on an even slower time course (Fig. 5 A), reaching a maximum only after 17 min. This value is consistent with what has already been observed on cultured cell lines (Zhang et al., 2001; DiPilato et al., 2004), and this time course is determined by the translocation of the catalytic subunits of PKA (Hagiwara et al., 1993; Harootunian et al., 1993). The nuclear envelope thus behaves as a passive integrator of the cytosolic signal, “low-pass filtering” the cytosolic events without affecting their relative amplitude (Fig. 5 B).
Our results suggest that the physiological effects of a neuromodulator will depend on the temporal profile of its release. Phasic release would affect membrane excitability within a range of tens of seconds in an all-or-none manner, whereas continuous release of a neuromodulator during tonic firing of neuromodulatory inputs would trigger graded signals in the cytosol, leading to the phosphorylation of intracellular proteins on a slower time scale. The coincidence of this PKA signal with other cellular events or the metabolic history of the cell may contribute to the fine tuning of the resulting PKA signal in the cytosol and in the nucleus, thus controlling the final physiological output.
Footnotes
This work was supported by the Centre National de la Recherche Scientifique and Université Pierre et Marie Curie-Paris 6. We thank Ronald Harris-Warrick for critical reading of this manuscript. We thank Roger Y. Tsien for providing the AKAR2 and AKAR2-NLS constructs.
References
- Bacskai BJ, Hochner B, Mahaut-Smith M, Adams SR, Kaang BK, Kandel ER, Tsien RY. Spatially resolved dynamics of cAMP and protein kinase A subunits in Aplysia sensory neurons. Science. 1993;260:222–226. doi: 10.1126/science.7682336. [DOI] [PubMed] [Google Scholar]
- Barnes AP, Livera G, Huang P, Sun C, O'Neal WK, Conti M, Stutts MJ, Milgram SL. Phosphodiesterase 4D forms a cAMP diffusion barrier at the apical membrane of the airway epithelium. J Biol Chem. 2005;280:7997–8003. doi: 10.1074/jbc.M407521200. [DOI] [PubMed] [Google Scholar]
- Bredenbeek PJ, Frolov I, Rice CM, Schlesinger S. Sindbis virus expression vectors: packaging of RNA replicons by using defective helper RNAs. J Virol. 1993;67:6439–6446. doi: 10.1128/jvi.67.11.6439-6446.1993. [DOI] [PMC free article] [PubMed] [Google Scholar]
- Carnegie GK, Scott JD. A-kinase anchoring proteins and neuronal signaling mechanisms. Genes Dev. 2003;17:1557–1568. doi: 10.1101/gad.1095803. [DOI] [PubMed] [Google Scholar]
- Cesetti T, Hernandez-Guijo JM, Baldelli P, Carabelli V, Carbone E. Opposite action of β1- and β2-adrenergic receptors on Ca(V)1 L-channel current in rat adrenal chromaffin cells. J Neurosci. 2003;23:73–83. doi: 10.1523/JNEUROSCI.23-01-00073.2003. [DOI] [PMC free article] [PubMed] [Google Scholar]
- Chen C, Nakamura T, Koutalos Y. Cyclic AMP diffusion coefficient in frog olfactory cilia. Biophys J. 1999;76:2861–2867. doi: 10.1016/S0006-3495(99)77440-0. [DOI] [PMC free article] [PubMed] [Google Scholar]
- DiPilato LM, Cheng X, Zhang J. Fluorescent indicators of cAMP and Epac activation reveal differential dynamics of cAMP signaling within discrete subcellular compartments. Proc Natl Acad Sci USA. 2004;101:16513–16518. doi: 10.1073/pnas.0405973101. [DOI] [PMC free article] [PubMed] [Google Scholar]
- Dunn TA, Wang CT, Colicos MA, Zaccolo M, DiPilato LM, Zhang J, Tsien RY, Feller MB. Imaging of cAMP levels and protein kinase a activity reveals that retinal waves drive oscillations in second-messenger cascades. J Neurosci. 2006;26:12807–12815. doi: 10.1523/JNEUROSCI.3238-06.2006. [DOI] [PMC free article] [PubMed] [Google Scholar]
- Ehrengruber MU, Lundstrom K, Schweitzer C, Heuss C, Schlesinger S, Gahwiler BH. Recombinant Semliki Forest virus and Sindbis virus efficiently infect neurons in hippocampal slice cultures. Proc Natl Acad Sci USA. 1999;96:7041–7046. doi: 10.1073/pnas.96.12.7041. [DOI] [PMC free article] [PubMed] [Google Scholar]
- Frace AM, Méry PF, Fischmeister R, Hartzell HC. Rate-limiting steps in the beta-adrenergic stimulation of cardiac calcium current. J Gen Physiol. 1993;101:337–353. doi: 10.1085/jgp.101.3.337. [DOI] [PMC free article] [PubMed] [Google Scholar]
- Goaillard J-M, Vincent P. Serotonin suppresses the slow afterhyperpolarization in rat intralaminar and midline thalamic neurones by activating 5-HT7 receptors. J Physiol (Lond) 2002;541:453–465. doi: 10.1113/jphysiol.2001.013896. [DOI] [PMC free article] [PubMed] [Google Scholar]
- Goaillard J-M, Vincent P, Fischmeister R. Simultaneous measurements of intracellular cAMP and L-type Ca2+ current in single frog ventricular myocytes. J Physiol (Lond) 2001;530:79–91. doi: 10.1111/j.1469-7793.2001.0079m.x. [DOI] [PMC free article] [PubMed] [Google Scholar]
- Hagiwara M, Brindle P, Harootunian A, Armstrong R, Rivier J, Vale W, Tsien R, Montminy MR. Coupling of hormonal stimulation and transcription via the cyclic AMP-responsive factor CREB is rate limited by nuclear entry of protein kinase A. Mol Cell Biol. 1993;13:4852–4859. doi: 10.1128/mcb.13.8.4852. [DOI] [PMC free article] [PubMed] [Google Scholar]
- Harootunian AT, Adams SR, Wen W, Meinkoth JL, Taylor SS, Tsien RY. Movement of the free catalytic subunit of cAMP-dependent protein kinase into and out of the nucleus can be explained by diffusion. Mol Biol Cell. 1993;4:993–1002. doi: 10.1091/mbc.4.10.993. [DOI] [PMC free article] [PubMed] [Google Scholar]
- Hempel CM, Vincent P, Adams SR, Tsien RY, Selverston AI. Spatio-temporal dynamics of cAMP signals in an intact neural circuit. Nature. 1996;384:166–169. doi: 10.1038/384166a0. [DOI] [PubMed] [Google Scholar]
- Jurevicius J, Fischmeister R. cAMP compartmentation is responsible for a local activation of cardiac Ca2+ channels by beta-adrenergic agonists. Proc Natl Acad Sci USA. 1996;93:295–299. doi: 10.1073/pnas.93.1.295. [DOI] [PMC free article] [PubMed] [Google Scholar]
- Lancaster B, Adams PR. Calcium-dependent current generating the afterhyperpolarization of hippocampal neurons. J Neurophysiol. 1986;55:1268–1282. doi: 10.1152/jn.1986.55.6.1268. [DOI] [PubMed] [Google Scholar]
- Lancaster B, Batchelor AM. Novel action of BAPTA series chelators on intrinsic K+ currents in rat hippocampal neurones. J Physiol (Lond) 2000;522:231–246. doi: 10.1111/j.1469-7793.2000.t01-1-00231.x. [DOI] [PMC free article] [PubMed] [Google Scholar]
- Lancaster B, Hu H, Gibb B, Storm JF. Kinetics of ion channel modulation by cAMP in rat hippocampal neurones. J Physiol (Lond) 2006;576:403–417. doi: 10.1113/jphysiol.2006.115295. [DOI] [PMC free article] [PubMed] [Google Scholar]
- Marty A, Neher E. Tight-seal whole-cell recording. In: Sakmann B, Neher E, editors. Single-channel recording. New York: Plenum; 1995. pp. 31–52. [Google Scholar]
- Meuth S, Pape HC, Budde T. Modulation of Ca2+ currents in rat thalamocortical relay neurons by activity and phosphorylation. Eur J Neurosci. 2002;15:1603–1614. doi: 10.1046/j.1460-9568.2002.01999.x. [DOI] [PubMed] [Google Scholar]
- Miyawaki A. Visualization of the spatial and temporal dynamics of intracellular signaling. Dev Cell. 2003;4:295–305. doi: 10.1016/s1534-5807(03)00060-1. [DOI] [PubMed] [Google Scholar]
- Nicholson C. Factors governing diffusing molecular signals in brain extracellular space. J Neural Transm. 2005;112:29–44. doi: 10.1007/s00702-004-0204-1. [DOI] [PubMed] [Google Scholar]
- Nicoll RA. The coupling of neurotransmitter receptors to ion channels in the brain. Science. 1988;241:545–551. doi: 10.1126/science.2456612. [DOI] [PubMed] [Google Scholar]
- Nikolaev VO, Bünemann M, Hein L, Hannawacker A, Lohse MJ. Novel single chain cAMP sensors for receptor-induced signal propagation. J Biol Chem. 2004;279:37215–37218. doi: 10.1074/jbc.C400302200. [DOI] [PubMed] [Google Scholar]
- Pakhotin PI, Pakhotina ID, Andreev AA. Functional stability of hippocampal slices after treatment with cyclooxygenase inhibitors. NeuroReport. 1997;8:1755–1759. doi: 10.1097/00001756-199705060-00037. [DOI] [PubMed] [Google Scholar]
- Pedarzani P, Storm JF. PKA mediates the effects of monoamine transmitters on the K+ current underlying the slow spike adaptation in hippocampal neurons. Neuron. 1993;11:1023–1035. doi: 10.1016/0896-6273(93)90216-e. [DOI] [PubMed] [Google Scholar]
- Pedarzani P, Krause M, Haug T, Storm JF, Stuhmer W. Modulation of the Ca2+-activated K+ current sIAHP by a phosphatase-kinase balance under basal conditions in rat CA1 pyramidal neurons. J Neurophysiol. 1998;79:3252–3256. doi: 10.1152/jn.1998.79.6.3252. [DOI] [PubMed] [Google Scholar]
- Rich TC, Karpen JW. Rev article: cyclic AMP sensors in living cells: what signals can they actually measure? Ann Biomed Eng. 2002;30:1088–1099. doi: 10.1114/1.1511242. [DOI] [PubMed] [Google Scholar]
- Rich TC, Fagan KA, Tse TE, Schaack J, Cooper DMF, Karpen JW. A uniform extracellular stimulus triggers distinct cAMP signals in different compartments of a simple cell. Proc Natl Acad Sci USA. 2001;98:13049–13054. doi: 10.1073/pnas.221381398. [DOI] [PMC free article] [PubMed] [Google Scholar]
- Rochais F, Vandecasteele G, Lefebvre F, Lugnier C, Lum H, Mazet JL, Cooper DM, Fischmeister R. Negative feedback exerted by cAMP-dependent protein kinase and cAMP phosphodiesterase on subsarcolemmal cAMP signals in intact cardiac myocytes: an in vivo study using adenovirus-mediated expression of CNG channels. J Biol Chem. 2004;279:52095–52105. doi: 10.1074/jbc.M405697200. [DOI] [PubMed] [Google Scholar]
- Sah P. Ca(2+)-activated K+ currents in neurones: types, physiological roles and modulation. Trends Neurosci. 1996;19:150–154. doi: 10.1016/s0166-2236(96)80026-9. [DOI] [PubMed] [Google Scholar]
- Sato M, Umezawa Y. Imaging protein phosphorylation by fluorescence in single living cells. Methods. 2004;32:451–455. doi: 10.1016/j.ymeth.2003.10.013. [DOI] [PubMed] [Google Scholar]
- Saucerman JJ, Zhang J, Martin JC, Peng LX, Stenbit AE, Tsien RY, McCulloch AD. Systems analysis of PKA-mediated phosphorylation gradients in live cardiac myocytes. Proc Natl Acad Sci USA. 2006;19:2650–2658. doi: 10.1073/pnas.0600137103. [DOI] [PMC free article] [PubMed] [Google Scholar]
- Shi SH, Hayashi Y, Petralia RS, Zaman SH, Wenthold RJ, Svoboda K, Malinow R. Rapid spine delivery and redistribution of AMPA receptors after synaptic NMDA receptor activation. Science. 1999;284:1811–1816. doi: 10.1126/science.284.5421.1811. [DOI] [PubMed] [Google Scholar]
- Steinberg SF, Brunton LL. Compartmentation of G protein-coupled signaling pathways in cardiac myocytes. Annu Rev Pharmacol Toxicol. 2001;41:751–773. doi: 10.1146/annurev.pharmtox.41.1.751. [DOI] [PubMed] [Google Scholar]
- Vogalis F, Harvey JR, Furness JB. Suppression of a slow post-spike afterhyperpolarization by calcineurin inhibitors. Eur J Neurosci. 2006;19:2650–2658. doi: 10.1111/j.0953-816X.2004.03369.x. [DOI] [PubMed] [Google Scholar]
- Wong W, Scott JD. AKAP signalling complexes: focal points in space and time. Nat Rev Mol Cell Biol. 2004;5:959–970. doi: 10.1038/nrm1527. [DOI] [PubMed] [Google Scholar]
- Zhang J, Ma Y, Taylor SS, Tsien RY. Genetically encoded reporters of protein kinase A activity reveal impact of substrate tethering. Proc Natl Acad Sci USA. 2001;98:14997–15002. doi: 10.1073/pnas.211566798. [DOI] [PMC free article] [PubMed] [Google Scholar]
- Zhang J, Campbell RE, Ting AY, Tsien RY. Creating new fluorescent probes for cell biology. Nat Rev Mol Cell Biol. 2002;3:906–918. doi: 10.1038/nrm976. [DOI] [PubMed] [Google Scholar]
- Zhang J, Hupfeld CJ, Taylor SS, Olefsky JM, Tsien RY. Insulin disrupts beta-adrenergic signalling to protein kinase A in adipocytes. Nature. 2005;437:569–573. doi: 10.1038/nature04140. [DOI] [PubMed] [Google Scholar]