Abstract
In songbirds, nucleus Uvaeformis (Uva) is the sole thalamic input to the telencephalic nucleus HVC (used as a proper name), a sensorimotor structure essential to learned song production that also exhibits state-dependent responses to auditory presentation of the bird's own song (BOS). The role of Uva in influencing HVC auditory activity is unknown. Using in vivo extracellular and intracellular recordings in urethane-anesthetized zebra finches, we characterized the auditory properties of Uva and examined its influence on auditory activity in HVC and in the telencephalic nucleus interface (NIf), the main auditory afferent of HVC and a corecipient of Uva input. We found robust auditory activity in Uva and determined that Uva is innervated by the ventral nucleus of lateral lemniscus, an auditory brainstem component. Thus, Uva provides a direct linkage between the auditory brainstem and HVC. Although low-frequency electrical stimulation in Uva elicited short-latency depolarizing postsynaptic potentials in HVC neurons, reversibly silencing Uva exerted little effect on BOS-evoked activity in HVC neurons. However, high-frequency stimulation in Uva suppressed auditory-evoked synaptic and suprathreshold activity in all HVC neuron types, a process accompanied by decreased input resistance of individual HVC neurons. Furthermore, high-frequency stimulation in Uva simultaneously suppressed auditory activity in HVC and NIf. These results suggest that Uva can gate auditory responses in HVC through a mechanism that involves inhibition local to HVC as well as withdrawal of auditory-evoked excitatory drive from NIf. Thus, Uva could play an important role in state-dependent gating of auditory activity in telencephalic sensorimotor structures important to learned vocal control.
Keywords: auditory gating, zebra finch, frequency-dependent, auditory pathways, thalamus, in vivo intracellular, thalamocortical
Introduction
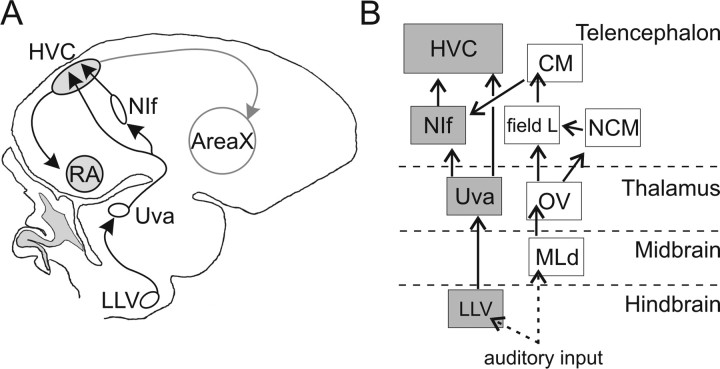
The thalamus influences a wide variety of sensory and motor processes in the telencephalon, including gating of sensory information (Aguilar and Castro-Alamancos, 2005; Akutagawa and Konishi, 2005; Casagrande et al., 2005). In the zebra finch, a songbird that learns to sing using auditory feedback (Konishi, 1965a,b), the nucleus Uvaeformis (Uva), is the sole thalamic input to the telencephalic nucleus HVC (used as a proper name), a sensorimotor structure essential to singing and song perception (Nottebohm et al., 1976; Brenowitz, 1991; Del Negro et al., 1998; Gentner et al., 2000), and to the main auditory afferent of HVC, the telencephalic nucleus interface (NIf) (Cardin and Schmidt, 2004a; Coleman and Mooney, 2004) (see Fig. 1). Auditory responses in both HVC and NIf of the zebra finch are robust and highly selective for playback of the bird's own song (BOS) during sleep or under anesthesia but can be comodulated in their strength and selectivity as a function of the animal's behavioral state (Schmidt and Konishi, 1998; Nick and Konishi, 2001; Cardin and Schmidt, 2003, 2004a; Rauske et al., 2003; Nick and Konishi, 2005). The anatomical placement of Uva presynaptic to both NIf and HVC raises the possibility that it plays an important role in supplying or modulating auditory activity in these two telencephalic nuclei.
Figure 1.
Schematic of the zebra finch song system and auditory pathways to HVC. A, Schematic of a parasagittal section of the zebra finch songbird brain with a subset of the song nuclei illustrated. The thalamic nucleus Uva projects to HVC both directly and indirectly, via NIf. B, Auditory pathways to HVC. Here we identify a pathway from LLV through Uva to HVC (gray). Previous work identified a pathway from the auditory brainstem through the auditory telencephalon to HVC (white). CM, Caudal mesopallium; MLd, dorsal lateral nucleus of the mesencephalon; field L, primary auditory area of the nidopallium; HVC, nucleus HVC of the nidopallium; NCM, caudal medial mesopallium; OV, nucleus ovoidalis; RA, robust nucleus of the arcopallium.
The auditory properties of Uva and its influence on auditory responses in HVC and NIf remain poorly understood. Auditory responses have been detected in the equivalent structure of the pigeon (Korzeniewska and Güntürkün, 1990), and Uva neurons can be excited by visual and tactile stimuli, suggesting a more general sensory function for Uva (Wild, 1994). In addition, the nature of the synaptic interactions of Uva with HVC remain ambiguous because electrically stimulating Uva has been reported to excite HVC neurons and also suppress the responses of HVC to tonal stimuli (Williams, 1989; Williams and Vicario, 1993). Therefore, we sought to characterize the auditory properties of Uva neurons, investigate the source of the auditory input of Uva, determine how Uva synaptically interacts with HVC neurons, and ascertain whether Uva can influence auditory activity in HVC and NIf.
Using dual extracellular recordings in the urethane-anesthetized zebra finch, we found that Uva neurons exhibit robust, nonselective responses to the BOS and other auditory stimuli. Anatomical tracing methods revealed that Uva is innervated by the ventral nucleus of lateral lemniscus (LLV), illuminating an anatomical substrate for a remarkably direct route from the auditory brainstem to HVC. Despite the potential for Uva to convey auditory information to HVC, we found that pharmacologically silencing Uva neuronal activity exerted little effect on BOS-selective responses in HVC. An analysis of functional connectivity revealed that low-frequency Uva stimulation excited both HVC and NIf, whereas high-frequency stimulation of Uva resulted in a rapid and coordinated suppression of auditory activity in both HVC and NIf. This suppressive effect was accompanied by decreased input resistance in HVC neurons, suggesting that suppression in HVC is attributable to local inhibition as well as withdrawal of auditory-evoked excitatory drive from NIf. Ultimately, the capacity of Uva to integrate auditory as well as other forms of sensory information and its ability to modulate auditory activity in HVC and NIf may be important to state-dependent gating of auditory drive to telencephalic sensorimotor nuclei.
Parts of this work have been published previously in abstract form (Coleman and Mooney, 2005).
Materials and Methods
Subjects
Experiments were performed using 72 (>120 d after hatch) male zebra finches (Taeniopygia guttata) in accordance with protocols approved by the Duke University Institutional Animal Care and Use Committee and the Animal Ethics Committee of the University of Auckland. The birds used in this study were either bred and reared in our colony at Duke University Medical Center (132–362 d after hatch) or obtained from commercial suppliers in either the United States (Acadiana Aviaries, Franklin, LA) or Auckland, New Zealand.
Acute in vivo experiments
Stimuli.
The methods used in this study have been described previously (Mooney, 2000; Rosen and Mooney, 2000; Coleman and Mooney, 2004). Before each acute in vivo experiment, songs were recorded from a male zebra finch placed with a female zebra finch in a sound-isolation chamber (Industrial Acoustics Company, Bronx, NY). Songs were amplified and low-pass filtered at 10 kHz, digitized at 22.05 kHz, and stored on a hard drive. Songs were recorded and edited using custom software (LabView; National Instruments, Austin, TX; written by M. Rosen, F. Livingston, and R. Balu) or using Sound Analysis Pro (David Swigger and Ofer Tchernichovski, City College of New York, New York, NY). Edited songs included two or three motifs, the largest repeated unit in the bird's song, and were typically 1.5–2.2 s in duration. Stimuli presented included the following: (1) the BOS; (2) BOS played in reverse (REV), in which the temporal structure of individual syllables and the global syllable order are reversed; (3) song from a conspecific (i.e., zebra) finch (CON); and (4) white noise bursts (WN), consisting of three bursts of white noise (each 50 ms in duration). Stimuli were presented at ∼70 dB sound pressure level, measured with a sound level meter (root mean square, A-weighted), with an interstimulus interval of 5 ± 1 s.
Surgery.
Animals were anesthetized with 20% urethane (60–120 μl total; Sigma, St. Louis, MO) administered into the pectoral muscle in 30–40 μl aliquots at 30 min intervals. Lidocaine HCl (2%; Abbott Labs, Chicago, IL) was applied under the scalp, after which the scalp was dissected along the midline. Uva was located in relation to its proximity to NIf; therefore, the approximate x–y location of NIf and Uva were marked on the skull using stereotaxic coordinates. NIf was marked at a position 2–2.5 mm rostral and 1.7 mm lateral from the bifurcation (Coleman and Mooney, 2004), and Uva was marked 1.5–2 mm rostral and 1.5 mm lateral from the midsagittal sinus bifurcation. A stainless steel post was then attached to the rostral part of the bird's skull with dental cement and cyanoacrylate. Once the cement hardened, the bird was removed from the stereotaxic device and placed in a sound-attenuating chamber (Industrial Acoustics Company) on an air table (Technical Manufacturing Company, Peabody, MA). The bird's head was immobilized via the mounted post, and its body temperature was maintained via an electric blanket set at 37°C (Harvard Apparatus, Holliston, MA). All recordings were made at a 45–55° head angle in the recording chamber. Small craniotomies were made over NIf, Uva, and HVC, and the dura was slit open with an insect pin. Recording electrodes were lowered into the brain using a one-dimensional hydraulic micromanipulator (Soma Scientific, Irvine, CA). Uva typically was encountered at a depth of 4.8–6 mm, NIf at 1.8–2.4 mm, and HVC at a depth of ∼0.3–0.8 mm from the surface of the brain. The Uva electrode was always lowered into the brain at a vertical orientation. To perform simultaneous recordings from the ipsilateral Uva and HVC, the HVC electrode was lowered into the brain at ∼15° below vertical. To perform simultaneous recordings from the ipsilateral Uva and NIf, the NIf electrode was lowered into the brain at ∼30° below vertical. In this orientation, NIf was typically encountered at a depth of 2–2.2 mm from the surface.
Electrophysiology.
To locate Uva, we first located NIf with a carbon fiber electrode (0.4–0.8 MΩ; Kation Scientific, Minneapolis, MN) and then moved the electrode 200 μm medial to search for Uva. NIf was identified by relying on stereotaxic coordinates and based on its electrophysiological properties and its response to playback of BOS and REV (Coleman and Mooney, 2004). In some cases, after we located NIf, the electrode was changed to either a stainless steel (1 MΩ; Micro Probe, Gaithersburg, MD) or a glass electrode (with the tip broken to ∼10–20 μm) for Uva inactivation experiments. The location of Uva was initially identified based on stimulations (0.3 ms single biphasic pulses; model 2100; A-M Systems, Everett, WA) that elicited multiunit activity in HVC (Williams and Vicario, 1993) and later based on its auditory responses to song playback. At the end of each recording session, the Uva recording and stimulation site was lesioned (+10 μA for 10–30 s) to confirm the location of the electrode. Extracellular signals were amplified via an A-M Systems model 1700 differential amplifier and bandpass filtered between 300 Hz and 5 kHz. Extracellular stimulations were made with an A-M Systems isolated pulse stimulator (model 2100). Intracellular recordings were obtained from individual HVC neurons, which were identified based on their firing properties and response to current injection (Dutar et al., 1998; Kubota and Taniguchi, 1998; Mooney, 2000). Intracellular recordings were made with sharp electrodes (100–180 MΩ; borosilicate glass, 100 outer diameter, 50 inner diameter; Frederick Haer Company, Bowdoinham, MA) filled with 2 m KAc. All intracellular electrodes were first tip filled with 5% Neurobiotin in 2 m KAc. Recordings were amplified via an AxoClamp 2B amplifier (Molecular Devices, Foster City, CA) and low-pass filtered at 3 kHz. All recordings were digitized at 10 or 11.025 kHz and stored on a personal computer. All intracellular recordings were obtained in bridge mode, in which the bridge was balanced by offsetting the electrode series resistance to −200 pA, 50 ms current injections before the cell was impaled. The bridge was checked periodically and rebalanced as needed during the recording session.
Uva inactivation.
To inactivate Uva, lidocaine HCl (2% in 1 m NaCl; Sigma), a sodium channel blocker, was pressure ejected with a picospritzer (30–60 ms pulses at 16–22 psi; General Valve, Fairfield, NJ) into the recording area through the recording electrode. The location and extent of lidocaine application was inferred post hoc from the distribution of rhodamine [3000 molecular weight (MW)] that was added to the lidocaine solution.
Data analysis.
Many aspects of the analysis of intracellular data use methods described previously (Rosen and Mooney, 2003; Coleman and Mooney, 2004). The threshold for detecting units within HVC and Uva multiunit activity was set visually by the user at an amplitude above background that excluded the smaller amplitude events (Coleman and Mooney, 2004). Multiunit activity and the action potential response of Uva and HVC neurons were calculated using the response strength (RS), which is the difference in mean firing rate during the stimulus and the mean firing rate during a prestimulus baseline period of similar duration. Significant auditory responses were determined using a paired t test, with p < 0.05, comparing the mean firing rate during the auditory stimulus with the mean firing rate during a prestimulus baseline period of equivalent duration. The response for subthreshold responses in HVC neurons was expressed as z-scores. The z-score takes the difference between the response during the stimulus and the baseline response and divides that by the SD of that difference and is calculated as follows:
 |
where S̄ is the mean response during the stimulus, B̄ is the mean response during a baseline period, and the denominator is the SD of (S − B).
One method to quantify neuronal selectivity for one stimulus versus another is the d′ value, which provides a statistical measure for the discriminability between two stimuli (Green and Swets, 1966). The d′ value is computed by the following equation:
 |
where R is the response strength to the stimulus (STIM), R̄ is the mean value of R, and σ2 is its variance. For our analyses, the selectivity for BOS (STIM1) was compared with either of two stimuli: REV and CON (STIM2). A d′ > 0.5 was used as the criterion for a selective response for BOS (Solis and Doupe, 1997).
Histology.
After each recording session, birds were deeply anesthetized with equithesin and transcardially perfused with 0.9% saline, followed by 4% paraformaldehyde (PFA) in 25 mm NaPO4 buffer. Brains were removed from the skull and postfixed in 4% PFA with 30% sucrose overnight at 4°C, blocked sagittally or coronally, and sectioned on a freezing microtome at 40–75 μm. To confirm the position of the thalamic lesion of the recording and stimulation site, sections were stained with cresyl violet. Extracellularly applied rhodamine dextran or Texas Red dextran (each 3000 MW) was visualized using epifluorescence. To determine the location of rhodamine or Texas Red labeling relative to Uva location after lidocaine application, photomicrographs or digital images of the rhodamine labeling were superimposed on images of the same section viewed under combined dark-field and fluorescent illumination.
Uva afferents
To determine possible sources of auditory afferents to Uva, four adult male zebra finches each received an injection of cholera toxin-B chain (CTB) (List Biological Laboratories, Campbell, CA) into the nucleus under electrophysiological control using procedures similar to those reported previously (Wild, 1994). Briefly, the birds were anesthetized by an injection into the breast muscle of an equal parts mixture of ketamine (50 mg/kg) and xylazine (20 mg/kg), and the head was fixed in a David Kopf Instruments (Tujunga, CA) stereotaxic frame with ear and beak bars. The head angle was adjusted so that the confluence of the midsagittal and cerebellar sinuses, which were visualized by removal of overlying bone, was placed 0.3 mm caudal to intra-aural zero. This resulted in a head angle of ∼45° (Stokes et al., 1974). A glass micropipette (internal tip diameter, 10–15 μm) filled with CTB (1% in PBS) and carried by a David Kopf Instruments Micropositioner was then lowered into the brain via a burr hole in the skull at the following stereotaxic coordinates: anterior, 0.0–0.2 mm; lateral, 1.5–1.7 mm; dorsal, 4.2–4.4 mm. Uva was identified using recordings of multiunit activity in response to somatosensory (brush strokes of contralateral body feathers) and visual (repetitive interruption of the surgical microscope light beam) stimuli. Signals were recorded using an A-M Systems differential amplifier (model 1700), bandpass filtered between 300 Hz and 5 kHz, and monitored on an oscilloscope and audio monitor. Iontophoretic injections (2 μA, 10–20 min) were then made through the recording pipette.
After a 48-h survival time, the birds were anesthetized with an overdose of ketamine–xylazine and perfused through the heart with normal saline followed by 4% PFA in 0.1 m phosphate buffer. The calvaria were removed and the brain was blocked transversely in the stereotaxic plane, after which it was equilibrated in 30% sucrose buffer for 15 h and sectioned at 35 μm on a freezing microtome. Sections were collected serially in 4 × 4 series, washed in PBS, and bleached in 1% H2O2 and 50% methanol for 15 min. Sections were then incubated overnight in a goat anti-CTB antibody (1:33,000; List Biological Laboratories), 2.5% normal rabbit serum, and 0.4% Triton X-100, followed by a biotinylated rabbit anti-goat IgG secondary antibody (Sigma) for 1 h, and then streptavidin peroxidase conjugate (Invitrogen, Carlsbad, CA) at 1:1000 dilution for an additional 1 h. CTB was visualized using 0.025% 3,3′-diamino benzidine (DAB).
Because these injections resulted in retrogradely labeled cells in the ipsilateral LLV (in addition to other previously identified nuclei; see below, Results and Discussion), iontophoretic injections (4 μA, 15 min) of biotinylated dextran amine (BDA) [10,000 MW (Invitrogen); 10% in PBS] were made into LLV in an additional five male zebra finches to verify this putative projection to Uva (Fig. 1). The procedures were identical to those described above for CTB injections, except that the stimuli eliciting the multiunit activity and field potentials were broadband clicks made by activating a picospritzer positioned 10 cm from the contralateral ear (with the air pulse directed away from the bird). The picospritzer and oscilloscope were triggered simultaneously.
After a 4 d survival period, the birds were perfused, and the brains were blocked in the transverse plane, equilibrated in 30% sucrose, sectioned at 35 μm, washed in PBS, and bleached, exactly as described above. Sections were then incubated in streptavidin peroxidase conjugate in PBS plus 0.4% Triton X-100 for 1 h and finally treated with DAB.
To locate cells retrogradely labeled with CTB or terminal fields anterogradely labeled with BDA, one or more series of sections were subsequently counterstained with cresyl violet for the identification of nuclear groups.
Results
Visual and auditory responses in Uva
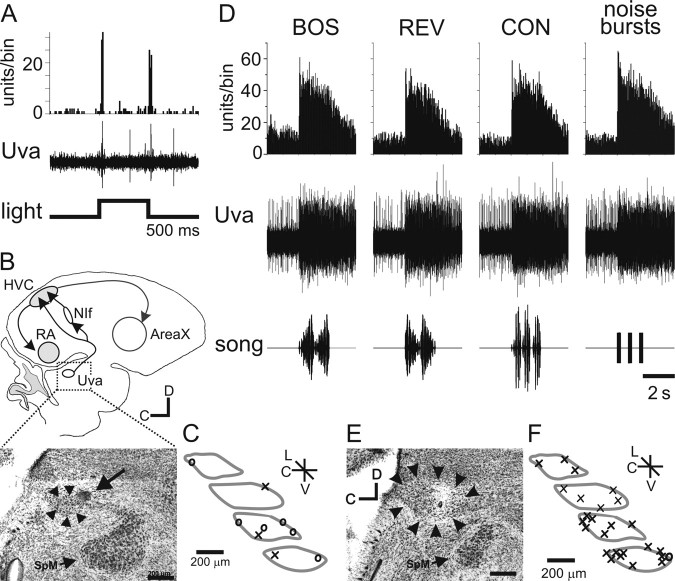
Previous studies reported that Uva responds to visual stimulation of the contralateral eye (Wild, 1994). We used extracellular recordings to record and characterize activity in Uva, and lesions and post hoc histology to anatomically confirm that the electrode recording and stimulation sites were within Uva (Fig. 2). Initially, we localized Uva by stereotaxic coordinates and light-evoked stimuli (Fig. 2A,B). Visually evoked activity in Uva consisted of an on/off response to light presented to the contralateral eye (Fig. 2A), as reported previously. We did not find evidence that light-evoked activity was restricted to a specific subregion of Uva (Fig. 2C). However, subsequent histological analysis revealed that visually evoked activity was present in only 33% (three of nine) of an initial set of recordings histologically confirmed to be within Uva (Fig. 2C). These recordings confirm that light-evoked activity can be detected in Uva of the urethane-anesthetized finch but also show that this feature cannot be used to reliably identify Uva.
Figure 2.
Visual and auditory responses in Uva. A, Uva responds to visual stimuli. Bottom, Timing of light stimulus (white light-emitting diode, 1100 mcd). Middle, Raw trace of multiunit extracellular recording of Uva response to a single light flash. The stimulus artifact was removed for clarity. Top, Peristimulus time histogram (PSTH) of Uva multiunit activity in response to 20 light flashes. Bin size, 25 ms. B, Anatomical location of recording site in A. Top, Schematic of a parasagittal section of the zebra finch brain with outline of area of photomicrograph shown below. Bottom, Photomicrograph of lesion made in the recording site for the experiment in A. Arrowheads outline Uva, and the arrow points to the lesion site, which is on the rostral, dorsal edge of Uva. Note the proximity of Uva to the medial spiriform nucleus (SpM). Scale bar, 200 μm. C, Schematic of multiple Uva sections illustrating all recording sites that responded (×) and did not respond (○) to light stimulus. D, Uva responds to auditory input. Bottom row, Oscillograms of song stimuli, including the BOS, REV, CON, and noise bursts. The noise burst stimulus is three sequential presentations of short duration (50 ms) white-noise bursts. Middle row, Raw trace of multiunit extracellular recording from Uva showing the responses to a single playback of each auditory stimulus. Top row, PSTH of Uva multiunit activity in response to 20 iterations of each auditory stimulus. E, Anatomical location of Uva recording site shown in D. Uva is outlined with the black arrowheads. The lesion and recording site is located in the middle of Uva. Scale bar, 200 μm. F, Schematic summary of Uva recording sites that responded (×) and did not respond to auditory stimuli (○).C, Caudal; D, dorsal; L, lateral; V, ventral.
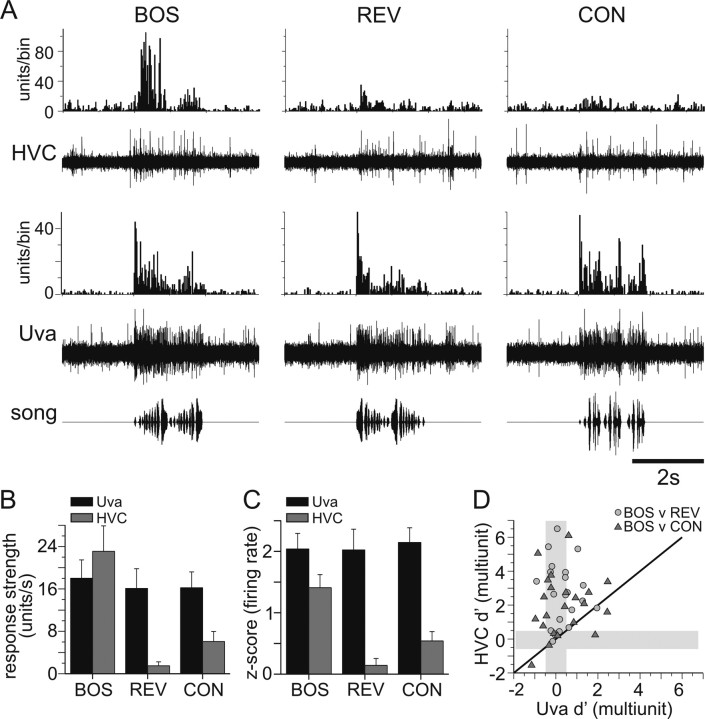
Because song nuclei that receive input from Uva show robust auditory activity and auditory responses have been detected in the pigeon equivalent of Uva (Korzeniewska and Güntürkün, 1990), we measured the responsiveness of Uva to auditory presentation of song stimuli. Multiunit recordings made throughout Uva revealed a strong response to all of the auditory stimuli we presented to the bird, including BOS, REV, CON, and noise bursts (Fig. 2D–F) (see Fig. 4A). Qualitatively, two types of responses were noted. The first type (4 of 22) (Fig. 2D) involved a marked increase in firing rate at stimulus onset that persisted after stimulus offset, whereas the second response type (18 of 22) (see Fig. 4A) involved a modulation in firing rate that could closely follow the temporal features of the stimulus. Almost all (21 of 22) Uva recording sites showed significant responses to all auditory stimuli presented (p < 0.05, using a paired t test to compare activity before and during stimulus presentation) (Fig. 2F). These findings suggest that, in addition to previous reports of somatosensory and visual activity, Uva also can strongly respond to auditory stimuli.
Figure 4.
Comparison of simultaneously recorded multiunit activity in Uva and HVC. A, Auditory responses from simultaneous multiunit recordings in HVC and Uva. Bottom row, Oscillograms of auditory stimuli. Fourth row, Raw trace of Uva multiunit response to a single iteration of each auditory stimulus. Third row, PSTH of the multiunit response in Uva to 20 iterations of each stimulus. Response strengths were as follows: BOS, 21.4; REV, 16.3; CON, 22.8; for all, p < 0.01. d′ values were as follows: BOS vs REV, 0.65; BOS vs CON, −0.18. Second row, Simultaneously recorded raw trace of multiunit response in HVC to a single playback of each auditory stimulus. Top row, PSTH of the multiunit response in HVC to 20 iterations of each stimulus. Bin size, 25 ms. HVC neurons are selective for BOS over the other two stimuli. Response strengths were as follows: BOS, 30.4; REV, 7.2; CON, 4.9; for all, p < 0.01. d′ values were as follows: BOS vs REV, 2.52; BOS vs CON, 0.88. B, C, On average, Uva neurons respond equally well to all auditory stimuli, whereas HVC responds selectively to BOS. B, Summary of response strength of multiunit activity in Uva (black bars; n = 22) and HVC (gray bars; n = 20) to each auditory stimulus, including BOS, REV, and CON. Error bars indicate SEM. C, z-score value of the multiunit firing rate of Uva and HVC. D, Uva and HVC activity do not have similar selectivity for BOS over non-BOS stimuli. The d′ values (BOS vs REV, circles; BOS v CON, triangles) for HVC firing rate are plotted against the d′ values for simultaneously recorded Uva firing rates. Black diagonal line is the unity line. The gray bars are regions of nonselectivity, −0.5 < d′ < 0.5, for each recording site.
Anatomical localization of Uva afferents
The auditory responses in Uva had not been described previously, and the anatomical source of the auditory input was unclear. To identify the potential source of auditory input to Uva, we performed retrograde and anterograde tracer experiments. Although all of the injections of CTB into Uva were small, none of them was strictly confined to the nucleus. Nevertheless, they each resulted in retrograde labeling of cells in all the nuclei previously identified as sources of afferents to Uva, namely the dorsal column and external cuneate nuclei, predominantly layer 13 of the optic tectum, a cell group in the ventrolateral medulla, the medial habenular nucleus, and the dorsal part of the superior reticular nucleus of the thalamus (Wild, 1994; Reinke and Wild, 1998; Striedter and Vu, 1998; Akutagawa and Konishi, 2005). In addition, the present experiments revealed another potential source of input to Uva, namely LLV (Fig. 3), a source that was confirmed by injections of BDA into LLV, subsequent to recording auditory evoked potentials there (data not shown). These injections produced a distinct terminal field in Uva, which was concentrated in its more lateral aspects (Fig. 3E). They also produced a massive terminal field in the ipsilateral central nucleus of the inferior colliculus (dorsal lateral nucleus of the mesencephalon) and retrogradely labeled cells in the cochlear nucleus angularis and the third-order auditory nucleus laminaris, thereby providing confirmation of the location of the injections in LLV. These anatomical tracing experiments indicate that Uva receives a direct projection from LLV, an isthmic component of the auditory brainstem.
Figure 3.
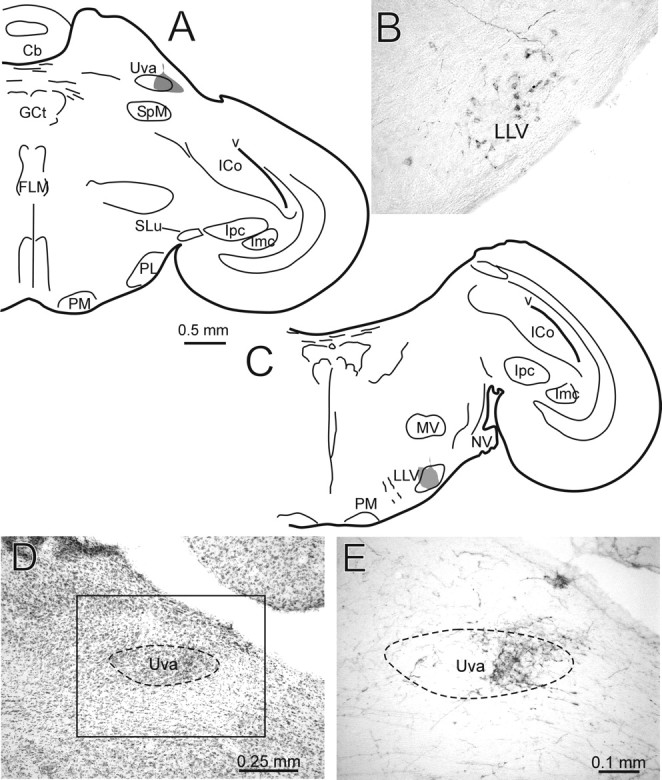
LLV projects to Uva. A, Schematic hemisection showing an injection of CTB (gray) centered on the lateral part of Uva. B, Photomicrograph of LLV neurons retrogradely labeled from the injection shown in A. Also obvious are several fibers labeled with BDA, an injection of which was made in a cochlear nucleus (nucleus angularis) in the same case. These fibers terminate within LLV. C, Schematic hemisection showing an injection of BDA (gray) in LLV. D, Nissl-counterstained section showing the grape-shaped nucleus Uva. Anterograde label resulting from the injection shown in C is present in the lateral part of Uva, which is shown in E at higher power in an adjacent non-counterstained section. E corresponds to the boxed area shown in D. Cb, Cerebellum; FLM, medial longitudinal fasciculus; GCt, central gray; ICo, intercollicular nucleus; Imc, magnocellular isthmic nucleus; Ipc, parvocellular isthmic nucleus; MV, rostral pole of trigeminal motor nucleus; NV, root of trigeminal nerve; PL, lateral pontine nucleus; PM, medial pontine nucleus; SLu, semilunar nucleus; SpM, medial spiriform nucleus; v, ventricle.
Comparison of Uva and HVC activity
A strong response bias to the BOS relative to other song and non-song stimuli (i.e., BOS selectivity) is one hallmark of HVC auditory responses in the urethane-anesthetized zebra finch. Given that we found Uva to be highly responsive to auditory stimulation, we directly compared BOS selectivity in Uva and HVC in individual birds by recording simultaneous multiunit activity from Uva and HVC. Across all birds, we found that Uva sites showed similarly robust excitatory responses to BOS, REV, and CON, whereas HVC sites were most strongly excited by the BOS (Fig. 4B,C) (RS, units/s ± SEM; Uva: BOS, 18.0 ± 3.5; REV, 16.1 ± 3.7; CON, 16.2 ± 3.0; HVC: BOS, 23.1 ± 4.8; REV, 1.5 ± 0.75; CON, 6.1 ± 1.9) (z-score multiunit firing rate, Uva: BOS, 2.0 ± 0.25; REV, 2.0 ± 0.34; CON, 2.1 ± 0.24; HVC: BOS, 1.4 ± 0.2; REV, 0.14 ± 0.11; CON, 0.54 ± 0.15). We directly compared BOS selectivity at these two sites by calculating a d′ value, which measures the difference between BOS- and either REV- or CON-evoked responses divided by the variance in these responses (see Materials and Methods). Although these calculations did reveal that a minority of Uva recording sites was selective for BOS (Fig. 4D) (8 of 22 sites BOS > REV; 7 of 22 sites BOS > CON; d′ > 0.5), BOS selectivity was significantly higher in HVC (paired t test, p < 0.05). This difference in selectivity between HVC and Uva is in contrast to the similar BOS selectivity between HVC and NIf, the main source of auditory input by HVC (Cardin and Schmidt, 2004a; Coleman and Mooney, 2004).
One of the striking characteristics of both NIf and HVC is their coordinated spontaneous bursts of activity (Janata and Margoliash, 1999; Coleman and Mooney, 2004). We found some coordinated bursting activity in extracellularly recorded Uva and HVC (supplemental Fig. 1, available at www.jneurosci.org as supplemental material). However, this activity was seen infrequently and thus was not further characterized.
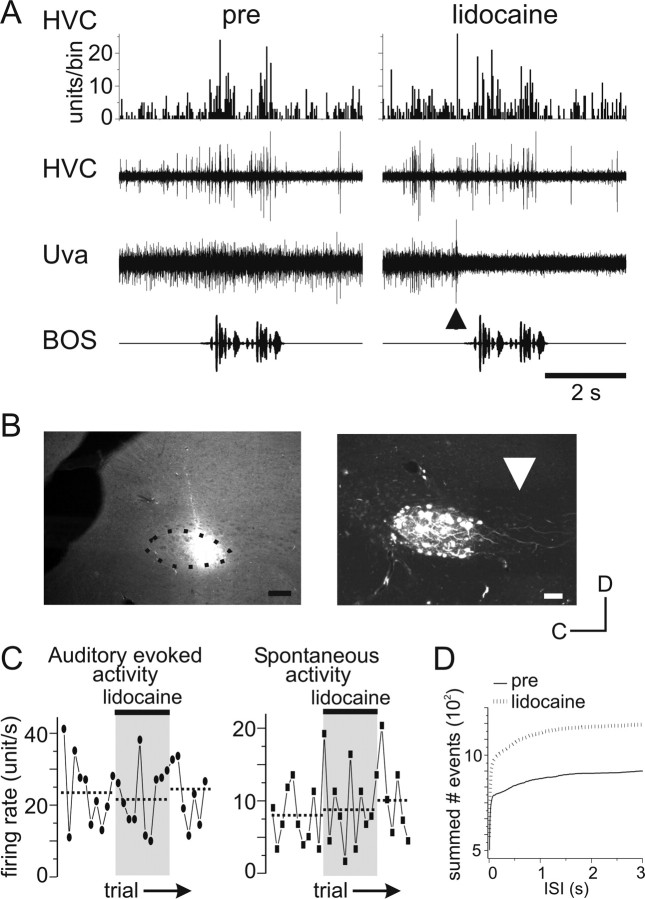
To determine whether Uva provides auditory input to HVC (either directly or indirectly), we inactivated Uva with lidocaine (2%) in urethane-anesthetized birds (Fig. 5). Somewhat to our surprise, applying lidocaine in Uva had very little influence on the BOS-evoked or spontaneous multiunit activity recorded in HVC, although it did silence multiunit activity recorded in Uva (Fig. 5A,C). For the example shown, lidocaine was applied to the rostral edge of Uva (Fig. 5B, left), which should eliminate all activity transmitted from Uva to HVC, because Uva axons that project to HVC exit rostrally through the site of inactivation (Fig. 5B, right) (Coleman and Vu, 2005). In all experiments in which we applied lidocaine to Uva (n = 4), we found no difference in the response strength of either BOS-evoked activity (units/s during song presentation before lidocaine, 37.3 ± 4.2; with lidocaine, 31.5 ± 3.7; after lidocaine, 33.0 ± 4.2; p > 0.05, ANOVA) or spontaneous activity in HVC (units/s during baseline activity before lidocaine, 12.5 ± 2.0; with lidocaine, 10.4 ± 1.7; after lidocaine, 10.6 ± 1.8; p > 0.05, ANOVA). Therefore, Uva inactivation does not appear to influence the response strength of BOS-evoked activity recorded in HVC. Because response strength is a measure of the change in the mean firing rate over the entire stimulus duration relative to the mean baseline firing rate, we also determined whether Uva inactivation altered other properties of the HVC response to BOS playback, including the peak firing time and changes in firing frequency. To determine whether there were changes in the overall timing of HVC activity during BOS playback before and during lidocaine inactivation of Uva, we calculated the correlation coefficient (“corrcoeff” function in Matlab) of the HVC response to 10 iterations of BOS playback before and during lidocaine inactivation of Uva. In two out of four cases, the correlation coefficient comparing HVC multiunit activity before with during lidocaine application was lower than that comparing HVC multiunit activity for two time points before lidocaine application (Table 1). These data suggest that Uva may slightly influence the timing of HVC multiunit responses to BOS playback. We further explored whether Uva may contribute to modulations in firing frequencies during BOS playback without affecting the overall mean firing rate, measured by the response strength metric, by calculating the multiunit firing frequency of HVC before and during lidocaine activation. Firing frequencies were binned (1 ms bin width), and the resulting histograms were compared (Kolmogrov–Smirnov test). There was a small but significant change in firing frequency during Uva inactivity in only one of the four experiments (Fig. 5D, Table 1). These data suggest that there may be some subtle changes in HVC activity during lidocaine inactivation of Uva; however, overall there is very little discernable difference in multiunit HVC firing during lidocaine inactivation of Uva in urethane-anesthetized birds (Fig. 5A). These results shows that Uva does not drive auditory responses in the HVC of the urethane-anesthetized zebra finch and raises questions about the nature of the synaptic interactions between Uva and HVC.
Figure 5.
Lidocaine inactivation of Uva has little effect on auditory or spontaneous HVC multiunit activity. A, Data showing no effect of Uva inactivation on BOS-evoked activity in HVC. Bottom trace, Oscillogram of song stimuli. Third trace, Raw trace of multiunit extracellular recording of Uva. Second trace, Multiunit extracellular recording of the ipsilateral HVC. Top trace, PSTH of the multiunit HVC response to 10 iterations of BOS presentation. Left, Before lidocaine application, BOS presentation increased activity in both NIf and HVC. Right, Lidocaine application to Uva immediately before BOS stimulation (arrowhead) eliminated activity in Uva but had little effect on the BOS response in HVC. B, Left, Photomicrograph of rhodamine dextran localization relative to Uva (dotted line). The boundary of Uva was determined from dark-field illumination of the same section (data not shown) and is outlined with the dotted line. This lidocaine injection likely blocked all input of Uva to HVC because Uva fibers exit from anterior Uva to project to HVC (see right) (Coleman and Vu, 2005). Right, Confocal image of retrogradely labeled Uva cells and axons (white arrow) from rhodamine dextran injected into HVC. Scale bars, 100 μm. C, The absolute BOS-evoked and spontaneous multiunit firing response in HVC before, during, and after lidocaine application in Uva for the experiment shown in A and B. Each symbol represents the multiunit firing response (units/s) to each sequential BOS stimulation. Lidocaine was applied to Uva after the 10th BOS presentation for 10 iterations (black bar, gray box). Left, Absolute BOS-evoked response (black circles) in HVC before, during, and after lidocaine application to Uva. Right, Spontaneous firing rate (black squares) in HVC before, during, and after lidocaine application to Uva. D, Comparison of firing frequencies of HVC activity before and during Uva inactivation. Summation of number of events during BOS presentation before (pre, solid line) and after (dotted line) lidocaine inactivation of Uva. ISI, Interstimulus interval.
Table 1.
Comparisons of HVC activity before and during lidocaine inactivation of Uva
| Experiment | Correlation coefficient |
Firing frequency (ISI) |
||
|---|---|---|---|---|
| Pre vs pre | Pre vs lido | p value | Kolmogorov–Smirnov z | |
| mc1400 | 0.7475 | 0.5005 | 0.251 | 1.018 |
| mc1401 | 0.3871 | 0.3406 | 0.252 | 1.017 |
| mc1411 | 0.279 | 0.2634 | 0.044 | 1.382 |
| mc1418 | 0.571 | 0.1833 | 0.870 | 0.595 |
ISI, Interstimulus interval; lido, lidocaine.
Synaptic interactions between Uva and HVC
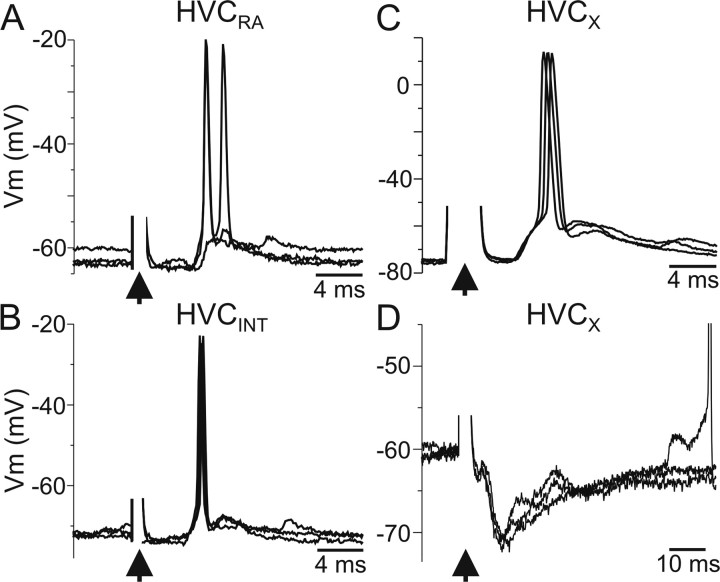
Because Uva inactivation exerted no measurable effect on HVC activity, we examined the synaptic influence of Uva on identified HVC neurons. Resolving cellular identity in HVC is particularly important because HVC comprises three distinct classes of neurons, including projection neurons that innervate either the basal ganglia area X (HVCX) or the song motor nucleus RA (HVCRA) and interneurons (HVCINT) (Fig. 1A), the last of which predominate in multiunit recordings (Rauske et al., 2003). Therefore, we made in vivo intracellular recordings from each of the three HVC neuron types and electrically stimulated Uva at low frequency (1 Hz). We found that low-frequency Uva stimulation evoked short-latency depolarizing postsynaptic potentials (dPSPs) in all HVCRA neurons (n = 6) (Fig. 6A) and HVCINT (n = 4) (Fig. 6B). A component of these PSPs appears to be excitatory because they could drive HVC neurons to fire action potentials. When recording from HVCX neurons, we found that Uva stimulation could elicit either purely depolarizing synaptic responses and action potentials (n = 2) (Fig. 6C) or a short-latency dPSP followed by a long-lasting hyperpolarizing PSP (n = 9) (Fig. 6D). This hyperpolarization is most likely attributable to feedforward inhibition from HVCINT (Mooney and Prather, 2005).
Figure 6.
Low-frequency Uva stimulation excites all HVC neuron subtypes. A, Low-frequency (1 Hz) Uva pulses (40 μA, 100 μs duration) elicit action potentials in an individual HVCRA neuron. Each trace is the response to a single Uva stimulation. Tonic hyperpolarizing current (−0.4 nA) was injected into the neuron through the recording electrode. B, Low-frequency (1 Hz) Uva pulses (40 μA) elicit action potentials in an HVCINT. C, Uva stimulation elicited an apparent purely excitatory response in some HVCX neurons. D, In some HVCX neurons, Uva stimulation elicited a fast EPSP followed by a long-lasting IPSP. Note the different timescale in C and D. For all traces, the stimulus artifact (arrowhead) was reduced for clarity. Neurons in C and D are from the same animal.
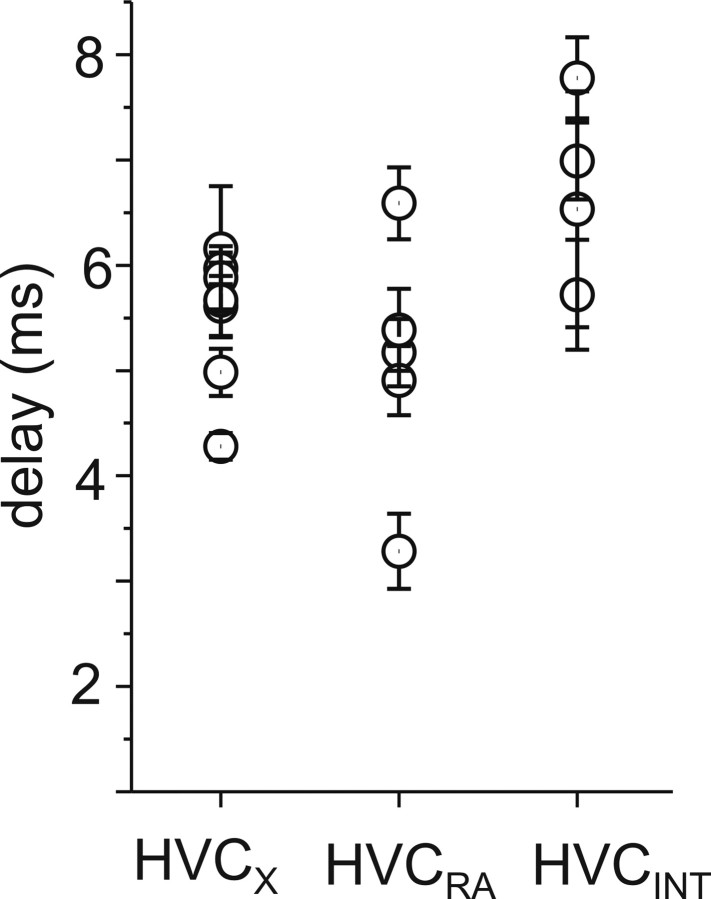
Stimulation of Uva and recording the postsynaptic potentials in HVC neurons allowed us to measure the synaptic delay between Uva and HVC. When we measured the delay between Uva stimulation and the onset of the postsynaptic potential in HVC neurons, we found that there was a similar delay between Uva stimulation and response in HVC projection neurons (Fig. 7) (mean ± SEM; HVCX, 5.3 ± 0.08 ms, n = 9; HVCRA, 4.9 ± 0.12 ms, n = 6). Interestingly, the longest delay was between Uva stimulation and PSP onset in HVCINT (Fig. 7) (HVCINT, 6.8 ± 0.16 ms, n = 4). This suggests that Uva may synapse directly on HVC projection neurons and interact with HVC interneurons indirectly, either through HVC network interactions or via NIf. These results indicate that Uva excites all three HVC neuron types and may recruit inhibition onto HVCX cells through HVCINT (Mooney and Prather, 2005).
Figure 7.
Delay between low-frequency (1 Hz) Uva stimulation and the onset of the postsynaptic response in each HVC neuron type. Each value represents mean ± SD.
A prominent feature of mammalian thalamocortical synapses is that they exhibit marked depression when they are repetitively activated at frequencies >2 Hz (Castro-Alamancos and Oldford, 2002; Castro-Alamancos, 2004; Rose and Metherate, 2005). To test whether Uva–HVC synapses are analogous to mammalian thalamocortical synapses in their tendency to display synaptic depression, we stimulated Uva at 2, 10, and 20 Hz (supplemental Fig. 2, available at www.jneurosci.org as supplemental material). We observed that, at 2 Hz, the Uva–HVC synapse did not show a significant depression (5.3 ± 1.2%). However, in response to stimulus trains at 10 and 20 Hz, the Uva–HVC synapse did display slight to moderate levels of depression (11.2 ± 3.0 and 19.1 ± 13.3%, respectively, when comparing the amplitude of the first and second evoked PSPs in the train). This level of depression is less marked than for thalamocortical synapses (Castro-Alamancos, 2004; Rose and Metherate, 2005).
High-frequency stimulation in Uva can suppress HVC auditory activity
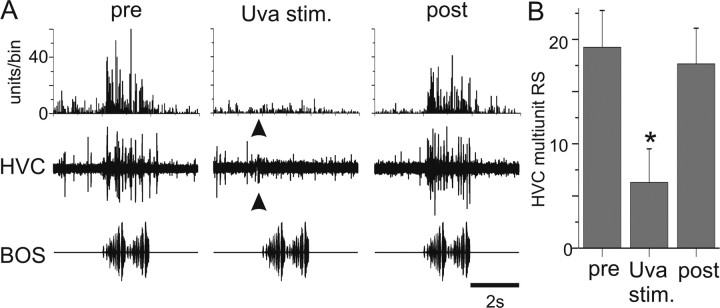
Because multiunit recordings made in Uva display high-frequency discharge (i.e., “superbursts”) during singing (Williams and Vicario, 1993) and previous reports suggested that Uva stimulation could suppress auditory activity in HVC (Williams, 1989), we investigated the effects of high-frequency electrical stimulation in Uva on auditory-evoked activity in HVC. In contrast to the effects of low-frequency Uva stimulation, a short-duration, high-frequency Uva stimulus train (50 ms train at 200 or 400 Hz) delivered immediately (200 ms) before each BOS playback suppressed auditory-evoked multiunit activity recorded in HVC (Fig. 8A, Uva stim). On average, high-frequency Uva stimulation resulted in a significant reduction of the BOS-evoked multiunit activity in HVC (Fig. 8B) (ANOVA, p < 0.05; 16 of 19 cases showed significant suppression). Subsequent trials in which Uva stimulation was discontinued showed recovery of BOS-evoked activity to baseline levels (Fig. 8A, post, B) (see Figs. 9, 10). In some cases, the response appeared to partially “recover” within 0.5–1 s after the stimulus train was applied to Uva (for such an example, see Fig. 9A, Uva stim.). These experiments show that high-frequency stimulation of Uva can transiently suppress BOS-evoked activity in HVC.
Figure 8.
A, High-frequency (400 Hz) Uva stimulation suppresses multiunit activity in HVC. Bottom row, Oscillogram of BOS. Middle row, Raw trace of the multiunit response of HVC to a single playback of BOS. Top row, PSTH of HVC multiunit activity to 10 iterations of BOS. Left column, HVC multiunit activity increases in response to playback of BOS before Uva stimulation. HVC RS of 38.8 units/s. Middle column, HVC activity is reduced when Uva is stimulated (arrowhead; 20 μA, 50 ms train at 400 Hz, 200 ms before BOS onset). RS of 2.16 units/s. The stimulus artifact was reduced in both the raw trace and the PSTH. Right column, HVC response to playback of BOS recovered when Uva was no longer stimulated before BOS presentation. RS of 38.27 units/s. This is from the same Uva recording site shown in Figure 2A. Bin size, 25 ms. B, Summary of the effect of Uva stimulation on BOS-evoked multiunit auditory activity in HVC. RS: pre, 18.8 ± 3.7 units/s; Uva stim., 6.1 ± 3.4 units/s; post, 17.6 ± 3.4 units/s. Error bars represent SEM. *p < 0.05, Uva stimulation is significantly less than either pre- or post-Uva stimulation (ANOVA).
Figure 9.
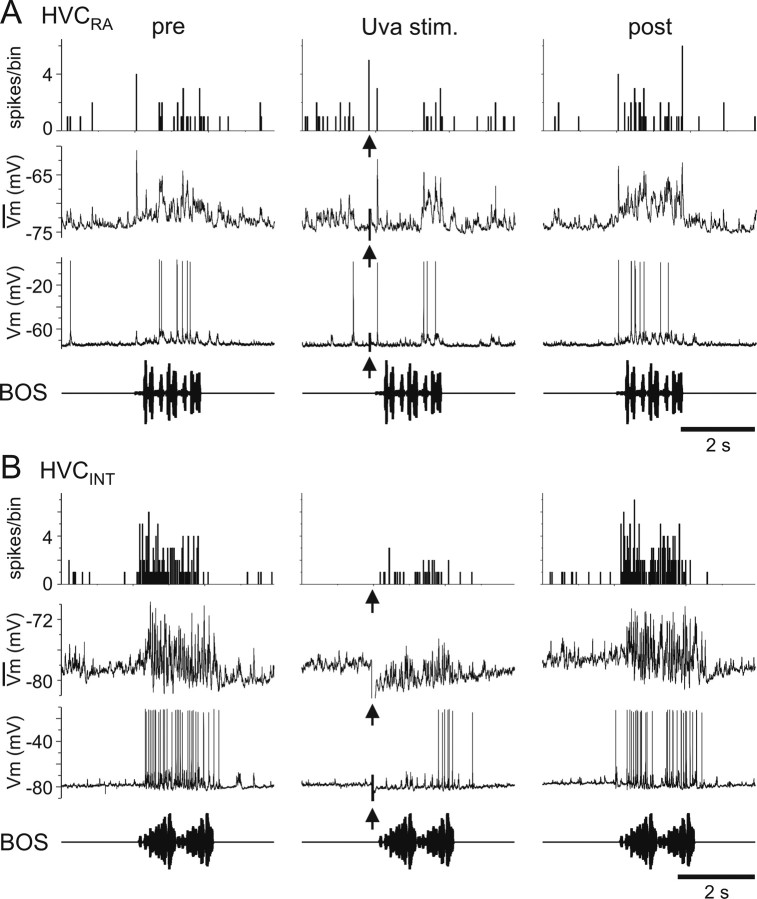
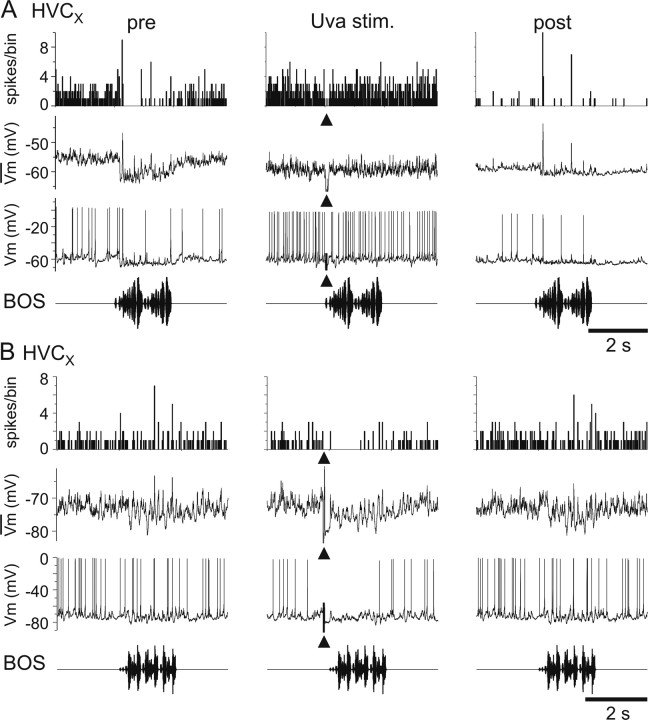
The auditory responses in HVCRA and HVCINT are suppressed by high-frequency Uva stimulation. A, B, Bottom row, Oscillogram of BOS presentation. Third row, Raw trace of the response of each HVC neuron to a single playback of BOS. Second row, Median filtered, average membrane potential. Top row, PSTH for spikes generated. Left column, Response of each HVC neuron to playback of BOS before Uva stimulation. Middle column, Uva was stimulated (Uva stim., arrowheads; 400 Hz for 50 ms) 200 ms before BOS playback. Right column, Response of each HVC neuron after Uva stimulation no longer preceded BOS presentation. A, The BOS-evoked auditory response of an HVCRA was reduced when Uva was stimulated (18 μA). Ten iterations of BOS were presented for each stimulus condition. B, The BOS-evoked auditory response in HVCINT was reduced when Uva was stimulated (25 μA). Five iterations of BOS was presented for each stimulus condition. For each neuron, the stimulus artifact was reduced for clarity. Bin size, 25 ms.
Figure 10.
High-frequency Uva stimulation had a mixed effect on BOS-evoked auditory response in HVCX neurons. A, B, Bottom row, Oscillogram of BOS presentation. Third row, Raw trace of the response of each HVC neuron to a single playback of BOS. Second row, Median filtered, average membrane potential. Top row, PSTH for spikes generated. A, Uva stimulation resulted in a removal of inhibition in a subset of HVCX neurons. Left column, Before Uva stimulation, the HVCX neuron was inhibited during playback of BOS. Middle column, Stimulation of Uva (5 50-ms trains at 200 Hz and 5 50-ms trains at 333 Hz, 20 μA) 200 ms before BOS playback (arrow) resulted in the removal of this inhibition, and the HVCX neuron fired action potentials throughout BOS playback. Right column, After Uva stimulation, the HVCX neuron was inhibited during BOS playback. The neuron is less active after Uva stimulation attributable to a slight, spontaneous hyperpolarization of the membrane potential, which is common for these cells and not the result of Uva stimulation. Ten iterations of BOS were presented for each stimulus. Tonic depolarizing current (+0.24 nA) was injected into the neuron throughout the recording to accentuate the inhibition. B, Uva stimulation inhibited some HVCX neurons. Left column, Before Uva stimulation, BOS presentation elicited hyperpolarizing IPSPs in the HVCX neuron. Stimulation of Uva (50 ms train at 400 Hz, 20 μA) 200 ms before BOS presentation resulted in an initial hyperpolarization of the membrane potential and a reduction in spiking. Right column, The response of the neuron to BOS presentation recovered after Uva stimulation. Five iterations of BOS were presented for each stimulus. Bin size, 25 ms.
To better understand how high-frequency Uva stimulation affected different HVC neuron types, we combined high-frequency Uva stimulations with intracellular recordings from identified HVC neurons. We found that high-frequency Uva stimulation reduced the BOS-evoked action potential activity in all three HVC neuron types. Qualitatively, we observed that the reduction in BOS-evoked action potential activity in both HVCINT and HVCRA neurons was paralleled by a reduction of the subthreshold response in these neurons during BOS playback (Fig. 9). In HVCX cells, which normally display a complex mix of hyperpolarizing and depolarizing responses to BOS playback, we observed that high-frequency electrical stimulation of Uva could diminish hyperpolarizing (Fig. 10A) and/or depolarizing (Fig. 10B) components of the BOS-evoked synaptic response. To quantify these effects, we measured the response of each HVC neuron type to BOS presentation without Uva stimulation and their response when BOS presentation was preceded by a brief, high-frequency electrical stimulation of Uva (Fig. 11). For HVCRA neurons, we measured the subthreshold depolarizing response to the whole song playback because these neurons fire action potentials very infrequently (Mooney, 2000; Hahnloser et al., 2002). Because HVCINT neurons fire robustly during BOS playback and measurement of subthreshold responses in these neurons is difficult because of the large afterhyperpolarization associated with their action potentials, we measured their suprathreshold RS to the whole song playback. HVCX neurons are inhibited throughout BOS playback and fire brief bursts of action potentials at specific times during each song (Mooney, 2000; Rosen and Mooney, 2003); therefore, we measured their suprathreshold response strength during their peak firing response (peak RS). These measurements showed significant suppressive effects on the activity in both HVCRA and HVCINT and marginally significant suppressive effects on HVCX neurons (Fig. 11).
Figure 11.
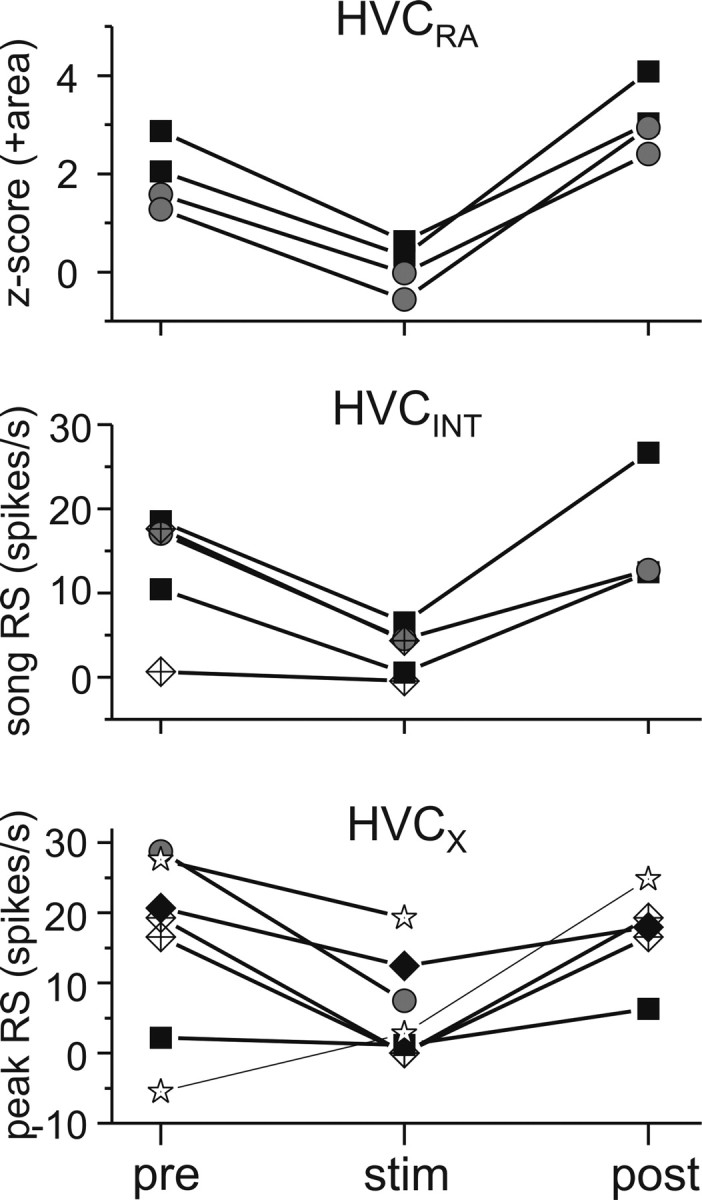
Summary of the effect of high-frequency Uva stimulation on individual HVC neurons. Top, The effect on HVCRA neurons was measured by the z-score value in area of subthreshold membrane potential to the whole song playback (n = 4 stimulus trials in 2 birds). Uva stimulation evoked a significant decrease in z-score area compared with pre-Uva stimulation values (p < 0.01, paired t test). Middle, The effect of Uva stimulation on HVCINT neurons was measured with the response strength throughout song presentation (n = 5 stimulus trials in 3 birds). Uva stimulation resulted in a significant decrease in HVCINT neurons response strength (p < 0.01, paired t test). Bottom, The effect of Uva stimulation on HVCX neurons was measured using the response of the peak HVCX firing compared with a comparable baseline firing rate (n = 7 stimulus trials in 4 birds). Uva stimulation resulted in a marginally significant decrease in HVCX peak RS (p = 0.056, paired t test). For each graph, each point is the average for 5–10 iterations of BOS playback.
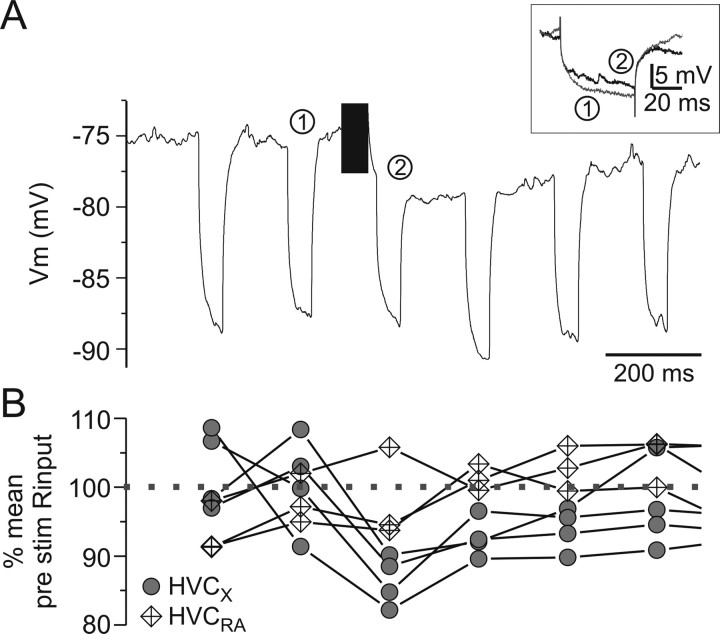
The suppressive effects of Uva stimulation on BOS-evoked activity in the various HVC neuron types could be attributable to direct inhibition of HVC neurons and/or removal of auditory-evoked excitatory drive from extrinsic sources, specifically NIf. A decreased input resistance in HVC neurons during Uva-evoked suppression of HVC auditory activity would be consistent with direct inhibition, whereas a resistance increase would be consistent with the removal of BOS-evoked synaptic excitation. To test whether high-frequency Uva stimulation influenced the input resistance of HVC projection neurons, we stimulated Uva while injecting a train of brief hyperpolarizing currents through the HVC intracellular recording electrode to monitor the input resistance of the impaled neuron (Fig. 12). We focused on HVC projection neurons because they had the shortest-latency response from low-frequency Uva stimulation and thus were most likely to receive monosynaptic input from Uva axons. In HVCX neurons, Uva stimulation was followed by a short-lasting reduction in input resistance, consistent with a direct inhibitory mechanism (Fig. 12B). However, the input resistance of HVCRA neurons did not change with high-frequency stimulation of Uva (repeated-measures ANOVA, p > 0.05).
Figure 12.
Uva stimulation results in a decrease in the input resistance (Rinput) of all HVC projection neurons. A, The Rinput of an HVCX neuron was monitored with current pulses (−0.3 nA, 200 ms interpulse interval, 50 ms pulse duration). Immediately after Uva stimulation, the Rinput decreased. The trace is the average change in membrane potential over 10 trials. Inset, Comparison of the change in voltage to injected current before (black line) or after (gray line) Uva stimulation. The numbers indicate which current pulse is illustrated. B, Change in Rinput for all HVC projection neurons tested. Each value is the percentage Rinput of the average (over 8 pulses) pre-Uva stimulation. Gray circles, HVCX neurons (n = 4); diamonds, HVCRA neurons (n = 3). Compared with the mean Rinput before Uva stimulation, Rinput in HVCX neurons was marginally different only immediately after Uva stimulation (first current pulse only, repeated-measures ANOVA, least significant difference post hoc, p = 0.055). Rinput of HVCRA neurons was not significantly different from the mean pre-Uva stimulation Rinput (repeated-measures ANOVA, p > 0.05).
Uva influence on NIf activity
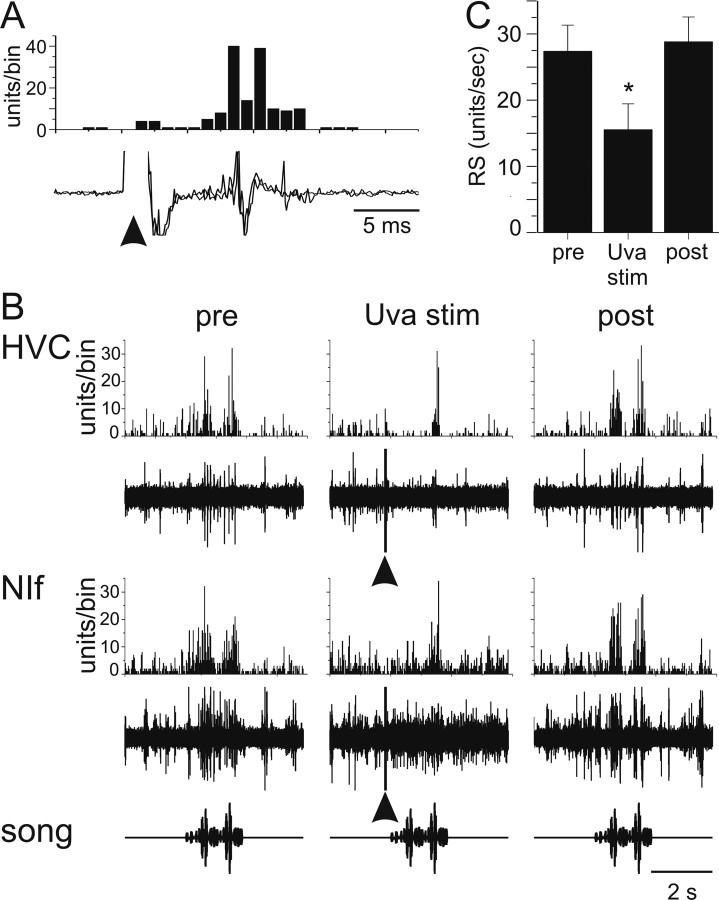
To explore the extent to which Uva might affect BOS-evoked auditory responses in HVC indirectly, we stimulated Uva while recording simultaneously from the ipsilateral NIf (n = 10 NIf recording sites in 2 birds). As we observed for HVC, low-frequency (1 Hz) Uva stimulation excited NIf neurons (Fig. 13A), and the latency of the evoked responses was similar or longer than the latency of synaptic responses recorded in HVC after Uva stimulation (latency of 9 ± 0 ms; n = 2). To determine whether high-frequency stimulation in Uva might suppress HVC auditory activity by removal of BOS-evoked excitatory drive from NIf, we delivered high-frequency stimulus trains to Uva (50 ms train at 400 Hz) while recording extracellularly from NIf neurons immediately (200 ms) before BOS playback (Fig. 13B,C). High-frequency Uva stimulation was accompanied by a significant decrease in the BOS-evoked excitatory response recorded in NIf (Fig. 13: pre, 27.4 ± 4.0; Uva stim, 15.5 ± 3.9; post, 28.8 ± 3.8; repeated-measures ANOVA, p < 0.05; n = 10 sites, 3 hemispheres in 2 birds). Furthermore, paired recordings in NIf and HVC revealed that high-frequency stimulation in Uva simultaneously suppressed auditory activity in both of these telencephalic song nuclei (Fig. 13B). Thus, the Uva-evoked suppression of auditory responses in HVC is attributable at least in part to removal of excitatory drive from NIf.
Figure 13.
Effect of Uva stimulation on NIf activity. A, Low-frequency (1 Hz) Uva stimulation (arrowhead; 25 μA) excited NIf neurons. Bottom, Raw trace of two examples of low-frequency Uva stimulation on ipsilateral NIf activity. Top, Histogram of the delay to onset of multiunit NIf activity relative to Uva stimulation. The response is the result of 20 low-frequency Uva stimulations. Bin size, 1 ms. B, High-frequency Uva stimulation reduces BOS-evoked auditory activity in both HVC and NIf. Multiunit activity was recorded simultaneously in HVC and NIf, both ipsilateral to Uva. Bottom row, Oscillogram of BOS presentation. Fourth row, Raw response of multiunit NIf activity to a single playback of BOS. Third row, PSTH of NIf multiunit activity to 10 iterations of BOS. Second row, Simultaneous raw trace of the response of multiunit HVC activity to BOS presentation. Top row, PSTH for HVC multiunit activity to 10 iterations of BOS. Left column, HVC and NIf multiunit activity increase in response to playback of BOS before Uva stimulation. HVC RS, 15.4 units/s; NIf RS, 18.6 units/s. Middle column, HVC and NIf activity is reduced when Uva is stimulated (arrowheads; 30 μA, 50 ms train at 400 Hz, 200 ms before BOS onset). HVC RS, 1.4 units/s; NIf RS, 7.1 units/s. The stimulus artifact was not removed from the raw trace. Right column, HVC response to playback of BOS recovered when Uva was not stimulated. HVC RS, 12.5 units/s; NIf RS, 14.76 units/s. Bin size, 25 ms. C, Summary of the effect of Uva stimulation on BOS-evoked multiunit auditory activity in NIf. Error bars represent SEM. *p < 0.05, NIf activity with Uva stimulation is significantly less (repeated-measures ANOVA) than pre- or post-Uva stimulation. Pre- and post-Uva stimulation HVC responses are not different (repeated-measures ANOVA, p = 0.515).
Discussion
We found that Uva neurons respond to auditory stimuli, including BOS, and identified the isthmic auditory nucleus LLV as a likely source of this auditory activity. We also found that low-frequency electrical stimulation in Uva excited all major HVC neuron types and evoked excitatory multiunit activity in NIf, revealing a remarkably direct route from the auditory brainstem to telencephalic nuclei important to learned vocal control. Despite the robust auditory activity of Uva and its excitatory influence on HVC, inactivating Uva exerted little effect on BOS-evoked HVC responses in anesthetized birds. However, high-frequency stimulation in Uva coordinately suppressed BOS-evoked auditory activity in both HVC and NIf, the major auditory afferent of HVC (Cardin and Schmidt, 2004a; Coleman and Mooney, 2004). In vivo intracellular recordings revealed that these suppressive effects could be accompanied by decreased input resistance in HVCX neurons, suggesting that high-frequency activity in Uva can inhibit HVC directly, as well as withdraw auditory-evoked excitatory drive from NIf to HVC. These results support a model wherein changes in Uva activity levels gate auditory input to telencephalic sensorimotor regions important to singing and song learning.
A major finding here is that Uva neurons respond to auditory stimuli, including the BOS. A previous study failed to detect auditory responses in Uva but relied on a different anesthetic regimen and used simple auditory stimuli (Wild, 1994). Most auditory responses in Uva were nonselective, contrasting with the high level of BOS selectivity manifested in HVC and NIf (Janata and Margoliash, 1999; Cardin and Schmidt, 2004a; Coleman and Mooney, 2004). Together with these previous studies, the present results suggest that both nonselective and highly selective auditory pathways converge in HVC. Furthermore, the nonselective auditory pathway to HVC appears to involve a direct projection from LLV to Uva, in contrast to the more circuitous route (through the auditory thalamus, primary and secondary auditory telencephalon, and NIf) that ultimately provides BOS-selective information to HVC (Fig. 1B) (Vates et al., 1996; Gentner and Margoliash, 2003; Theunissen et al., 2004). Although previous studies in pigeons showed that dorsolateral prefrontal cortex (DLPc), the equivalent of Uva in non-songbirds, exhibits auditory activity, the source of its auditory drive remains unknown (Korzeniewska and Güntürkün, 1990). In songbirds, a direct and nonselective auditory pathway from LLV through Uva to HVC could be well suited to relaying auditory feedback to sensorimotor areas important to learned vocal control or for gating auditory activity in the song system in a context-dependent manner.
The present finding that Uva can exhibit auditory responses to birdsong, in combination with present and previous results showing that Uva can respond to visual and somatosensory stimulation (Wild, 1994), suggests that Uva has the potential to convey polysensory information to its postsynaptic targets, including HVC and NIf. Indeed, auditory and visual responses have been detected in HVC (Katz and Gurney, 1981; Bischof and Engelage, 1985), whereas both somatosensory and auditory responses have been detected in NIf (Wild, 1994; Janata and Margoliash, 1999). An important goal of future studies will be to determine whether individual Uva neurons respond to multisensory input and the degree to which this sensory information is segregated between NIf and HVC.
Although Uva displays robust auditory activity and excites HVC neurons, it is surprising that pharmacologically inactivating Uva did not alter the strength or pattern of the BOS-evoked auditory response in HVC in urethane-anesthetized birds. In contrast, previous studies showed that inactivating NIf, the penultimate node in the other auditory pathway to HVC, can silence much or all of the spontaneous and BOS-evoked activity of HVC (Cardin and Schmidt, 2004a; Coleman and Mooney, 2004; Cardin et al., 2005). One possible explanation is that urethane anesthesia reduces activity in Uva below a threshold at which it influences the auditory responsiveness of HVC. Another possibility is that Uva exerts a more modulatory effect on HVC activity, an idea that gains some support from the finding that Uva inactivation in some cases altered the shape of the BOS-evoked response and the distribution of firing rates of HVC neurons, without altering the BOS-evoked response strength recorded in HVC.
Although the neurotransmitters and receptors at Uva–HVC synapses are unknown, the short-latency PSPs evoked in HVC neurons by electrical stimulation of Uva, which were capable of driving action potentials in all HVC neuron types, are suggestive of fast synaptic transmission. Candidates for driving such fast excitation are ionotropic glutamate receptors, which have been detected on HVC neurons (Mooney and Prather, 2005). Although the major goal of the present study was to examine the influence of Uva on HVC, we also found evidence that Uva excites NIf neurons. This excitatory influence stands in stark contrast to the suppressive effects of high-frequency stimulation in Uva on the auditory responses of HVC. The mechanisms that dictate how the functional influence of Uva on HVC changes with stimulus frequency are not entirely clear, although our results provide some useful clues. Part of the mechanism appears to involve removal of BOS-evoked excitatory drive from NIf to HVC, because high-frequency stimulation in Uva simultaneously suppressed auditory-evoked activity in HVC and NIf. Another part of the mechanism, at least for HVCX neurons, appears to involve augmented inhibitory drive recruited by high-frequency Uva stimulation, manifested as a decreased input resistance in HVCX cells concomitant with suppression of their BOS-evoked activity. This inhibition may arise through local interneurons, which we found are excited by Uva and which are known to make inhibitory synapses on HVCX cells (Rosen and Mooney, 2003, 2006; Mooney and Prather, 2005). Indeed, some inhibition onto HVCX cells involves metabotropic glutamate receptors, which trigger inhibitory currents lasting several hundred milliseconds (Dutar et al., 1998, 2000; Schmidt and Perkel, 1998) that are an important component of BOS-evoked hyperpolarizing responses in HVCX cells (Rosen and Mooney, 2003; Mooney and Prather, 2005). Another possibility is that high-frequency stimulation of Uva axons triggers release of inhibitory neuropeptides in HVC. Notably, the dorsomedial “horn” of Uva is reported to contain neurons immunopositive for corticotrophin-releasing factor (CRF), and cell bodies in the DLPc of chicks and quail are immunopositive for CRF and calcitonin gene-related peptide (Lanuza et al., 2000; Richard et al., 2004). A scenario that cannot be totally excluded is that electrical stimulation in Uva antidromically recruits a common inhibitory input to Uva, NIf, and HVC, but a common input to these three nuclei has not been described. One important goal of future studies will be to further dissect the mechanism and sites whereby Uva exerts its suppressive influence on HVC and NIf auditory activity. A second important goal will be to examine whether natural variations in Uva firing patterns exert differential effects on HVC activity similar to those seen here using different stimulation frequencies.
A previous study showed that electrical or chemical stimulation of basal forebrain (BF) acts via cholinergic receptors in HVC to produce a long-lasting decrease in HVC auditory responses (Shea and Margoliash, 2003). Suppression of HVC auditory responses by BF stimulation is much longer lasting (∼10 min) than suppression after high-frequency Uva stimulation (∼2 s) (Figs. 9, 10), and Uva neurons are not cholinergic (Akutagawa and Konishi, 2005), suggesting two distinct gating mechanisms. In addition to cholinergic gating of HVC auditory responses, adrenergic agonists and antagonists comodulate auditory responses in HVC and NIf (Cardin and Schmidt, 2004b). However, Uva neurons are not adrenergic, and the source of noradrenaline that gates auditory responses in NIf and HVC is unclear (Mello et al., 1998; Schmidt, 1998). Together, these results indicate that there are multiple mechanisms and pathways by which auditory responses in HVC can be gated (Cardin and Schmidt, 2004b).
Functionally, the ability of Uva influence HVC and NIf activity could serve both sensory and motor roles. First, Uva can respond to auditory, tactile, and visual cues, a capacity that enables it to integrate sensory information across modalities and may facilitate the assessment of environmental cues as well as self-performance. Second, Uva receives cholinergic input from the medial habenula (Akutagawa and Konishi, 2005), a structure implicated in attention (Lecourtier and Kelly, 2005) and sleep/wake cycles in mammals (Haun et al., 1992; Valjakka et al., 1998); a similar function in birds may enable Uva to regulate auditory activity in HVC and NIf in a state-dependent manner. Third, the influence of Uva on HVC and NIf neuronal activity operates on a fast timescale, consistent with recent evidence showing that auditory responses in these nuclei can be gated synchronously by arousal and attention on a timescale of milliseconds to seconds (Nick and Konishi, 2001; Cardin and Schmidt, 2003). Such rapid gating may be especially important in the highly dynamic social interactions that typify the colonial zebra finch (Immelmann, 1965). Finally, the capacity for high-frequency Uva discharge to suppress auditory activity in HVC also could play a role in singing. Chronic multiunit recordings in singing birds revealed that Uva neurons fire superbursts at the end of the song motif (Williams and Vicario, 1993), after which both spontaneous and auditory-evoked activity in HVC is suppressed for several seconds (McCasland and Konishi, 1981). Assuming individual Uva neurons fire at high frequencies during superbursts, our results suggest a plausible mechanism for this suppressive effect. Moreover, frequency-dependent changes in functional connectivity between Uva and HVC along with the polysensory nature of Uva may facilitate state- and context-dependent gating of auditory information to the song system, a process potentially important to song learning and perception.
Footnotes
This work was supported by National Institute on Deafness and Other Communication Disorders Grant 02524 (R.M.) and a grant from the Royal Society of New Zealand, Marsden Contract UOA306 (J.M.W.). We thank David Kloetzer for excellent technical assistance, Dr. D. Thomson for help with data and statistical analyses, Dr. T. Roberts for the image in Figure 5B, and Dr. S. Shea for constructive comments on previous versions of this manuscript.
References
- Aguilar JR, Castro-Alamancos MA. Spatiotemporal gating of sensory inputs in thalamus during quiescent and activated states. J Neurosci. 2005;25:10990–11002. doi: 10.1523/JNEUROSCI.3229-05.2005. [DOI] [PMC free article] [PubMed] [Google Scholar]
- Akutagawa E, Konishi M. Connections of thalamic modulatory centers to the vocal control system of the zebra finch. Proc Natl Acad Sci USA. 2005;102:14086–14091. doi: 10.1073/pnas.0506774102. [DOI] [PMC free article] [PubMed] [Google Scholar]
- Bischof HJ, Engelage J. Flash evoked responses in a song control nucleus of the zebra finch (Taeniopygia guttata castanotis) Brain Res. 1985;326:370–374. doi: 10.1016/0006-8993(85)90048-4. [DOI] [PubMed] [Google Scholar]
- Brenowitz EA. Altered perception of species-specific song by female birds after lesions of a forebrain nucleus. Science. 1991;251:303–305. doi: 10.1126/science.1987645. [DOI] [PubMed] [Google Scholar]
- Cardin JA, Schmidt MF. Song system auditory responses are stable and highly tuned during sedation, rapidly modulated and unselective during wakefulness, and suppressed by arousal. J Neurophysiol. 2003;90:2884–2899. doi: 10.1152/jn.00391.2003. [DOI] [PubMed] [Google Scholar]
- Cardin JA, Schmidt MF. Auditory responses in multiple sensorimotor song system nuclei are co-modulated by behavioral state. J Neurophysiol. 2004a;91:2148–2163. doi: 10.1152/jn.00918.2003. [DOI] [PubMed] [Google Scholar]
- Cardin JA, Schmidt MF. Noradrenergic inputs mediate state dependence of auditory responses in the avian song system. J Neurosci. 2004b;24:7745–7753. doi: 10.1523/JNEUROSCI.1951-04.2004. [DOI] [PMC free article] [PubMed] [Google Scholar]
- Cardin JA, Raksin JN, Schmidt MF. Sensorimotor nucleus NIf is necessary for auditory processing but not vocal motor output in the avian song system. J Neurophysiol. 2005;93:2157–2166. doi: 10.1152/jn.01001.2004. [DOI] [PubMed] [Google Scholar]
- Casagrande VA, Guillery RW, Sherman SW. Amsterdam: Elsevier; 2005. Cortical function: a view from the thalamus. [Google Scholar]
- Castro-Alamancos MA. Dynamics of sensory thalamocortical synaptic networks during information processing states. Prog Neurobiol. 2004;74:213–247. doi: 10.1016/j.pneurobio.2004.09.002. [DOI] [PubMed] [Google Scholar]
- Castro-Alamancos MA, Oldford E. Cortical sensory suppression during arousal is due to the activity-dependent depression of thalamocortical synapses. J Physiol (Lond) 2002;541:319–331. doi: 10.1113/jphysiol.2002.016857. [DOI] [PMC free article] [PubMed] [Google Scholar]
- Coleman MJ, Mooney R. Synaptic transformations underlying highly selective auditory representations of learned birdsong. J Neurosci. 2004;24:7251–7265. doi: 10.1523/JNEUROSCI.0947-04.2004. [DOI] [PMC free article] [PubMed] [Google Scholar]
- Coleman MJ, Mooney R. The thalamic nucleus uvaeformis modulates auditory responses in HVC. Soc Neurosci Abstr. 2005;31:78–17. [Google Scholar]
- Coleman MJ, Vu ET. Recovery of impaired songs following unilateral but not bilateral lesions of nucleus uvaeformis of adult zebra finches. J Neurobiol. 2005;63:70–89. doi: 10.1002/neu.20122. [DOI] [PubMed] [Google Scholar]
- Del Negro C, Gahr M, Leboucher G, Kreutzer M. The selectivity of sexual responses to song displays: effects of partial chemical lesion of the HVC in female canaries. Behav Brain Res. 1998;96:151–159. doi: 10.1016/s0166-4328(98)00009-6. [DOI] [PubMed] [Google Scholar]
- Dutar P, Vu HM, Perkel DJ. Multiple cell types distinguished by physiological, pharmacological, and anatomic properties in nucleus HVc of the adult zebra finch. J Neurophysiol. 1998;80:1828–1838. doi: 10.1152/jn.1998.80.4.1828. [DOI] [PubMed] [Google Scholar]
- Dutar P, Petrozzino JJ, Vu HM, Schmidt MF, Perkel DJ. Slow synaptic inhibition mediated by metabotropic glutamate receptor activation of GIRK channels. J Neurophysiol. 2000;84:2284–2290. doi: 10.1152/jn.2000.84.5.2284. [DOI] [PubMed] [Google Scholar]
- Gentner TQ, Margoliash D. Neuronal populations and single cells representing learned auditory objects. Nature. 2003;424:669–674. doi: 10.1038/nature01731. [DOI] [PMC free article] [PubMed] [Google Scholar]
- Gentner TQ, Hulse SH, Bentley GE, Ball GF. Individual vocal recognition and the effect of partial lesions to HVc on discrimination, learning, and categorization of conspecific song in adult songbirds. J Neurobiol. 2000;42:117–133. doi: 10.1002/(sici)1097-4695(200001)42:1<117::aid-neu11>3.0.co;2-m. [DOI] [PubMed] [Google Scholar]
- Green D, Swets J. New York: Wiley; 1966. Signal detection theory and psychophysics. [Google Scholar]
- Hahnloser RH, Kozhevnikov AA, Fee MS. An ultra-sparse code underlies the generation of neural sequences in a songbird. Nature. 2002;419:65–70. doi: 10.1038/nature00974. [DOI] [PubMed] [Google Scholar]
- Haun F, Eckenrode TC, Murray M. Habenula and thalamus cell transplants restore normal sleep behaviors disrupted by denervation of the interpeduncular nucleus. J Neurosci. 1992;12:3282–3290. doi: 10.1523/JNEUROSCI.12-08-03282.1992. [DOI] [PMC free article] [PubMed] [Google Scholar]
- Immelmann K. Sydney: Angus and Robertson; 1965. Australian finches. [Google Scholar]
- Janata P, Margoliash D. Gradual emergence of song selectivity in sensorimotor structures of the male zebra finch song system. J Neurosci. 1999;19:5108–5118. doi: 10.1523/JNEUROSCI.19-12-05108.1999. [DOI] [PMC free article] [PubMed] [Google Scholar]
- Katz LC, Gurney ME. Auditory responses in the zebra finch's motor system for song. Brain Res. 1981;221:192–197. doi: 10.1016/0006-8993(81)91073-8. [DOI] [PubMed] [Google Scholar]
- Konishi M. Effects of deafening on song development in Am robins and black-headed grosbeaks. Z Tierpsychol. 1965a;22:584–599. [PubMed] [Google Scholar]
- Konishi M. The role of auditory feedback in the control of vocalization in the white-crowned sparrow. Z Tierpsychol. 1965b;22:770–783. [PubMed] [Google Scholar]
- Korzeniewska E, Güntürkün O. Sensory properties and afferents of the N. dorsolateralis posterior thalami of the pigeon. J Comp Neurol. 1990;292:457–479. doi: 10.1002/cne.902920311. [DOI] [PubMed] [Google Scholar]
- Kubota M, Taniguchi I. Electrophysiological characteristics of classes of neuron in the HVc of the zebra finch. J Neurophysiol. 1998;80:914–923. doi: 10.1152/jn.1998.80.2.914. [DOI] [PubMed] [Google Scholar]
- Lanuza E, Davies DC, Landete JM, Novejarque A, Martinez-Garcia F. Distribution of CGRP-like immunoreactivity in the chick and quail brain. J Comp Neurol. 2000;421:515–532. doi: 10.1002/(sici)1096-9861(20000612)421:4<515::aid-cne4>3.0.co;2-6. [DOI] [PubMed] [Google Scholar]
- Lecourtier L, Kelly PH. Bilateral lesions of the habenula induce attentional disturbances in rats. Neuropsychopharmacology. 2005;30:484–496. doi: 10.1038/sj.npp.1300595. [DOI] [PubMed] [Google Scholar]
- McCasland JS, Konishi M. Interaction between auditory and motor activities in an avian song control nucleus. Proc Natl Acad Sci USA. 1981;78:7815–7819. doi: 10.1073/pnas.78.12.7815. [DOI] [PMC free article] [PubMed] [Google Scholar]
- Mello CV, Pinaud R, Ribeiro S. Noradrenergic system of the zebra finch brain: immunocytochemical study of dopamine-beta-hydroxylase. J Comp Neurol. 1998;400:207–228. [PubMed] [Google Scholar]
- Mooney R. Different subthreshold mechanisms underlie song selectivity in identified HVc neurons of the zebra finch. J Neurosci. 2000;20:5420–5436. doi: 10.1523/JNEUROSCI.20-14-05420.2000. [DOI] [PMC free article] [PubMed] [Google Scholar]
- Mooney R, Prather JF. The HVC microcircuit: the synaptic basis for interactions between song motor and vocal plasticity pathways. J Neurosci. 2005;25:1952–1964. doi: 10.1523/JNEUROSCI.3726-04.2005. [DOI] [PMC free article] [PubMed] [Google Scholar]
- Nick TA, Konishi M. Dynamic control of auditory activity during sleep: correlation between song response and EEG. Proc Natl Acad Sci USA. 2001;98:14012–14016. doi: 10.1073/pnas.251525298. [DOI] [PMC free article] [PubMed] [Google Scholar]
- Nick TA, Konishi M. Neural song preference during vocal learning in the zebra finch depends on age and state. J Neurobiol. 2005;62:231–242. doi: 10.1002/neu.20087. [DOI] [PubMed] [Google Scholar]
- Nottebohm F, Stokes TM, Leonard CM. Central control of song in the canary, Serinus canarius. J Comp Neurol. 1976;165:457–486. doi: 10.1002/cne.901650405. [DOI] [PubMed] [Google Scholar]
- Rauske PL, Shea SD, Margoliash D. State and neuronal class-dependent reconfiguration in the avian song system. J Neurophysiol. 2003;89:1688–1701. doi: 10.1152/jn.00655.2002. [DOI] [PubMed] [Google Scholar]
- Reinke H, Wild JM. Identification and connections of inspiratory premotor neurons in songbirds and budgerigar. J Comp Neurol. 1998;391:147–163. [PubMed] [Google Scholar]
- Richard S, Martinez-Garcia F, Lanuza E, Davies DC. Distribution of corticotropin-releasing factor-immunoreactive neurons in the central nervous system of the domestic chicken and Japanese quail. J Comp Neurol. 2004;469:559–580. doi: 10.1002/cne.11023. [DOI] [PubMed] [Google Scholar]
- Rose HJ, Metherate R. Auditory thalamocortical transmission is reliable and temporally precise. J Neurophysiol. 2005;94:2019–2030. doi: 10.1152/jn.00860.2004. [DOI] [PubMed] [Google Scholar]
- Rosen MJ, Mooney R. Intrinsic and extrinsic contributions to auditory selectivity in a song nucleus critical for vocal plasticity. J Neurosci. 2000;20:5437–5448. doi: 10.1523/JNEUROSCI.20-14-05437.2000. [DOI] [PMC free article] [PubMed] [Google Scholar]
- Rosen MJ, Mooney R. Inhibitory and excitatory mechanisms underlying auditory responses to learned vocalizations in the songbird nucleus HVC. Neuron. 2003;39:177–194. doi: 10.1016/s0896-6273(03)00357-x. [DOI] [PubMed] [Google Scholar]
- Rosen MJ, Mooney R. Synaptic interactions underlying song-selectivity in the avian nucleus HVC revealed by dual intracellular recordings. J Neurophysiol. 2006;95:1158–1175. doi: 10.1152/jn.00100.2005. [DOI] [PubMed] [Google Scholar]
- Schmidt MF. Modulation by social context sheds new light on mechanisms of vocal production. Neuron. 1998;21:645–647. doi: 10.1016/s0896-6273(00)80576-0. [DOI] [PubMed] [Google Scholar]
- Schmidt MF, Konishi M. Gating of auditory responses in the vocal control system of awake songbirds. Nat Neurosci. 1998;1:513–518. doi: 10.1038/2232. [DOI] [PubMed] [Google Scholar]
- Schmidt MF, Perkel DJ. Slow synaptic inhibition in nucleus HVc of the adult zebra finch. J Neurosci. 1998;18:895–904. doi: 10.1523/JNEUROSCI.18-03-00895.1998. [DOI] [PMC free article] [PubMed] [Google Scholar]
- Shea SD, Margoliash D. Basal forebrain cholinergic modulation of auditory activity in the zebra finch song system. Neuron. 2003;40:1213–1226. doi: 10.1016/s0896-6273(03)00723-2. [DOI] [PubMed] [Google Scholar]
- Solis MM, Doupe AJ. Anterior forebrain neurons develop selectivity by an intermediate stage of birdsong learning. J Neurosci. 1997;17:6447–6462. doi: 10.1523/JNEUROSCI.17-16-06447.1997. [DOI] [PMC free article] [PubMed] [Google Scholar]
- Stokes TM, Leonard CM, Nottebohm F. The telencephalon, diencephalon, and mesencephalon of the canary, Serinus canaria, in stereotaxic coordinates. J Comp Neurol. 1974;156:337–374. doi: 10.1002/cne.901560305. [DOI] [PubMed] [Google Scholar]
- Striedter GF, Vu ET. Bilateral feedback projections to the forebrain in the premotor network for singing in zebra finches. J Neurobiol. 1998;34:27–40. [PubMed] [Google Scholar]
- Theunissen FE, Amin N, Shaevitz SS, Woolley SM, Fremouw T, Hauber ME. Song selectivity in the song system and in the auditory forebrain. Ann NY Acad Sci. 2004;1016:222–245. doi: 10.1196/annals.1298.023. [DOI] [PubMed] [Google Scholar]
- Valjakka A, Vartiainen J, Tuomisto L, Tuomisto JT, Olkkonen H, Airaksinen MM. The fasciculus retroflexus controls the integrity of REM sleep by supporting the generation of hippocampal theta rhythm and rapid eye movements in rats. Brain Res Bull. 1998;47:171–184. doi: 10.1016/s0361-9230(98)00006-9. [DOI] [PubMed] [Google Scholar]
- Vates GE, Broome BM, Mello CV, Nottebohm F. Auditory pathways of caudal telencephalon and their relation to the song system of adult male zebra finches. J Comp Neurol. 1996;366:613–642. doi: 10.1002/(SICI)1096-9861(19960318)366:4<613::AID-CNE5>3.0.CO;2-7. [DOI] [PubMed] [Google Scholar]
- Wild JM. Visual and somatosensory inputs to the avian song system via nucleus uvaeformis (Uva) and a comparison with the projections of a similar thalamic nucleus in a nonsongbird, Columba livia. J Comp Neurol. 1994;349:512–535. doi: 10.1002/cne.903490403. [DOI] [PubMed] [Google Scholar]
- Williams H. Mulitple representations and auditory-motor interactions in the avian song system. Ann NY Acad Sci. 1989;563:148–164. [Google Scholar]
- Williams H, Vicario DS. Temporal patterning of song production: participation of nucleus uvaeformis of the thalamus. J Neurobiol. 1993;24:903–912. doi: 10.1002/neu.480240704. [DOI] [PubMed] [Google Scholar]


