

Abstract
Subplate (SP) neurons are important for the proper development of thalamocortical innervation. They are necessary for formation of ocular dominance and orientation columns in visual cortex. During the perinatal period, many SP neurons die. The surviving cohort forms interstitial cells in the white matter (WM) and a band of horizontally oriented cells below layer VI (layer VIb, layer VII, or subplate cells). Although the function of embryonic SP neurons has been well established, the functional roles of WM and postnatal SP cells are not known. We used a combination of anatomical, immunohistochemical, and electrophysiological techniques to explore the dendritic morphology, neurotransmitter phenotype, intrinsic electrophysiological, and synaptic input properties of these surviving cells in the rat visual cortex. The density of SP and WM cells significantly decreases during the first month of life. Both populations express neuronal markers and have extensive dendritic arborizations within the SP, WM, and to the overlying visual cortex. Some intrinsic electrophysiological properties of SP and WM cells are similar: each generates high-frequency slowly adapting trains of action potentials in response to a sustained depolarization. However, SP cells exhibit greater frequency-dependent action potential broadening than WM neurons. Both cell types receive predominantly AMPA/kainate receptor-mediated excitatory synaptic input that undergoes paired-pulse facilitation as well as NMDA receptor and GABAergic input. Synaptic inputs to these cells can also undergo long-term synaptic plasticity. Thus, surviving SP and WM cells are functional electrogenic neurons integrated within the postnatal visual cortical circuit.
Keywords: layer VII, white matter, electrophysiology, plasticity, cortex, subplate
Introduction
Embryonic subplate (SP) neurons are important for the development of proper synaptic connectivity in neocortex. Removal of SP neurons during embryonic development leads to aberrant thalamocortical connections (Ghosh et al., 1990; Ghosh and Shatz, 1994; Molnar et al., 1998). In the visual cortex, after SP ablation, ocular dominance and orientation columns do not develop correctly (Ghosh and Shatz, 1992; Lein et al., 1999; Grossberg and Seitz, 2003; Kanold et al., 2003; Kanold, 2004).
During maturation, layer IV neurons receive convergent synaptic input from SP and thalamic axons (Kanold et al., 2003; Kanold, 2004). A competitive process weakens the disynaptic thalamic–SP–layer IV circuit and strengthens thalamic–layer IV monosynaptic connections, leading to elimination of the SP–layer IV pathway with formation of the mature thalamocortical pathway (Friauf et al., 1990; Kanold et al., 2003). After refinement of the synaptic inputs to layer IV, many SP neurons undergo programmed cell death during late embryonic and early postnatal development (Al Ghoul and Miller, 1989; Naegele et al., 1991; Ghosh and Shatz, 1993; Allendoerfer and Shatz, 1994; Valverde et al., 1995; DeFreitas et al., 2001; McQuillen et al., 2002). The surviving cells are situated interstitially in the white matter (WM) [WM neurons (Valverde and Facal-Valverde, 1988; Chun and Shatz, 1989; Shering and Lowenstein, 1994)] and as a narrow band just below layer VI [SP neurons, layer VIb, layer VII, subgriseal neurons (Reep and Goodwin, 1988; Vandevelde et al., 1996; Clancy and Cauller, 1999; Reep, 2000)].
Embryonic SP neurons may function exclusively during a restricted phase of development, contributing only to refinement of the thalamocortical innervation (Allendoerfer and Shatz, 1994; Kanold, 2004). Alternatively, because some SP neurons (∼20%) survive, they may perform other functions in the postnatal neocortex, becoming integrated into the microcircuitry of the six major cortical laminase. Data in support of this alternative include the following: fluorescent tracers applied to layer I in juvenile and adult rats retrogradely label somata of SP and WM cells (Clancy and Cauller, 1999); SP neurons that survive programmed cell death do not show evidence of atrophy of their dendritic trees or nuclear shrinkage (Robertson et al., 2000); and SP cells receive functional synaptic input during the first days [postnatal day 0 (P0) to P3] of postnatal life in the rat (Hanganu et al., 2001, 2002). However, the fate and functional properties of these cells beyond the immediate perinatal period are unknown.
We determined the following: the declining density of SP and WM cells stabilizes by P30; both smooth and spiny neurons survive in the SP with their dendrites oriented along the WM border and toward the pial surface; both cell types generate high-frequency slowly adapting trains of action potentials (APs) with some spike broadening over the course of an action potential train; both groups of neurons receive excitatory glutamatergic synaptic input, primarily onto AMPA/kainate receptors, as well as GABAA and NMDA receptor (NMDAR)-mediated input; and the synaptic inputs to SP and WM neurons undergo short- and long-term plasticity. Thus, surviving SP and WM cells are functional neuronal elements that become integrated into the postnatal neocortical network.
Materials and Methods
General methods
All methods were performed according to guidelines by the Institutional Animal Care and Use Committees of the University of Alabama at Birmingham and Baylor College of Medicine. P10–P20 Sprague Dawley rats were deeply anesthetized with sodium pentobarbital (35 mg/kg) and killed with a guillotine. The brain was rapidly removed and chilled in artificial CSF (aCSF) containing 124 mm NaCl, 2 mm KCl, 2 mm MgSO4, 2 mm CaCl2, 1.25 mm KH2PO4, 26 mm NaHCO3, and 10 mm dextrose, and saturated with 95% O2/5% CO2 to obtain a final pH of 7.4. The hemispheres were divided, the frontal part of the brain was removed to the level of the central sulcus, and 300 μm coronal slices of the visual cortex were prepared using a Vibratome 1000 (Technical Products International, St. Louis, MO). Slices were incubated at 33°C for 30 min in a holding chamber using a heated water bath (Fisher Scientific, Pittsburgh, PA) and allowed to reach room temperature throughout the day. After incubation for at least 1 h, slices were transferred to a submerged recording chamber (Warner Instruments, Hamden, CT) and superfused continuously at 1.5 ml/min with oxygenated aCSF at room temperature (∼24°C). An upright microscope (Axioskope FS1; Zeiss, Oberkochen, Germany) equipped with an Achroplan 40× 0.8 numerical aperture water immersion lens and differential interference contrast video microscopy was used to view neurons in the slices.
Glass micropipettes [8250 glass (1.5 outer diameter, 0.86 inner diameter); A-M Systems, Carlsborg, WA] were pulled in a vertical puller (PP-830; Narishige, Tokyo, Japan) to an open tip resistance of 3.5–6 MΩ and filled with the following (in mm): 125 K-gluconate, 10 HEPES, 1 NaCl, 2 Mg-ATP, 0.2 Na-GTP, 0.2 EGTA, and 10 KCL, pH adjusted to 7.4 by KOH. Osmolarity was adjusted to 280–290 mOsm using a Wescor (Logan, UT) 5500 vapor pressure osmometer. Sometimes 0.5% biocytin (Sigma, St. Louis, MO) was added to this solution to identify recorded cells and confirm their position. Cells were filled with biocytin by passive diffusion during the course of an experiment. Slices were transferred to chilled 4% paraformaldehyde after recording and fixed overnight at 4°C.
Because experiments were only performed in postnatal and not embryonic SP, any mention of SP from this point on indicates the postnatal variety unless indicated otherwise. For all experiments, the SP region was established as the most immediate band of cells above the WM and below layer VI. These cells have a horizontal organization, which is distinct from the more columnar organization in layer VI. A clear band of axons could also be observed above the SP in live and fixed tissue. Cells that were between the fibers of the WM proper were classified as WM cells. When a cell was close to the interface between SP and WM, its identification was based on the location of neighboring neurons. Only when the cell was clearly below the band formed by SP cells was it classified as a WM cell.
Histology and immunohistochemistry
Biocytin processing.
After overnight fixation, sections were incubated in an avidin/biotin/HRP complex overnight at 4°C with 0.1% Triton X-100 (Vector Elite; Vector Laboratories, Burlingame, CA) and developed using DAB (Vector Laboratories). The tissue was counterstained with cresyl violet and coverslipped with DPX (EM Sciences, Ft. Washington, PA).
Somatodendritic analysis.
To examine the somatodendritic phenotype and morphology of the dendritic tree, biocytin-filled cells were drawn at 500× using camera lucida. Cells were classified as spiny if spines were readily observed on all dendritic processes by examination at 1250×. A series of concentric rings 25 μm apart was superimposed on the drawing and centered at the cell body (Sholl, 1953). The rings were divided in four quadrants labeled clockwise to determine the location and orientation of the dendritic processes. Quadrant 1 was placed parallel to the normal vector from the pia to the WM. Dendritic crossings were noted by distance from the soma and the quadrant in which they occurred and were only noted when a neurite crossed or touched one of the rings. The orientation of the dendritic tree in relation to the plane of the slice (horizontal or vertical) was determined by calculating the ratio of crossings of quadrants 1 and 3 (vertical orientation) versus 2 and 4 (horizontal orientation).
Immunohistochemistry.
To test whether there was a developmental decrease in SP and WM cells, the age span examined was expanded. Sprague Dawley rats ages P2, P9, P16, P23, and P30 were anesthetized with sodium pentobarbital (100 mg/kg) and then perfused with 4% paraformaldehyde and 0.3% glutaraldehyde in a phosphate-buffered artificial saline solution at pH 7.4 for preparation of subsequent immunohistochemical analysis of their visual cortex with primary antisera for specific neurochemicals. After perfusion, the brain was removed, and the primary visual cortex was blocked and sectioned on a vibratome at 100 μm. Primary antibodies were against neuronal-specific nuclear protein (NeuN) (mouse, 1:500; Millipore, Temecula, CA) and microtubule associated protein-2 (MAP-2) (mouse, 1:1000; Millipore). After staining with the aforementioned antibodies, secondary antibodies were used with a chromagen to visualize the antigenic molecules within the cortical sections with conventional light microscopy.
For the development analysis, the distribution and number of neurons and their developmental gradients were quantified by setting an immunopositivity threshold for detecting cells in material. Data were analyzed with an Olympus Optical (Melville, NY) IX70 microscope and IP Lab software (Scanalytics, Fairfax, VA). The complete area of SP or WM was outlined in each slice, and the number of positive cells was counted manually through the thickness of the slice. Determination of whether a cell was in the SP or WM was done as described above. A marker was placed electronically in each soma to prevent double counting. The area of the SP or WM section was multiplied by the section thickness (100 μm) to calculate tissue volume, and the density of each particular immunopositive cell type was calculated and expressed as positive cells per cubic millimeter. MAP-2 could not be used to label SP cells because the density of processes is too high and does not allow reliable counting.
Electrophysiological recordings
All records were collected with either an Axopatch-1B or a MultiClamp 700 amplifier (both from Molecular Devices, Union City, CA), amplified, filtered on-line at 10 kHz with a four-pole Bessel low-pass filter, and digitized at 20 kHz with a Digidata 1200 and Clampex 8 or 9 software (Molecular Devices) unless otherwise noted. Cells that were significantly depolarized (above −50 mV) or with high access resistance (>40 MΩ or >20% the value of the input resistance for that cell) were discarded immediately. In all cases, high access resistance correlated with a “blunting” of the APs and was readily observable.
Spike frequency and intrinsic physiology experiments
SP and WM cells were recorded in whole-cell configuration using the visualized patch technique. Cells were patched in voltage clamp and switched to current clamp, and their membrane potential was noted. A 10–20 mV hyperpolarizing pulse in voltage clamp was sometimes used to calculate the input resistance of the cell. To study AP properties, a single 5–10 ms, 800–900 pA step depolarization was applied to the cell to elicit a spike. This was repeated at 0.1 Hz for 10 trials. The spike amplitude, threshold for spike initiation, and half-width at half-height were recorded. AP amplitude was measured from the resting membrane potential (Em) to the peak of the AP. The threshold for spike initiation was obtained at the intersection of two linear fits over the rising phase of the AP and the depolarizing phase.
For the evaluation of spike frequency adaptation properties, 500 ms step depolarization pulses (20–200 pA in 20 pA increments) were used in pseudorandom order to elicit a train of APs. Each depolarizing pulse was applied at 0.1 Hz for 10 trials each for a total of 100 trials. Overlying pyramidal neurons (layer II/III) were also recorded as controls in these experiments. In most cases, these neurons were recorded in the same slices in which either a WM or SP cell was recorded. Spike train traces were sorted using custom Visual Basic routines in Excel (Microsoft, Redmond, WA) according to the depolarization level (i.e., 20 pA, 150 pA). The time of peak of each AP in a train was measured using a threshold-crossing-based algorithm in either Origin (OriginLab, Northampton, MA) or Clampfit 9 (Molecular Devices). The instantaneous frequency for each AP was calculated for each interval in the train. To compare across groups, each instantaneous firing frequency at a particular depolarization level in a cell was averaged and then normalized to the highest average frequency for that cell (usually a point in the 200 pA depolarization). Spike broadening was also examined in trains of APs using Clampfit 9. The half-width for each AP at each depolarization level was calculated and normalized based on the first AP for that depolarization.
Synaptic physiology and pharmacology
SP and WM cells were recorded in whole-cell configuration using the visualized patch technique. Cells were patched in voltage-clamp and held at −70 mV. In some cases, experiments were also done by stepping the cell to −50 or +30 mV during the trial. Monosynaptic postsynaptic currents (PSCs) were elicited by constant-current square-wave pulses of 20–300 μA in amplitude and 50 μs in duration delivered with a concentric bipolar electrode (CBARC75; Frederick Haer Company, Bowdoinham, ME) positioned offset from the cell within the fibers of the WM or the SP region. The stimulating electrode was positioned to elicit the maximal evoked synaptic response by trying up to five to eight positions. Of course, it was not possible to be absolutely certain that the most optimal stimulating electrode position was selected because this would have required many placements with possible resultant tissue damage. However, because we were able to find a stimulation site for most of the cells in which the evoked postsynaptic potential (PSP) reached spiking threshold, it is likely that the values we derived for the half threshold PSP and the PSC amplitude at threshold are reasonable in most cases. For a series of control experiments, layer II/III pyramidal cells were recorded. The monosynaptic nature of inputs to SP or to WM cells in response to “off beam” stimulation of afferents within the adjacent SP or WM or of layer II/III pyramidal cells in response to “on beam” stimulation of afferents in layer 4 was verified by the short (<5 ms) and regular (±0.5 ms) synaptic delay of the responses. The stimulating electrode was moved closer or farther from the cell until a reliable synaptic response (consistent peak amplitude) was obtained. The differences in electrode positioning does not allow for reliable comparisons of absolute size of PSCs between experiments. In some cases, a reliable synaptic response could not be obtained, and a new cell was patched. This was an issue mostly with WM cells but not for SP cells. Stimulation from the overlying neocortex was attempted in several cases, but it usually showed either only antidromic spikes or polysynaptic responses. A qualitative input–output curve was determined for the evoked PSPs in current-clamp mode for each neuron studied in this manner. The stimulation intensity that yielded a PSP with a peak amplitude of ∼50% of that required for spike threshold was used for most of the subsequent recording, including pharmacological analysis of the synaptic responses (see below) to standardize across cells. Quantitative input–output curves were recorded for a subset of cells in current clamp. The PSC amplitude at threshold evoked was calculated by increasing the stimulus intensity while recording in current-clamp mode until a reliable spike was generated. The stimulus intensity was then lowered to the level that was just below that required to trigger a spike in current-clamp mode, and the recording condition was then switched to voltage-clamp mode in which the evoked PSC was recorded for 10 trials. The evoked PSC at the stimulation intensity that was just below that required to elicit spiking in current-clamp mode was then noted for each cell and compared between groups. A 10–20 mV hyperpolarizing pulse was used to monitor input and access resistance. Cells were discarded if the holding current increased rapidly or exceeded −150 pA.
Bath application of 20 μm 6-cyano-7-nitroquinoxaline-2,3-dione (CNQX), 50 μm d-2-amino-5-phosphonovaleric acid (APV), and 10 μm bicuculline methiodide (all from Sigma) was done sequentially to block AMPA/kainate, NMDA, and GABAA receptors, respectively. Each drug was applied for at least 2 min after reaching the slice chamber and before recording responses. In most cases, the application order was as described above to prevent hyperexcitability of the slice after bicuculline application. We also altered the drug application order in some cases to better isolate each synaptic component by avoiding any order effects. For data analysis, the control was defined as either the drug or control period before application of either bicuculline, APV, or CNQX. For example, in some cases, the drug application protocol was control solution (aCSF) followed by bicuculline, whereas in others it was CNQX/APV followed by CNQX/APV/bicuculline, with the bicuculline effect taken as the difference between the APV/CNQX response and the APV/CNQX/bicuculline response, and so on. In a subset of experiments, putative NMDA receptor-mediated synaptic currents were evaluated by decreasing [MgSO4] to 1 mm and increasing [CaCl2] to 3 mm in the aCSF with CNQX and bicuculline added and evoking synaptic responses while holding the Em of the cell at depolarized levels (+30 mV). These currents were compared with those during bath application of d-APV. For all drug applications, the effect was observed within 20 s of the drug reaching the slice chamber. At least 10–20 trials of synaptic stimuli at 0.1 Hz were delivered before and after each drug condition.
The PSC peak amplitudes were measured in Clampfit by the difference between a window over the baseline after the stimulus artifact and before the onset of the PSC and a second window around the PSC. The amplitude was calculated using a smoothing window using the average of seven points around the peak (the peak point and three points on each side). At 20 kHz, the smoothing window was 0.3 ms. Significant differences were determined using a paired t test. Data were collected as described before, amplified 10–20 times, low-pass filtered on-line at 4 kHz, and digitized at 20 kHz.
Short- and long-term synaptic plasticity
Short-term plasticity was examined by delivering pseudorandomized paired extracellular stimuli to fibers in the WM or SP regions at 0.2 Hz with 12.5–200 ms interstimulus intervals (ISIs). Ten to 20 trials of each ISI were collected. Each trial was sorted using custom routines in Excel based on the ISI delivered. To measure the amplitude of each PSC, a baseline window was located right before the onset of each PSC in the pair, and the peak amplitude was calculated using a 0.3 ms smoothing window as described before. The paired-pulse ratio (PPR) was calculated for each ISI by dividing the average peak amplitude of the second PSC over the first. Not every cell recorded received all ISI pulses. The PPR for each ISI was classified as showing significant paired-pulse facilitation (PPF) or depression (PPD) based on the average PPR (facilitation above 1.0; depression below 1.0) and whether it was significantly different from the calculated baseline variability of the PPR expected for a PSC at that particular ISI. This baseline PPR was calculated from the first PSC in the pair in trial n + 1 divided by the first PSC in trial n (equal to a 5 s ISI).
Long-term plasticity was examined using either a low-frequency conditioning protocol that consisted of extracellular stimulation of afferents at 1 Hz for 15 min (900 trials) or a pairing protocol that consisted of 100 ms direct depolarization of the neuron that elicited three to six spikes paired with a synaptic stimulus10 ms after the start of the depolarizing pulse (60 pairings over 10 min at 0.1 Hz). In both cases, the conditioning protocol was applied in current-clamp mode. The baseline and postconditioning periods were recorded in voltage-clamp mode, at a holding potential of −70 mV. Pre-pairing control data collection began when a stable baseline was observed after acquiring whole-cell configuration (usually after 5–10 min). The baseline was recorded for 10–15 min before starting the conditioning protocol and at least 30 min after conditioning. Biocytin was not included in the pipette in these experiments. Cells were rejected when obvious drift in the current was observed or when the access resistance changed by >20%.
Trials were normalized to the 10 min of pre-conditioning baseline control period with the average of the PSC peak amplitudes assigned a value of 1.0; during the 1 Hz conditioning period in current clamp, the first trial PSP peak amplitude was assigned a value of 1.0; and for the postconditioning period in voltage clamp, the PSC peak amplitude values were normalized to the average of the PSC peak amplitudes during the pre-conditioning control period. The values recorded during the last 10 min of the post-conditioning period were averaged into a single score for each cell and compared with pre-conditioning values (10 min before induction) to compute the amount of potentiation or depression. Significance relative to baseline was tested with paired t test. For all statistical analyses, differences were considered significant if p < 0.05. Results are reported as mean ± SEM in each case.
Results
Changes in neuronal density in SP and WM
A period of programmed cell death in embryonic SP neurons has been demonstrated (Allendoerfer and Shatz, 1994; Robertson et al., 2000). To determine whether similar changes occur in the SP and WM regions, cells were immunolabeled using MAP-2 and NeuN between P2 and P30. A total of 120 slices (84 for NeuN and 36 for MAP-2) from 25 animals were used. Both of these markers label only neurons. Figure 1 shows representative photomicrographs of visual cortical slices labeled with NeuN at P2 (A1), P16 (A2), and P30 (A3). At P2, a clear distinction is present between SP cells and cells of the overlying cortex. The SP region has a condensed appearance and a cell-sparse zone above. By P30, the SP region is more homogeneous in appearance with cortical layer VI, but cells can be distinguished by their horizontal somatic orientation (Luskin and Shatz, 1985; Chun and Shatz, 1989; Finney et al., 1998). The WM region can be identified easily at all ages studied. Immunostained cells are indicated by filled arrows. In live tissue, WM cells become more difficult to locate in older animals because of increased myelination. We found a 61% reduction of SP (Fig. 1B) and an 85% reduction of WM (Fig. 1C) cell density during the first 30 postnatal days (p < 0.01 in both cases). A similar reduction in WM cell density has been reported (Clancy et al., 2001). Approximately 29,000 ± 1800 neurons/mm3 remain within the SP and 500 ± 60 neurons/mm3 in the WM by P30. Therefore, SP and WM cells are immunopositive for neuronal markers, and their density declines during the first postnatal month until stabilizing.
Figure 1.
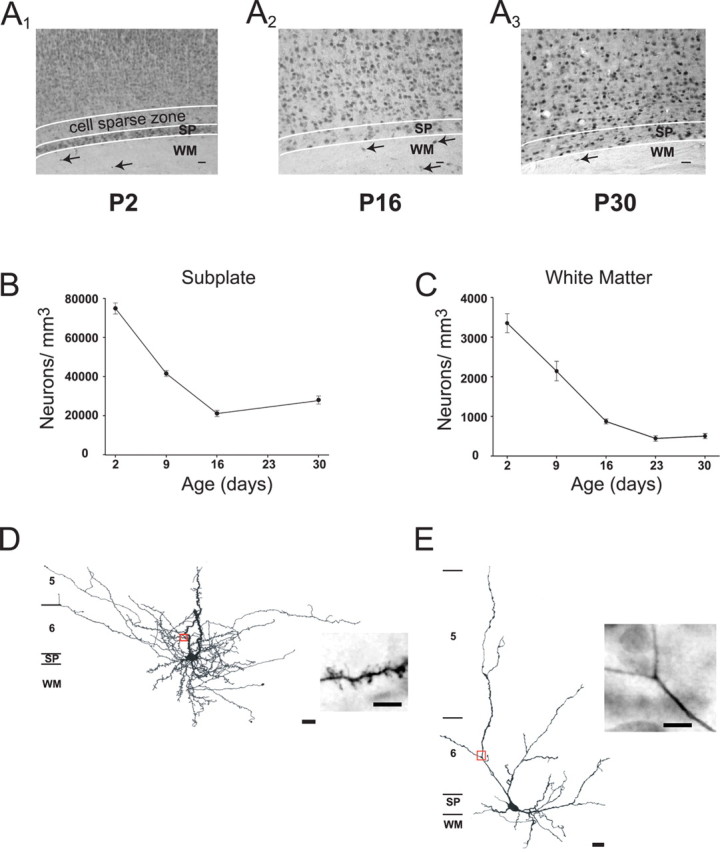
SP and WM cells decrease in density during the first month postnatally. A, Representative examples of NeuN-stained rat visual cortex at P2 (A1), P16 (A2), and P30 (A3). Filled arrows indicate WM cells at each age. B, C, Plots of neuronal density of SP (B) and WM (C) cells during the first month after birth in rat visual cortex. A developmental decrease was observed in both populations. D, E, Camera lucida drawings of a spiny (D) and smooth (E) SP cell. Insets are photomicrographs of the area of dendrite indicated by the red box in each drawing. Approximate location of the layers is indicated on the left of each drawing. Scale bars: photomicrographs, 50 μm; drawings, 20 μm; insets, 5 μm.
Dendritic morphology
To examine the dendritic morphology and density of projections of SP cells, 30 cells were filled with biocytin and drawn using light microscopy. We reported a similar analysis previously for WM neurons (Clancy et al., 2001). Representative examples of a spiny (Fig. 1D) and a smooth (Fig. 1E) cell within the SP region are shown. A section of the dendrite in each cell (red box) is shown in the photomicrographs. In some SP cells, spines were readily visible at the light microscopic level, whereas others required closer inspection of different areas of the dendritic tree. Smooth cells were completely devoid of spines. Fifty-three percent of the SP cells were spiny (n = 16) and 47% smooth (n = 14). SP cells had prominent dendritic projections parallel to the SP region and dendrites that radiated into the overlying cortical laminae.
The extent and orientation of the dendritic arborizations of 31 SP and 22 WM cells (data not shown) were quantified. Both groups were similar in the average number of dendritic crossings at each distance interval from the soma. There was no difference between SP and WM cells in the distribution of dendrites in each quadrant with the majority of the dendrites located in quadrants 1, 2, and 4 (horizontally along the laminar borders and vertically toward the pial surface) but not in quadrant 3 (toward the WM). Thus, postnatal SP and WM cells have robust dendritic processes that project to overlying cortical laminae.
Passive membrane and action potential firing properties
To better understand the role that SP and WM cells may play in the postnatal cortical circuit, we examined their passive membrane and active AP generating properties. SP and WM cells (basic electrophysiological properties are summarized in Table 1) were similar in their input resistance (SP, n = 42; WM, n = 28), threshold for spike initiation (SP, n = 35; WM, n = 16), and AP half-width (SP, n = 21; WM, n = 9). WM cells were significantly more depolarized at rest (n = 71) than SP (n = 74; p = 0.003) and pyramidal neurons (n = 16, p = 0.002). There was a slight but statistically significant difference in the ages of the samples between SP and WM cells (1.3 d), with mean ages of 12.1 ± 0.4 d for WM and 13.4 ± 0.3 d for SP neurons (p = 0.008). However, this slight age difference is unlikely to account for the difference in properties because when only the SP and WM cells from the same age range were compared the difference in properties remained. Interestingly, WM cells had significantly higher input resistances when compared with pyramidal neurons (WM, n = 28; pyramidal, n = 8; p < 0.001), and SP cells had larger APs (SP, n = 21; pyramidal, n = 6; p = 0.02). The AP half-width was larger in pyramidal than in SP or WM cells (SP, n = 21; WM, n = 9; pyramidal, n = 6; p < 0.05).
Table 1.
Electrophysiological properties of subplate and white matter neurons

Pyr, Pyramidal neurons; HW, half-width at half-height; sAHP, slow afterhyperpolarization amplitude. *p < 0.05; **p < 0.01.
Spike broadening during a train of action potentials is a well described frequency-dependent phenomenon in the cortex (Aldrich et al., 1979; Gillette et al., 1980; Koester and Alevizos, 1989; Zhou and Hablitz, 1996). We compared pyramidal (n = 6), SP (n = 21), and WM (n = 8) spike trains. SP and WM neurons underwent frequency-dependent spike broadening as did pyramidal cells. In comparisons between groups, however, the WM cells underwent significantly less (p < 0.05) spike broadening than the SP or pyramidal cells (Table 1).
Although SP and WM cells share many similar intrinsic membrane properties, there are substantial differences between these groups and cortical pyramidal neurons with respect to their spike train generating properties in response to sustained depolarizing input. We used direct current injections to study the spike train properties of SP (n = 22) and WM (n = 10) cells and compared them with pyramidal cells (n = 6) of layer II/III. Representative examples are shown for pyramidal (Fig. 2A1,A2), SP (Fig. 2B1,B2), and WM (Fig. 2C1,C2) cells at the current injection levels indicated. Examples are shown at 80 and 180 pA for pyramidal neurons because most did not exhibit consistent spikes before 80 pA, and there was no significant difference between 180 and 200 pA in the number of spikes. The maximum instantaneous firing frequency of the pyramidal neuron shown in Figure 2D was lower (31 Hz) than that of the SP (38 Hz) (Fig. 2E) and WM (53 Hz) (Fig. 2F) cells. The WM cell had a higher firing frequency (53 vs 38 Hz) and number of spikes (18 vs 12) than the SP cell. Interestingly, the WM cell had a fast initial adaptation period that stabilized after the fourth interval (200 pA) (Fig. 2F), whereas the SP neuron adapted only slowly throughout the train (200 pA) (Fig. 2E). The group data demonstrate that pyramidal neurons (Fig. 2G) exhibit a faster rate of spike frequency adaptation, which leads to fewer spikes per depolarization (10 at 180 pA). SP cells are more slowly adapting (Fig. 2H), whereas WM cells spike trains barely adapt (Fig. 2I). The group data for SP and WM cells are shown up to 12 intervals, because after this range not all cells show spikes and the data are skewed. WM cells showed up to 21 spikes when depolarized to 180–200 pA, and SP cells showed only up to 19 spikes at 200 pA depolarization. Thus, WM cells have a higher average firing frequency than SP cells. When the instantaneous firing frequency at 200 pA is compared between the groups (Fig. 2J), WM neurons (dark gray bars) had a significantly higher firing frequency than SP neurons (black bars) at all intervals except the first (p < 0.05). Pyramidal neurons (light gray bars) had the lowest firing frequency of the three groups. The rate of adaptation for each cell group at 200 pA depolarization was fitted with a single exponential (Fig. 2K, gray lines) using the equation y = yo + ae−bx, where 1/b was the tau. Although all cells showed some adaptation to responses eventually, the rate of adaptation of pyramidal neurons was faster (Fig. 2K, light gray triangles; 1.86 intervals, 54% overall reduction in firing rate), followed by WM cells (Fig. 2K, dark gray circles; 3.92 intervals, 22% reduction in firing rate) and SP cells (Fig. 2K, black circles; 6.19 intervals, 39% reduction in firing rate).
Figure 2.

SP and WM cells exhibit slow spike frequency adaptation. Traces and graphs shown for each group are arranged in columns. A–C, Representative traces for a pyramidal (A1, A2), SP (B1, B2), and WM (C1, C2) cell at the depolarization level indicated on the left. D–F, Instantaneous spike frequency analysis for the cell shown in the examples for pyramidal (D), SP (E), and WM (F). Each line represents a different depolarization level, and each point is a particular interval number. G–I, Analysis of spike frequency adaptation group data in pyramidal (G), SP (H), and WM (I) cells. Data were normalized to the largest instantaneous current in each cell. Traces shown for pyramidal cells start at a higher depolarization level because spikes were rarely present below 80 pA. J, Comparison of instantaneous frequency for each cell group versus spike interval number at 200 pA depolarization. K, Comparison of the adaptation rate between each cell group. Gray lines are single-exponential fits. For J and K, pyramidal cells are indicated by light gray bars and triangles, SP cells are indicated by black bars and circles, and WM cells are indicated by dark gray bars and gray circles. Significance calculated for the difference between SP and WM neurons. *p < 0.05.
Functional synaptic input to subplate and white matter cells
To determine whether SP and WM cells are synaptically integrated in the cortical network, we evoked PSPs, generated input–output curves for these cells, and compared them with pyramidal neurons. Both SP and WM cells receive functional synaptic input. Figure 3 shows representative input–output curves of PSP peak amplitude versus stimulus intensity under current clamp for a typical pyramidal (Fig. 3A), SP (Fig. 3B), and WM (Fig. 3C) cell. The inset traces are recordings at various stimulation intensities; several traces just at spike threshold are clustered near the peak recorded amplitude (traces with spikes were omitted for clarity of the PSPs). The 50% amplitude of the PSP to spike threshold and the extracellular stimulus current intensity used to evoke that 50% response are indicated by the intersecting lines on the input–output curves. The 50% amplitude of the PSPs to spike threshold are plotted (Fig. 3D) for the grouped data for the pyramidal (8.9 ± 0.8 mV; n = 6), SP (8.0 ± 0.6 mV; n = 6), and WM (7.0 ± 1.3 mV; n = 4) cells. In a separate set of experiments done in voltage clamp (Fig. 3E), the PSC amplitude evoked just below spike threshold that was previously recorded in current clamp for that same cell was noted. Sample PSCs recorded in response to stimulation current intensities just below spike threshold as previously determined in current clamp are shown above each group bar (Fig. 3E). The PSC peak amplitudes recorded in voltage clamp in response to stimulation intensities determined to be just below spike threshold for each cell (initially measured in current clamp while recording evoked PSPs) were −53 ± 10 pA in WM cells (n = 10), −141 ± 25 pA in pyramidal cells (n = 6), and −214 ± 45 pA in SP cells (n = 6). The WM PSCs evoked at just below the spike threshold intensity were significantly smaller (p < 0.01) than the pyramidal or SP cell PSCs.
Figure 3.

Synaptic input–output properties in pyramidal, SP, and WM cells. A–C, Representative examples of input–output curves in pyramidal (A), SP (B), and WM (C) cells. Gray lines indicate the half-threshold PSP amplitude and stimulus intensity for each cell. Insets are PSPs for each indicated cell type on top. D, Plot of average ± SEM half-threshold PSP amplitude in pyramidal (black bar; n = 6), SP (light gray bar; n = 6) and WM (dark gray bar; n = 4) neurons. E, Plot of the average ± SEM. PSC amplitude at threshold evoked in voltage clamp at a synaptic stimulating current amplitude that was used for that same cell in current-clamp mode to evoke a PSP that was just below spike threshold for pyramidal (black bar; n = 6), SP (light gray bar; n = 6), and WM (dark gray bar; n = 10) cells. Insets are PSCs for each cell type below. Statistical comparisons are between WM and the other cell groups. **p < 0.01.
To determine the receptors that mediate the synaptic responses, we isolated the PSC components pharmacologically in 23 SP and 12 WM cells (and five control layer II/III pyramidal cells). CNQX significantly reduced the peak current in both SP and WM cells (Fig. 4). Representative controls in aCSF and records in CNQX are shown for an SP (Fig. 4A) and WM (Fig. 4B) cell, respectively. CNQX eliminated >80% of the current in each group (SP control, −74 ± 14 pA; CNQX, −13 ± 5 pA; n = 12; WM control, −55 ± 13 pA; CNQX, −4 ± 1 pA; n = 5; p < 0.01 in each case). The results summarized in Figure 4C are consistent with a substantial AMPA/kainate receptor-mediated input to both cell groups.
Figure 4.

Effect of AMPA/kainate, NMDA, and GABAA receptor pharmacological inhibition on synaptic responses evoked in SP and WM cells. Panels correspond to the cell type (SP or WM) indicated at the top of each column. A–C, Effects of CNQX alone on synaptic responses evoked at −70 mV. Representative examples of averaged evoked synaptic responses from an SP (A) and a WM (B) cell in aCSF (control; large black traces) and in CNQX (small gray traces). Summary of effects of CNQX on normalized peak evoked synaptic responses at −70 mV (C). D–F, Effect of APV alone on evoked synaptic currents at −70 mV. Representative examples of averaged evoked synaptic responses from an SP (D) and a WM (E) cell in aCSF (control; black traces) and in APV (gray traces). Summary of effects of APV on normalized peak evoked synaptic currents at −70 mV (F). G–I, Effect of APV and CNQX on evoked synaptic currents at −70 mV. Small currents remain in some cells at −70 mV after blockade of AMPA/kainate receptors with CNQX. Representative examples of average evoked synaptic responses from an SP (G) and a WM (H) cell in CNQX alone (black traces) and in CNQX/APV (gray traces). Summary of effect of APV/CNQX (vs CNQX alone) on normalized peak evoked synaptic responses at −70 mV (I). J, K, Effects of bicuculline on amplitude of average peak evoked synaptic responses of SP (J) and WM (K) cells. The peak responses are plotted for each individual cell tested in the control (Pre-Bicuc) condition and the experimental (Peri-Bicuc) condition. The control responses varied in their amplitude ranges as the bicuculline was applied after a no-drug control condition (aCSF), in conjunction with APV after application of APV alone, or in conjunction with CNQX/APV after application of CNQX/APV. *p < 0.05; **p < 0.01.
We also evaluated possible contributions of NMDA receptors to the evoked synaptic responses in several types of experiments. The effect of bath application of APV on the averaged evoked synaptic response is shown for an SP (Fig. 4D) and WM (Fig. 4E) cell recorded at −70 mV. The results are summarized in Figure 4F. There was no significant change in the peak amplitudes of the PSCs in either the SP or WM cell groups (Δ = +25 and +13% for SP and WM, respectively; SP control, −12 ± 1 pA; APV, −15 ± 3 pA; n = 4; p = 0.13; WM control, −23 ± 3 pA; APV, −26 ± 7 pA; n = 5; p = 0.35). However, if the AMPA/kainate receptor-mediated responses were first blocked with CNQX, bath application of APV at −70 mV resulted in a small but significant change in the peak amplitudes of the PSCs in both cell groups (−33 and −50% for SP and WM, respectively). Example recordings are shown for a single SP and WM cell (Figs. 4G,H). For the SP neurons (n = 10), the peak PSC was reduced from −15 ± 5 to −10 ± 4 pA (p = 0.02) (Fig. 4I). For the WM neurons (n = 4), the peak PSC was reduced from −4 ± 1 to −2 ± 0.4 pA (p = 0.02) (Fig. 4I). Although these results suggest that an NMDA receptor-mediated component to the evoked synaptic response can be identified in isolation from the AMPA/kainate component, it is important to note that the reduction for WM neurons is with respect to a small residual PSC component in the presence of CNQX alone at −70mV (−4 pA) (Fig. 4F) and that the 33% reduction for SP neurons was primarily attributable to two cells in the group of 10 tested.
Because in many cases neither CNQX nor APV completely eliminated the evoked synaptic responses, we also investigated the possibility of a GABAergic input to these cells. Addition of bicuculline significantly reduced the peak PSC for some cells in both the SP (Fig. 4J) and WM (Fig. 4K) groups. Because the addition of bicuculline to the bath sometimes followed evaluation of AMPA/kainate and/or NMDA components of the synaptic responses, the results of the different experimental protocols (all performed at −70 mV) are graphically represented together in Figure 4, J and K, but with the peak PSC in the absence and presence of bicuculline for each cell indicated. The individual peak evoked synaptic responses in the various solutions containing either aCSF, APV, or CNQX/APV but without bicuculline present (pre-bicuc) are compared with those same solutions but with bicuculline also present (peri-bicuc). Bicuculline caused a 74% reduction in overall PSC amplitude in SP cells (pre-bicuc, −15 ± 5 pA; peri-bicuc, −4 ± 2 pA; p = 0.01) (Fig. 4J) and a 34% reduction in overall PSC peak amplitude in WM cells (pre-bicuc, −6 ± 2 pA; peri-bicuc, −4 ± 2 pA; p = 0.03) (Fig. 4K). This effect was primarily attributable to a subset (6 of 16 SP and 3 of 11 WM neurons) of the cells tested as can been seen from the response peak plots in Figure 4, J and K.
Because APV had only minor effects on the synaptic responses evoked at −70 mV in control aCSF, we also used conditions that are more conducive to revealing NMDAR-mediated responses. Several SP and WM cells were tested at more depolarized levels. Figure 5A shows recordings from an SP neuron at a −70 mV (top traces) and at a +30 mV (bottom traces) holding potential. Each trace is the average for the condition indicated. An inward (top) and outward (bottom) current can be seen. This current was reduced by CNQX application at −70 mV but remained unchanged at +30 mV. APV reduced the remaining current by only a small amount, whereas bicuculline eliminated the current at both holding potentials. Figure 5B shows the results of adding APV to CNQX at +30 mV for individual SP cells. Group analysis of the peak synaptic responses of the SP cells recorded at +30 mV showed no significant change (CNQX at +30 mV, −96 ± 32 pA; CNQX/APV at +30 mV, −94 ± 32 pA; p = 0.50). WM neurons were not tested at +30 mV. SP and WM cells were also tested at −50 mV, but APV did not have a significant effect on the PSCs at that membrane potential either. Individual examples are shown for SP (Fig. 5C) and WM (Fig. 5D) cells, (SP control at −50 mV, −13 ± 2 pA; APV at −50 mV, −10 ± 4 pA; WM control at −50 mV, −17 ± 6 pA; APV at −50, −17 ± 8). To further optimize the conditions for revealing a potential NMDA component of the synaptic response of SP cells, we also compared responses at +30 mV with an elevated Ca2+/Mg2+ ratio (3:1 vs 1:1) and with pharmacological inhibition of AMPA and GABAA receptor-mediated currents (with CNQX and bicuculline, respectively) with and without APV present. These results are illustrated in Figure 5, E and F. APV completely eliminated the residual synaptic currents (−115 ± 35 pA in CNQX/bicuculline; −0.3 ± 3 pA in CNQX/bicuculline/APV; p < 0.01). However, although the APV inhibition is consistent with an NMDAR response, the inward nature of the synaptic currents, even at +30 mV, suggest that other processes may be contributing to this response or its apparent polarity (see Discussion).
Figure 5.

Effects of APV application on evoked synaptic responses in the presence of CNQX at −70 and +30 mV before and after application of bicuculline. Example (A) synaptic responses of an SP cell recorded at −70 and +30 mV holding potential. An inward (control, −70 mV) and the corresponding outward (+30 mV) current are seen at the two holding potentials. The current is significantly decreased by CNQX at −70 mV (−52%; p < 0.01) but is not significantly affected by APV (−3%; p > 0.05) at either potential. Bicuculline eliminated the remaining current at both membrane potentials. Individual (B) data for SP cells (n = 3) that were depolarized to +30 mV in the presence of CNQX (CNQX + 30) and in the presence of CNQX/APV (CNQX + APV + 30). The NMDA receptor component was not observed when SP (n = 4) (C) or WM (n = 4) (D) cells were depolarized to −50 mV. Inward PSCs are seen at +30 mV when SP cells are recorded in low Mg2+/high Ca2+ and during blockade of AMPA/kainate and GABAA receptors (E1). The current is eliminated by application of APV (E2). Individual data (F) for SP cells (n = 5) depolarized to +30 mV in the presence of CNQX and bicuculline (CNQX + Bicuc) and in the presence of CNQX, bicuculline, and APV (CNQX + Bicuc + APV).
The temporal interactions of synaptic inputs to SP and WM neurons was evaluated with a pseudorandomized paired-pulse protocol (n = 21 SP and n = 17 WM neurons) that included ISIs ranging from 12.5 to 200 ms with at least five ISIs tested for 21 of the cells (n = 11 SP and n = 10 WM). In both populations, responses of some cells underwent facilitation, whereas others underwent depression. The PPR for each interval was analyzed for each SP and WM cell. Example recordings for a 50 and 200 ms ISI are shown for an example SP (Fig. 6A, inset traces) and WM (Fig. 6B, inset traces) cell. When analyzed as a group, synaptic inputs to SP cells (Fig. 6A) showed significant PPF at 25, 50, and 100 ms ISIs (p < 0.01 for each ISI). WM cells (Fig. 6B) showed significant facilitation at 50 and 250 ms ISIs (p < 0.05 for each ISI). In both cell groups, the response at a given ISI was considered significant only when it was different from the calculated baseline variability expected of the PPR expected for a PSC at that particular ISI (light gray region in graph).
Figure 6.

Responses of SP and WM cells to paired-pulse synaptic stimulation. Inset traces at top are recorded averaged paired-pulse evoked PSCs from an example SP (left) and WM (right) cell for the 50 and 200 ms ISI. A, B, Analysis of group PPR in SP (A; n = 21) and WM (B; n = 17) cells. Horizontal lines at 1.0 PPR indicate the interface between paired-pulse depression (<1.0) and paired-pulse facilitation (>1.0). Gray region indicates the variability in the PPR expected from normal variability of a single PSC (the mean ± SEM PPR for the ratio of the first PSC in each trial related to the first PSC in the previous trial with 5 s intertrial intervals). Filled circles in the group data represent the mean ± SEM of the PPR at each ISI. *p < 0.05; **p < 0.01.
It was of interest to determine whether synaptic inputs to SP and WM cells were capable of plasticity in response to standard activity-dependent conditioning paradigms. Induction of long-term (≥30 min) synaptic plasticity was evaluated using two standard protocols. One was a low-frequency (1 Hz) afferent stimulation paradigm generally used to induce long-term depression (LTD) (Dudek and Bear, 1993; Kirkwood et al., 1993; Kirkwood and Bear, 1995; Perrett et al., 2001). A schematic of this protocol is shown at the top of Figure 7. Baseline PSCs were collected at 0.1 Hz for 10–15 min in voltage clamp before stimulating at 1 Hz for 15 min in current clamp (inset shows the PSPs). The postconditioning responses (also obtained at 0.1 Hz) were collected in voltage clamp for the remaining period. Time plots of representative examples of peak amplitudes of PSCs before, during, and after conditioning for an example SP (Fig. 7A) and WM (Fig. 7B) cell are shown. Insets are the average PSCs for the 10 min before conditioning (top left in each figure) and the last 10 min of recording (top right in each figure) in the post-conditioning period. The peak amplitudes of the PSPs collected under current clamp during the conditioning period were normalized to the first PSP elicited and were included to demonstrate the time course of development of depression. Points are shown every 20 s during the baseline and post-conditioning period. Points are shown every second during the conditioning phase. Baseline stability was confirmed by comparing the first and last 2 min of the baseline region (SP, p = 0.25; WM, p = 0.61; two-tailed t test). Significant LTD occurred in both examples (p < 0.001 in both cases). Group data are shown in minute averages for all SP (n = 8) (Fig. 7C) and WM (n = 7) (Fig. 7D) cells. SP and WM cells exhibit significant LTD (p < 0.001). The depression was greater in WM cells (55% WM vs 31% SP; p < 0.001).
Figure 7.

Responses of SP and WM cells to 1 Hz synaptic conditioning for plasticity induction. Schematic shows the organization of the experimental protocol (for details, see Materials and Methods). Inset traces are examples of the recorded PSCs and PSPs in current and voltage clamp, respectively. Arrow in the insets represents the location of extracellular stimulation. Gray bars indicate the conditioning period. A, B, Representative time plots of PSCs before and after 15 min 1 Hz synaptic stimulation for an individual SP and WM cell that exhibited LTD, respectively. Insets are average PSCs 10 min before 1 Hz stimulation and from 25–35 min after 1 Hz stimulation (horizontal bars). Horizontal line indicates the interface between depression and facilitation. C, D, Group data for all SP (n = 8) and WM (n = 7) cells, respectively. Significant LTD (p < 0.001) was observed in both cases. The mean group LTD in SP cells was 31%, whereas it was 55% in WM cells.
Responses to a conditioning protocol that pairs synaptic input with postsynaptic depolarization was also evaluated (Fig. 8, protocol schematic at the top). This pairing protocol resulted in variable plasticity outcomes. Examples in which LTD was induced in an SP cell and long-term potentiation (LTP) was induced in a WM neuron are illustrated in Figure 8, A (−40%; p < 0.001) and B (+15%; p = 0.006), respectively. The insets show the average current response before conditioning and during the last 10 min of recording. The grouped data for the sample of cells from the SP and WM groups are illustrated in minute averages in Figure 8, C and D, respectively. Although there were variable outcomes for individual cells in both groups, the SP group underwent significant depression (−19%; p < 0.001) (Fig. 8C), whereas the WM group did not significantly change (3%; p = 0.36) (Fig. 8D). Table 2 summarizes the individual outcomes for each cell tested.
Figure 8.

Responses of SP and WM cells to plasticity induction protocol that pairs synaptic input at 0.1 Hz with direct depolarization (and spiking) of the postsynaptic cell. Schematic shows the organization of the pairing protocol used for LTP induction (for details, see Materials and Methods). Inset traces are examples of whether the recording was in voltage or current clamp and are not meant to represent a particular experiment. Arrow in the insets represents the location of extracellular stimulation. Gray bars indicate the conditioning period. Spike train represents the depolarization of the cell during the pairing. Representative examples from SP (A), showing significant depression, and WM (B), showing significant potentiation. Insets are average PSCs 10 min before pairing and from 30–40 min after conditioning (horizontal bars). C, D, Group data for all SP (n = 7) and WM (n = 9) cells in the sample, respectively. Significant depression (19%) was seen in SP cells (p < 0.001), but no change (3%) was seen in WM cells because some cells also showed mild potentiation.
Table 2.
Outcomes from pairing experiment
| Cell phenotype | Percentage change PSC peak amplitude | p value | Percentage change rise time | p value | Percentage change half-width | p value |
|---|---|---|---|---|---|---|
| SP | −13 | 0.01 | −29 | 0.004 | −21 | 0.002 |
| SP | −14 | 0.04 | −32 | <0.001 | −44 | <0.001 |
| SP | +12 | 0.02 | −35 | 0.19 | −20 | 0.009 |
| SP | −40 | <0.001 | +58 | <0.001 | +29 | <0.001 |
| SP | −13 | 0.004 | −0.7 | 0.96 | −6 | 0.22 |
| SP | −35 | <0.001 | +15 | 0.15 | +17 | 0.006 |
| SP | −17 | <0.001 | −0.2 | 0.97 | −24 | 0.006 |
| WM | −7 | 0.07 | −11 | 0.15 | −21 | <0.001 |
| WM | +142 | <0.001 | −32 | <0.001 | −45 | <0.001 |
| WM | −38 | <0.001 | −49 | <0.001 | −96 | <0.001 |
| WM | +60 | <0.001 | −38 | <0.001 | −24 | 0.002 |
| WM | −49 | <0.001 | −27 | 0.24 | −36 | 0.13 |
| WM | −27 | 0.04 | −26 | 0.16 | −35 | 0.02 |
| WM | +4 | 0.5 | −32 | 0.06 | −27 | <0.001 |
| WM | +15 | 0.008 | −23 | 0.001 | −43 | <0.001 |
| WM | +29 | <0.001 | −11 | 0.11 | −36 | <0.001 |
Percentage change obtained by dividing the mean value during the last 10 min postconditioning by the 10 min preconditioning (baseline).
Discussion
The aim of this study was to determine whether those SP and WM cells that survive the period of early programmed cell death are functional neurons and, if so, to what degree they are integrated into the cortical circuitry. Surviving SP and WM cells do have neuronal phenotypes: SP cells are positive for neuronal markers and can have spiny or smooth dendrites. Aside from differences in Em and AP amplitude, SP and WM neurons share many characteristics, including weak spike frequency adaptation, progressive AP broadening during sustained firing (data not shown), and receipt of glutamatergic and GABAergic inputs.
Decrease in density of subplate and white matter neurons in postnatal cortex
Programmed cell death has been postulated for eliminating neurons in the SP during perinatal development (Wahle and Meyer, 1987; Al Ghoul and Miller, 1989; Naegele et al., 1991; Allendoerfer and Shatz, 1994; DeFreitas et al., 2001; Arias et al., 2002; McQuillen et al., 2002). We observed a decline in cell density in SP during the first postnatal month of cortical development (Fig. 1B,C). It is unlikely that this decrease is attributable to a sampling error because a similar time course for the elimination of SP neurons occurs in cat visual cortex (Chun and Shatz, 1989). Sampling errors would have been more likely at P30 when the distinction between SP and layer VI is less clear. However, that should lead to an increase in the number of neurons counted. The reduction in SP cell density is not caused by cortical expansion because the decrease of cortical neurons in the upper layers is significantly less than that observed in SP neurons (Woo et al., 1991) (but see Valverde et al., 1995). In the mouse WM, there is a 75-fold decrease in neurons between birth and P21 but only a 15-fold increase in WM volume (Wood et al., 1992); therefore, the decrease in neuronal density is not caused by a dilution effect.
Potential sources of synaptic input to SP and WM neurons
SP neurons have rich dendritic arborizations (Fig. 1D,E) extending parallel to the cortical laminae and toward the overlying neocortex, positioning them to sample intracortical synapses (Gilbert and Kelly, 1975; Anderson et al., 1992; Callaway and Katz, 1992; Douglas and Martin, 2004). Moreover, individual supragranular neurons in visual cortex (Kisvarday et al., 1987; Martin, 2002; Binzegger et al., 2004, 2005; Douglas and Martin, 2004) issue axon collaterals deep in layer VI and even into the WM that may potentially innervate SP and/or WM neurons. In rodent cortex, corticocortical fibers travel superficially in WM, close to and through the SP, callosal projections follow a trajectory in the middle of the WM, whereas corticofugal axons travel deeper (Aggoun-Aouaoui et al., 1996; Del Rio et al., 2000). Thalamocortical axons from the dorsal lateral geniculate nucleus also travel through the SP and upper WM (Catalano et al., 1991; Miller et al., 1993; Lopez-Bendito and Molnar, 2003), raising the possibility for the dendrites of SP and WM neurons to receive synaptic inputs from collaterals of thalamocortical, ipsilateral corticocortical, and/or callosal afferents (Miller et al., 1993; Aggoun-Aouaoui et al., 1996; Del Rio et al., 2000). Thus, SP and WM neurons may provide feedback to intracortical microcircuits and sample outputs from neuromodulatory systems (dopamine, acetylcholine, serotonin, and norepinephrine) that innervate the layer VI–WM border and layer VI (Wilson and Molliver, 1991; Phillipson et al., 1987; Mechawar et al., 2000; Latsari et al., 2002). SP and WM cells could also receive synaptic input from like-type neighbors, because bouton-studded axons of WM neurons are present within SP and WM (Clancy et al., 2001).
Functional properties of synaptic input to subplate and white matter neurons
The amplitudes of the evoked synaptic currents just below threshold differ between pyramidal, SP, and WM neurons (Fig. 3E), paralleling the intrinsic physiology of each cell type. WM neurons had more depolarized resting membrane potentials and higher input resistance, but their thresholds were not different from SP or pyramidal neurons (Table 1); therefore, smaller currents are sufficient to trigger an action potential. Synaptic inputs to SP and WM cells are glutamatergic and GABAergic (Fig. 4). Local GABAergic neurons also are located in cat and rat layer VI (Kisvardy et al., 1987; Ling et al., 2005). A distinct NMDAR-mediated component was not readily demonstrable in the synaptic responses in SP cells while clamping the soma at −70 or −50 mV in a normal calcium/magnesium aCSF (Fig. 5A–D). The only experimental conditions in which APV clearly abolished a distinct component of the synaptic response were when the [Ca2+]o/[Mg2+]o ratio was increased, the cell was depolarized (+30 mV), and AMPA/kainate and GABAA receptor input was pharmacologically inhibited. However, even under these conditions, the current that was blocked by APV was inward, uncharacteristic of an NMDAR-mediated response. Interestingly, NMDARs, active at −70 mV, have been described in early SP neurons (Hanganu et al., 2002), which may be eliminated through an NMDAR-mediated process (Csillik et al., 2002). Although it is possible that the APV was not effective (Monaghan and Larsen, 1997; Stocca and Vicini, 1998; Hanganu et al., 2002) at blocking the responses recorded at −70 or −50 mV, that is unlikely because, at +30 mV with an elevated [Ca2+]o/[Mg2+]o ratio, the responses were eliminated by APV. The net inward synaptic current at +30 mV that APV blocked may, under conditions of elevated [Ca2+]o, be below the EPSC and presumably be carried predominantly by a combination of sodium and calcium. Alternatively the inward synaptic current at +30 mV may be a manifestation of another calcium activated (or inactivated) current [K+ or Cl− (Owen et al., 1984; Zorumski et al., 1989; Shah and Haylett, 2002; Wang et al., 2006)]. Although the ionic mechanism of this current are beyond the scope of this present study, the capacity for APV to eliminate these synaptically evoked currents is consistent with them having at least an initial NMDA receptor-mediated component. It is also possible that the sites of the synaptic input on these SP and WM cells may have been so electrotonically distant that they are not effectively voltage clamped, leading to the inward current blocked by APV (Spruston et al., 1993; Carnevale et al., 1997).
Overall, the synaptic inputs to SP and WM underwent short-term facilitation, consistent with a low probability of baseline neurotransmitter release (Dobrunz and Stevens, 1997). However, on an individual cell basis, short-term plasticity was variable, suggesting the following: (1) individual postsynaptic target neurons may contribute differentially (Davis, 1995; Levenes et al., 2001; Diana et al., 2002); (2) multiple sources of afferent inputs with variable release properties innervate individual SP/WM neurons; and/or (3) extracellular stimulation activates heterogeneous afferents to a given cell. Paired-pulse plasticity is generally attributed to presynaptic terminals (Dobrunz et al., 1997; Canepari and Treves, 2001; von Gersdorff and Borst, 2002). Our protocol should have minimized selective activation of different afferent populations between experiments and cells. Because inhibition was not blocked, local inhibitory circuits may have contributed to the variability of the responses. Modulation of short-term synaptic transmission via GABAB receptors may also play a role in the variability observed. In the frontal cortex, GABAB receptors change PPD to PPF through heterosynaptic depression of excitatory synaptic transmission (Chu and Hablitz, 2003), and there is a high expression of GABAB receptor within the SP region (Princivalle et al., 2000).
In addition to PPF, both SP and WM neurons underwent longer-term plasticity, primarily LTD (Fig. 7C,D) in response to 1 Hz conditioning, and, in some SP neurons, LTD was induced in response to pairing (Fig. 8A) that is generally thought to favor LTP (Abraham and Bear, 1996; Lee et al., 2000). Layer II/III pyramidal neurons respond similarly to a pairing protocol with variable plasticity outcomes (Ismailov et al., 2004). This may be attributable to different histories of the synapses (Abraham and Bear, 1996; Heynen et al., 1996; Philpot et al., 2003) or neuronal states (Montgomery and Madison, 2002; Montgomery and Madison, 2004).
Role for surviving subplate and white matter neurons in the visual cortical microcircuit
Our results suggest a cohesive development of SP and WM neurons that positions them to play a role in the mature cortical circuit. Embryonic SP neurons have been shown to be glutamatergic and provide excitatory drive to the cortex during development (Finney et al., 1998). Although the axonal projections of postnatal SP neurons have not been examined, axons of WM neurons including a subset of neurons called “border neurons” that matches the location of the postnatal SP neurons described in our study innervate all cortical layers (Clancy et al., 2001). Furthermore, tracers applied to layer I of the cortex retrogradely label a population of neurons just below layer VI (Clancy and Cauller, 1999), exactly where the SP/WM neurons we studied are located. Therefore, it is possible that the neurons described in our study provide glutamatergic drive to the cortex, perhaps innervating inhibitory neurons in overlying cortex. Consistent with this suggestion, lesioning embryonic SP neurons causes seizures (Lein et al., 1999).
Footnotes
This work was supported by National Institutes of Health Grants EY-12782 and HD-38760 (M.J.F.) and F31-NS10608 (J.T.-R.). The technical assistance of Felecia Hester is gratefully acknowledged. Dr. John Hablitz provided advice on electrode techniques.
References
- Abraham WC, Bear MF. Metaplasticity: the plasticity of synaptic plasticity. Trends Neurosci. 1996;19:126–130. doi: 10.1016/s0166-2236(96)80018-x. [DOI] [PubMed] [Google Scholar]
- Aggoun-Aouaoui D, Kiper DC, Innocenti GM. Growth of callosal terminal arbors in primary visual areas of the cat. Eur J Neurosci. 1996;8:1132–1148. doi: 10.1111/j.1460-9568.1996.tb01281.x. [DOI] [PubMed] [Google Scholar]
- Al Ghoul WM, Miller MW. Transient expression of Alz-50 immunoreactivity in developing rat neocortex: a marker for naturally occurring neuronal death? Brain Res. 1989;481:361–367. doi: 10.1016/0006-8993(89)90815-9. [DOI] [PubMed] [Google Scholar]
- Aldrich RW, Jr, Getting PA, Thompson SH. Mechanism of frequency-dependent broadening of molluscan neurone soma spikes. J Physiol (Lond) 1979;291:531–544. doi: 10.1113/jphysiol.1979.sp012829. [DOI] [PMC free article] [PubMed] [Google Scholar]
- Allendoerfer KL, Shatz CJ. The subplate, a transient neocortical structure: its role in the development of connections between thalamus and cortex. Annu Rev Neurosci. 1994;17:185–218. doi: 10.1146/annurev.ne.17.030194.001153. [DOI] [PubMed] [Google Scholar]
- Anderson JC, Dehay C, Friedlander MJ, Martin KA, Nelson JC. Synaptic connections of physiologically identified geniculocortical axons in kitten cortical area 17. Proc Biol Sci. 1992;250:187–194. doi: 10.1098/rspb.1992.0148. [DOI] [PubMed] [Google Scholar]
- Arias MS, Baratta J, Yu J, Robertson RT. Absence of selectivity in the loss of neurons from the developing cortical subplate of the rat. Brain Res Dev Brain Res. 2002;139:331–335. doi: 10.1016/s0165-3806(02)00582-5. [DOI] [PubMed] [Google Scholar]
- Binzegger T, Douglas RJ, Martin KA. A quantitative map of the circuit of cat primary visual cortex. J Neurosci. 2004;24:8441–8453. doi: 10.1523/JNEUROSCI.1400-04.2004. [DOI] [PMC free article] [PubMed] [Google Scholar]
- Binzegger T, Douglas RJ, Martin KA. Axons in cat visual cortex are topologically self-similar. Cereb Cortex. 2005;15:152–165. doi: 10.1093/cercor/bhh118. [DOI] [PubMed] [Google Scholar]
- Callaway EM, Katz LC. Development of axonal arbors of layer 4 spiny neurons in cat striate cortex. J Neurosci. 1992;12:570–582. doi: 10.1523/JNEUROSCI.12-02-00570.1992. [DOI] [PMC free article] [PubMed] [Google Scholar]
- Canepari M, Treves A. Characterization of the variability of glutamatergic synaptic responses to presynaptic trains in rat hippocampal pyramidal neurons. Network. 2001;12:175–198. [PubMed] [Google Scholar]
- Carnevale NT, Tsai KY, Claiborne BJ, Brown TH. Comparative electrotonic analysis of three classes of rat hippocampal neurons. J Neurophysiol. 1997;78:703–720. doi: 10.1152/jn.1997.78.2.703. [DOI] [PubMed] [Google Scholar]
- Catalano SM, Robertson RT, Killackey HP. Early ingrowth of thalamocortical afferents to the neocortex of the prenatal rat. Proc Natl Acad Sci USA. 1991;88:2999–3003. doi: 10.1073/pnas.88.8.2999. [DOI] [PMC free article] [PubMed] [Google Scholar]
- Chu Z, Hablitz JJ. GABA(B) receptor-mediated heterosynaptic depression of excitatory synaptic transmission in rat frontal neocortex. Brain Res. 2003;959:39–49. doi: 10.1016/s0006-8993(02)03720-4. [DOI] [PubMed] [Google Scholar]
- Chun JJ, Shatz CJ. Interstitial cells of the adult neocortical white matter are the remnant of the early generated subplate neuron population. J Comp Neurol. 1989;282:555–569. doi: 10.1002/cne.902820407. [DOI] [PubMed] [Google Scholar]
- Clancy B, Cauller LJ. Widespread projections from subgriseal neurons (layer VII) to layer I in adult rat cortex. J Comp Neurol. 1999;407:275–286. [PubMed] [Google Scholar]
- Clancy B, Silva-Filho M, Friedlander MJ. Structure and projections of white matter neurons in the postnatal rat visual cortex. J Comp Neurol. 2001;434:233–252. doi: 10.1002/cne.1174. [DOI] [PubMed] [Google Scholar]
- Csillik AE, Okuno E, Csillik B, Knyihár, Vécsei L. Expression of kynurenine aminotransferase in the subplate of the rat and its possible role in the regulation of programmed cell death. Cereb Cortex. 2002;12:1193–1201. doi: 10.1093/cercor/12.11.1193. [DOI] [PubMed] [Google Scholar]
- Davis GW. Long-term regulation of short-term plasticity: a postsynaptic influence on presynaptic transmitter release. J Physiol (Paris) 1995;89:33–41. doi: 10.1016/0928-4257(96)80549-3. [DOI] [PubMed] [Google Scholar]
- DeFreitas MF, McQuillen PS, Shatz CJ. A novel p75NTR signaling pathway promotes survival, not death, of immunopurified neocortical subplate neurons. J Neurosci. 2001;21:5121–5129. doi: 10.1523/JNEUROSCI.21-14-05121.2001. [DOI] [PMC free article] [PubMed] [Google Scholar]
- Del Rio JA, Martinez A, Auladell C, Soriano E. Developmental history of the subplate and developing white matter in the murine neocortex. Neuronal organization and relationship with the main afferent systems at embryonic and perinatal stages. Cereb Cortex. 2000;10:784–801. doi: 10.1093/cercor/10.8.784. [DOI] [PubMed] [Google Scholar]
- Diana MA, Levenes C, Mackie K, Marty A. Short-term retrograde inhibition of GABAergic synaptic currents in rat Purkinje cells is mediated by endogenous cannabinoids. J Neurosci. 2002;22:200–208. doi: 10.1523/JNEUROSCI.22-01-00200.2002. [DOI] [PMC free article] [PubMed] [Google Scholar]
- Dobrunz LE, Stevens CF. Heterogeneity of release probability, facilitation, and depletion at central synapses. Neuron. 1997;18:995–1008. doi: 10.1016/s0896-6273(00)80338-4. [DOI] [PubMed] [Google Scholar]
- Dobrunz LE, Huang EP, Stevens CF. Very short-term plasticity in hippocampal synapses. Proc Natl Acad Sci USA. 1997;94:14843–14847. doi: 10.1073/pnas.94.26.14843. [DOI] [PMC free article] [PubMed] [Google Scholar]
- Douglas RJ, Martin KA. Neuronal circuits of the neocortex. Annu Rev Neurosci. 2004;27:419–451. doi: 10.1146/annurev.neuro.27.070203.144152. [DOI] [PubMed] [Google Scholar]
- Dudek SM, Bear MF. Bidirectional long-term modification of synaptic effectiveness in the adult and immature hippocampus. J Neurosci. 1993;13:2910–2918. doi: 10.1523/JNEUROSCI.13-07-02910.1993. [DOI] [PMC free article] [PubMed] [Google Scholar]
- Finney EM, Stone JR, Shatz CJ. Major glutamatergic projection from subplate into visual cortex during development. J Comp Neurol. 1998;398:105–118. [PubMed] [Google Scholar]
- Friauf E, McConnell SK, Shatz CJ. Functional synaptic circuits in the subplate during fetal and early postnatal development of cat visual cortex. J Neurosci. 1990;10:2601–2613. doi: 10.1523/JNEUROSCI.10-08-02601.1990. [DOI] [PMC free article] [PubMed] [Google Scholar]
- Ghosh A, Shatz CJ. Involvement of subplate neurons in the formation of ocular dominance columns. Science. 1992;255:1441–1443. doi: 10.1126/science.1542795. [DOI] [PubMed] [Google Scholar]
- Ghosh A, Shatz CJ. A role for subplate neurons in the patterning of connections from thalamus to neocortex. Development. 1993;117:1031–1047. doi: 10.1242/dev.117.3.1031. [DOI] [PubMed] [Google Scholar]
- Ghosh A, Shatz CJ. Segregation of geniculocortical afferents during the critical period: a role for subplate neurons. J Neurosci. 1994;14:3862–3880. doi: 10.1523/JNEUROSCI.14-06-03862.1994. [DOI] [PMC free article] [PubMed] [Google Scholar]
- Ghosh A, Antonini A, McConnell SK, Shatz CJ. Requirement for subplate neurons in the formation of thalamocortical connections. Nature. 1990;347:179–181. doi: 10.1038/347179a0. [DOI] [PubMed] [Google Scholar]
- Gilbert CD, Kelly JP. The projections of cells in different layers of the cat's visual cortex. J Comp Neurol. 1975;163:81–105. doi: 10.1002/cne.901630106. [DOI] [PubMed] [Google Scholar]
- Gillette R, Gillette MU, Davis WJ. Action-potential broadening and endogenously sustained bursting are substrates of command ability in a feeding neuron of Pleurobranchaea. J Neurophysiol. 1980;43:669–685. doi: 10.1152/jn.1980.43.3.669. [DOI] [PubMed] [Google Scholar]
- Grossberg S, Seitz A. Laminar development of receptive fields, maps and columns in visual cortex: the coordinating role of the subplate. Cereb Cortex. 2003;13:852–863. doi: 10.1093/cercor/13.8.852. [DOI] [PubMed] [Google Scholar]
- Hanganu IL, Kilb W, Luhmann HJ. Spontaneous synaptic activity of subplate neurons in neonatal rat somatosensory cortex. Cereb Cortex. 2001;11:400–410. doi: 10.1093/cercor/11.5.400. [DOI] [PubMed] [Google Scholar]
- Hanganu IL, Kilb W, Luhmann HJ. Functional synaptic projections onto subplate neurons in neonatal rat somatosensory cortex. J Neurosci. 2002;22:7165–7176. doi: 10.1523/JNEUROSCI.22-16-07165.2002. [DOI] [PMC free article] [PubMed] [Google Scholar]
- Heynen AJ, Abraham WC, Bear MF. Bidirectional modification of CA1 synapses in the adult hippocampus in vivo. Nature. 1996;381:163–166. doi: 10.1038/381163a0. [DOI] [PubMed] [Google Scholar]
- Ismailov I, Kalikulov D, Inoue T, Friedlander MJ. The kinetic profile of intracellular calcium predicts long-term potentiation and long-term depression. J Neurosci. 2004;24:9847–9861. doi: 10.1523/JNEUROSCI.0738-04.2004. [DOI] [PMC free article] [PubMed] [Google Scholar]
- Kanold PO. Transient microcircuits formed by subplate neurons and their role in functional development of thalamocortical connections. NeuroReport. 2004;15:2149–2153. doi: 10.1097/00001756-200410050-00001. [DOI] [PubMed] [Google Scholar]
- Kanold PO, Kara P, Reid RC, Shatz CJ. Role of subplate neurons in functional maturation of visual cortical columns. Science. 2003;301:521–525. doi: 10.1126/science.1084152. [DOI] [PubMed] [Google Scholar]
- Kirkwood A, Bear MF. Elementary forms of synaptic plasticity in the visual cortex. Biol Res. 1995;28:73–80. [PubMed] [Google Scholar]
- Kirkwood A, Dudek SM, Gold JT, Aizenman CD, Bear MF. Common forms of synaptic plasticity in the hippocampus and neocortex in vitro. Science. 1993;260:1518–1521. doi: 10.1126/science.8502997. [DOI] [PubMed] [Google Scholar]
- Kisvarday ZF, Martin KA, Friedlander MJ, Somogyi P. Evidence for interlaminar inhibitory circuits in the striate cortex of the cat. J Comp Neurol. 1987;260:1–19. doi: 10.1002/cne.902600102. [DOI] [PubMed] [Google Scholar]
- Koester J, Alevizos A. Innervation of the kidney of Aplysia by L10, the LUQ cells, and an identified peripheral motoneuron. J Neurosci. 1989;9:4078–4088. doi: 10.1523/JNEUROSCI.09-11-04078.1989. [DOI] [PMC free article] [PubMed] [Google Scholar]
- Latsari M, Dori I, Antonopoulos J, Chiotelli M, Dinopoulos A. Noradrenergic innervation of the developing and mature visual and motor cortex of the rat brain: a light and electron microscopic immunocytochemical analysis. J Comp Neurol. 2002;445:145–158. doi: 10.1002/cne.10156. [DOI] [PubMed] [Google Scholar]
- Lee SH, Rosenmund C, Schwaller B, Neher E. Differences in Ca2+ buffering properties between excitatory and inhibitory hippocampal neurons from the rat. J Physiol (Lond) 2000;525:405–418. doi: 10.1111/j.1469-7793.2000.t01-3-00405.x. [DOI] [PMC free article] [PubMed] [Google Scholar]
- Lein ES, Finney EM, McQuillen PS, Shatz CJ. Subplate neuron ablation alters neurotrophin expression and ocular dominance column formation. Proc Natl Acad Sci USA. 1999;96:13491–13495. doi: 10.1073/pnas.96.23.13491. [DOI] [PMC free article] [PubMed] [Google Scholar]
- Levenes C, Daniel H, Crepel F. Retrograde modulation of transmitter release by postsynaptic subtype 1 metabotropic glutamate receptors in the rat cerebellum. J Physiol (Lond) 2001;537:125–140. doi: 10.1111/j.1469-7793.2001.0125k.x. [DOI] [PMC free article] [PubMed] [Google Scholar]
- Ling LL, Hughes LF, Caspary DM. Age-related loss of the GABA synthetic enzyme glutamic acid decarboxylase in rat primary auditory cortex. Neuroscience. 2005;132:1103–1113. doi: 10.1016/j.neuroscience.2004.12.043. [DOI] [PubMed] [Google Scholar]
- Lopez-Bendito G, Molnar Z. Thalamocortical development: how are we going to get there? Nat Rev Neurosci. 2003;4:276–289. doi: 10.1038/nrn1075. [DOI] [PubMed] [Google Scholar]
- Luskin MB, Shatz CJ. Studies of the earliest generated cells of the cat's visual cortex: cogeneration of subplate and marginal zones. J Neurosci. 1985;5:1062–1075. doi: 10.1523/JNEUROSCI.05-04-01062.1985. [DOI] [PMC free article] [PubMed] [Google Scholar]
- Martin KA. Microcircuits in visual cortex. Curr Opin Neurobiol. 2002;12:418–425. doi: 10.1016/s0959-4388(02)00343-4. [DOI] [PubMed] [Google Scholar]
- McQuillen PS, DeFreitas MF, Zada G, Shatz CJ. A novel role for p75NTR in subplate growth cone complexity and visual thalamocortical innervation. J Neurosci. 2002;22:3580–3593. doi: 10.1523/JNEUROSCI.22-09-03580.2002. [DOI] [PMC free article] [PubMed] [Google Scholar]
- Mechawar N, Cozzari C, Descarries L. Cholinergic Innervation in adult rat cerebral cortex: a quantitative immunocytochemical description. J Comp Neurol. 2000;428:305–318. doi: 10.1002/1096-9861(20001211)428:2<305::aid-cne9>3.0.co;2-y. [DOI] [PubMed] [Google Scholar]
- Miller B, Chou L, Finlay BL. The early development of thalamocortical and corticothalamic projections. J Comp Neurol. 1993;335:16–41. doi: 10.1002/cne.903350103. [DOI] [PubMed] [Google Scholar]
- Molnar Z, Adams R, Goffinet AM, Blakemore C. The role of the first postmitotic cortical cells in the development of thalamocortical innervation in the reeler mouse. J Neurosci. 1998;18:5746–5765. doi: 10.1523/JNEUROSCI.18-15-05746.1998. [DOI] [PMC free article] [PubMed] [Google Scholar]
- Monaghan DT, Larsen H. NR1 and NR2 subunit contributions to N-methyl-d-aspartate receptor channel blocker pharmacology. J Pharmacol Exp Ther. 1997;280:614–620. [PubMed] [Google Scholar]
- Montgomery JM, Madison DV. State-dependent heterogeneity in synaptic depression between pyramidal cell pairs. Neuron. 2002;33:765–777. doi: 10.1016/s0896-6273(02)00606-2. [DOI] [PubMed] [Google Scholar]
- Montgomery JM, Madison DV. Discrete synaptic states define a major mechanism of synapse plasticity. Trends Neurosci. 2004;27:744–750. doi: 10.1016/j.tins.2004.10.006. [DOI] [PubMed] [Google Scholar]
- Naegele JR, Barnstable CJ, Wahle PR. Expression of a unique 56-kDa polypeptide by neurons in the subplate zone of the developing cerebral cortex. Proc Natl Acad Sci USA. 1991;88:330–334. doi: 10.1073/pnas.88.2.330. [DOI] [PMC free article] [PubMed] [Google Scholar]
- Owen DG, Segal M, Barker JL. A Ca-dependent Cl− conductance in cultured mouse spinal neurons. Nature. 1984;311:567–570. doi: 10.1038/311567a0. [DOI] [PubMed] [Google Scholar]
- Perrett SP, Dudek SM, Eagleman D, Montague PR, Friedlander MJ. LTD induction in adult visual cortex: role of stimulus timing and inhibition. J Neurosci. 2001;21:2308–2319. doi: 10.1523/JNEUROSCI.21-07-02308.2001. [DOI] [PMC free article] [PubMed] [Google Scholar]
- Phillipson OT, Kilpatrick IC, Jones MW. Dopaminergic innervation of the primary visual cortex in the rat, and some correlations with human cortex. Brain Res Bull. 1987;18:621–633. doi: 10.1016/0361-9230(87)90132-8. [DOI] [PubMed] [Google Scholar]
- Philpot BD, Espinosa JS, Bear MF. Evidence for altered NMDA receptor function as a basis for metaplasticity in visual cortex. J Neurosci. 2003;23:5583–5588. doi: 10.1523/JNEUROSCI.23-13-05583.2003. [DOI] [PMC free article] [PubMed] [Google Scholar]
- Princivalle A, Regondi MC, Frassoni C, Bowery NG, Spreafico R. Distribution of GABAB receptor protein in somatosensory cortex and thalamus of adult rats and during postnatal development. Brain Res Bull. 2000;15:397–405. doi: 10.1016/s0361-9230(00)00256-2. [DOI] [PubMed] [Google Scholar]
- Reep RL. Cortical layer VII and persistent subplate cells in mammalian brains. Brain Behav Evol. 2000;56:212–234. doi: 10.1159/000047206. [DOI] [PubMed] [Google Scholar]
- Reep RL, Goodwin GS. Layer VII of rodent cerebral cortex. Neurosci Lett. 1988;90:15–20. doi: 10.1016/0304-3940(88)90779-3. [DOI] [PubMed] [Google Scholar]
- Robertson RT, Annis CM, Baratta J, Haraldson S, Ingeman J, Kageyama GH, Kimm E, Yu J. Do subplate neurons comprise a transient population of cells in developing neocortex of rats? J Comp Neurol. 2000;426:632–650. doi: 10.1002/1096-9861(20001030)426:4<632::aid-cne10>3.0.co;2-4. [DOI] [PubMed] [Google Scholar]
- Shah MM, Haylett DG. K+ currents generated by NMDA receptor activation in rat hippocampal pyramidal neurons. J Neurophysiol. 2002;87:2983–2989. doi: 10.1152/jn.2002.87.6.2983. [DOI] [PubMed] [Google Scholar]
- Shering AF, Lowenstein PR. Neocortex provides direct synaptic input to interstitial neurons of the intermediate zone of kittens and white matter of cats: a light and electron microscopic study. J Comp Neurol. 1994;347:433–443. doi: 10.1002/cne.903470309. [DOI] [PubMed] [Google Scholar]
- Sholl DA. Dendritic organization in the neurons of the visual and motor cortices of the cat. J Anat. 1953;87:387–406. [PMC free article] [PubMed] [Google Scholar]
- Spruston N, Jaffe DB, Williams SH, Johnston D. Voltage- and space-clamp errors associated with the measurement of electronically remote synaptic events. J Neurophysiol. 1993;70:781–802. doi: 10.1152/jn.1993.70.2.781. [DOI] [PubMed] [Google Scholar]
- Stocca G, Vicini S. Increased contribution of NR2A subunit to synaptic NMDA receptors in developing rat cortical neurons. J Physiol (Lond) 1998;507:13–24. doi: 10.1111/j.1469-7793.1998.013bu.x. [DOI] [PMC free article] [PubMed] [Google Scholar]
- Valverde F, Facal-Valverde MV. Postnatal development of interstitial (subplate) cells in the white matter of the temporal cortex of kittens: a correlated Golgi and electron microscopic study. J Comp Neurol. 1988;269:168–192. doi: 10.1002/cne.902690203. [DOI] [PubMed] [Google Scholar]
- Valverde F, Lopez-Mascaraque L, Santacana M, De Carlos JA. Persistence of early-generated neurons in the rodent subplate: assessment of cell death in neocortex during the early postnatal period. J Neurosci. 1995;15:5014–5024. doi: 10.1523/JNEUROSCI.15-07-05014.1995. [DOI] [PMC free article] [PubMed] [Google Scholar]
- Vandevelde IL, Duckworth E, Reep RL. Layer VII and the gray matter trajectories of corticocortical axons in rats. Anat Embryol (Berl) 1996;194:581–593. doi: 10.1007/BF00187471. [DOI] [PubMed] [Google Scholar]
- von Gersdorff H, Borst JG. Short-term plasticity at the calyx of held. Nat Rev Neurosci. 2002;3:53–64. doi: 10.1038/nrn705. [DOI] [PubMed] [Google Scholar]
- Wahle P, Meyer G. Morphology and quantitative changes of transient NPY-ir neuronal populations during early postnatal development of the cat visual cortex. J Comp Neurol. 1987;261:165–192. doi: 10.1002/cne.902610202. [DOI] [PubMed] [Google Scholar]
- Wang XQ, Deriy LV, Foss S, Huang P, Lamb FS, Kaetzel MA, Bindokas V, Marks JD, Nelson DJ. CLC-3 channels modulate excitatory synaptic transmission in hippocampal neurons. Neuron. 2006;52:321–333. doi: 10.1016/j.neuron.2006.08.035. [DOI] [PubMed] [Google Scholar]
- Wilson MA, Molliver ME. The organization of serotonergic projections to cerebral cortex in primates: regional distribution of axon terminals. Neuroscience. 1991;44:537–553. doi: 10.1016/0306-4522(91)90076-z. [DOI] [PubMed] [Google Scholar]
- Woo TU, Beale JM, Finlay BL. Dual fate of subplate neurons in a rodent. Cereb Cortex. 1991;1:433–443. doi: 10.1093/cercor/1.5.433. [DOI] [PubMed] [Google Scholar]
- Wood JG, Martin S, Price DJ. Evidence that the earliest generated cells of the murine cerebral cortex form a transient population in the subplate and marginal zone. Brain Res Dev Brain Res. 1992;66:137–140. doi: 10.1016/0165-3806(92)90150-u. [DOI] [PubMed] [Google Scholar]
- Zhou FM, Hablitz JJ. Layer I neurons of rat neocortex. I. Action potential and repetitive firing properties. J Neurophysiol. 1996;76:651–667. doi: 10.1152/jn.1996.76.2.651. [DOI] [PubMed] [Google Scholar]
- Zorumski CF, Thio LL, Clark GD, Clifford DB. Calcium influx through N-methyl-d-aspartate channels activates a potassium current in postnatal rat hippocampal neurons. Neurosci Lett. 1989;99:293–299. doi: 10.1016/0304-3940(89)90462-x. [DOI] [PubMed] [Google Scholar]