

Abstract
The inferior frontal cortex, particularly the ventrolateral prefrontal cortex (VLPFC) in the right hemisphere, has been implicated to serve as a general inhibitory mechanism in the cognitive control of behavior. Because this notion was primarily based on studies of response inhibition in manual tasks, it has yet to be validated in other response modalities. We conducted a functional magnetic resonance imaging study to examine whether the VLPFC is commonly activated during inhibition of responses by hand and by eye within the same subjects. We used the stop-signal task, a relatively pure measure of response inhibition, as the behavioral paradigm. Results from 12 subjects showed that both the right and the left caudal VLPFC and anterior insula, rostral to the premotor area, are activated during inhibition of both manual and saccadic responses. Within the posterior VLPFC, activations overlapped to a significant extent across the two response modalities, although a weaker functionally differentiation was also found along the dorsoventral axis. Other areas such as medial superior frontal gyrus (pre-supplementary motor area/supplementary eye field), dorsolateral prefrontal cortex, and inferior parietal cortex were also activated during canceling both hand and eye movements. Our findings suggest that a common VLPFC network is involved in response inhibition, although the specific control of the different response modalities may be partially segregated within the lateral prefrontal cortex.
Keywords: inferior frontal gyrus, insula, motor, oculomotor, cognitive control, countermanding, stop-signal task, human
Introduction
The lack of inhibitory control or disinhibition has been considered a hallmark of patients with frontal lobe damage (Shallice and Burgess, 1993, 1996). To study the neural substrates underlying inhibitory control, researchers have applied the stop-signal paradigm (Logan et al., 1984), of which canceling a planned response is required on the presentation of an external cue. Using this paradigm, a recent study of patients with damages to the frontal lobes indicated that the right inferior frontal gyrus (IFG) or ventrolateral prefrontal cortex (VLPFC) is critical for response inhibition (Aron et al., 2003). They found that the deficit on performing the stop-signal task was strongly correlated with the size of damage involving the right IFG but not with that of the left IFG. The application of transcranial magnetic stimulation (TMS) to the right IFG also produced a temporary reduction in performance on the stop-signal task, whereas little effect was observed when stimulating other right hemispheric regions (Chambers et al., 2006); however, they did not examine the left IFG. In neuroimaging studies, activation of the right IFG is usually observed in response inhibition tasks such as the stop-signal task (Rubia et al., 2001) and go/no-go task (Garavan et al., 1999; Konishi et al., 1999), as well as in cognitive control tasks requiring inhibitory processes such as the Wisconsin Card Sorting Task (WCST) (Nagahama et al., 2001) and the flanker task (Hazeltine et al., 2000).
Combining findings from neuroimaging and patient studies, the right IFG has been postulated to serve as a general inhibitory mechanism for controlling goal-directed behavior (Konishi et al., 1999; Aron et al., 2004). There are at least three observations challenging the specificity of right IFG in inhibitory control. First, the left IFG and other frontal and parietal regions are often activated along with the right IFG during response inhibition in neuroimaging studies (Wager et al., 2005). Second, an area near the junction of inferior frontal sulcus and precentral sulcus (IFJ) has also been suggested to play a central role in cognitive control tasks (e.g., Stroop) (Derrfuss et al., 2005). Third, studies of nonhuman primates and humans have demonstrated that the frontal eye fields (FEF) and supplementary eye fields (SEF) exhibit activity patterns related to the process of stopping saccadic eye movements (Hanes et al., 1998; Stuphorn et al., 2000; Curtis et al., 2005). Perhaps the oculomotor system has its own inhibitory control mechanism, although it is also possible that the SEF and FEF receive inhibitory commands from the lateral prefrontal areas.
Because the implication of the right VLPFC as a general inhibitory control is almost exclusively based on data from studies involving only manual responses, it has yet to be validated in other response modalities (e.g., oculomotor). We recorded blood oxygenation level-dependent (BOLD) responses in human participants while they performed a manual and a saccade version of the stop-signal task. We applied both group and single-subject analyses to determine whether or not the VLPFC is commonly involved in inhibiting both hand and eye movements.
Materials and Methods
Subjects
Fifteen healthy young adults were recruited from the university campus and the psychology subject pool, none with a history of neurological, psychiatric, and addictive disorders according to self-report. Three subjects were excluded from analysis because of excessive head motion. Data from the remaining 12 subjects (six men and six women, aged between 19 and 28 years) were included in this report. All participants have normal or corrected-to-normal vision. Only right-handed individuals participated in the experiment. Their handedness scores were between 0.79 and 1, which were assessed by the Edinburgh scale (Oldfield, 1971). All participants provided written consent approved by the local Institutional Review Board.
Behavioral tasks
Manual and saccade stop-signal task.
The stop-signal paradigm, also called the countermanding paradigm or the go–stop task, was originally developed by Logan (for review, see Logan et al., 1984). Because the stop signal is presented after the go signal in the stop-signal paradigm, it ensures that the response has been initiated before it is inhibited; this may not be the case in other common response inhibition paradigms such as the go/no-go, antisaccade, and flanker tasks. The go/no-go task requires the subject to respond to the target stimulus and not respond to the nontarget stimulus, the antisaccade task requires the subject to generate movements opposite to the direction of the target, and the flanker task requires the subject to respond to a stimulus that is incompatible with the response associated with nearby distracters. These latter tasks involve additional cognitive processes, including stimulus discrimination, response selection/switch, and planning. The stop-signal paradigm has been applied recently in functional magnetic resonance imaging (fMRI) research for studying a relatively pure form of response inhibition (Rubia et al., 2001, 2003; Aron and Poldrack, 2006; Li et al., 2006).
In the present experiment, the stop-signal tasks consisted of go trials and stop trials (see Fig. 1A,B). Each trial was 3 s long. On each trial, after an initial fixation period, a plus sign (go signal) was displayed on either the left or the right side of the screen at ∼10° of eccentricity from the central fixation. On ∼30% of the trials, a circle (stop signal) was displayed for 300 ms at the center shortly after the presentation of the go signal. Subjects were instructed to respond as fast as possible to the go signal and try their best to cancel the planned response on the appearance of the stop signal. A stop was considered successful if subjects made no response during a 1 s time window. The stop-signal delay (SSD), the delay between the go signal and stop signal, was defined individually using their behavioral data from a training session before scanning (see below). The stop-signal reaction time (SSRT) for each subject was estimated by applying the race model (Logan et al., 1984): SSRT = T − mean SSD, where T is the point when the integral of the observed distribution of go reaction times (RTs) equals the probability of unsuccessful stop.
Figure 1.

Stop-signal paradigm and cortical activations during stopping hand and eye movements. A, Visual events were the same for go trials and stop trials of the manual and saccade stop-signal tasks. The appearance of a peripheral target (go signal) indicates whether to make a left or a right response, whereas the appearance of a circle (stop signal) at the center shortly after the go signal indicates that the planned response should now be canceled. B, Timing of visual events during a stop trial. SSD is the interval between the go and stop signal. SSD was assigned individually to equate performance across response modalities and across subjects. C, Activations corresponding to manual response inhibition (red) and hand motor control (green) are shown on the right and left hemispheres of the rendered MNI single-subject brain. D, Activations corresponding to saccade inhibition (red) and saccade control (green). E, Activations corresponding to manual response inhibition (blue) and saccade inhibition (red) and their overlap (whiter color). White circles mark the locations of overlapping activations in the ventral IFG. For the exact locations of the overlapped activations, refer to Figure 2 and Table 1. F, IFG subdivisions in the right hemisphere: cyan area, pars opercularis; magenta area, pars triangularis; orange area, pars orbitalis. The central sulcus (CS) is traced with a blue line. Note that activations for response inhibition in each response modality were derived from stop–go contrast, whereas activations for hand motor and saccade control were derived from hand/saccadic responses relative to the fixation baseline. Threshold is p < 0.001 (uncorrected, cluster size of at least 9).
Each subject performed three runs of the manual version and three runs of the saccade version of the stop-signal task during scanning. In the manual stop-signal task, subjects responded by pressing the left or the right button in correspondence with the side of the go signal. In the saccade stop-signal task, subjects responded by making a leftward or a rightward saccade to the go signal. The sequences of go and stop trials were randomly generated using the “optseq” algorithm, which was designed to increase the sensitivity of detecting changes in BOLD signal across task conditions (Dale, 1999) (http://surfer.nmr.mgh.harvard.edu/optseq). Each sequence (a run) had 46 go trials, 20 stop trials, and 36 null events (in multiples of 1.5 s). Null events were intertrial intervals, during which subjects simply fixated at the center of the screen and made no responses. The inclusion of null events between task trials also made the onset of task trials unpredictable. The interval between go signals ranged between 3 and 7.5 s (average of 3.81 s). Each run was finished with a blank period (21 s) after the presentation of the last visual stimulus. The central fixation was displayed on the screen the whole time, and the subjects were told to maintain their fixation.
Hand motor and oculomotor control tasks.
Control tasks were conducted for identifying the hand motor and oculomotor regions functionally for each individual. Each subject performed one run of each control task. During the motor control run, subjects pressed a button twice with their left or right thumb in correspondence with the onset of a checkerboard on the left and right side of the central fixation. During the oculomotor control run, subjects made double-step saccades to two dots appeared on either the left or the right side of the central fixation. The visual stimuli were randomly displayed on the left/right side of the screen, and the interstimulus interval was between 3 and 10.5 s (average of 4.83 s).
Procedure and apparatus
To avoid practice effects, each subject was trained on both the manual and the saccade stop-signal tasks on the day before scanning for ∼1.5 h. Each subject practiced the stop-signal tasks with four different SSDs: 50, 100, 200, and 300 ms for the manual version and 50, 80, 150, and 220 ms for the saccade version. By linear interpolation using the training data, a short SSD and a long SSD were selected for each stop-signal task to be used for each individual in the scanning session. The purpose was to equate task performance across the two response modalities and across subjects to achieve an accuracy of 80 and 60% for the short and the long SSD conditions, respectively. Applying two SSDs was also for reducing habituation over the course of scanning and for better matching of performance.
To access performance on oculomotor inhibition, subjects completed a postscanning session on the same saccade stop-signal task that they performed inside the magnet. Eye position was monitored and recorded outside of the magnet using the Eyelink II eye tracker (SR Research, Osgoode, Ontario, Canada). The sampling rate was 500 Hz. The average gaze position error was <0.5° (with noise limited at <0.01° root mean square). Visual stimuli were presented on the computer screen, and subjects were positioned with their head on a chin rest (which was 69 cm away from the screen). Each subject completed a calibration procedure before every experimental block. Saccades were determined using initial velocity (>35°/s) and acceleration (>9500°/s2).
Visual stimuli were rear projected onto a screen positioned at the back of the magnet bore opening. Subjects viewed the visual display through a mirror mounted on the head coil. Visual presentation was controlled, and response data were recorded with “E-prime” (Psychology Software Tools, Pittsburgh, PA), running on a personal computer (PC) with the Windows XP operating system (Pentium 4, Dell Dimension 5100; Dell Computer Company, Round Rock, TX). A response box with four buttons interfaced with the PC through the parallel port was used for collecting manual responses. Visual stimulus presentation was synchronized with image acquisition through a digital interface. All visual stimuli were orange in color against a black background.
Image acquisition and protocol
Whole-brain images were acquired using a Philips (Cleveland, OH) 3 T Achieva system with an eight-channel head coil. Head movement was minimized using foam padding and a tape across the forehead. The following scanning protocols were used to collect images. First, a series of three-plane localizer images was acquired followed by a series of high-resolution structural images [T1-weighted three-dimensional turbo field echo; 176 sagittal slices; slice thickness, 1 mm; repetition time (TR), 9.9 ms; echo time (TE), 4.6 ms; matrix, 256 × 256; field of view (FOV), 25 × 25 cm]. A series of T1-weighted in-plane structural images was acquired parallel to the anterior–posterior commissural (AC–PC) line (24 axial slices; slice thickness, 5 mm; TR, 300 ms; TE, 5.0 ms; matrix, 256 × 256; FOV, 22 × 22 cm). Subsequently, eight series of functional images were acquired along the same AC–PC plane using a standard T2*-sensitive echo planar pulse sequence (24 axial slices; 5 mm thick, interleaved; TR, 1500 ms; TE, 30ms; matrix, 64 × 64; FOV, 22 × 22 cm; flip angle, 80°). Four image volumes were discarded at the beginning of each series to allow the MR signal to reach equilibrium. For each subject, we collected 182 volumes/session (273 s) for three sessions for the stop-signal task in each response modality and 162 volumes (243 s) for each control task.
Image processing
All images were processed with SPM2 (Welcome Department of Imaging Neuroscience, University College London, London, UK; http://www.fil.ion.ucl.ac.uk/spm/) and Matlab (version 6.0; MathWorks, Natick, MA). DICOM (Digital Imaging and Communications in Medicine) images were converted into the analyzed image format with MRIcro (http://www.sph.sc.edu/comd/rorden/mricro.html). Images from each individual were first screened for obvious artifacts such as ghosting and motion. Images were oriented to approximately the same direction followed by correcting the acquisition time delay between the slices. Images were realigned relative to the first volume of the middle run; runs with images of >3 mm of translational motion and 2° of rotational motion were removed from additional analysis. Data from the 12 subjects were all within the motion criteria, so none of the runs was removed. The in-plane and high-resolution anatomical images were segmented (into gray and white matter) and coregistered with the mean functional image. All images were then normalized to the Montreal Neurological Institute (MNI) gray matter template, using a 12-parameter affine registration followed by a series of nonlinear transformations (Friston et al., 1995). The functional images were subsequently resampled to 3 × 3 × 3 mm voxel size and spatially smoothed with a Gaussian kernel of 8 mm full-width at half-maximum. The data were high-pass filtered with a cutoff of Hz to remove low-frequency drifts.
Image analysis
We applied both voxel-by-voxel analysis (SPM2) and regions of interest (ROIs) analysis to analyze the imaging data. For the voxel-by-voxel analysis, a design model was constructed for the stop-signal task in each response modality using the onset times of the four task conditions: left go, right go, left stop, and right stop. Each event vector was convolved with a canonical hemodynamic response function and used as a regressor (Friston et al., 1995). (Because we did not find differences in activation comparing the left and right responses, those data were combined for the analysis and results described below.) Estimated parameters of the regressors (beta weights) were calculated for each voxel using the general linear model. Random effects analysis was applied to test for statistical differences between conditions for the group. To reduce the probability of type 1 error, a combination of significance threshold (p < 0.001, uncorrected) and cluster filter (nine contiguous voxels) was applied to reveal activation clusters in the group maps (Forman et al., 1995; Poline et al., 1997). The coordinates were reported according to the MNI system (http://imaging.mrc-cbu.cam.ac.uk/imaging/MniTalairach). We first used t tests to identify regions involved in response inhibition in each response modality by contrasting the stop versus the go conditions. Motor, oculomotor, and visual-related activations were identified as references using data from the control tasks. It is important to confirm that our findings could not be simply attributed to the sensory and motor effects. To identify common activations across response inhibition in both modalities, we applied the conjunction analytic procedures to determine activations that were above threshold in both saccade and manual stop–go contrasts (Friston et al., 2005; Nichols et al., 2005). We also tested whether the brain regions involved in response inhibition show modality-specific effects by directly comparing the stop–go contrasts of the saccade and manual data. A lower threshold was applied on the direct contrasts because of the double subtraction (p < 0.01, uncorrected), and the results were masked by the stop–go contrast (p < 0.001 uncorrected and cluster size of at least nine). For example, the saccade stop–go contrast was applied to limit the search for regions that show greater activity in canceling saccades than in canceling manual responses and vice versa for the manual data.
We applied ROI analysis to assess the statistical significance of activations within the VLPFC in correspondence with inhibition of hand and eye movements. Four anatomical ROIs were defined: the three subdivisions of IFG (pars opercularis, pars triangularis, and pars orbitalis) and the combined whole (see Fig. 1F). These anatomical ROIs were defined anatomically using AAL (WFU_PickAtlas by Advanced Neuroscience Imaging Research Lab, Winston-Salem, NC; http://www.fmri.wfubmc.edu/download.htm) and were used for confirming whether an activated cluster is within the anatomical boundary of IFG and, if so, in which subdivision. Functional ROIs were defined using the activation clusters from the conjunction analysis and from the direct comparison of saccade stop–go and manual stop–go contrasts. ROI data from each subject were extracted using Marsbar (Brett et al., 2002) (http://marsbar.sourceforge.net/).
We conducted two sets ROI analysis to determine the extent of activation overlap and segregation within the IFG during inhibition of hand and eye movements. First, for each functional ROI, we applied paired t tests to determine whether the beta weights from the stop–go contrasts are significantly different across the two response modalities (see Figs. 2, 3). We also calculated the correlation between beta weights and stop-signal performance (SSRT) of each response modality. Second, for each individual, we located the largest suprathreshold cluster with significant local maxima within the anatomically defined IFG in the stop–go contrast map of each response modality (t > 3; cluster size more than three). We further limited the search to the ventral part of IFG as opposed to the more dorsal IFJ, because the former is usually activated in stop-signal tasks whereas the latter is usually activated in other cognitive control tasks (see Introduction). The IFJ is between 27 and 40 mm in the z direction (for review, see Derrfuss et al., 2004); we therefore defined ventral IFG as the area below z = 27 mm. We applied paired t tests to assess differences between the two response modalities in terms of both location (coordinates) and magnitude (beta weights). Similar results were obtained when using the peak voxel.
Figure 2.

Common activations in response inhibition. A, Suprathreshold activations were localized in the ventral IFG/insula in both manual and saccade stop–go contrast (p < 0.001, uncorrected). Common activations were also found in the MFG and medial SFG (see Table 1). Numbers indicate the y-coordinates in millimeters of the coronal slices. L, Left; R, right. B, Same results are shown on the lateral surface of the right and left hemispheres of the rendered MNI single-subject brain. C, Average beta values of the right IFG (RIFG) and left IFG (LIFG) clusters (in A) reveal similar level of activation in inhibiting hand and eye movements. Beta values are the parameter estimates of the SPM model (in arbitrary units). Error bars indicate the SEM.
Figure 3.
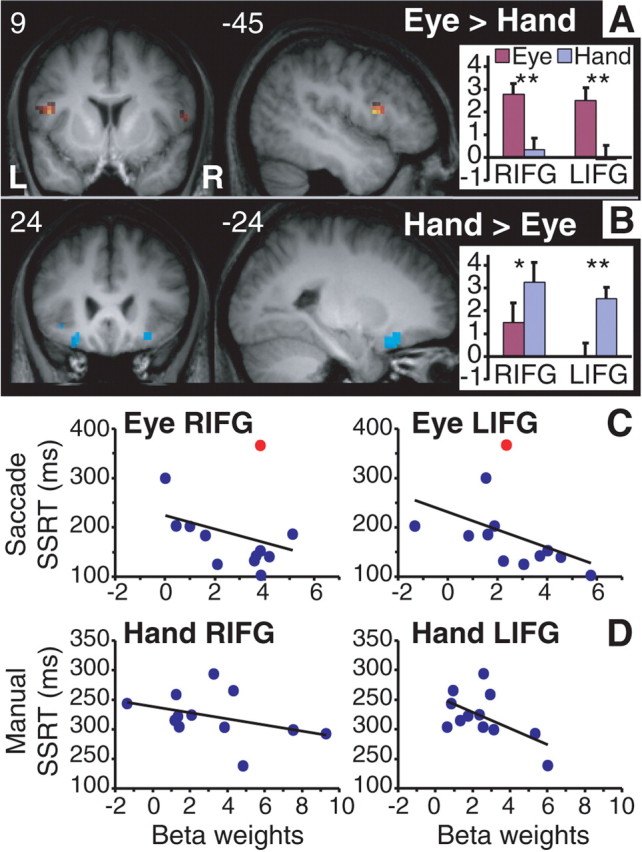
Differential activations in ventral IFG in response inhibition. A, A more dorsal part of the IFG showed stronger activity in inhibiting eye movements relative to inhibiting hand movements. B, A more ventral part of the IFG showed stronger activity in inhibiting hand movements relative to eye movements. Activation data shown in A and B (p < 0.01, uncorrected; cluster size of at least 9) are masked, respectively, by the saccade and the manual stop–go contrast. See Table 1. Insets on the right show the corresponding bar charts of the average beta values and SEs of the activation clusters (extracted from the maps on the left) for each response modality. The number on the left corner of each slice indicates the y-coordinates for coronal slices and x-coordinates for sagittal slices. L, Left; R, right; paired t tests, *p < 0.02, **p < 0.002. C, Scatter plots of saccade SSRT (y-axis) and beta weights (x-axis) for the right (RIFG) and left (LIFG) activation clusters (in A) across all subjects. The red dot indicates the subject whose SSRT in the saccade stop-signal task was 2 SDs from the mean. D, Scatter plots of manual SSRT (y-axis) and beta weights (x-axis) for the activation clusters (in B) across all subjects. Note that shorter SSRT is associated with higher fMRI signal in all the plots. For r2 values, see Results.
Results
Behavioral results
High behavioral performance was observed on go trials in the manual stop-signal task during scanning (mean ± SD; accuracy, 98 ± 5%; RT, 453 ± 86 ms) and in the postscanning saccade stop-signal task (accuracy, 95 ± 10%; RT, 293 ± 64 ms). (Eye movements were only recorded outside of the magnet.) The mean accuracy of the group on stop trials in the manual and saccade stop-signal tasks was 70 ± 18% (short SSD, 83 ± 12%; long SSD, 57 ± 27%) and 68 ± 23% (short SSD, 69 ± 23%; long SSD, 67 ± 23%), respectively, indicating that the overall stop performance was equated across the two response modalities. The mean SSRT was 222 ± 41 ms for the manual task and 186 ± 77 ms for the saccade task, with the difference between them approaching significance (t(11) = 1.75; p = 0.11, two-tail paired t test). The difference in SSRT between the two response modalities was expected according to a previous study (Logan and Irwin, 2000).
Cortical activations during manual and saccade stop-signal tasks
Group stop–go contrast maps showed greater activations in both lateral and medial prefrontal cortexes during canceling hand and eye movements relative to executing the movements (Fig. 1C,D). These prefrontal activations were mostly anterior to the motor- and oculomotor-related activations (i.e., primary motor, premotor, and FEF) identified by the control tasks. Within the inferior frontal cortex of both hemispheres, posterior IFG and anterior insula showed greater activity in response to the stop signal than to the go signal in both manual and saccade stop-signal tasks. Figure 1E displays the overlap and the partial segregation of activation in the IFG across the two response modalities (see below). Aside from the IFG/insula, several regions, including the medial superior frontal gyrus (SFG), anterior cingulate cortex [Brodmann's area (BA) 32], dorsolateral PFC (BA 10/46), middle temporal gyrus (BA 19/21), and inferior parietal lobe (IPL) (BA 40), showed stronger activity on stop trials than on go trials during the manual stop-signal task (p < 0.05, corrected at cluster level). The dorsolateral PFC (BA 46) and medial SFG showed stronger activity on stop trials than on go trials during the saccade stop-signal task (p < 0.05, corrected at cluster level). Unlike previous findings of greater IFJ activity in cognitive control tasks (Derrfuss et al., 2004), suprathreshold activity in this area was not evident in the stop–go contrast in either response modality. We therefore did not further analyze this region.
Overlap in activation within the IFG during inhibition of hand and eye movements
We applied conjunction analysis to identify cortical regions that were significantly activated in both stop-signal tasks. A voxel was considered conjunctively activated in canceling manual and saccadic responses if it was suprathreshold in the stop–go contrast of both response modalities (p < 0.001, uncorrected). Figure 2 shows the regions that are conjunctively activated during response inhibition in both modalities, and their coordinates are listed in Table 1(top half). The main cluster of conjunctive activation was in the posterior IFG/insula (p < 0.05, corrected), and it was more extensive in the right than in the left hemisphere. The activation in IFG extended across the three subdivisions of the IFG, although mostly in the pars triangularis and pars orbitalis (refer to Fig. 1F and methods for anatomical definitions). ROI analysis confirmed that these activations do not differ significantly between inhibition of eye and hand movements (F < 1). The activation in the right IFG was stronger than that in the left IFG (F(1,11) = 8.66; p < 0.02). [The hemisphere by response modality interaction was not significant (F < 1).] Furthermore, suprathreshold activations in both stop–go contrasts were observed in the medial SFG [pre-supplementary motor area (SMA)/SEF], the right middle frontal gyrus, and the right IPL.
Table 1.
Results from conjunction analysis and direct contrast between saccade and manual inhibition [eye (stop–go) versus hand (stop–go)]
| Region | BA | Cluster size | x | y | z | T | Z |
|---|---|---|---|---|---|---|---|
| Conjunction | |||||||
| Right insula | 178 | 30 | 18 | 3 | 6.03 | 4.59 | |
| Right IFG | 47 | 42 | 18 | −6 | 5.50 | 4.32 | |
| Left IFG | 47 | 119 | −42 | 12 | −6 | 5.74 | 4.44 |
| Left insula | −27 | 21 | 3 | 5.38 | 4.25 | ||
| Medial SFG | 8 | 53 | 9 | 18 | 54 | 6.19 | 4.66 |
| Right MFG* | 10/46 | 35 | 36 | 48 | 21 | 4.61 | 3.81 |
| Right IPL* | 40 | 31 | 57 | −45 | 45 | 4.02 | 3.44 |
| Eye > hand | |||||||
| Left IFG | 44/6 | 17 | −45 | 6 | 12 | 5.27 | 3.65 |
| −54 | 3 | 15 | 4.50 | 3.32 | |||
| Right IFG* | 45/44 | 16 | 45 | 18 | 12 | 3.66 | 2.90 |
| 44 | 54 | 15 | 9 | 3.13 | 2.59 | ||
| Hand > eye | |||||||
| Left IFG* | 47 | 14 | −24 | 24 | −21 | 4.46 | 3.30 |
| −27 | 15 | −15 | 3.06 | 2.55 | |||
| 9 | −39 | 21 | −9 | 3.44 | 2.77 | ||
| Right IFG* | 47 | 10 | 30 | 24 | −15 | 3.24 | 2.66 |
For the direct contrasts, ″Eye > hand″ result was masked with the stop–go contrast for the saccade task, whereas ″Hand > eye″ result was masked with the stop–go contrast for the manual task. T values, Z values, and MNI coordinates (x, y, z in mm) of the activation peaks in the clusters are listed. Unless otherwise stated, all local maxima were significant after corrected for false discovery rate (p ≤ 0.05). Eye, Saccade inhibition; Hand, manual inhibition. *p < 0.13 (false discovery rate), approaching significance.
Segregation in activation within the IFG during inhibition of hand and eye movements
Although the IFG was commonly activated in both tasks, there was some degree of segregation within the ventral IFG for inhibiting manual responses versus inhibiting saccades (Fig. 1E). Differential activation in the IFG across response modalities was revealed by a direct comparison of the manual and saccade stop–go contrasts. Only regions that showed suprathreshold activation in each individual stop–go contrast were subjected to the direct contrast. A more dorsal and posterior part of IFG (mostly pars opercularis) showed stronger activity during canceling eye movements than hand movements, whereas a more ventral and anterior part of IFG (pars orbitalis) showed the opposite pattern (Fig. 3A,B; Table 1, bottom half). Even at a lower threshold (p < 0.05, uncorrected), both pars triangularis and pars opercularis did not show greater activity in manual response inhibition, whereas pars orbitalis did not show greater activity in saccade inhibition relative to each of their counterparts. This dorsoventral relationship was observed for both hemispheres, although the segregation in the right IFG was only revealed at a lower threshold (p < 0.01, uncorrected). ROI analysis confirmed that the modality-specific effects in IFG are significant in both hemispheres (p < 0.02 for all comparisons) (Fig. 3A,B, insets) (for other regions that showed modality-specific effects, see supplemental data, available at www.jneurosci.org as supplemental material). To further confirm this observation, we calculated the correlation between stop-signal performance (estimated SSRT) and beta values for the four IFG activation clusters shown in Figure 3. Results from the regression analysis showed that activity of the right (r2 = 0.09; p = 0.35) and the left (r2 = 0.19; p = 0.15) IFG activation clusters (saccade inhibition > manual inhibition) in Figure 3A correlate negatively with SSRT for stopping saccades (Fig. 3C). [The r2 values were 0.46 (p = 0.02) and 0.39 (p = 0.04), respectively, for the right and the left IFG after removing the subject whose SSRT was 2 SDs away from the mean SSRT of the saccade stop-signal task.] Conversely, these two IFG clusters for saccade inhibition did not show significant correlation with SSRT for stopping hand movements (both with r2 < 0.2 and p > 0.15). Moreover, the IFG activation clusters (manual response inhibition > saccade inhibition) in Figure 3B correlate negatively with SSRT for stopping manual responses (Fig. 3D) (right IFG, r2 = 0.14, p = 0.22; left IFG, r2 = 0.33, p = 0.05). Conversely, these two IFG clusters for manual inhibition did not show significant correlation with SSRT for stopping eye movements even after removing the outlier (both with r2 < 0.1 and p > 0.4).
We further conducted single-subject ROI analysis to determine whether the activation loci within the IFG are spatially segregated across the two inhibition conditions. We applied a relatively stringent threshold to the stop–go contrast of each response modality to identify the activation cluster within the ventral IFG of each individual. Three subjects did not show activations in the right IFG and two not in the left IFG at this threshold setting. Figure 4 illustrates the distribution of the individual activation loci within the ventral IFG on a coronal slice centered at the mean y-coordinate. The activation loci in the right IFG of the two response modalities were marginally significantly separated along the x- and z-axes (t(8) = 2.31; p = 0.05). Activation loci in the left IFG were significant separated along the z-axis (t(9) = 4.21; p = 0.002). Thus, for both the left and the right IFG, activations during manual response inhibition in individual subjects were more ventral compared with activations during saccade inhibition. Correspondingly, the average signal changes of the group (beta weights at the activation loci) were significantly different for inhibiting movements across the two response modalities (all p values <0.05).
Figure 4.

The coronal image on the left shows the activation loci within the ventral IFG of individual subjects for inhibition of eye movements (magenta circles) and hand movements (cyan pluses). The bar charts on the right show the average x-, y-, and z-coordinate values in millimeters for the right IFG (RIFG) and left IFG (LIFG). The x-coordinate values of the LIFG are plotted as positive values. *p = 0.05, **p = 0.002. L, Left; R, right.
Discussion
It has been implicated that the right VLPFC is critical for inhibitory control of behavior (Aron et al., 2004). Here we delineated activations within the posterior VLPFC in both hemispheres for stopping hand and eye movements in the same group of subjects. Our results showed that the activations in IFG of both hemispheres overlapped to a significant extent during response inhibition across the two modalities. In addition, our results showed a more ventral activation during stopping manual responses compared with a more dorsal activation of IFG during stopping saccades.
Common inhibitory mechanism
Our data showed that the posterior and ventral part of the VLPFC (and insula) in both hemispheres are commonly involved in response inhibition across the hand-motor and oculomotor systems. This finding thus lends support to the hypothesis of VLPFC serving as a common inhibitory mechanism in cognitive control (Konishi et al., 1999; Aron et al., 2004). In addition, the apparent greater overlap in activation in the right VLPFC compared with the left VLPFC supports the right-dominance theory of response inhibition. The hemispheric differences in activity were significant in the present study for response inhibition in both modalities. Konishi et al. (1999) have demonstrated previously that the greater no-go than go activation in the right VLPFC is independent of the responding hand. Ideally, we would conduct the same analysis, except we did not have enough statistical power for such comparisons under the current design.
The loci of common activations in the present study do not coincide with IFJ, the region that is commonly involved in numerous cognitive control tasks, including the task switching paradigm and the Stroop task (Derrfuss et al., 2004). At lower thresholds, the IFG activation in the present study does spread to cover the IFJ. In contrast, the common activations in bilateral VLPFC/insula in the present study are very close, within 8 mm in all directions, to the areas identified in a recent study as the “core” regions for implementing general task control (called “task set”) across a variety of 10 cognitive tasks (Dosenbach et al., 2006). The only other core region that they identified is in the medial superior frontal cortex, which is also within the 8 mm range from the part of medial SFG activated in both of our stop-signal tasks. Response inhibition tasks were not included in the study by Dosenbach et al. Our findings thus provide additional evidence that these two prefrontal regions are involved in supporting common control mechanisms across two major output modalities.
VLPFC and inhibition of manual responses
The activation of VLPFC and insula during inhibiting manual responses is consistent with previous findings. Previous lesion studies in animals have first demonstrated that the inferior prefrontal cortex has a critical role in inhibiting unwanted arm movements (Iversen and Mishkin, 1970). Although recent lesion and TMS data strongly suggested that the right VLPFC is important for response inhibition in humans (Aron et al., 2003; Chambers et al., 2006), fMRI data showed that VLPFC in both hemispheres as well as other frontal and parietal regions are involved in inhibition of manual responses (Garavan et al., 1999, Rubia et al., 2003; Li et al., 2006). In fact, numerous activation peaks were evident within the lateral PFC in both hemispheres as revealed by a recent meta analysis of neuroimaging data from previous studies of the WCST and the go/no-go task (Buchsbaum et al., 2005). The variation in activation loci within the VLPFC could be a result of variation in task performance (e.g., successful and unsuccessful stop) and task parameters (e.g., differences in visual cues and response demands). It has been shown that the VLPFC is related with successful response inhibition (Rubia et al., 2003), and its activity is modulated by the number of preceding go trials (Durston et al., 2002). Besides, an electrophysiology study has demonstrated that neurons in the VLPFC differentiate between no-go cues (color vs motion) for guiding the upcoming no-go responses (Sakagami et al., 2001). Furthermore, comparing activations during the stop-signal task and the sensorimotor control task, our data showed that the caudal VLPFC is more active during canceling an intended response, whereas the ventral premotor area is primarily active during the mapping of sensorimotor responses. Our findings thus support the notion that response control is organized along the rostrocaudal axis of the lateral PFC, as suggested by Petrides (2005).
VLPFC and inhibition of saccades
Our results indicated that the activation of VLPFC in canceling saccades is anterior to the activation of FEF and the ventral premotor cortex in executing saccades. The control of saccadic eye movements is commonly associated with the anterior arcuate regions (FEF) in monkeys (Goldberg and Segraves, 1989), and a homolog has been defined in the human brain (Paus, 1996). However, there has been no clear evidence from the literature suggesting that the VLPFC is involved in the cognitive control of eye movements until very recently. In an electrophysiology study of nonhuman primates, Hasegawa et al. (2004) showed that neurons in the caudal VLPFC anterior to the FEF exhibit activity that is selective to unwanted stimuli and perhaps coding the signal for inhibiting unwanted eye movements. A recent fMRI study first showed that the right VLPFC (and insula) along with SEF and FEF is activated during an oculomotor task requiring subjects to make decisions on whether or not to execute a saccade (Heinen et al., 2006). These investigators demonstrated that the VLPFC, unlike SEF and FEF, is more active during the decision making process rather than the actual planning or generation of saccades. Compared with the activation in VLPFC during saccade inhibition in our study, the coordinates of the activation in the study by Heinen et al. was at approximately the same z-level but was more medial (mean locus of six subjects, x = 29, y = 23, z = 7). Furthermore, although the activation of VLPFC has rarely been shown in neuroimaging studies of antisaccade, a study using a modified antisaccade task that assimilates the typical go/no-go design have found enhanced activity in the VLPFC in an antisaccade condition compared with a matched prosaccade condition (Chikazoe et al., 2007). They reported a ventral and a more dorsal locus in VLPFC, which matches the conjunction and saccade-related activation in the present study, respectively. Our results therefore provide novel evidence showing that a part of the caudal VLPFC in the human brain, dorsal to the part involved in manual response inhibition, may be particularly involved in mediating saccade inhibition.
Activations in other cortical areas during response inhibition
Other cortical regions, including the dorsolateral PFC, pre-SMA/SEF, and IPL, were also active during canceling movements in both response modalities. It has been implicated that the dorsolateral PFC plays a critical role in oculomotor control (Pierrot-Deseilligny et al., 2005), working memory (Goldman-Rakic, 1987), and more generally in the cognitive control of behavior (Miller and Cohen, 2001). Previous neuroimaging studies of manual response inhibition have observed greater activity in the dorsolateral PFC and IPL corresponding to no-go responses than go responses (Wager et al., 2005). The inhibition of prepotent saccades, as shown by studies of antisaccade performance, has also been associated with the functions of dorsolateral PFC (Munoz and Everling, 2004). Compared with the stop-signal paradigm, the antisaccade task requires visuospatial transformation as well as response selection and reprogramming, which may be the functions of dorsolateral PFC. Indeed, others have suggested that the dorsolateral PFC is associated with response selection, guiding by spatial working memory (Rowe et al., 2000). Here, we found an apparently greater activation in the dorsolateral PFC during stopping saccades compared with stopping manual responses.
In summary, our results revealed both common and differential activations within the posterior VLPFC during inhibitory control of hand and eye movements. We suggest that the common activations (particularly in the right IFG and insula) reflect cognitive operations such as the representation of stop-signal and the retrieval of task rules, and that the differential activations (particularly in the left IFG) reflect segregated response control processes. Various parts of the VLPFC have been associated previously with the processing of response rules (Bunge, 2004; Sakai and Passingham, 2006), response selection (Liu et al., 2006), and working memory (Smith and Jonides, 1999). The caudal part of VLPFC is likely a part of the response control network involving the dorsolateral PFC, medial SFG, and inferior parietal areas in directing goal-oriented actions. Because the current study does not distinguish among error trials and correct trials, our findings may reflect all the component processes of response inhibition. Future studies should apply other methods such as TMS to distinguish the role of the left and the right IFG in response inhibition. The distinction between the activation of caudal VLPFC and anterior insula also warrants additional investigation in future response inhibition studies. Nonetheless, our study is the first to show that the hand-motor and oculomotor systems appear to have overlapping and partially separated inhibitory control processes involving differentiable subdivisions of the ventrolateral prefrontal cortex.
Footnotes
This work was supported by the State University of New York at Stony Brook and a Drescher Award. We thank Dr. Mark Wagshul and the staff of Department of Radiology for their generous support. We also thank Xin Chen for his help on eye movement monitoring and recording. We are grateful to the two anonymous reviewers who gave constructive suggestions that helped improve this manuscript.
References
- Aron AR, Poldrack RA. Cortical and subcortical contributions to Stop signal response inhibition: role of the subthalamic nucleus. J Neurosci. 2006;26:2424–2433. doi: 10.1523/JNEUROSCI.4682-05.2006. [DOI] [PMC free article] [PubMed] [Google Scholar]
- Aron AR, Fletcher PC, Bullmore ET, Sahakian BJ, Robbins TW. Stop-signal inhibition disrupted by damage to right inferior frontal gyrus in humans. Nat Neurosci. 2003;6:115–116. doi: 10.1038/nn1003. [DOI] [PubMed] [Google Scholar]
- Aron AR, Robbins TW, Poldrack RA. Inhibition and the right inferior frontal cortex. Trends Cogn Sci. 2004;8:170–177. doi: 10.1016/j.tics.2004.02.010. [DOI] [PubMed] [Google Scholar]
- Brett M, Anton JL, Valabregue R, Poline JB. Region of interest analysis using an SPM toolbox. 8th International Conference on Functional Mapping of the Human Brain; June; Sendai, Japan. 2002. Paper presented at. [Google Scholar]
- Buchsbaum BR, Greer S, Chang WL, Berman KF. Meta-analysis of neuroimaging studies of the Wisconsin card-sorting task and component processes. Hum Brain Mapp. 2005;25:35–45. doi: 10.1002/hbm.20128. [DOI] [PMC free article] [PubMed] [Google Scholar]
- Bunge SA. How we use rules to select actions: a review of evidence from cognitive neuroscience. Cogn Affect Behav Neurosci. 2004;4:564–579. doi: 10.3758/cabn.4.4.564. [DOI] [PubMed] [Google Scholar]
- Chambers CD, Bellgrove MA, Stokes MG, Henderson TR, Garavan H, Robertson IH, Morris AP, Mattingley JB. Executive “brake failure” following deactivation of human frontal lobe. J Cogn Neurosci. 2006;18:444–455. doi: 10.1162/089892906775990606. [DOI] [PubMed] [Google Scholar]
- Chikazoe J, Konishi S, Asari T, Jimura K, Miyashita Y. Activation of right inferior frontal gyrus during response inhibition across response modalities. J Cogn Neurosci. 2007;19:69–80. doi: 10.1162/jocn.2007.19.1.69. [DOI] [PubMed] [Google Scholar]
- Curtis CE, Cole MW, Rao VY, D'Esposito M. Canceling planned action: an FMRI study of countermanding saccades. Cereb Cortex. 2005;15:1281–1289. doi: 10.1093/cercor/bhi011. [DOI] [PubMed] [Google Scholar]
- Dale AM. Optimal experimental design for event-related fMRI. Hum Brain Mapp. 1999;8:109–114. doi: 10.1002/(SICI)1097-0193(1999)8:2/3<109::AID-HBM7>3.0.CO;2-W. [DOI] [PMC free article] [PubMed] [Google Scholar]
- Derrfuss J, Brass M, von Cramon DY. Cognitive control in the posterior frontolateral cortex: evidence from common activations in task coordination, interference control, and working memory. NeuroImage. 2004;23:604–612. doi: 10.1016/j.neuroimage.2004.06.007. [DOI] [PubMed] [Google Scholar]
- Derrfuss J, Brass M, Neumann J, von Cramon DY. Involvement of the inferior frontal junction in cognitive control: meta-analyses of switching and Stroop studies. Hum Brain Mapp. 2005;25:22–34. doi: 10.1002/hbm.20127. [DOI] [PMC free article] [PubMed] [Google Scholar]
- Dosenbach NU, Visscher KM, Palmer ED, Miezin FM, Wenger KK, Kang HC, Burgund ED, Grimes AL, Schlaggar BL, Petersen SE. A core system for the implementation of task sets. Neuron. 2006;50:799–812. doi: 10.1016/j.neuron.2006.04.031. [DOI] [PMC free article] [PubMed] [Google Scholar]
- Durston S, Thomas KM, Worden MS, Yang Y, Casey BJ. The effect of preceding context on inhibition: an event-related fMRI study. NeuroImage. 2002;16:449–453. doi: 10.1006/nimg.2002.1074. [DOI] [PubMed] [Google Scholar]
- Forman SD, Cohen JD, Fitzgerald M, Eddy WF, Mintun MA, Noll DC. Improved assessment of significant activation in functional magnetic resonance imaging (fMRI): use of a cluster-size threshold. Magn Reson Med. 1995;33:636–647. doi: 10.1002/mrm.1910330508. [DOI] [PubMed] [Google Scholar]
- Friston KJ, Holmes AP, Poline JB, Grasby PJ, Williams SC, Frackowiak RS, Turner R. Analysis of fMRI time-series revisited. NeuroImage. 1995;2:45–53. doi: 10.1006/nimg.1995.1007. [DOI] [PubMed] [Google Scholar]
- Friston KJ, Penny WD, Glaser DE. Conjunction revisited. NeuroImage. 2005;25:661–667. doi: 10.1016/j.neuroimage.2005.01.013. [DOI] [PubMed] [Google Scholar]
- Garavan H, Ross TJ, Stein EA. Right hemispheric dominance of inhibitory control: an event-related functional MRI study. Proc Natl Acad Sci USA. 1999;96:8301–8306. doi: 10.1073/pnas.96.14.8301. [DOI] [PMC free article] [PubMed] [Google Scholar]
- Goldberg ME, Segraves MA. The visual and frontal cortices. Rev Oculomot Res. 1989;3:283–313. [PubMed] [Google Scholar]
- Goldman-Rakic PS. Circuitry of primate prefrontal cortex and regulation of behavior by representational memory. In: Plum F, editor. Handbook of physiology. The nervous system. Higher functions of the brain. Bethesda, MD: American Physiological Society; 1987. pp. 313–417. [Google Scholar]
- Hanes DP, Patterson WF, II, Schall JD. Role of frontal eye fields in countermanding saccades: visual, movement, and fixation activity. J Neurophysiol. 1998;79:817–834. doi: 10.1152/jn.1998.79.2.817. [DOI] [PubMed] [Google Scholar]
- Hasegawa RP, Peterson BW, Goldberg ME. Prefrontal neurons coding suppression of specific saccades. Neuron. 2004;43:415–425. doi: 10.1016/j.neuron.2004.07.013. [DOI] [PubMed] [Google Scholar]
- Hazeltine E, Poldrack R, Gabrieli JD. Neural activation during response competition. J Cogn Neurosci. 2000;12(Suppl 2):118–129. doi: 10.1162/089892900563984. [DOI] [PubMed] [Google Scholar]
- Heinen SJ, Rowland J, Lee BT, Wade AR. An oculomotor decision process revealed by functional magnetic resonance imaging. J Neurosci. 2006;26:13515–13522. doi: 10.1523/JNEUROSCI.4243-06.2006. [DOI] [PMC free article] [PubMed] [Google Scholar]
- Iversen SD, Mishkin M. Perseverative interference in monkeys following selective lesions of the inferior prefrontal convexity. Exp Brain Res. 1970;11:376–386. doi: 10.1007/BF00237911. [DOI] [PubMed] [Google Scholar]
- Konishi S, Nakajima K, Uchida I, Kikyo H, Kameyama M, Miyashita Y. Common inhibitory mechanism in human inferior prefrontal cortex revealed by event-related functional MRI. Brain. 1999;122:981–991. doi: 10.1093/brain/122.5.981. [DOI] [PubMed] [Google Scholar]
- Li CS, Huang C, Constable RT, Sinha R. Imaging response inhibition in a stop-signal task: neural correlates independent of signal monitoring and post-response processing. J Neurosci. 2006;26:186–192. doi: 10.1523/JNEUROSCI.3741-05.2006. [DOI] [PMC free article] [PubMed] [Google Scholar]
- Liu X, Banich MT, Jacobson BL, Tanabe JL. Functional dissociation of attentional selection within PFC: response and non-response related aspects of attentional selection as ascertained by fMRI. Cereb Cortex. 2006;16:827–834. doi: 10.1093/cercor/bhj026. [DOI] [PubMed] [Google Scholar]
- Logan GD, Irwin DE. Don't look! Don't touch! Inhibitory control of eye and hand movements. Psychon Bull Rev. 2000;7:107–112. doi: 10.3758/bf03210728. [DOI] [PubMed] [Google Scholar]
- Logan GD, Cowan WB, Davis KA. On the ability to inhibit simple and choice reaction time responses: a model and a method. J Exp Psychol Hum Percept Perform. 1984;10:276–291. doi: 10.1037//0096-1523.10.2.276. [DOI] [PubMed] [Google Scholar]
- Miller EK, Cohen JD. An integrative theory of prefrontal cortex function. Annu Rev Neurosci. 2001;24:167–202. doi: 10.1146/annurev.neuro.24.1.167. [DOI] [PubMed] [Google Scholar]
- Munoz DP, Everling S. Look away: the anti-saccade task and the voluntary control of eye movement. Nat Rev Neurosci. 2004;5:218–228. doi: 10.1038/nrn1345. [DOI] [PubMed] [Google Scholar]
- Nagahama Y, Okada T, Katsumi Y, Hayashi T, Yamauchi H, Oyanagi C, Konishi J, Fukuyama H, Shibasaki H. Dissociable mechanisms of attentional control within the human prefrontal cortex. Cereb Cortex. 2001;11:85–92. doi: 10.1093/cercor/11.1.85. [DOI] [PubMed] [Google Scholar]
- Nichols T, Brett M, Andersson J, Wager T, Poline JB. Valid conjunction inference with the minimum statistic. NeuroImage. 2005;25:653–660. doi: 10.1016/j.neuroimage.2004.12.005. [DOI] [PubMed] [Google Scholar]
- Oldfield RC. The assessment and analysis of handedness: the Edinburgh inventory. Neuropsychologia. 1971;9:97–113. doi: 10.1016/0028-3932(71)90067-4. [DOI] [PubMed] [Google Scholar]
- Paus T. Location and function of the human frontal eye-field: a selective review. Neuropsychologia. 1996;34:475–483. doi: 10.1016/0028-3932(95)00134-4. [DOI] [PubMed] [Google Scholar]
- Petrides M. Lateral prefrontal cortex: architectonic and functional organization. Philos Trans R Soc Lond B Biol Sci. 2005;360:781–795. doi: 10.1098/rstb.2005.1631. [DOI] [PMC free article] [PubMed] [Google Scholar]
- Pierrot-Deseilligny C, Muri RM, Nyffeler T, Milea D. The role of the human dorsolateral prefrontal cortex in ocular motor behavior. Ann NY Acad Sci. 2005;1039:239–251. doi: 10.1196/annals.1325.023. [DOI] [PubMed] [Google Scholar]
- Poline JB, Worsley KJ, Evans AC, Friston KJ. Combining spatial extent and peak intensity to test for activations in functional imaging. NeuroImage. 1997;5:83–96. doi: 10.1006/nimg.1996.0248. [DOI] [PubMed] [Google Scholar]
- Rowe JB, Toni I, Josephs O, Frackowiak RS, Passingham RE. The prefrontal cortex: response selection or maintenance within working memory? Science. 2000;288:1656–1660. doi: 10.1126/science.288.5471.1656. [DOI] [PubMed] [Google Scholar]
- Rubia K, Russell T, Overmeyer S, Brammer MJ, Bullmore ET, Sharma T, Simmons A, Williams SC, Giampietro V, Andrew CM, Taylor E. Mapping motor inhibition: conjunctive brain activations across different versions of go/no-go and stop tasks. NeuroImage. 2001;13:250–261. doi: 10.1006/nimg.2000.0685. [DOI] [PubMed] [Google Scholar]
- Rubia K, Smith AB, Brammer MJ, Taylor E. Right inferior prefrontal cortex mediates response inhibition while mesial prefrontal cortex is responsible for error detection. NeuroImage. 2003;20:351–358. doi: 10.1016/s1053-8119(03)00275-1. [DOI] [PubMed] [Google Scholar]
- Sakagami M, Tsutsui K, Lauwereyns J, Koizumi M, Kobayashi S, Hikosaka O. A code for behavioral inhibition on the basis of color, but not motion, in ventrolateral prefrontal cortex of macaque monkey. J Neurosci. 2001;21:4801–4808. doi: 10.1523/JNEUROSCI.21-13-04801.2001. [DOI] [PMC free article] [PubMed] [Google Scholar]
- Sakai K, Passingham RE. Prefrontal set activity predicts rule-specific neural processing during subsequent cognitive performance. J Neurosci. 2006;26:1211–1218. doi: 10.1523/JNEUROSCI.3887-05.2006. [DOI] [PMC free article] [PubMed] [Google Scholar]
- Shallice T, Burgess P. Supervisory control of action and thought selection. In: Baddeley LW, editor. Attention: selection, awareness, and control: a tribute to Donald Broadbent. Oxford: Clarendon; 1993. pp. 171–187. [Google Scholar]
- Shallice T, Burgess P. The domain of supervisory processes and temporal organization of behaviour. Philos Trans R Soc Lond B Biol Sci. 1996;351:1405–1411. doi: 10.1098/rstb.1996.0124. discussion 1411–1402. [DOI] [PubMed] [Google Scholar]
- Smith EE, Jonides J. Storage and executive processes in the frontal lobes. Science. 1999;283:1657–1661. doi: 10.1126/science.283.5408.1657. [DOI] [PubMed] [Google Scholar]
- Stuphorn V, Taylor TL, Schall JD. Performance monitoring by the supplementary eye field. Nature. 2000;408:857–860. doi: 10.1038/35048576. [DOI] [PubMed] [Google Scholar]
- Wager TD, Sylvester CY, Lacey SC, Nee DE, Franklin M, Jonides J. Common and unique components of response inhibition revealed by fMRI. NeuroImage. 2005;27:323–340. doi: 10.1016/j.neuroimage.2005.01.054. [DOI] [PubMed] [Google Scholar]