

Abstract
During retinal development, neuroepithelial progenitor cells divide in either a symmetric proliferative mode, in which both daughter cells remain mitotic, or in a neurogenic mode, in which at least one daughter cell exits the cell cycle and differentiates as a neuron. Although the cellular mechanisms of neurogenesis remain unknown, heterogeneity in cell behaviors has been postulated to influence this cell fate. In this study, we analyze interkinetic nuclear migration, the apical–basal movement of nuclei in phase with the cell cycle, and the relationship of this cell behavior to neurogenesis. Using time-lapse imaging in zebrafish, we show that various parameters of interkinetic nuclear migration are significantly heterogeneous among retinal neuroepithelial cells. We provide direct evidence that neurogenic progenitors have greater basal nuclei migrations during the last cell cycle preceding a terminal mitosis. In addition, we show that atypical protein kinase C (aPKC)-mediated cell polarity is essential for the relationship between nuclear position and neurogenesis. Loss of aPKC also resulted in increased proliferative cell divisions and reduced retinal neurogenesis. Our data support a novel model for neurogenesis, in which interkinetic nuclear migration differentially positions nuclei in neuroepithelial cells and therefore influences selection of progenitors for cell cycle exit based on apical–basal polarized signals.
Keywords: neurogenesis, cell fate, cell cycle, retina development, neuroepithelia, cell polarity
Introduction
Retinal neurogenesis begins with cell cycle exit and cell-type determination followed by cell migration and differentiation. In vertebrates, retinogenesis progresses in a wave-like manner that spreads across the neuroepithelium, generally in a central-to-peripheral manner (Malicki, 2004). At any point within the wave, only a subset of neuroepithelial cells produce postmitotic neurons; the remaining cells divide as proliferative progenitors. Although some of the influential signals and underlying cell cycle exit machinery have been identified (Levine and Green, 2004; Donovan and Dyer, 2005), what constitutes the selection basis for neurogenic cell divisions remains elusive.
Heterogeneity in neuroepithelial cell behaviors has been postulated to function as a fundamental mechanism for regulating differential cell fates. Substantial evidence in invertebrates suggests that the orientation of cell division differentially segregates determinate factors that can regulate neurogenesis and cell-type determination (Roegiers and Jan, 2004). However, the role of cell division orientation within the developing vertebrate retina is not as clear. Although there is heterogeneity in cleavage plane orientation, and proteins such as Numb and Notch-1 can be asymmetrically localized within dividing neuroepithelial cells, a role for division orientation in neurogenesis has not been observed in vertebrates (Cayouette et al., 2001; Silva et al., 2002; Das et al., 2003). However, in the retina, division orientation was found to predict whether daughter cell-type fates were the same or different (Cayouette and Raff, 2003; Poggi et al., 2005).
Another cell behavior with potential to impact cell cycle exit and other cell fate decisions is interkinetic nuclear migration. Interkinetic nuclear migration is the process in which the nucleus migrates within the cytoplasm of elongated neuroepithelial progenitor cells and in phase with the cell cycle (Frade, 2002; Baye and Link, 2007) (see Fig. 1 A). M phase always occurs at the apical surface and S phase in more basal locations. In the current study, we investigate whether interkinetic nuclear migration influences retinal neurogenesis. Using time-lapse imaging techniques in zebrafish, we show that there is significant heterogeneity in parameters of interkinetic nuclear migration, consistent with a role in establishing asymmetry among retinal progenitor cells. Specifically, diversity was found in the maximum basal nuclear position, the time the nucleus remained at the basal-most location, and in the total cell cycle period. Heterogeneity in interkinetic nuclear migration was evident in cells present within a single retina, in individual cell lineages, and between sibling cells. By analyzing nuclear migration in transgenic fish in which cell cycle exit was marked by green fluorescent protein (GFP), we show that neuroepithelial cells with greater basal nuclear migrations produce postmitotic neurons. Additionally, we provide evidence that deep basal nuclear migration is not a consequence of neurogenesis. Finally, we demonstrate that atypical protein kinase C (aPKC) activity, which is critical for proper apical–basal cell polarity, is essential for the relationship of nuclear position and neurogenesis and regulates the proportion of cells undergoing retinal neurogenesis. Our data support a model in which heterogeneity in interkinetic nuclear migration functions to regulate retinal neurogenesis by differentially positioning nuclei in retinal progenitors and facilitating graded responses to polarized signals.
Figure 1.
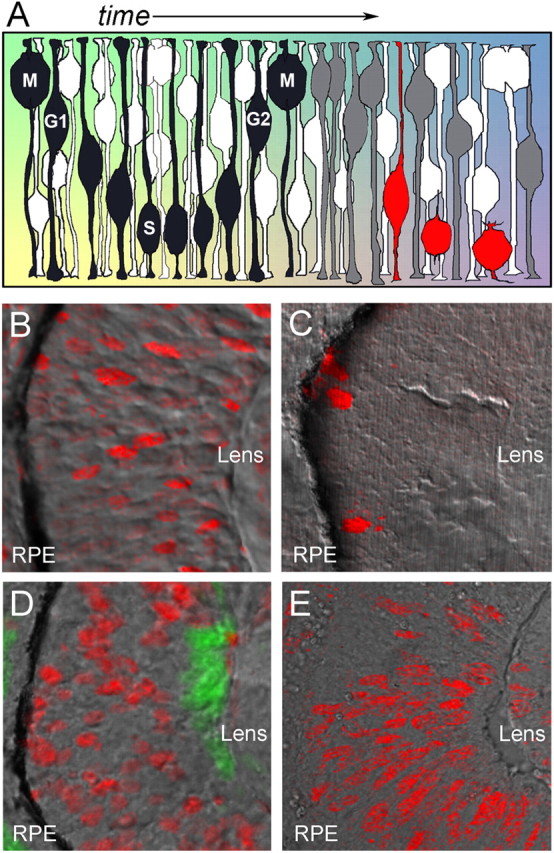
Interkinetic nuclear migration in neuroepithelial cells and heterogeneity in the location of nuclei during the cell cycle. A, Neuroepithelial cells move their nuclei in an apical-to-basal manner with reference to the cell cycle. M phase always occurs at the apical surface, whereas G1, S, and G2 phases occur at more basal locations. Intrinsic and extrinsic factors change over time in addition to localizing within different regions of neuroepithelial cells (colored background). In this diagram, the black cell produces a postmitotic neuron. After the neurogenic division, one of the daughter cells (gray) exits the cell cycle to become a ganglion cell (red). B, Phospho-Rb immunolabeling (red) indicates that nuclei in late G1/early S phase are distributed throughout the neuroepithelium. C, Phospho-histone H3 immunolabeling (red) indicates that nuclei in late G2/M phase are restricted to the apical surface. D, S-phase nuclei (red) labeled with a 5 min pulse of BrdU also show heterogeneity in apical–basal location. huc:GFP expression marks differentiating retinal ganglion cells at the basal surface (green). B–D, Images are from 36 hpf zebrafish embryos. E, S-phase nuclei (red) labeled with a 15 min pulse of BrdU at E10.5 of a mouse embryo also show heterogeneity in apical–basal location. B–E, Bright-field images overlaid with confocal fluorescence. RPE, Retinal pigment epithelium.
Materials and Methods
Immunohistochemistry
S-phase labeling.
5-Bromo-2-deoxyuridine (BrdU) was used to label cells in S phase. For zebrafish, 15 nl of 10 mm BrdU in 1% phenol red solution was injected directly into the eyes of anesthetized 36 h postfertilization (hpf) embryos, which had been embedded in 1% agarose. Embryos were allowed to recover for 5 min and immediately fixed in cold 4% paraformaldehyde/PBS. For labeling embryonic mouse tissue at embryonic day 10.5 (E10.5), pregnant dams were injected intraperitoneally with 500 μl of 2.5 mg/ml BrdU in PBS. Mice were killed 15 min after injection, and embryos were immediately fixed in cold 4% paraformaldehyde/PBS. After overnight fixation, all embryos were then washed, embedded in cryoprotectant, and sectioned at 12 μm onto Superfrost+, gelatin-coated glass slides. Dried sections were washed with PBS and incubated with 2N HCl for 20 min at 37°C. These slides were then washed extensively with PBTD (PBS, 1% DMSO, and 0.1% Tween). Sections were immunostained with a rat anti-BrdU antibody (MAS-250; Harlan Sera Labs, Indianapolis, IN) diluted 1:1000 in blocking solution (5% normal donkey serum, 1% DMSO, and 0.1% Tween). Anti-BrdU immunolabeling was visualized with a 1:800 dilution Rhodamine Red X-conjugated donkey anti-rat secondary antiserum (Jackson ImmunoResearch Laboratories, West Grove, PA).
G1 and M-phase labeling.
Anti-phospho-histone H3 (pH3) rabbit polyclonal antisera (Millipore, Billerica, MA) was used at 1:1000 to label cells in late G2/M phase. Anti-phospho (ser795) retinoblastoma (pRb) rabbit polyclonal antiserum (Cell Signaling Technology, Beverly, MA) was used at 1:200 to label cells in G1/early S phase. Rhodamine Red X-conjugated donkey anti-rabbit secondary antiserum (Jackson ImmunoResearch Laboratories) was used at a 1:800 dilution for detection.
Imaging interkinetic nuclear migration
Nucleus labeling.
Two techniques were used to label nuclei of retinal progenitor cells. In the first approach, microinjection of plasmid DNA encoding the histone H2B-GFP fusion protein was used to label nuclei in a mosaic manner throughout the embryo (Meng et al., 1999; Köster and Fraser, 2001). In the second approach, tissue-specific genetic mosaics were established using donor fish transgenic for two GFP reporter constructs. The double-transgenic donor embryos were derived by crossing histone H2A-GFP+/+ fish (Pauls et al., 2001) to either huc:GFP+/+ fish (Park et al., 2000) or ath5:GFP+/+ fish (Masai et al., 2003). The histone H2A-GFP fish express nuclear GFP ubiquitously from gastrulation onward, whereas huc:GFP fish express cytoplasmic GFP only in postmitotic neurons shortly after cell cycle withdrawal. Fish with the ath5:GFP transgene mark neurogenic precursors in the cell cycle preceding the terminal mitosis. To generate small, isolated cell clones that were both histone H2A-GFP and huc:GFP or ath5:GFP positive in the developing retina, blastomere transplantation was performed (Ho and Kane, 1990). Briefly, at the 1000 cell stage, 10–20 double-transgenic donor cells were transplanted to the animal-pole region of an unlabeled wild-type host embryo of the same age. This area of the blastomere is fated to become retina and forebrain tissue, and limited transplantation into this region results in small numbers of labeled cells within these structures by 24 hpf. All embryos were grown in 0.003% 1-phenyl-2-thiourea (PTU) to block pigmentation and mediate visualization.
Confocal time-lapse microscopy.
At 24 hpf, labeled embryos were anesthetized with 0.05% Tricane in 0.003% PTU and embedded in 1.0% low melt agarose. Embryos were placed in a glass-bottom culture dish and oriented so that the eye was facing up. GFP-labeled cells were imaged on a Nikon (Tokyo, Japan) C1 confocal microscope. Transmitted light images were also collected during the time lapse to enable accurate measurement of apical and basal surfaces during nuclear movements. Optical z-sections were collected at 2 μm steps every 12 min for 24–48 h. These parameters were determined empirically to be sufficient to capture M phase for each cell while reducing photobleaching during the extended time course. Temperature was maintained throughout all experiments at 28.5°C using a stage incubator.
Measurement and analysis of interkinetic nuclear migration in single cells.
Image planes from confocal time-lapse microscopy (Nikon C1) were converted from the IDS to ND format using MetaMorph Imaging software (Universal Imaging, Philadelphia, PA). These data were then arrayed by time and z-plane using the Multidimensional Analysis Tool Suite. Apical and basal boundaries of the retinal neuroepithelium were imaged using bright-field optics. Distance measurements were taken using the Region Measurements tools in MetaMorph. In total, data were collected from 109 retinoblasts in 16 independent time-lapse experiments. Of these, eight time-lapse experiments were performed on cells in which the postmitotic marker transgene (huc:GFP) was present. These experiments yielded n = 14 definitive neurogenic cells (one or both daughter cells were huc:GFP positive) and n = 13 definitive symmetric proliferative (both daughter cells underwent mitosis). An additional 28 cells were examined by time-lapse using the ath5:GFP transgene (12 ath5:GFP positive and 16 ath5:GFP negative).
Cell cycle period.
Individual cells were followed from M phase to M phase. M phase was easily viewed by the condensed and elongated nature of the chromatin. The time required for this was recorded as the total cell cycle period (Willer et al., 2005).
Maximum basal position analysis.
To calculate the relative maximum basal nuclear position, individual cell nuclei were followed to the apex of their basal migration. At this point, the total thickness distance of the middle of the nucleus from the apical surface was divided by the total apicobasal thickness of the neuroepithelium.
Basal pause time analysis.
Individual cells were followed until they reached their most basal position, defined as the farthest point from the apical surface during interkinetic nuclear migration. Basal pause time was the quantity of time the nucleus remained at this position, as defined by movement <5 μm.
Statistical analysis.
Pearson correlation and Spearman rank correlation were used to examine associations between cell cycle period, maximal basal position, and basal pause time. The probability of a cell becoming postmitotic or remaining proliferative was analyzed using the Wilcoxon two-sample test. All statistical analyses were performed using Minitab (State College, PA) software.
Trichostatin A treatment
Trichostatin A (TSA) was diluted in DMSO to a concentration of 1 μm. Mosaic histone H2B-GFP-labeled embryos, generated as described above, were placed in the TSA solution beginning at 16 hpf and imaged in the solution for 14 h. As a control for efficacy, neurogenesis was measured in parallel in huc:GFP embryos.
Initiation and rate of neurogenesis
Developmental time of initiation.
The huc:GFP transgenic line was bred into the heart and soul mutant line (Park et al., 2000; Horne-Badovinac et al., 2001; Peterson et al., 2001). Wild-type embryos that carried the huc:GFP transgene were injected with morpholinos (MOs; Genetools, Corvallis, OR) specific to aPKCλ and aPKCζ mRNA. The translation inhibiting aPKCλ was used at a concentration of 5 ng/embryo, and the translation inhibiting aPKCζ MO was used at 8 ng/embryo as described previously (Horne-Badovinac et al., 2001; Cui et al., 2007). To determine when huc:GFP expression is initiated, embryos were treated with PTU and monitored under a fluorescence dissecting scope every 15 min beginning at 32 hpf.
Cell cycle exit assay to quantitate neurogenesis.
To determine the percentage of cells exiting the cell cycle and becoming postmitotic cells over a short window of developmental time, a saturating pulse of BrdU was used to identify definitive postmitotic neurons. A BrdU injection was given at 34 hpf, when the majority of ganglion cells are postmitotic, and fixed at 45 hpf. The BrdU negative cells were counted at 45 hpf and represent the number of cells that were postmitotic at 34 hpf. Noninjected siblings were fixed at 34 hpf, and the nuclei were counted to determine the average number of cells present at 34 hpf. The number of postmitotic cells counted at 45 hpf was then divided by the total nuclei at 34 hpf to obtain the proportion of total cells that were postmitotic at 34 hpf.
Results
Nuclear position of G1 and S phase is heterogeneous in retinal progenitor cells
As a first approach to address diversity in interkinetic nuclear migration among retinal progenitor cells, we sought to determine the location of nuclei at different stages of the cell cycle within the pseudostratified neuroepithelium. To do so, immunohistochemistry was performed on cryosections of 36 hpf zebrafish embryos using antibodies against phosphorylated retinoblastoma protein (pRb, a marker for cells in G1 and early S phase) or phosphorylated histone H3 (pH3, a marker for cells in late G2 and M phase). The location of S-phase nuclei was determined by giving a very short (5 min) pulse of BrdU to 36 hpf zebrafish embryos. BrdU incorporation was then assessed by immunofluorescence. As anticipated and well characterized by others, all cells in M phase showed nuclei located within two cell diameters from the apical surface (Fig. 1 C). Interestingly, nuclei in G1 or S phase were found at positions throughout the thickness of the retina, suggesting great heterogeneity in the pattern of interkinetic nuclear migration (Fig. 1 B,D). To determine whether this phenomenon was specific to the developing zebrafish retina, the location of S phase was examined in the developing mouse retina. A 15 min pulse of BrdU was administered to pregnant mice carrying E10.5 stage embryos, a developmental time when all cells in the retina are proliferative. Similar to zebrafish, S-phase cells were found throughout the thickness of the mouse retina, demonstrating that heterogeneity in nuclear position during the cell cycle is not specific to developing zebrafish (Fig. 1 E).
Imaging interkinetic nuclear migration in vivo
To directly assess interkinetic nuclear migration and potential heterogeneity in this cell behavior, we used confocal time-lapse imaging using zebrafish embryos. Retinal neuroepithelial cells with histone H2A:GFP-positive nuclei were imaged beginning at 24 hpf (supplemental movie 1, available at www.jneurosci.org as supplemental material). At this time of development, all retinal neuroepithelial cells are mitotic. The first retinal cells to withdraw from the cell cycle in zebrafish do so at ∼28 hpf (Hu and Easter, 1999). It was necessary to image isolated GFP-positive cells so that movements of individual nuclei could be followed for multiple rounds of mitosis. Labeling of isolated nuclei was accomplished by either of two methods. To characterize overall diversity in interkinetic nuclear migration, wild-type embryos were injected at the 1–4 cell stage with plasmid DNA encoding the histone H2B:GFP fusion protein driven by a ubiquitous promoter (Köster and Fraser, 2001). This approach results in embryos in which transgenes are expressed in a mosaic manner, where the degree of mosaicism is dependent on the amount of plasmid DNA injected (Meng et al., 1999). To follow cell fates of individual cells, blastomere transplantation was performed using germline transgenic donors. Donor embryos were obtained from a cross between transgenic fish in which one parent was homozygous for the fusion protein histone H2A-GFP and the other parent was homozygous for the huc:GFP transgene (Fig. 2 A). The histone H2A:GFP transgenic line, Tg(h2afz:GFP)kca6, shows nuclear GFP in all cells from the blastulae stage onward (Pauls et al., 2001). The huc:GFP transgenic line, Tg(elav3:eGFP), expresses cytoplasmic GFP in subsets of postmitotic neurons (Park et al., 2000). Within the zebrafish retina, endogenous HuC protein is expressed in ganglion and amacrine cells (Link et al., 2000). To ensure that within the retina, the huc:GFP transgene was only expressed in postmitotic cells, saturating 15 h pulses of BrdU were given at 36 hpf, when the first wave of retinal neuroepithelial cells had begun to exit the cell cycle. All cells that were GFP positive were negative for BrdU incorporation, indicating that these cells had exited the cell cycle. In addition, shorter timed pulses of BrdU and time-lapse imaging indicated that huc:GFP expression was detectable within 3–6 h after the last M phase (data not shown). These results within the retina are similar to those found for the huc:GFP transgene within hindbrain neuroepithelial cells (Lyons et al., 2003). At 36 hpf, all of the huc:GFP-positive cells were found in a basal location, consistent with differentiation as ganglion cells, the first cell type born in the retina for all vertebrates (Fig. 1 D).
Figure 2.
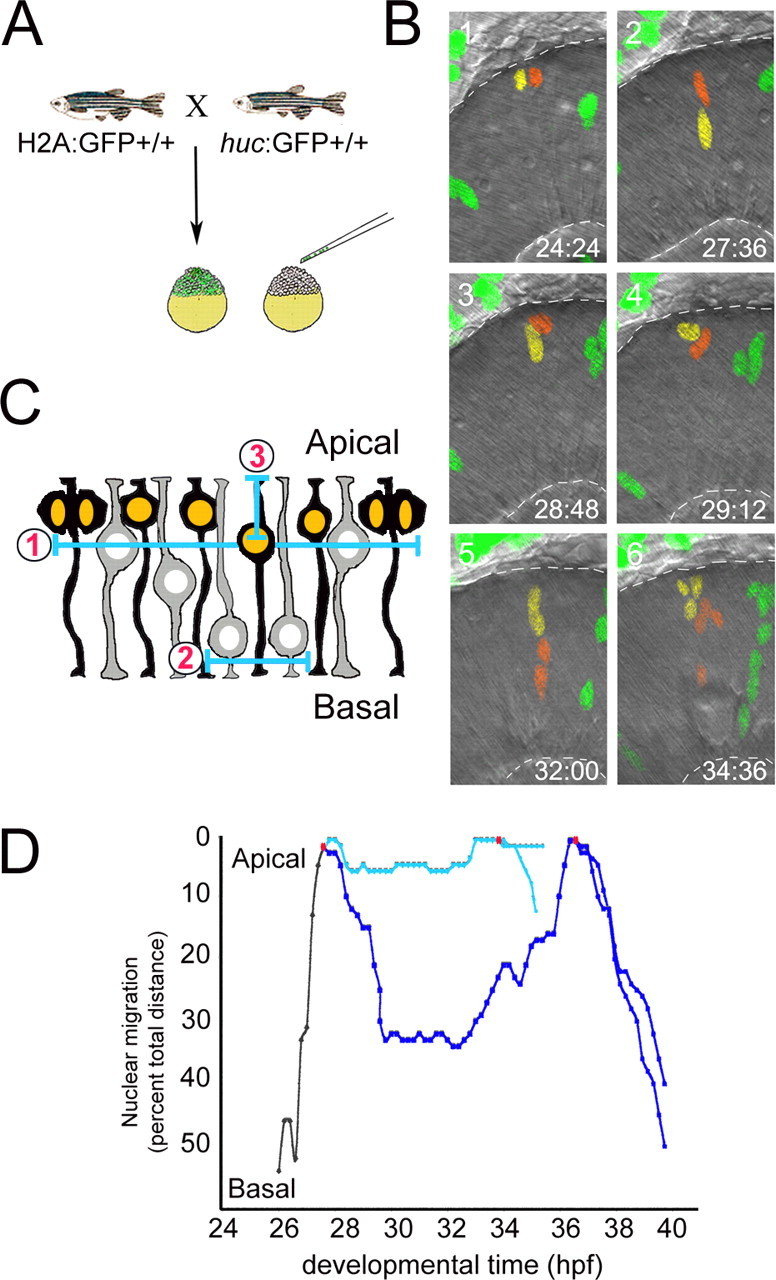
Examining interkinetic nuclear migration in vivo. A, Isolated, labeled retinal neuroepithelial cells were generated by blastula transplantation. Donor cells, derived by crossing a homozygous H2A-GFP transgenic fish to a homozygous huc:GFP fish, were then placed in the retinal-fated region of unlabeled host blastula-stage embryos. B, Montage of selected frames from a time-lapse imaging experiment showing the heterogeneity of interkinetic nuclear migration. Duplicated nuclei of a cell in late M phase, as well as that of their progeny, are pseudocolored red and yellow. Also shown is a separate clone with green nuclei. Dashed lines indicate the apical (top) and basal (bottom) surfaces. Developmental time (hpf) is shown above the lens (bottom right). C, Diagram showing the parameters of interkinetic nuclear migration that were quantified: (1) cell cycle period, (2) basal pause time, and (3) maximum basal distance achieved. D, Graph of interkinetic nuclear migration in an individual cell and its progeny. A single cell's nuclei (black) and its progeny (light and dark blue) were tracked until they were lost as a result of high cell density in the imaging field or until photobleaching occurred. Heterogeneity is evident between daughter cells for cell cycle period, basal pause time, and maximum basal position. Note the saltatory nature and occasional reverse in direction for nuclear migration.
Diversity in retinal progenitor interkinetic nuclear migration
With these tools and techniques, retinal neuroepithelial cell nuclei were imaged at 12 min intervals from 24 hpf until 48–72 hpf. These parameters were determined as sufficient to capture M phase for each cell, while reducing photobleaching during the extended imaging period. Figure 2 B shows a representative montage of selected images from a time-lapse experiment highlighting interkinetic nuclear migration through several cell divisions for a clone of labeled retinal neuroepithelial cells. The montage begins with a cell that has just undergone mitosis at 24 h 24 min. The resulting daughter nuclei and those of their progeny are pseudocolored red and yellow to facilitate tracking the diversity in nuclear migrations. Quantization of interkinetic nuclear migration patterns for individual cells indicated that nuclei movement was saltatory, with periods of movement interspersed with periods of either pause or transient movements in the opposite direction (Fig. 2 D). Analysis of nuclear migration rates of neuroepithelia indicated that the overall velocity for nuclear migration from the apical surface to maximum basal position was significantly slower than nuclear migration in the opposite direction (supplemental Fig. 1, available at www.jneurosci.org as supplemental material). However, analysis indicated that velocity and other aspects of interkinetic nuclear migration were highly variable in both directions.
To further characterize heterogeneity of interkinetic nuclear migration, three parameters were examined: cell cycle period, maximum basal nuclear position, and the amount of time the nucleus remained at its basal-most position (Fig. 2 C). The cell cycle period of individual retinal progenitor cells was calculated by recording the time required to progress from M phase to M phase. M-phase nuclei were easily visualized by their apical location, condensation of chromatin, and the eventual segregation of DNA to each daughter cell. The mean cell cycle period was 6 h 24 min (n = 109), which is consistent with population studies previously published (Hu and Easter, 1999). Interestingly, however, a large array of cell cycle periods was observed, ranging from 4 h to >11 h over the developmental period from 24 to 40 hpf, when the first wave of cell cycle exit occurs (Fig. 3 A). When these data are binned into two groups based on the time before the first cells exit the cell cycle (24–32 hpf) and the time when the first wave of cell cycle exit is underway (32–40 hpf), the mean cell cycle period increased from 6 h 19 min to 6 h 37 min, respectively. This is consistent with population data in mammals indicating small increases in cell cycle period over developmental time (Young, 1985; Alexiades and Cepko, 1996). Although the majority of cell cycle periods increased as developmental time passed, our analysis revealed that this is not an absolute lineage restriction. This can be seen in family clone IV (Fig. 4). The first generation of this clone had daughter cell cycle periods of 8 h 36 min and 8 h even, whereas the next generation had cell cycle periods of 6 h 24 min, 5 h 36 min, and two at 6 h 24 min. During these imaging experiments, only two cells underwent apoptosis, as marked by nuclear condensation followed by DNA fragmentation (data not shown). This low rate of apoptosis (1.8%) within the zebrafish retinal neuroepithelium is consistent with previous reports on fixed tissue (Biehlmaier et al., 2001). The paucity of cell death also confirmed that our imaging approach did not introduce phototoxicity.
Figure 3.

Interkinetic nuclear migration is heterogeneous, and parameters are independent. A–C, Frequency distributions of cell cycle period (A), basal pause time (B), and maximum basal distance achieved (C) for interkinetic nuclear migration in retinal neuroepithelial cells from 24–40 hpf embryos (n = 109 cells from 16 independent time lapses). D–F, Scatter plots showing the independent variable relationship of cell cycle period versus basal pause time (D), maximum basal position versus cell cycle period (E), and maximum basal position versus basal pause time (F). Regression analysis using the Pearson correlation and Spearman rank correlation demonstrates a lack of strong dependence for any of the parameters measured. The Spearman rank correlation value (r), where 1 equals absolute correlation, is shown for each comparison (top right).
Figure 4.

Interkinetic nuclear migration: proliferative versus neurogenic cell divisions. A, Lineage diagrams of four representative huc:GFP transgenic retinal families indicating the cell type [proliferative (green circles), postmitotic neuron (red squares), or unknown (black triangles)] and the associated cell cycle period (vertical time, h:min). AI, Lineage showing symmetric proliferative cell divisions. AII, Lineage showing a single asymmetric division in the first generation. AIII, Lineage showing two asymmetric divisions in the second generation. AIV, Lineage showing two symmetric proliferative divisions in the second generation that produced an asymmetric neurogenic and symmetric neurogenic division. Note that cell cycle period does not always increase in subsequent cell generations (AIV). B, Maximum basal position of proliferative (green circles) and postmitotic neurons (red squares) as measured in huc:GFP fish (p = 0.014, Wilcoxon test). C, Maximum basal position of proliferative (green circles) and postmitotic neurons (red squares) as measured in ath5:GFP fish (p = 0.00005, Wilcoxon test). The proportion of neurogenic cells based on maximum apical–basal nucleus position is shown to the right of each graph. Note the increased probability of a neurogenic cell division correlates with the depth of nuclear migration.
The second parameter of interkinetic nuclear migration examined was the maximum basal position. This is a measure of how far the nucleus of the cell travels toward the basal lamina after mitosis at the apical surface. This distance was expressed as a percentage of the total thickness of the retinal neuroepithelium to account for retinal growth during the imaging period. We observed that after cytokinesis, basal migration of individual nuclei varied greatly and appeared to be stochastic (Fig. 3 C). Some cells' nuclei did not move from the apical surface, whereas other nuclei traveled nearly the entire thickness of the retina before returning to the apical surface to divide again. This is consistent with the immunolabeling results, which showed great diversity in nuclear position for cells at the same stage of the cell cycle. It should be noted that nuclei that move the farthest distances did not necessarily have longer cell cycles. For example, the nucleus that moved among the farthest, 83.8% of the total thickness of the retina, had a relatively short cell cycle period of 5 h 36 min (Fig. 3 E).
The third parameter of interkinetic nuclear migration that we characterized was basal pause time, the amount of time the nucleus remained at its most basal position. Analysis of individual cells showed that during interkinetic nuclear migration, the longest periods of pause occurred at the maximum basal position (Fig. 2 D). We therefore characterized basal pause time by observing the nucleus until it reached its maximum basal position and then recorded the length of time it remained there before moving apically. Heterogeneity also exists for this parameter. Basal pause time ranged from 12 min (one time point) to 6 h 36 min with an average pause time of 1 h 58 min (Fig. 3 B).
Overview of data for all three parameters suggested that sibling cells tended to show similar behaviors of interkinetic nuclear migration. Indeed, on average there is more similarity between sibling cells compared with nonsibling cells (supplemental Fig. 2, available at www.jneurosci.org as supplemental material). Finally, to determine whether any of the parameters that we measured during interkinetic nuclear migration were dependent on each other, cross-correlations and statistical regression analyses were performed. Analysis indicated that cell cycle period and maximum basal position are independent, and only very weak correlations could be detected between basal pause time and the other parameters (Fig. 3 D,E).
Interkinetic nuclear migration and neurogenesis
Heterogeneity in a cell behavior among otherwise equivalent groups of cells is necessary for that behavior to influence cell fate decisions and differentiation events. To test whether any parameter of interkinetic nuclear migration correlated with cells producing postmitotic neurons, we analyzed interkinetic nuclear migration in cells that expressed GFP just after cell cycle exit. Time-lapse imaging was performed on embryos with isolated clones of cells that were histone H2A-GFP positive and had the potential to express cytoplasmic GFP under the control of the huc promoter (Fig. 3 A). All three parameters of interkinetic nuclear migration were then retrospectively assessed in cells that became postmitotic (cytoplasmic GFP positive) as well as those that remained proliferative (cytoplasmic GFP negative and mitosis detected in both daughter cells) (data not shown). We observed between zero and four cells exit the cell cycle within each clone of cells. During the imaging period, these clones underwent one to three rounds of mitosis. Cumulatively, we found that 28.5% of the cells examined expressed the huc:GFP postmitotic marker from 28 to 42 hpf.
Retinal progenitor cells can divide by three different modes: symmetric mitotic, asymmetric, and symmetric postmitotic. Symmetric mitotic divisions produce two proliferative progenitor daughter cells, asymmetric divisions produce one proliferative progenitor and one postmitotic cell, and finally symmetric postmitotic divisions produce two postmitotic cells (Livesey and Cepko, 2001) (Fig. 4 A). During early periods of retinogenesis, asymmetric and symmetric postmitotic divisions are considered neurogenic, because glia are not generated until later developmental times. Using the huc:GFP transgene from 28 to 42 hpf (during the first wave of cell cycle exit in the zebrafish retina), we found progenitor cells divided in the following manner: 48% symmetric proliferative, 48% asymmetric, and 4% symmetric postmitotic. Therefore, for neurogenic cells, huC:GFP primarily marks asymmetric cell divisions (>90%). Interestingly, all three modes of cell division can occur in a single three-generation clone, and a progenitor can produce two postmitotic neurons without first dividing asymmetrically (Fig. 4 A, family IV).
To begin to examine relationships between the parameters of interkinetic nuclear migration and neurogenesis, we first examined trends that could be found within a single clone. The majority of clones indicated that cells that become neurogenic had deeper nuclear migration and shorter cell cycle periods than sibling cells that remained proliferative (supplemental Fig. 2, available at www.jneurosci.org as supplemental material). For example, we compared sibling cells that had different cell fates (proliferative vs neurogenic) and found that the neurogenic cell had a shorter or equivalent cell cycle 10 of 11 times. For nuclear migration, the neurogenic cell had a greater maximum basal migration 9 of 11 times. No trends were found for the basal pause time parameter (data not shown). As a population, the maximum basal position of the nucleus segregated proliferative progenitors from neurogenic progenitors. Cells with nuclei that migrated further toward the basal surface were significantly more likely to produce a postmitotic neuron than cells whose nuclei remained closer to the apical surface (Fig. 4 B, Table 1). In fact, no huc:GFP neurons were generated if the progenitor cell's nucleus migrated <40% of the distance toward the basal lamina. Average cell cycle periods and basal pause times did not show significant differences between symmetric proliferative and neurogenic progenitor cell populations (Table 1). In summary, the following trend was observed: progenitor cells with nuclei that traveled greater basal distances produced daughter cells that became postmitotic. Lineage data suggest that shorter cell cycle periods tend to yield neurogenic divisions within a clone, although as a population cell cycle period was not significantly different.
Table 1.
Interkinetic nuclear migration in proliferative versus neurogenic retinal progenitors
| Type of cell division (n) | Average ± SEM | SD | Wilcoxon rank sum | |
|---|---|---|---|---|
| Cell cycle period (h:min) | Symmetric proliferative (13) | 5:59 ± 0:26 | 1:34 | p = 0.790 |
| Neurogenic (14) | 5:51 ± 0:21 | 1:17 | ||
| Total (109) | 6:24 ± 0:09 | 1:38 | ||
| Basal pause time (h:min) | Symmetric proliferative (13) | 1:28 ± 0:16 | 0:57 | p = 0.320 |
| Neurogenic (14) | 1:51 ± 0:19 | 1:12 | ||
| Total (109) | 1:58 ± 0:08 | 1:26 | ||
| Maximum basal distance (% total distance) | Symmetric proliferative (13) | 51.58 ± 4.16 | 15.01 | p = 0.014 |
| Neurogenic (14) | 66.02 ± 3.49 | 14.54 | ||
| Total (109) | 52.66 ± 1.83 | 19.17 |
% Total distance, Ratio of the basal distance traveled to the total width of the retina. Total represents proliferative + neurogenic + unclassified cell populations. Wilcoxon test conducted for symmetric proliferative versus neurogenic populations.
To further probe the relationship between nuclear position and neurogenesis, we repeated these imaging experiments using the ath5:GFP [Tg(atoh7:GFP)] transgenic line, which also marks neurogenesis in the retina (Masai et al., 2003). This transgene expresses GFP under ath5(atoh7) regulatory sequence and is activated after S phase of the last cell cycle before a symmetric neurogenic cell division (Masai et al., 2005; Poggi et al., 2005). At the time of development when we analyzed maximum nuclear position in ath5:GFP transgenic fish, cells that are GFP negative correspond to proliferative progenitors. Like the huc:GFP neurogenic population, the ath5:GFP neurogenic population showed a strong bias for deeper basal nuclear migrations during the last cell cycle compared with their GFP-negative counterparts (Fig. 4 C; supplemental Movie 2, available at www.jneurosci.org as supplemental material). In fact, the segregation of proliferative from neurogenic populations was greater in the ath5:GFP line. This difference may be attributable to the fact that ath5:GFP marks symmetric neurogenic divisions, whereas huc:GFP primarily marks asymmetric neurogenic divisions. Consistent with this possibility, the sole symmetric neurogenic cell division observed in huc:GFP transgenic cells had the deepest basal nuclear migration. For both transgenic markers, when considering the maximum nuclear position along the apical–basal axis, a probability gradient for neurogenesis emerged in which the likelihood of producing a postmitotic neuron increased with greater nuclear migration (Fig. 4 B,C, right columns).
Promoting proliferative cell fates does not bias nuclear migration
The observation that neurogenic cell divisions correlate with deep basal nuclear migrations can be interpreted in several ways. For example, neurogenesis may drive deep basal nuclear migration. Conversely, basal nuclear position may influence the commitment to neurogenesis. If the former were true, then allowing only proliferative cell divisions by blocking neurogenesis would result in a bias against deep nuclear migrations. To test this possibility, we treated embryos with a histone deacetylase I inhibitor, TSA. Recent studies have demonstrated that either genetic mutations in histone deacetylase I or treatment with TSA completely inhibits retinal neurogenesis in zebrafish embryos (Stadler et al., 2005; Yamaguchi et al., 2005). We confirmed that TSA-treated embryos completely blocked expression of the neurogenic marker huc:GFP (Fig. 5 A). By tracking nuclear migration in retinal progenitor cells from drug-treated embryos, we determined that there was no statistical difference in the maximum basal position of nuclei or average cell cycle period in cells treated with TSA compared with the DMSO-treated controls (Fig. 5 B,C). This result suggests that deep basal nuclear migration is not caused by neurogenesis. However, because we cannot exclude the possibility that inhibition of histone deacetylase I blocks the execution of neurogenesis without affecting neurogenic determination, it is possible that progenitors first become committed to neurogenesis and are therefore biased for deep nuclear migration. Alternatively, nuclear position may influence the commitment to divide neurogenically by enabling differential responses to polarized cues.
Figure 5.
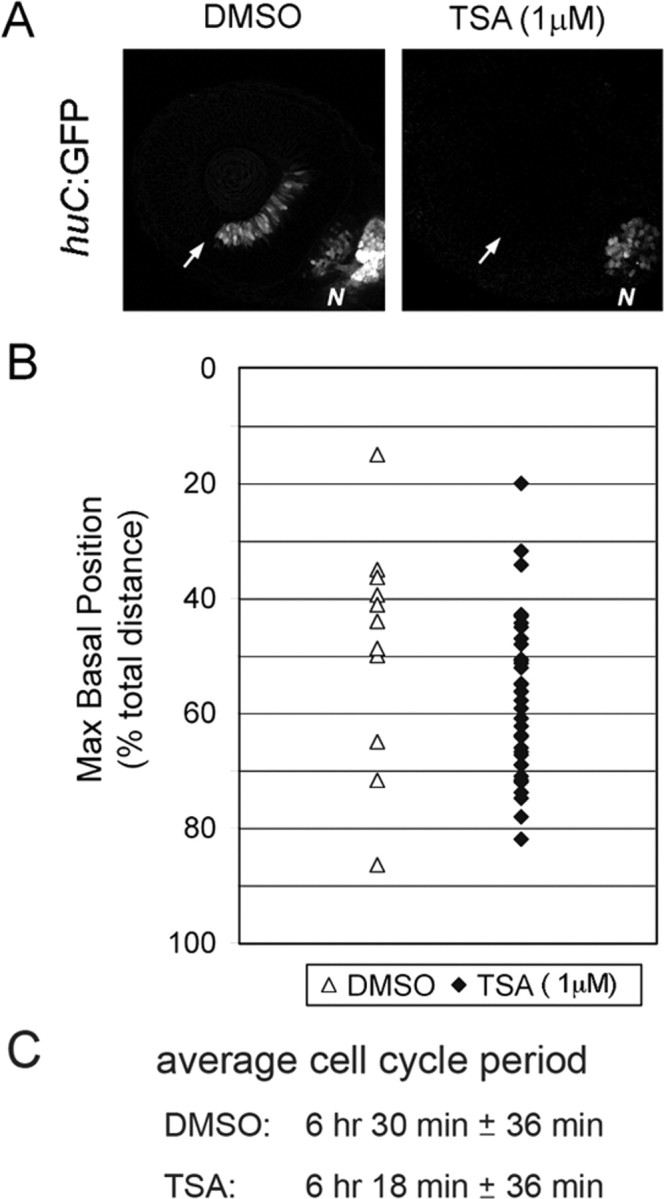
TSA-treated nuclei do not become neurogenic and behave similarly to definitive proliferative nuclei. A, DMSO-treated control and TSA-treated (1 μm) retinas at 36 hpf. Control retinas have a large proportion of cells expressing the postmitotic huc:GFP marker indicating neurogenesis, whereas the TSA-treated embryos have no neurogenesis occurring in the retina. Note that the TSA-treated embryo does have differentiation of huc:GFP-expressing cells in other brain regions. B, Maximum basal nuclei position of DMSO-treated (open triangles) and TSA-treated (filled diamonds) embryos. C, Average cell cycle period for DMSO- (n = 5) or TSA- (n = 5) treated embryos. These populations of cells are not statistically different for either parameter. N, Nasal epithelium. The arrows indicate ventral fissure and site of initiation of neurogenesis in the retina.
Apical–basal polarity is essential for the relationship between nuclear position and neurogenesis
To explore whether intrinsic apical–basal polarized cues are important for cell cycle exit and regulated neurogenesis, we measured parameters of the mitotic cycle and neurogenesis in embryos that lack aPKC activity. Atypical PKCλ and ζ comprise a subgroup of the PKC family and are part of a complex of proteins that regulate various aspects of apical–basal cell polarity. This signaling complex associates with the plasma membrane near tight junction components at the apical end of cells, including retinal neuroepithelia (Izumi et al., 1998; Wodarz, 2002; Suzuki and Ohno, 2006). Disruption of aPKC activity in zebrafish, through genetic mutation in aPKCλ (heart and soul) or by morpholino knock-down of both aPKCλ and ζ, leads to a variety of apical–basal cell polarity phenotypes including basal-localized mitoses, altered division plane orientation, and postmitotic cell positioning defects (Horne-Badovinac et al., 2001; Zolessi et al., 2006; Cui et al., 2007). To assess potential affects on neurogenesis, we measured the timing of huc:GFP initiation in both has mutants and aPKCλ and ζ morphants. Like wild-type siblings, embryos lacking either aPKCλ or combined aPKCλ and ζ activity initiated huc:GFP expression at ∼34 hpf (Fig. 6 A). These data suggest that neurogenesis initiates normally with loss of aPKC activity. We next tested whether aPKC activity influenced the rate of neurogenesis. This was accomplished using long-pulse BrdU to determine the proportion of cells that exited the cell cycle between 28 and 34 hpf. We found that although neurogenesis initiated on time with loss of aPKC activity, the proportion of progenitor cells selected to divide neurogenically was significantly reduced in both has mutants and aPKCλ and ζ morphants (Fig. 6 A–C). Finally, to address whether the relationship between nuclear position and neurogenesis was affected by loss of aPKC activity, we analyzed the maximum nuclear position of proliferative and neurogenic cells in aPKCλ and ζ morphants. This analysis was performed as before, using aPKC morphant;ath5:GFP host cells. Overall, the segregation of neurogenic versus proliferative progenitors based on nuclear position was lost in aPKC morphants (Fig. 6 D). Similar to results from long-pulse BrdU labeling experiments, the proportion of neurogenic cells was decreased (29% in aPKC morphants compared with 43% in wild-type retina). With reduced aPKC activity, the increase in proliferative cell divisions appeared to be selected from progenitors with more basal nuclear migrations (compare Figs. 6 D, 4 C). Conversely, although neurogenesis was suppressed with loss of aPKC activity, progenitor cells with relatively shallow nuclear migration went on to express ath5:GFP. These data are consistent with an essential role for intrinsic cell polarity in regulating the relationship between basal nuclear position and retinal neurogenesis.
Figure 6.

aPKC activity is essential for the relationship between nuclear position and neurogenesis. A, Developmental time for initiation of neurogenesis as marked by huc:GFP expression in wild-type versus has/aPKCλ mutants and control versus aPKCλ and ζ morphants. B, Saturation BrdU (red) and Hoechst (blue) labeling to identify postmitotic neurons at 34 hpf in wild type, has mutants, and aPKCλ and ζ morphants. The arrowheads indicate BrdU-negative, postmitotic cells. C, Comparison of the proportion of postmitotic cells at 34 hpf in wild type, has mutants, and aPKCλ and ζ morphants. **p < 0.01, Student's t test. D, Maximum basal position of proliferative (green circles) and postmitotic neurons (red squares) as measured in ath5:GFP;aPKCλ and ζ morphant cells. There is no significant difference between the proliferative and neurogenic populations (p = 0.525, Wilcoxon test). The wild-type range of maximum basal nuclear positions for neurogenic and proliferative retinal cells is regraphed from Figure 4 C for comparison. Error bars represent SEM.
Discussion
During retinal development, neuroepithelial cells must integrate multiple signaling inputs that influence cell fate decisions. One key cellular decision, which is essential for appropriate numbers and proportions of cell types, is whether to exit the cell cycle or remain proliferative. At any time within active regions of neurogenesis, only a subset of progenitor cells commit to a terminal cell division. Because the local signaling environments are often similar among clustered cells, differences in progenitor cell behaviors may enable differential cell fates. We have used time-lapse analysis to study interkinetic nuclear migration in individual retinal neuroepithelial cells in relation to neurogenesis. We found that this mitotic cell behavior shows extreme heterogeneity. In particular, there is variation in (1) the distance the nucleus migrates, (2) the amount of time nuclei remain at the basal-most position, and (3) the time to complete a mitotic cycle. Interestingly, we observed many mitotic cells in which the nucleus remained close to the ventricular zone, suggesting that basal nuclear migration is not required for S phase. We also found that although the cell cycle period increased with generation number in the majority of cell lineages, there were families in which the cell cycle period was shorter in progeny cells. This demonstrates that the cell cycle period is not absolutely restricted to increase with each cell division. Importantly, we found that particular patterns of interkinetic nuclear migration correlate with neurogenic cell divisions. In general, progenitors that produce postmitotic cells have nuclei that migrate to more basal locations. Specifically, the farther the nucleus migrated within a progenitor cell, the greater the probability it would divide neurogenically (Fig. 4 B,C).
Cell behaviors and cell fates
Historically, research on neural progenitor behaviors and cell fates has focused primarily on mitotic division plane orientation. For invertebrates, the orientation of cell division has significant influence on daughter cell fates by asymmetrically distributing determinant molecules between the progeny. Examples exist for the importance of cell division orientation in regulating neurogenesis and the types of cells that can be generated (Kemphues, 2000; Justice and Jan, 2002; Roegiers and Jan, 2004). In vertebrates, cleavage plane orientation appears to be important for distinguishing cell-type fates but not for regulating neurogenesis. For example, studies in mice during late retinal development support a role for division orientation in cell-type fate choice (Cayouette et al., 2003). In the zebrafish retinal neuroepithelium, division orientation also correlates with cell-type fate decisions. By imaging ath5:GFP-positive cells, Poggi et al. (2005) observed that circumferential cell divisions tend to produce daughter cells of different types, whereas radial cell divisions most often produce cells of the same type. These observations, along with the data from our experiments, suggest that in the retina the pattern of interkinetic nuclear migration during the last cell cycle influences cell cycle exit, whereas cleavage plane orientation of the last M phase influences cell-type fate choice.
By monitoring activation of the tis21 promoter, Huttner and colleagues have shown that asymmetric inheritance of apical membrane can influence cell cycle exit in the mouse brain (Iacopetti et al., 1999; Haubensak et al., 2004; Kosodo et al., 2004). This work demonstrated that neuroepithelial cells that asymmetrically distribute apical plasma membrane are biased to produce postmitotic neurons. Although not directly assessed, it was concluded that the daughter cell that inherited apical membrane remained proliferative. Their observations led to a model for CNS progenitor cells in which the switch from symmetric proliferative to asymmetric neurogenic division occurs by (1) the activation of the tis21 gene, (2) reduction in apical membrane, and (3) the asymmetric distribution of apical membrane (Huttner and Kosodo, 2005). It will be interesting to test whether a similar mechanism functions in the retinal neuroepithelium and whether nuclear position influences either activation of tis21 or the reduction of apical membrane.
Cell cycle length and neurogenesis
In addition to asymmetries during mitosis, cell cycle length has also been suggested to influence neuroepithelial cell fates. For example, in CNS progenitors, modulating G1-phase kinetics altered the rate of cell cycle exit (Ohnuma et al., 2002; Calegari and Huttner, 2003; Hodge et al., 2004). A subsequent study showed that neurogenic telencephalic cells have longer cell cycles than proliferative progenitors (Calegari et al., 2005). In the zebrafish retina, we find that there is tremendous heterogeneity in progenitor cell cycle periods. Our analysis demonstrated that there is no statistical difference in the average length of the cell cycle between proliferative or neurogenic cells. However, considering these data with respect to individual lineages does show that neurogenic cells have shorter cell cycles than their proliferative siblings. These data are consistent with recent observations in frog embryos suggesting that fast cell cycles promote terminal mitoses in the retina (Locker et al., 2006). It will be important to further consider the role of cell cycle kinetics by closely examining the lengths of individual cell cycle phases in relation to neurogenesis.
Interkinetic nuclear migration and signaling
Overall, our results coupled with those from others suggest an important role for interkinetic nuclear migration during retinogenesis. We provide support for a model in which heterogeneity in nuclear position influences whether retinal progenitor cells reenter or exit the mitotic cycle (Fig. 7). By blocking neurogenesis, we show that deep basal nuclear migrations are not a consequence of neurogenesis. This model provides a mechanism for how multiple cell fates can be generated in clusters of neuroepithelial cells related by lineage and equivalent in both expression of intrinsic neurogenic factors and influence from microenvironmental signals. We propose that differences in the position of the nucleus, perhaps during specific phases of the cell cycle, allow neuroepithelia to respond differentially to apical–basal polarized signals. Cells with nuclei in more basal locations were biased to divide neurogenically. Consistent with this model, disruption of cell polarity by loss of aPKC affected the relationship of nuclear position and neurogenesis, as well as the rate of cell cycle exit. Disruptions to aPKC did not completely ameliorate cell cycle exit, suggesting that intrinsic cell polarity is not essential for neurogenesis, but instead is important for selection of the appropriate proportion of neurogenic competent cells for terminal mitosis.
Figure 7.

Model depicting the influence of interkinetic nuclear migration on neurogenesis. Two neurogenic-competent cells (white nuclei) are shown to have just exited M phase. Heterogeneity in interkinetic nuclear migration results in differential location and time that the nucleus resides in G1 and/or G2 phase for otherwise equivalent cells (red box). Localized intrinsic and extrinsic cues, which change with developmental time (background colors), provide differential influences on the retinal progenitors. Although both progenitors are competent to produce a postmitotic cell, only those with greater basal nuclear migrations are selected to become neurogenic (gray nuclei). M-phase dynamics regulate which cell(s) become postmitotic (red nuclei) and influence cell-type fate.
What other factors might influence neurogenesis? In addition to intrinsic cell polarity, extrinsic factors are also presented in localized manners during retinal development. For example, secreted Wnt and Hedgehog proteins are expressed in polarized fashions, and both pathways can influence cell cycle exit in the vertebrate retina (Liu et al., 2003; Masai et al., 2005; Shkumatava and Neumann, 2005; Van Raay et al., 2005; Wang et al., 2005; Yamaguchi et al., 2005). Neurotransmitters can also influence progenitor cell proliferation through short-range signaling (Martins and Pearson, 2007). In general, the proximity of the nucleus and cell body to any of these signals could be important for transcriptional modulation and regulation of neurogenesis.
Nuclear position may also bias progenitor cell fate through posttranslational mechanisms. Nucleus-associated signals and subcellular organelles could function to differentially modify (activate or inactive) localized proteins capable of influencing cell cycle exit. Conversely, kinases anchored at the apical or basal surfaces of neuroepithelial cells could differentially phosphorylate proteins associated with the cell body and nucleus in a manner dependent on nuclear position. As an example, the Notch pathway, which functions to break cellular equivalence and can affect cell cycle exit, is modulated at the posttranslational level. Within the developing retina, Notch pathway components are expressed in a regionalized manner (Murciano et al., 2002). In addition, endosome recycling of the Notch ligand Delta to the plasma membrane may depend on the distance of the cell body from the apical surface (Justice and Jan, 2002; Itoh et al., 2003; Chen and Casey Corliss, 2004; Emery et al., 2005). Similarly, efficiency in nuclear translocation of the cleaved intracellular Notch domain may depend on nuclear position. Other mechanisms for bridging nuclear position and neurogenesis are also possible.
In summary, our data firmly establish that there is significant heterogeneity among retinal neuroepithelial cell progenitors in several parameters of interkinetic nuclear migration. The relationship between maximum basal nuclear position in the cell cycle preceding a neurogenic cell division supports the following model. Within the proliferative retinal neuroepithelium, cells become competent to withdraw from the cell cycle in part by expressing proneural factors. Cells expressing these proteins are then selected for neurogenic divisions based on the position of the nucleus/cell body, and perhaps during a specific cell cycle phase. Nuclear position biases whether the cell divides in a symmetric proliferative (apical nuclear position) or neurogenic (basal nuclear position) manner. Mitotic cell behaviors, which asymmetrically distribute apical membrane and cell-type fate determinants, then influence which daughter cell exits the cell cycle and what specific cell type it will become. Temporal changes in expression of intrinsic factors and the local signaling environment, as proposed by others, set the threshold for neurogenesis and influence the repertoire of particular cell types that can be generated. Our observations of retinal interkinetic nuclear migration support this general model and provide the first link of this cell behavior to proliferative cell decisions.
Footnotes
This work was supported by a National Institutes of Health (NIH) Training Fellowship in Vision Sciences (5T32EY014536 to L.M.B.), as well as NIH Grant R01EY01467 and a March of Dimes Basil O'Connor Fellowship (B.A.L.). We thank Daniel Eastwood (Division of Biostatistics, Medical College of Wisconsin, Milwaukee, WI) for consultation on statistical evaluation. We also thank Colleen Lavin (Fryer Company, Huntley, IL) for assistance with quantitative image analyses.
References
- Alexiades MR, Cepko C. Quantitative analysis of proliferation and cell cycle length during development of the rat retina. Dev Dyn. 1996;205:293–307. doi: 10.1002/(SICI)1097-0177(199603)205:3<293::AID-AJA9>3.0.CO;2-D. [DOI] [PubMed] [Google Scholar]
- Baye LM, Link BA. Nuclear migration during retinal development. Brain Res. 2007 doi: 10.1016/j.brainres.2007.05.021. in press. [DOI] [PMC free article] [PubMed] [Google Scholar]
- Biehlmaier O, Neuhauss SC, Kohler K. Onset and time course of apoptosis in the developing zebrafish retina. Cell Tissue Res. 2001;306:199–207. doi: 10.1007/s004410100447. [DOI] [PubMed] [Google Scholar]
- Calegari F, Huttner WB. An inhibition of cyclin-dependent kinases that lengthens, but does not arrest, neuroepithelial cell cycle induces premature neurogenesis. J Cell Sci. 2003;116:4947–4955. doi: 10.1242/jcs.00825. [DOI] [PubMed] [Google Scholar]
- Calegari F, Haubensak W, Haffner C, Huttner WB. Selective lengthening of the cell cycle in the neurogenic subpopulation of neural progenitor cells during mouse brain development. J Neurosci. 2005;25:6533–6538. doi: 10.1523/JNEUROSCI.0778-05.2005. [DOI] [PMC free article] [PubMed] [Google Scholar]
- Cayouette M, Raff M. The orientation of cell division influences cell-fate choice in the developing mammalian retina. Development. 2003;130:2329–2339. doi: 10.1242/dev.00446. [DOI] [PubMed] [Google Scholar]
- Cayouette M, Whitmore A, Jeffery G, Raff M. Asymmetric segregation of Numb in retinal development and the influence of the pigmented epithelium. J Neurosci. 2001;21:5643–5651. doi: 10.1523/JNEUROSCI.21-15-05643.2001. [DOI] [PMC free article] [PubMed] [Google Scholar]
- Chen W, Casey Corliss D. Three modules of zebrafish Mind bomb work cooperatively to promote Delta ubiquitination and endocytosis. Dev Biol. 2004;267:361–373. doi: 10.1016/j.ydbio.2003.11.010. [DOI] [PubMed] [Google Scholar]
- Cui S, Otten C, Rohr S, Abdelilah-Seyfried S, Link BA. Analysis of aPKClamda and aPKCzeta reveals multiple and redundant functions during vertebrate retinogenesis. Mol Cell Neurosci. 2007;34:431–444. doi: 10.1016/j.mcn.2006.11.016. [DOI] [PMC free article] [PubMed] [Google Scholar]
- Das T, Payer B, Cayouette M, Harris WA. In vivo time-lapse imaging of cell divisions during neurogenesis in the developing zebrafish retina. Neuron. 2003;37:597–609. doi: 10.1016/s0896-6273(03)00066-7. [DOI] [PubMed] [Google Scholar]
- Donovan SL, Dyer MA. Regulation of proliferation during central nervous system development. Semin Cell Dev Biol. 2005;16:407–421. doi: 10.1016/j.semcdb.2005.02.012. [DOI] [PubMed] [Google Scholar]
- Emery G, Hutterer A, Berdnik D, Mayer B, Wirtz-Peitz F, Gaitan MG, Knoblich JA. Asymmetric Rab 11 endosomes regulate delta recycling and specify cell fate in the Drosophila nervous system. Cell. 2005;122:763–773. doi: 10.1016/j.cell.2005.08.017. [DOI] [PubMed] [Google Scholar]
- Frade JM. Interkinetic nuclear movement in the vertebrate neuroepithelium: encounters with an old acquaintance. Prog Brain Res. 2002;136:67–71. doi: 10.1016/s0079-6123(02)36007-2. [DOI] [PubMed] [Google Scholar]
- Haubensak W, Attardo A, Denk W, Huttner WB. Neurons arise in the basal neuroepithelium of the early mammalian telencephalon: a major site of neurogenesis. Proc Natl Acad Sci USA. 2004;101:3196–3201. doi: 10.1073/pnas.0308600100. [DOI] [PMC free article] [PubMed] [Google Scholar]
- Ho R, Kane D. Cell-autonomous action of zebrafish spt-1 mutation in specific mesodermal precursors. Nature. 1990;348:728–730. doi: 10.1038/348728a0. [DOI] [PubMed] [Google Scholar]
- Hodge RD, D'Ercole AJ, O'Kusky JR. Insulin-like growth factor-I accelerates the cell cycle by decreasing G1 phase length and increases cell cycle reentry in the embryonic cerebral cortex. J Neurosci. 2004;24:10201–10210. doi: 10.1523/JNEUROSCI.3246-04.2004. [DOI] [PMC free article] [PubMed] [Google Scholar]
- Horne-Badovinac S, Lin D, Waldron S, Schwarz M, Mbamalu G, Pawson T, Jan Y, Stainier DY, Abdelilah-Seyfried S. Positional cloning of heart and soul reveals multiple roles for PKCλ in zebrafish organogenesis. Curr Biol. 2001;11:1492–1502. doi: 10.1016/s0960-9822(01)00458-4. [DOI] [PubMed] [Google Scholar]
- Hu M, Easter SS. Retinal neurogenesis: the formation of the intial central patch of postmitotic cells. Dev Biol. 1999;207:309–321. doi: 10.1006/dbio.1998.9031. [DOI] [PubMed] [Google Scholar]
- Huttner WB, Kosodo Y. Symmetric versus asymmetric cell division during neurogenesis in the developing vertebrate central nervous system. Curr Opin Cell Biol. 2005;17:648–657. doi: 10.1016/j.ceb.2005.10.005. [DOI] [PubMed] [Google Scholar]
- Iacopetti P, Michelini M, Stuckmann I, Oback B, Aaku-Saraste E, Huttner WB. Expression of the antiproliferative gene TIS21 at the onset of neurogenesis identifies single neuroepithelial cells that switch from proliferative to neuron-generating division. Proc Natl Acad Sci USA. 1999;96:4639–4644. doi: 10.1073/pnas.96.8.4639. [DOI] [PMC free article] [PubMed] [Google Scholar]
- Itoh M, Kim CH, Palardy G, Oda T, Jiang YJ, Maust D, Yeo SY, Lorick K, Wright GJ, Ariza-McNaughton L, Weissman AM, Lewis J, Chandrasekharappa SC, Chitnis AB. Mind bomb is a ubiquitin ligase that is essential for efficient activation of Notch signaling by Delta. Dev Cell. 2003;4:67–82. doi: 10.1016/s1534-5807(02)00409-4. [DOI] [PubMed] [Google Scholar]
- Izumi Y, Hirose T, Tamai Y, Hirai S, Nagashima Y, Fujimoto T, Tabuse Y, Kemphues KJ, Ohno S. An atypical PKC directly associates and colocalizes at the epithelial tight junction with ASIP, a mammalian homologue of Caenorhabditis elegans polarity protein PAR-3. J Cell Biol. 1998;143:95–106. doi: 10.1083/jcb.143.1.95. [DOI] [PMC free article] [PubMed] [Google Scholar]
- Justice NJ, Jan YN. Variations on the Notch pathway in neural development. Curr Opin Neurobiol. 2002;12:64–70. doi: 10.1016/s0959-4388(02)00291-x. [DOI] [PubMed] [Google Scholar]
- Kemphues K. PARsing embryonic polarity. Cell. 2000;101:345–348. doi: 10.1016/s0092-8674(00)80844-2. [DOI] [PubMed] [Google Scholar]
- Kosodo Y, Roper K, Haubensak W, Marzesco AM, Corbeil D, Huttner WB. Asymmetric distribution of the apical plasma membrane during neurogenic divisions of mammalian neuroepithelial cells. EMBO J. 2004;23:2314–2324. doi: 10.1038/sj.emboj.7600223. [DOI] [PMC free article] [PubMed] [Google Scholar]
- Köster R, Fraser S. Tracing transgene expression in living zebrafish embryos. Dev Biol. 2001;233:329–346. doi: 10.1006/dbio.2001.0242. [DOI] [PubMed] [Google Scholar]
- Levine EM, Green ES. Cell-intrinsic regulators of proliferation in vertebrate retinal progenitors. Semin Cell Dev Biol. 2004;15:63–74. doi: 10.1016/j.semcdb.2003.09.001. [DOI] [PubMed] [Google Scholar]
- Link BA, Fadool JM, Malicki J, Dowling JE. The zebrafish young mutation acts non-cell-autonomously to uncouple differentiation from specification for all retinal cells. Development. 2000;127:2177–2188. doi: 10.1242/dev.127.10.2177. [DOI] [PubMed] [Google Scholar]
- Liu H, Mohamed O, Dufort D, Wallace VA. Characterization of Wnt signaling components and activation of the Wnt canonical pathway in the murine retina. Dev Dyn. 2003;227:323–334. doi: 10.1002/dvdy.10315. [DOI] [PubMed] [Google Scholar]
- Livesey FJ, Cepko CL. Vertebrate neural cell-fate determination: lessons from the retina. Nat Rev Neurosci. 2001;2:109–118. doi: 10.1038/35053522. [DOI] [PubMed] [Google Scholar]
- Locker M, Agathocleous M, Amato MA, Parain K, Harris WA, Perron M. Hedgehog signaling and the retina: insights into the mechanisms controlling the proliferative properties of neural precursors. Genes Dev. 2006;20:3036–3048. doi: 10.1101/gad.391106. [DOI] [PMC free article] [PubMed] [Google Scholar]
- Lyons DA, Guy AT, Clarke JD. Monitoring neural progenitor fate through multiple rounds of division in an intact vertebrate brain. Development. 2003;130:3427–3436. doi: 10.1242/dev.00569. [DOI] [PubMed] [Google Scholar]
- Malicki J. Cell fate decisions and patterning in the vertebrate retina: the importance of timing, asymmetry, polarity and waves. Curr Opin Neurobiol. 2004;14:15–21. doi: 10.1016/j.conb.2004.01.015. [DOI] [PubMed] [Google Scholar]
- Martins RA, Pearson RA. Control of cell proliferation by neurotransmitters in the developing retina. Brain Res. 2007 doi: 10.1016/j.brainres.2007.04.076. in press. [DOI] [PubMed] [Google Scholar]
- Masai I, Lele Z, Yamaguchi M, Komori A, Nakata A, Nishiwaki Y, Wada H, Tanaka H, Nojima Y, Hammerschmidt M, Wilson SW, Okamoto H. N-cadherin mediates retinal lamination, maintenance of forebrain compartments and patterning of retinal neurites. Development. 2003;130:2479–2494. doi: 10.1242/dev.00465. [DOI] [PubMed] [Google Scholar]
- Masai I, Yamaguchi M, Tonou-Fujimori N, Komori A, Okamoto H. The hedgehog-PKA pathway regulates two distinct steps of the differentiation of retinal ganglion cells: the cell-cycle exit of retinoblasts and their neuronal maturation. Development. 2005;132:1539–1553. doi: 10.1242/dev.01714. [DOI] [PubMed] [Google Scholar]
- Meng A, Jessen JR, Lin S. Transgenesis. In: Detrich HW, Westerfield M, Zon LI, editors. The zebrafish: genetics and genomics. New York: Academic; 1999. pp. 133–147. [Google Scholar]
- Murciano A, Zamora J, Lopez-Sanchez J, Frade JM. Interkinetic nuclear movement may provide spatial clues to the regulation of neurogenesis. Mol Cell Neurosci. 2002;21:285–300. doi: 10.1006/mcne.2002.1174. [DOI] [PubMed] [Google Scholar]
- Ohnuma S, Hopper S, Wang KC, Philpott A, Harris WA. Co-ordinating retinal histogenesis: early cell cycle exit enhances early cell fate determination in the Xenopus retina. Development. 2002;129:2435–2446. doi: 10.1242/dev.129.10.2435. [DOI] [PubMed] [Google Scholar]
- Park HC, Kim CH, Bae YK, Yeo SY, Kim SH, Hong SK, Shin J, Yoo KW, Hibi M, Hirano T, Miki N, Chitnis AB, Huh TL. Analysis of upstream elements in the HuC promoter leads to the establishment of transgenic zebrafish with fluorescent neurons. Dev Biol. 2000;227:279–293. doi: 10.1006/dbio.2000.9898. [DOI] [PubMed] [Google Scholar]
- Pauls S, Geldmacher-Voss B, Campos-Ortega JA. A zebrafish histone variant H2A.F/Z and a transgenic H2A.F/Z:GFP fusion protein for in vivo studies of embryonic development. Dev Genes Evol. 2001;211:603–610. doi: 10.1007/s00427-001-0196-x. [DOI] [PubMed] [Google Scholar]
- Peterson RT, Mably JD, Chen JN, Fishman MC. Convergence of distinct pathways to heart patterning revealed by the small molecule concentramide and the mutation heart-and-soul. Curr Biol. 2001;11:1481–1491. doi: 10.1016/s0960-9822(01)00482-1. [DOI] [PubMed] [Google Scholar]
- Poggi L, Vitorino M, Masai I, Harris WA. Influences on neural lineage and mode of division in the zebrafish retina in vivo. J Cell Biol. 2005;171:991–999. doi: 10.1083/jcb.200509098. [DOI] [PMC free article] [PubMed] [Google Scholar]
- Roegiers F, Jan YN. Asymmetric cell division. Curr Opin Cell Biol. 2004;16:195–205. doi: 10.1016/j.ceb.2004.02.010. [DOI] [PubMed] [Google Scholar]
- Shkumatava A, Neumann CJ. Shh directs cell-cycle exit by activating p57Kip2 in the zebrafish retina. EMBO Rep. 2005;6:563–569. doi: 10.1038/sj.embor.7400416. [DOI] [PMC free article] [PubMed] [Google Scholar]
- Silva AO, Ercole CE, McLoon SC. Plane of cell cleavage and numb distribution during cell division relative to cell differentiation in the developing retina. J Neurosci. 2002;22:7518–7525. doi: 10.1523/JNEUROSCI.22-17-07518.2002. [DOI] [PMC free article] [PubMed] [Google Scholar]
- Stadler JA, Shkumatava A, Norton WH, Rau MJ, Geisler R, Fischer S, Neumann CJ. Histone deacetylase 1 is required for cell cycle exit and differentiation in the zebrafish retina. Dev Dyn. 2005;233:883–889. doi: 10.1002/dvdy.20427. [DOI] [PubMed] [Google Scholar]
- Suzuki A, Ohno S. The PAR-aPKC system: lessons in polarity. J Cell Sci. 2006;119:979–987. doi: 10.1242/jcs.02898. [DOI] [PubMed] [Google Scholar]
- Van Raay TJ, Moore KB, Iordanova I, Steele M, Jamrich M, Harris WA, Vetter ML. Frizzled 5 signaling governs the neural potential of progenitors in the developing Xenopus retina. Neuron. 2005;46:23–36. doi: 10.1016/j.neuron.2005.02.023. [DOI] [PubMed] [Google Scholar]
- Wang Y, Dakubo GD, Thurig S, Mazerolle CJ, Wallace VA. Retinal ganglion cell-derived sonic hedgehog locally controls proliferation and the timing of RGC development in the embryonic mouse retina. Development. 2005;132:5103–5113. doi: 10.1242/dev.02096. [DOI] [PubMed] [Google Scholar]
- Willer GB, Lee VM, Gregg RG, Link BA. Analysis of the zebrafish perplexed mutation reveals tissue-specific roles for de novo pyrimidine synthesis during development. Genetics. 2005;170:1827–1837. doi: 10.1534/genetics.105.041608. [DOI] [PMC free article] [PubMed] [Google Scholar]
- Wodarz A. Establishing cell polarity in development. Nat Cell Biol. 2002;4:E39–E44. doi: 10.1038/ncb0202-e39. [DOI] [PubMed] [Google Scholar]
- Yamaguchi M, Tonou-Fujimori N, Komori A, Maeda R, Nojima Y, Li H, Okamoto H, Masai I. Histone deacetylase 1 regulates retinal neurogenesis in zebrafish by suppressing Wnt and Notch signaling pathways. Development. 2005;132:3027–3043. doi: 10.1242/dev.01881. [DOI] [PubMed] [Google Scholar]
- Young RW. Cell proliferation during postnatal development of the retina in the mouse. Dev Brain Res. 1985;21:229–239. doi: 10.1016/0165-3806(85)90211-1. [DOI] [PubMed] [Google Scholar]
- Zolessi FR, Poggi L, Wilkinson CJ, Chien CB, Harris WA. Polarization and orientation of retinal ganglion cells in vivo . Neural Develop. 2006;1:2. doi: 10.1186/1749-8104-1-2. [DOI] [PMC free article] [PubMed] [Google Scholar]