

Abstract
Glutamate transporters regulate excitatory neurotransmission and prevent glutamate-mediated excitotoxicity in the CNS. To better study the cellular and temporal dynamics of the expression of these transporters, we generated bacterial artificial chromosome promoter Discosoma red [glutamate–aspartate transporter (GLAST)] and green fluorescent protein [glutamate transporter-1 (GLT-1)] reporter transgenic mice. Analysis of these mice revealed a differential activation of the transporter promoters not previously appreciated. GLT-1 promoter activity in the adult CNS is almost completely restricted to astrocytes, often and unexpectedly in a nonoverlapping pattern with GLAST. Spinal cord GLT-1 promoter reporter, protein density, and physiology were 10-fold lower than in brain, suggesting a possible mechanism for regional sensitivity seen in disease. The GLAST promoter is active in both radial glia and many astrocytes in the developing CNS but is downregulated in most astrocytes as the mice mature. In the adult CNS, the highest GLAST promoter activity was observed in radial glia, such as those located in the subgranular layer of the dentate gyrus. The continued expression of GLAST by these neural progenitors raises the possibility that GLAST may have an unanticipated role in regulating their behavior. In addition, GLAST promoter activation was observed in oligodendrocytes in white matter throughout many (e.g., spinal cord and corpus callosum), but not all (e.g., cerebellum), CNS fiber tracts. Overall, these studies of GLT-1 and GLAST promoter activity, protein expression, and glutamate uptake revealed a close correlation between transgenic reporter signals and uptake capacity, indicating that these mice provide the means to monitor the expression and regulation of glutamate transporters in situ.
Keywords: BAC, glutamate, GLT-1, GLAST, membrane, transgenic, oligodendroglial, astroglia
Introduction
Five isoforms of sodium-dependent transporters are responsible for removing extracellular glutamate in the CNS and are critical for preventing excitotoxicity (Choi et al., 1987) and modulating synaptic transmission (Huang and Bergles, 2004). Glutamate–aspartate transporter (GLAST) and glutamate transporter-1 (GLT-1) are presumed to be astroglial proteins, by immunohistochemical and in situ studies. Of the isoforms, GLT-1 [known as excitatory amino acid transporter 2 (EAAT2) in humans] is the dominant functional subtype, localized predominantly to perisynaptic astrocyte plasma membranes throughout the forebrain and spinal cord (Furuta et al., 1997; Berger and Hediger, 1998). Gene inactivation studies document a critical role for GLT-1 in maintaining low extracellular glutamate (Rothstein et al., 1994; Tanaka, 1997). Diminished expression of GLT-1 contributes to neurodegenerative disorders (Choi, 1988), including amyotrophic lateral sclerosis (Rothstein et al., 1992, 1995), multiple sclerosis (Werner et al., 2001), and Alzheimer's disease (Li et al., 1997; Masliah et al., 2000). GLAST, the embryonically dominant transporter, has its expression restricted in the adult. GLAST is also altered in neurological and psychiatric diseases (Banner et al., 2002; Scott et al., 2002). Understanding the regional and cellular regulation of these synaptically relevant genes is significant from a pathogenic and therapeutic perspective.
Recent studies have provided limited information on the genomic regulation of GLT-1 and GLAST transporters, which has been restricted to in vitro analysis of promoter fragments (Kim et al., 2003; Su et al., 2003) that may not accurately reflect normal gene regulation (Su et al., 2004). Consequently, little is known about the genomic regulation of glutamate transporters in vivo. To better understand GLT-1/EAAT2 and GLAST/EAAT1 regulation, we generated bacterial artificial chromosome (BAC) promoter reporter transgenic mice that express the fluorescent proteins enhanced green fluorescent protein (eGFP) or Discosoma red (DsRed) Express under the control of the natural GLT-1 or GLAST BAC promoters, respectively, to attempt to replicate wild-type promoter activity accurately.
Because of the large size of BAC transgenes, they have the potential to carry all necessary sequence information contained within the endogenous promoter and regulatory regions and therefore provide accurate information on the temporal and regional patterns of promoter activation. By coupling these promoter sequences to fluorescent reporters, it is possible to visualize cellular morphology in living tissue. Furthermore, because multiple copies of the transgene are often integrated, there is the potential to resolve expression patterns that were not visible through in situ hybridization or immunohistochemistry. Notably, the intense protein expression of GLT1/GLAST in neuropil has made it particularly difficult to differentiate individual cellular patterns of expression (Rothstein et al., 1994). An additional advantage of genetically encoded fluorescent reporters is the ability to identify individual living cells for electrophysiological evaluation and thereby study the functional expression of transporters in intact tissue; by using different fluorescent reporters, it is possible to compare promoter activity in specific cells.
Here we used a combination of quantitative high-resolution imaging and electrophysiology recordings to define the cellular pattern of glutamate transporter expression in the developing and adult CNS, using two lines of BAC transgenic reporter mice. These transporter reporter mice demonstrated that almost all astroglia express GLT-1. Furthermore, in most brain regions, cells exhibited either GLAST or GLT-1 promoter activation, and only rarely were both promoters active. GLAST promoter activity persisted at a high level in hippocampal neural progenitor cells and in selected oligodendroglial populations in the mature CNS. Although the GLT-1 promoter is strongly activated in both gray and white matter astrocytes, we discovered large differences in gene expression and functional transport in forebrain versus spinal cord astroglia, possibly accounting for regional disease vulnerabilities between these areas.
Materials and Methods
BAC constructs.
Mouse BACs RPCI-24-287G11 and RPCI-23-361H22, both obtained from BAC-PAC Resources (bacpac.chori.org), were used for the GLAST and GLT-1 reporter mice, respectively. BAC RPCI-24-287G11, containing the entire GLAST gene plus 18 kb upstream of the first exon and 60 kb downstream of the last exon, was modified using a double homologous combination approach with the SV-RecA shuttle vector as described previously (Yang et al., 1997), with minor alterations, to insert cDNA for DsRed. The first homology region, termed the A-box, included the 721 bp between the sequence 5′-TTCCCTGTA-AAAGCCTCAATT-3′ and the reverse complement sequence 5′-GCTCTTCTCCGTTGCTTTTGGTCAT-3′ based on the published online mouse genome (http://www.ensembl.org/Mus_musculus/index.html). The second homology region, the B-box, included the 618 bp between the sequence 5′-A(T→A)GACCAAAAGCAACGGAG-3′ and the reverse complement sequence 5′-TGCTGGGGTTAAAGGTGTG-3′. The GLAST start codon, in exon 2, was mutated to AAG, and the DsRed cDNA (DsRed Express; Clontech, Mountain View, CA) was inserted downstream, immediately after the end of the A-box, within the same exon, as illustrated in Figure 1 A (left).
Figure 1.

Generation of GLAST–DsRed and GLT-1–eGFP BAC promoter reporter mice. A, B, The modifications made to the GLAST (A) and GLT-1 (B) mouse BACs are shown. The modified (GLAST) or interrupted (GLT-1) start codons are underlined, and the insertion point for the reporter is indicated. C, Bright-field image of a brain from an adult GLAST–DsRed mouse (left), DsRed fluorescence from the same brain (middle), and close-up view of the cerebellum (right). D, Bright-field image of the brain from an adult GLT-1–eGFP mouse (left) and eGFP fluorescence from the same brain (right). E, GLAST Western blot: −/−, GLAST knock-out mouse; +/−, heterozygote GLAST mouse; +/+, wild-type littermate of line 593 GLAST–DsRed mouse; 593, line 593 GLAST–DsRed mouse (high DsRed expression); 573, line 573 GLAST–DsRed reporter line (weak DsRed expression). F, GLT-1 Western blot: −/−, GLT-1 knock-out mouse; +/−, heterozygote GLT-1 mouse; +/+, wild-type littermate of line 335 GLT-1–eGFP mouse; 335, line 335 GLT-1–eGFP mouse (high eGFP expression); 356, line 356 GLT-1–eGFP mouse (low eGFP expression).
BAC RPCI-23-361H22, containing the entire 123 kb GLT-1 gene plus 45 kb upstream of the first exon and 24 kb downstream of the last exon, was modified using the pLD53SC.E-E shuttle vector as described previously (Gong et al., 2002), with minor alterations, to insert cDNA for eGFP between the AT and the G of the start codon. The A-box homology region was cloned into the pLD53SC.E-E shuttle vector using the AscI and SmaI sites on the vector. The 502 bp A-box was generated with PCR primers 5′-AGGCGCGCCCAGGGCGCAGCGGCCTCT-3′ (AscI site underlined) and 5′-TTCCCCCGGGATGGCGTGGGGAACGCCC-3′ based on the sequence upstream of the GLT-1 exon 1 initiation codon found in the published on-line mouse genome. The PCR product was blunt ended with Klenow enzyme, then digested with AscI, and ligated into the shuttle vector.
The final modified BACs were transfected into HEK-293 cells and primary astrocyte cultures using Fugene 6 Transfection Reagent (Roche Diagnostics, Indianapolis, IN) to validate reporter function and then linearized and injected by the Johns Hopkins Transgenic Core Facility, into mouse pronuclei for generation of transgenic reporter mice. Founders were identified via PCR to detect DsRed (GLAST) or eGFP (GLT-1) transcripts. These founders, of the B6SJL hybrid strain, were bred with C57BL/6 wild-type mice to generate independent transgenic lines.
Western blotting.
Mice were anesthetized and killed, and cerebral cortex [for GLT-1 (Fig. 1)], cerebellum [for GLAST (Fig. 1)], or cerebral cortex, hippocampus, and spinal cord [for C57BL/6 wild type (see Fig. 7)] was dissected out and homogenized in lysis buffer [20 mm Tris-HCl, pH 7.4, 10% sucrose, and Complete Protease Inhibitor Cocktail tablet (Roche Diagnostics)]. After sonication, protein concentration was determined by performing a Bradford Assay (Pierce, Rockford, IL) and then diluted 1:1 in sample buffer (250 mm Tris-HCl, pH 6.8, 4% SDS, 10% glycerol, and 1% β-mercaptoethanol). After denaturation by heating at 95°C for 3 min, 10 μg of protein was loaded in each lane of a 4–10% polyacrylamide gel (Invitrogen, Carlsbad, CA) along with a protein standard ladder (Precision Plus; Bio-Rad, Hercules, CA). Nonspecific sites were blocked with 5% nonfat milk, and blots were incubated overnight at 4°C with rabbit polyclonal anti-actin [1:75,000 for GLAST blot, 1:50,000 for GLT-1 blot, and 1:500 of a new tube for the wild-type blot; Sigma A5060 (Sigma, St. Louis, MO)], to control for protein loading levels and either affinity-purified anti-GLAST (Rothstein et al., 1994) (1:100) or anti-cGLT-1 (Rothstein et al., 1994) (1:25,000 for the GLT-1-blot or 1:10,000 of a different tube for the wild-type blot) antibodies. Antipeptide GLT-1 and GLAST antibodies were generated in our laboratory as described previously (Rothstein et al., 1994). Antibody labeling was detected by incubating blots with horseradish peroxidase-labeled anti-rabbit secondary antibody (1:5000; GE Healthcare, Little Chalfont, UK) and visualized with enhanced chemiluminescence (GE Healthcare).
Figure 7.

GLT-1 expression by astrocytes in the spinal cord. A, Confocal fluorescent image of the ventral horn of the spinal cord from a GLT-1–eGFP mouse, showing eGFP expression (green) by small cells scattered throughout the neuropil (white arrows). The section was stained with NeuN antibodies (blue) to show the location of motor neurons (somas indicated by asterisks). Scale bar, 50 μm. B, Plot of the eGFP fluorescence intensity of astrocytes in the stratum radiatum region of the hippocampus (Hipp) and the ventral horn of the spinal cord. Values taken from a P24 GLT-1–eGFP BAC mouse; horizontal line represents population average. C, Western blot showing GLT-1 protein levels in mouse cortex (Ctx), hippocampus (Hipp), and spinal cord (SC). This blot is representative of blots made from three different mice of the same age. The actin bands show that equivalent amounts of protein were loaded into each lane. D, Whole-cell recording of glutamate transporter currents from an astrocyte in the ventral horn of a P29 GLT-1–eGFP mouse (identified by eGFP fluorescence) showing responses recorded under control conditions (black trace) and in the presence of DHK (300 μm; blue trace) or TBOA (300 μm; red trace). Calibration: 25 ms, 25 pA. Transporter currents were elicited in response to brief photolysis (duration shown by black trace above) of MNI–d-aspartate (500 μm). Traces at bottom left show responses on a slower timescale, highlighting the slow decay of the putative K+-mediated component. Calibration: 500 ms, 25 pA. Inset at bottom right shows the response of this cell to voltage steps (−50, −30, −10, 10, 30, and 50 mV). Calibration: 50 ms, 1 nA. E, Fluorescent images of the ventral horn from a P24 GLAST–DsRed/GLT-1–eGFP double-transgenic mouse stained with GFAP antibodies, showing colocalization between eGFP and GFAP (green arrow) by astrocytes in the gray matter (Gm). DsRed expression was observed in GFAP− cells (red arrow) in both the gray matter and white matter (Wm). Scale bar, 50 μm. F, Fluorescent image from the ventral horn of a P24 GLAST–DsRed/GLT-1–eGFP double-transgenic mouse showing the extent of overlap between eGFP (green arrows) and DsRed (red arrows). Scale bar, 50 μm. G, Plot of the relative intensities for eGFP (green diamonds) and DsRed (red triangles) among cells in the ventral horn of the spinal cord. Motor neurons (blue squares) did not express either fluorescent protein.
Histology.
Typically, histological analysis was performed on several sections from two to three mice at each age. Representative pictures are shown. Mice were anesthetized and perfused with 4% paraformaldehyde via cardiac ventricle cannulation, postfixed in the same fixative for 2–20 h, cryoprotected with 30% sucrose in phosphate buffer for 24 h, and then rapidly frozen. Sections were cut at 40–45 μm and mounted on a slide. For comparison of hippocampal and spinal cord promoter activation levels, these tissues were paired on the same slides to facilitate equivalent handling. Digital images were taken from either a Nikon (Tokyo, Japan) E800 microscope or a Zeiss (Oberkochen, Germany) LSM 510 Meta confocal microscope. For composite images, multiple images were taken at either 2× or 4× [for postnatal day 1 (P1)] at the same exposure and the same gray levels (4098) for each composite, and the combined images were subsequently aligned using Adobe Photoshop (Adobe Systems, San Jose, CA).
Immunohistochemistry.
Sections were incubated overnight with primary antibodies. After several rinses, the sections were incubated with secondary antibody conjugated to fluorescent label; 7-amino-4-methylcoumarin-3-acetic acid AMCA (1:200; Vector Laboratories, Burlingame, CA). The sources for and dilutions of each antibody were as follows: glial fibrillary acidic protein (GFAP) (1:500; Sigma), neuronal-specific nuclear protein (NeuN) (1:2000; Chemicon, Temecula, CA), and nestin (1:100; Chemicon).
Relative fluorescence intensity analysis.
The relative intensity of eGFP in astrocytes in hippocampus versus spinal cord and in hippocampus versus corpus callosum was determined with NIH Image J software (http://rsb.info.nih.gov/ij). After imaging the tissues with the same microscope settings during the same microscope session, the images were analyzed as follows. A box was drawn within the cell body of each cell in an area, and the average pixel intensity was measured. Average background levels were also averaged from measurements within blood vessels, which are black. The final intensity for cells in a given region was the average of the background-subtracted averages from multiple slices and animals.
Determination of cells with overlap of GLT-1 or GLAST promoter activation and GFAP expression.
Confocal images (40×) of hippocampus slices from GLAST–DsRed BAC/GLT-1–eGFP BAC double-transgenic mice stained with GFAP (blue) were analyzed to determine the overlap of the three reporters in the hippocampus. Triple-color images were split in the Zeiss LSM Image Browser, and, using arrows to identify the same cell in each image, cells were scored as positive or negative for each reporter.
Proteolipid protein–eGFP promoter reporter mice.
Transgenic myelin proteolipid protein (PLP) promoter reporter mice that express eGFP in cells at all stages of oligodendrocyte differentiation (Mallon et al., 2002) were kindly provided by Wendy Macklin (Lerner Research Institute, Cleveland, OH). These mice were bred to GLAST–BAC promoter reporter mice, and double-transgenic offspring were analyzed for overlap of PLP and GLAST promoter activity.
Electrophysiology.
Acute coronal slices of brain (400 μm thick) were prepared from P13–P48 mice in ice-cold solution containing the following (in mm): 110 choline chloride, 2.5 KCl, 0.5 CaCl2, 7 MgSO4, 1.25 NaH2PO4, 25 choline bicarbonate, 25 d-glucose, 3.1 Na-pyruvate, and 1 kynurenic acid. Slices were allowed to recover at 37°C for 30 min in artificial CSF (ACSF) containing the following (in mm): 119 NaCl, 2.5 KCl, 2.5 CaCl2, 1.3 MgCl2, 1 NaH2PO4, 26.2 NaHCO3, and 11 d-glucose (and then maintained in a submerged chamber oxygenated with 95% O2/5% CO2). For experiments on spinal cord, transverse sections (300–400 μm thick) were prepared from lumbar regions (L4–L5) of cords removed from P21–P24 mice, as described above. Whole-cell recordings were made as described previously (Bergles and Jahr, 1997), using an internal solution containing the following (in mm): 120 KCH3O3S, 10 EGTA, 20 HEPES, 1 MgCl2, 2 Na2ATP, and 0.2 NaGTP, pH 7.3. Cells were voltage clamped at −90 mV, and currents were recorded with an Axopatch 200B amplifier, filtered at 3 kHz, and then digitized using pClamp software (Molecular Devices, Sunnyvale, CA). For the photolysis experiments, the caged d-aspartate analog 4-methoxy-7-nitroindolinyl (MNI)–d-aspartate (Huang et al., 2005) was dissolved in HEPES-buffered saline (HEPES ACSF) containing the following (in mm): 137 NaCl, 2.5 KCl, 2.5 CaCl2, 1.3 MgCl2, and 20 HEPES, pH 7.3, locally applied using a wide-bore pipette. The UV output of a CW Argon Laser (model 2017; Spectra-Physics, Mountain View, CA) was focused to a 50 μm spot on the soma of recorded cells, and photolysis was initiated by exposing the preparation to UV light for 1 ms by opening a computer-controlled shutter placed in the light path, as described previously (Huang et al., 2005). These experiments were done in the presence of antagonists of voltage-gated Na+ channels (tetrodotoxin at 1 μm), AMPA/kainate receptors (2,3-dioxo-6-nitro-1,2,3,4-tetrahydrobenzo[f]quinoxaline-7-sulfonamide disodium salt at 10 μm), NMDA receptors [(RS)-3-(2-carboxypiperazin-4-yl)-propyl-1-phosphonic acid at 10 μm and (5R,10S)-(+)-5-methyl-10,11-dihydro-5H-dibenzo[a,d]cyclo-hepten-5,10-imine hydrogen maleate at 50 μm], and GABAA receptors [6-imino-3-(4-methoxyphenyl)-1(6H)-pyridazinebutanoic acid dihydrobromide at 5 μm[rsqb]. For each experiment, the bath solution contained the same concentration of antagonists present in the solution containing caged compound. Statistical significance was determined use the paired Student's t test; a p value <0.05 was considered significant.
Results
Generation of GLAST and GLT-1 BAC promoter reporter mice
To monitor the activity of the GLAST promoter in situ, we created a line of transgenic mice using a BAC reporter construct in which DsRed was inserted downstream of the GLAST promoter (Fig. 1 A). From a total of 62 potential founders, three mice were found to contain the GLAST–DsRed transgene, consistent with the low probability of intact BAC integration (Takahashi et al., 2000). Offspring from two of the founders (lines 593 and 570) exhibited high DsRed expression, whereas offspring from the third (line 573) expressed DsRed at a much lower level. Although the intensity of DsRed fluorescence varied among the founders, the cellular pattern of DsRed expression was similar in each line. Gross analysis of the brains of adult GLAST–DsRed mice revealed that DsRed expression was low in the cortex but high in the cerebellum (Fig. 1 C), consistent with the dominant role of GLAST in glutamate clearance in the cerebellar cortex (Watase et al., 1998).
To monitor the activity of the GLT-1 promoter in situ, we created a second group of BAC transgenic mice in which eGFP was inserted downstream of the GLT-1 promoter (Fig. 1 B). Of 51 potential founders, two tested positive for the transgene by PCR (lines 335 and 356), with line 335 exhibiting much more intense eGFP fluorescence; as with GLAST-DsRed mice, the cellular pattern of expression was similar in both GLT-1 lines. There was remarkable complementarity between the distribution of eGFP in these mice and that of DsRed in the GLAST–DsRed mice; whereas DsRed was low in the forebrain and high in the cerebellum, eGFP fluorescence was markedly higher in the cortex than in the cerebellum (Fig. 1 D), consistent with the prominent role of GLT-1 in glutamate uptake in the forebrain (Danbolt et al., 1992; Tanaka, 1997).
Although the full-length GLAST and GLT-1 genes were contained in the respective BAC constructs, the expression of GLAST or GLT-1 mRNA was prevented by interrupting the first coding exon in the case of GLAST and the start codon in the case of GLT-1, by the reporter cDNA and poly(A) tail. On-line sequence analysis of the mouse genomic regions containing the BACs indicated that there are no other full-length genes present in either construct. Transporter protein levels were unchanged in the BAC reporter transgenic mice compared with wild-type mice (Fig. 1 E,F), indicating that the additional copies of the GLAST or GLT-1 promoters did not limit transcriptional activation of the endogenous promoters; densitometry indicated that there were no statistically significant differences in intensity between any of the transporter bands on each blot (data not shown). In accordance with these findings, mice from these transgenic lines did not exhibit gross behavioral abnormalities, and offspring were generated according to the expected Mendelian ratios.
Developmental changes in GLAST and GLT-1 promoter activity
To follow the change in GLAST promoter activity during postnatal development, we examined the pattern of DsRed expression in whole brain and in sagittal sections of hippocampus, cerebellum, and spinal cord at P1, P10, P25, and P40. GLAST promoter activity in newborn mice (P1) was highest in the cerebral cortex and periventricular proliferation zones (Fig. 2), in which it presumably enables the expression of GLAST by radial glia (Shibata et al., 1997; Hartfuss et al., 2001). By P25, GLAST promoter activity in the cortex was markedly reduced, although this promoter remained active in adults within the dentate gyrus and in white matter regions, such as the alveus of the hippocampus and the corpus callosum. In contrast, GLAST promoter activity observed in the nascent cerebellar cortex gradually increased throughout development and was maintained at a high level in adults (P40). GLAST promoter activity was also observed in both the gray and white matter of the spinal cord, in which it was particularly prominent in dorsal white matter columns (Fig. 2). These results indicate that the initial widespread GLAST promoter activity in the forebrain is progressively reduced over the first 2 postnatal weeks and that, by maturity, the activity is primarily restricted to the cerebellum, the white matter, and several niches in the forebrain.
Figure 2.

Developmental changes in GLAST promoter activity. Fluorescent images show the expression of DsRed in sagittal sections of brain tissue from GLAST–DsRed BAC transgenic mice collected at P1, P10, P25, and P40. The composite images show the entire section, reconstructed from multiple images. Scale bars: for the composite images (left column), 2 mm; for the P40 hippocampus, 150 μm; for all other images, 300 μm.
Corresponding analysis of the GLT-1–eGFP BAC reporter mice at postnatal days 1, 11, 25, and 39 revealed widespread GLT-1 promoter activity in both the developing and adult CNS (Fig. 3). At birth, GLT-1 promoter activity was also high in the periventricular germinal zones, in the emerging dentate gyrus, and in the dorsal horn of the spinal cord. The level of promoter activity increased with age in the cerebellum and spinal cord, and, in contrast to the GLAST promoter, there was a progressive increase in GLT-1 promoter activity within the gray matter of the hippocampus. Although the GLT-1 promoter was active in all gray matter regions of the adult CNS, the relative activity varied among cells in the same brain region and between cells in different brain regions. For example, cells within the suprapyramidal blade of the dentate gyrus exhibited 40% higher promoter activity than those located in the stratum radiatum region of area CA1 (Fig. 3), as estimated by measuring the intensity of eGFP fluorescence. These data suggest that GLT-1 promoter activity is subject to local control, perhaps to adjust the level of transporter expression to the amount of glutamate that is released in different brain regions.
Figure 3.

Developmental changes in GLT-1 promoter activity. Fluorescent images showing the expression of eGFP in sagittal sections of brain tissue from GLT-1–eGFP BAC transgenic mice collected at postnatal days 1, 11, 25, and 39. The composite images show the entire section, reconstructed from multiple images. Scale bars: for composite images, 2 mm; for all other images, 300 μm.
In the adult CNS, GLT-1 promoter activity was not restricted to gray matter. Weaker activity was also seen in the white matter regions of the cortex and cerebellum (Fig. 3), indicating that both GLAST and GLT-1 promoters are active in these fiber tracts. Together, these results indicate that the establishment of normal cellular patterning and synaptic connectivity in the CNS is accompanied by the maintained activation of the GLT-1 promoter in both white and gray matter regions.
Differential regional and cellular activation of transporter genes during development
To investigate the cellular pattern of GLAST and GLT-1 promoter activity, we crossed GLAST–DsRed and GLT-1–eGFP lines to create double-transgenic mice. Examination of whole-brain composites and sections from specific brain regions at postnatal days 1 and 24 revealed that there was remarkably little overlap between DsRed and eGFP expression (Fig. 4 A,B), indicating that cells have predominantly one or the other promoter active. In the cerebellum, GLAST promoter activity was concentrated at the superficial cortical layers at P1 and primarily in the Bergmann glia by P24 (Fig. 4 C,D), whereas the GLT-1 promoter was consistently activated in the granule cell layer but also overlapped with GLAST promoter activity in the Bergmann glia (Fig. 4 E).
Figure 4.
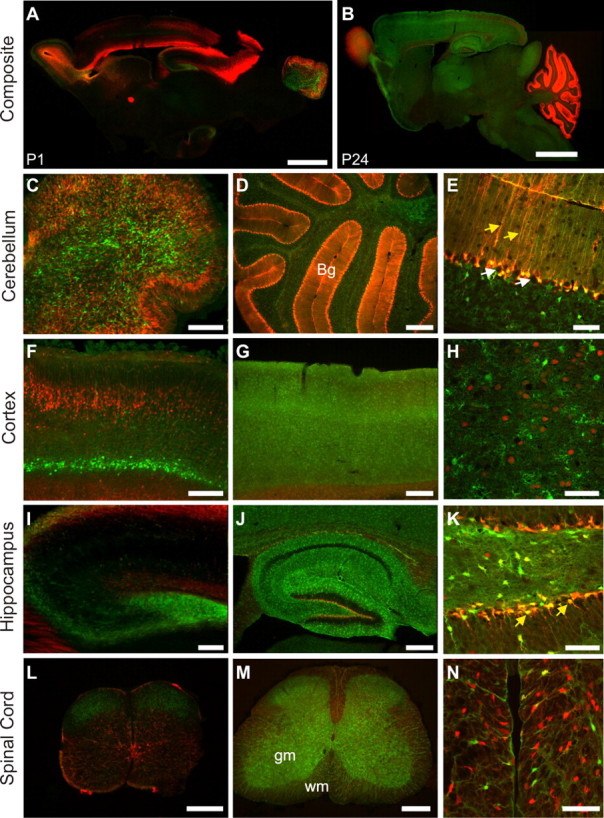
Differential glutamate transporter promoter activity among cells in the brain and spinal cord. All images are sagittal sections from GLAST–DsRed/GLT-1–eGFP double-transgenic mice. A, Composite fluorescent image showing the expression of DsRed (red) and eGFP (green) in the brain at P1. Scale bar, 2 mm. B, Composite image showing the expression of DsRed and eGFP in the P24 brain. Scale bar, 2 mm. C–E, Fluorescent images of the cerebellum at P1 (C) and P24 (D, E). Both GLAST and GLT-1 promoters were active in Bergmann glia (Bg) (yellow arrows in E), although neither promoter was active in Purkinje neurons (white arrows in E). Scale bars: C, D, 300 μm; E, 50 μm. F–H, Fluorescent images of the cortex from P1 (F) and P24 (G, H). Layer 4 is shown at higher magnification in H. Scale bars: F, G, 300 μm; H, 50 μm. I–K, Fluorescent images of the hippocampus from a P1 (I) or P24 (J, K). Both DsRed and eGFP were expressed by radial glia in the dentate gyrus (yellow arrows in K). Scale bars: I, J, 300 μm; K, 50 μm. L–N, Fluorescent images of spinal cord from a P1 (L) or P24 (M, N). gm, Gray matter; wm, white matter. A region of the ventral white matter is shown at a higher magnification in N. Scale bars: L, M, 300 μm; N, 50 μm.
In the cerebral cortex, GLAST and GLT-1 promoters were active in different layers at P1 (Fig. 4 F); initially, there was strong GLAST promoter activity in middle cortical layers, but this focal distribution dissipated by 24 d of age. Similarly, GLT-1 promoter activity was initially prominent in periventricular and deep cortical layers at P1, but, by P24, it was present throughout all cortical layers (Fig. 4 G). GLAST and GLT-1 promoter activity appeared to be primarily segregated to different cells (Fig. 4 H). For reasons not yet understood, DsRed expression was visible in the NeuN-positive (NeuN+) nuclei of some cortical neurons during early development (supplemental Fig. 1, available at www.jneurosci.org as supplemental material). In the neonatal hippocampus, the promoters for both GLAST and GLT-1 were active (Fig. 4 I), although the complimentary distribution of eGFP and DsRed suggests that cells at this age tend to express one or the other transporter. At P24 (Fig. 4 J), GLT-1 promoter activity was dominant in the hippocampus except for the subgranular layer of the dentate gyrus (Fig. 4 K) in which both promoters were active. Although GLT-1 promoter activation was localized predominantly to astroglial cells, it was also present in CA3/CA4 pyramidal neurons, as described previously (Schmitt et al., 1996; Berger and Hediger, 1998), albeit at a much lower level than in astrocytes (Figs. 3, 4 J). In the spinal cord, there was also little overlap between GLAST and GLT-1 promoter activities (Fig. 4 L,M); the GLT-1 promoter was active throughout gray matter at P24, whereas GLAST promoter activity was more prominent in both dorsal and ventral white matter tracts at this age (Fig. 4 N). These results indicate that there are marked cellular differences in the activity of the promoters for these two glutamate transporters in the developing brain and spinal cord.
Glutamate transporters are abundant in white matter astrocytes
GLT-1 (EAAT2) is the predominant glutamate transporter in the mammalian brain (Danbolt, 2001), accounting for up to 90% of total glutamate uptake in CNS tissue (Rothstein et al., 1996; Tanaka, 1997). In gray matter, this transporter is highly expressed by astrocytes (Rothstein et al., 1994; Lehre et al., 1995; Bergles and Jahr, 1997). Consistent with these findings, in GLT-1–eGFP mice, eGFP was expressed in small cells throughout the gray matter that were immunoreactive for GFAP (Fig. 5 A–C). Local photolysis of MNI–d-aspartate (125 μm), a caged substrate of glutamate transporters (Huang et al., 2005), induced a transient inward current in these cells that was inhibited 95.0 ± 0.3% (n = 3) by the selective glutamate transporter inhibitor d,l-threo-B-benzyloxyaspartate (TBOA) (200 μm) (Fig. 5 D), indicating that glutamate transporters were abundant in the membranes of astrocytes from these mice. Previous studies have shown that these currents are carried primarily by GLT-1 (Huang et al., 2004).
Figure 5.

Glutamate transporters are expressed by astrocytes in both gray and white matter. A, Confocal fluorescence image of the CA1 region of the hippocampus from a P24 GLT-1–eGFP BAC mouse, incubated with an antibody (ab) against GFAP, showing the distribution of eGFP (green) and GFAP (blue). B, C, Higher-magnification images of the region delimited by the white box in A, showing expression of eGFP (B) by GFAP+ astrocytes (C). D, Whole-cell recording of glutamate transporter currents elicited in a stratum radiatum astrocyte (identified expression of eGFP) in response to photolysis of MNI–d-aspartate (125 μm). The red trace shows the response recorded in the presence of the glutamate transporter antagonist TBOA (300 μm). P34 GLT-1–eGFP BAC mouse. E, Confocal fluorescence image of the corpus callosum from a P24 GLT-1–eGFP BAC mouse showing the distribution of eGFP in the corpus callosum. F, G, Higher-magnification images of the region delimited by the white box in E, showing expression of eGFP (F) by GFAP+ astrocytes (G) in this white matter region. H, Whole-cell recording of glutamate transporter currents elicited in a corpus callosum astrocyte (identified expression of eGFP) in response to photolysis of MNI–d-aspartate (125 μm). The red trace shows the response recorded in the presence of the glutamate transporter antagonist TBOA (300 μm). P34 GLT-1–eGFP BAC transgenic mouse.
Although the overall level of eGFP fluorescence was markedly lower in the white matter of the corpus callosum, higher-magnification imaging revealed that many small eGFP+/GFAP+ cells were present within these fiber tracts (Fig. 5 E–G), indicating that the GLT-1 promoter was also active in white matter astrocytes. The eGFP fluorescence of astrocyte somata in white matter was 86% of that of astrocytes in the hippocampus (n = 74 cells in four sections). Consistent with these findings, photolysis of MNI–d-aspartate (125 μm) induced transporter currents in callosal astrocytes that were comparable (peak amplitude, −209 ± 38 pA; n = 5) with those recorded from hippocampal astrocytes under similar conditions (peak amplitude, −232 ± 30 pA; n = 4; p = 0.827). However, transporter currents in callosal astrocytes decayed much more slowly (half-decay time: corpus callosum, 35.5 ± 5.8 ms, n = 5; hippocampus, 5.3 ± 0.1 ms, n = 4; p < 0.001) (Fig. 5 D,H), suggesting that the rate of d-aspartate clearance is much slower in white matter. To probe the uptake capacity of astrocytes in both regions, we increased the amount of d-aspartate that was photoreleased by increasing the intensity of illumination and the concentration of MNI–d-aspartate (500 μm); under these conditions, a second UV exposure applied 5 ms after the first produced little additional increase in response amplitude, indicating that transporters were close to saturation. The amplitude of transporter currents elicited under these near-saturating conditions was −1030 ± 111 pA (n = 4) in the hippocampus and −649 ± 60 pA (n = 4) in the corpus callosum (p < 0.05), indicating that astrocytes in the corpus callosum express significantly fewer glutamate transporters than astrocytes in the hippocampus. The greater difference between transporter currents than eGFP levels in these areas may indicate that there also could be regional variations in posttranscriptional regulation of GLT-1.
GLAST and GLT-1 transporters are expressed by radial glial cells of the dentate gyrus
In the hippocampus, both GLT-1 and GLAST promoters were active in GFAP+ astrocytes; of 102 cells examined in hippocampal slices from P24 double BAC transgenic mice, 85% of GFAP+ astrocytes exhibited both eGFP and DsRed fluorescence. However, the relative intensities of eGFP and DsRed varied considerably among cells (Fig. 6 A,B), suggesting that there are functional differences even among neighboring astrocytes. Within the dentate gyrus, both GLAST and GLT-1 promoters were also active in GFAP+ radial glia clustered in the subgranular layer (Fig. 6 A–C). Within the subgranular zone, DsRed expression colocalized with the filamentous protein nestin (Fig. 6 D,E), confirming that the GLAST promoter was active in these neural progenitor cells (Zimmerman et al., 1994). The intensity of DsRed was much higher in radial glia than in astrocytes, suggesting that the activity of the GLAST promoter is higher in the progenitors. Local photolysis of MNI–d-aspartate (125 μm) induced large-amplitude (−533 ± 54 pA; n = 4) transporter currents in radial glia that were inhibited 92 ± 1% by TBOA (200 μm; n = 4) (Fig. 6 F), indicating that these cells may contribute significantly to glutamate uptake in this region of the dentate gyrus. Although DsRed expression was markedly elevated in radial glia compared with astrocytes, transporter currents from radial glia were still inhibited 61 ± 2% by dihydrokainate (DHK) (300 μm), a selective antagonist of GLT-1, indicating that both transporters contribute to uptake in these cells.
Figure 6.

The GLAST promoter is active in astrocytes and neural progenitor cells of the adult hippocampus. A–C, Confocal fluorescence images of the dentate gyrus from a GLAST–DsRed/GLT-1–eGFP double-transgenic mouse brain section incubated with an antibody (ab) against GFAP. A, DsRed expression by cells in the subgranular zone (yellow arrow) and within the granule cell layer (gcl) (green arrow). A number of weakly fluorescent cells were also visible (red arrows) within the gcl. B, Fluorescent image of the same region shown in A, showing the expression of eGFP. C, GFAP immunoreactivity from the same region. Scale bar, 50 μm. D, Fluorescent image of the dentate gyrus from a GLAST–DsRed mouse showing expression of DsRed by cells in the subgranular zone that send processes (blue arrows) into the gcl. E, Corresponding nestin immunoreactivity for the region shown in D. Scale bar, 20 μm. F, Whole-cell recording of glutamate transporter currents from radial glia in the dentate gyrus in response to photolysis of MNI–d-aspartate (125 μm), under control conditions (black trace), or in the presence of DHK (300 μm; blue trace) or TBOA (300 μm; red trace). Inset shows the response of this cell to voltage steps (−50, −30, −10, 10, 30, and 50 mV). Calibration: 100 ms, 2 nA. The linear current response is characteristic of glial cells. P26 GLAST–DsRed mouse.
Numerous weakly DsRed+ cells were also observed within the granule cell layer of the dentate gyrus (Fig. 6 A); these cells were GFAP negative (GFAP−) (Fig. 6 C), indicating that they were not radial glia or astrocytes. After asymmetric division, newly generated granule cells migrate into the granule cell layer, raising the possibility that these cells were immature granule cells. Consistent with this hypothesis, in two of four recordings from these weakly DsRed+ cells, action potentials were elicited by injection of positive current (data not shown). These results suggest that either the GLAST promoter remains active for several days after neurogenesis or that DsRed persists after the promoter is silenced. In support of the latter hypothesis, transporter currents were not observed in these recently generated granule cells in response to photolysis of MNI–d-aspartate (500 μm; n = 4).
GLT-1 promoter activity is lower in spinal cord astrocytes
GLT-1 promoter activity was also observed in astrocytes throughout the ventral and dorsal spinal cord (Fig. 7 A); however, the intensity of eGFP fluorescence in these cells was much lower than that observed in astrocytes located in the dentate gyrus or CA1 regions of the hippocampus. A comparison of the fluorescence in 30 hippocampal CA1 astrocytes located in stratum radiatum to 34 astrocytes in the ventral spinal cord indicated that the average level in spinal cord was only 38% of that in hippocampus (Fig. 7 B), suggesting that GLT-1 may be less abundant in spinal cord. In accordance with the lower apparent promoter activity in spinal cord, Western analysis revealed that spinal cord tissue contained much less GLT-1 protein than hippocampal tissue (Fig. 7 C). These findings were further corroborated by functional analysis of transporter currents in astrocytes located in the ventral horn. Transporter currents induced by photolysis of MNI–d-aspartate (500 μm) were almost 10-fold smaller (peak amplitude, −119 ± 13 pA; n = 6; p < 0.001) than currents recorded from hippocampal astrocytes under comparable conditions (Fig. 7 D). Photoliberation of d-aspartate also induced an inward current in spinal cord astrocytes that had very slow rise and decay kinetics. Previous studies suggest that this slow current reflects the rise and decay of extracellular potassium, which is released during transporter cycling (Bergles and Jahr, 1997; Huang et al., 2005). The greater prominence of this component in responses from spinal cord astrocytes arises primarily from the smaller relative size of the transporter current, although it is also possible that spinal cord tissue has a lower capacity for potassium clearance.
To determine the relative level of GLAST and GLT-1 promoter activity among cells in the spinal cord, we examined lumbar tissue from GLAST–DsRed/GLT-1–eGFP double-transgenic mice. In these sections, GFAP+ astrocytes were consistently eGFP+, indicating that there is robust GLT-1 promoter activity in this population of glia (Fig. 7 E). However, there was striking segregation between eGFP and DsRed among cells in the spinal cord, with few cells exhibiting expression of both fluorescent proteins (Fig. 7 F,G), suggesting that cells in these regions may express either GLAST or GLT-1. Indeed, transporter currents in spinal cord astrocytes were completely blocked by DHK (300 μm; n = 6) (Fig. 7 D), indicating that there were few GLAST transporters in their membranes. Together, these results indicate that GLT-1 is primarily responsible for glutamate uptake into spinal cord astrocytes.
The GLAST promoter is active in oligodendrocytes
Throughout the adult CNS, DsRed was expressed in GFAP− cells that were also immunonegative for the neuronal marker NeuN (data not shown), indicating that the GLAST promoter is also active in non-astrocytic glial cells. Because these DsRed+ cells were abundant in white matter, we tested whether this promoter was active in oligodendrocytes by crossing GLAST–DsRed mice with mice that express eGFP under control of the oligodendrocyte marker myelin PLP (Mallon et al., 2002) to visualize oligodendrocytes. In the spinal ventral horn of these double reporter mice, there was considerable overlap between DsRed and eGFP (Fig. 8 A–C), indicating that the GLAST promoter is active in oligodendrocytes. Transporter currents recorded from DsRed+/eGFP+ cells in these mice were, however, very small (≤5 pA; n = 8; 500 μm MNI–d-aspartate). In four cells, this component was blocked by DHK (Fig. 8 D), indicating that these uptake currents were mediated by GLT-1.
Figure 8.

The GLAST promoter is active in oligodendrocytes in CNS white matter. A–C, Confocal fluorescent images of the ventral horn of the spinal cord from a P24 GLAST–DsRed/PLP–eGFP double-transgenic mouse, showing expression of DsRed by many eGFP+ cells (arrows). Scale bar, 50 μm. D, Whole-cell recording of glutamate transporter currents from a DsRed+/eGFP+ oligodendrocyte in the ventral horn of the spinal cord from a P21 GLAST–DsRed/PLP–eGFP double-transgenic mouse, showing responses recorded under control conditions (black trace) and in the presence of DHK (300 μm; blue trace) or TBOA (300 μm; red trace). Transporter currents were elicited in response to brief photolysis (duration shown by black trace above) of MNI–d-aspartate (500 μm). E–H, Confocal fluorescent images from the striatum from a GLAST–DsRed/PLP–eGFP double-transgenic mouse at P24 (E–G) and at P10 (H). Scale bar, 50 μm. I–K, Fluorescent image of the corpus callosum from this double-transgenic mouse, showing expression of DsRed (I) and eGFP (J) by cells in this region. The two channels have been merged in K, and several cells that express only eGFP (green circles), DsRed (red circles), or both fluorescent proteins (yellow circles) have been highlighted. Scale bar, 50 μm. L, Whole-cell recording of glutamate transporter currents from a DsRed+/eGFP+ oligodendrocyte in the corpus callosum (P26 GLAST–DsRed/PLP–eGFP mouse), showing the response under control conditions (black trace) and in the presence of DHK (300 μm; blue trace) or TBOA (300 μm; red trace). Transporter currents were elicited in response to brief photolysis (duration shown by black trace above) of MNI–d-aspartate (125 μm).
In the white matter of the striatum and corpus callosum, extensive overlap between DsRed and eGFP was also observed in GLAST–DsRed/PLP–eGFP mice (Fig. 8 E–K); in the striatum, the laterally projecting processes of these mature oligodendrocytes were clearly visible (Fig. 8 F). In this region, colocalization was observed at P24 (Fig. 8 E–G) and P43 (data not shown) but not at P10 (Fig. 8 H), suggesting that expression of DsRed by these oligodendrocytes reflects recent promoter activity rather than persistence of DsRed expressed during a previous developmental stage. Additional analysis of GLAST–BAC–DsRed/PLP–eGFP offspring at postnatal days 10, 24, and 43 indicated that the GLAST promoter is active in oligodendrocytes in many CNS white matter regions and that the level of promoter activity increases with age.
Within the corpus callosum, approximately half of the DsRed+ cells in GLAST–DsRed/PLP–eGFP mice were eGFP+ (Fig. 8 K). Transporter currents recorded from these DsRed+/eGFP+ oligodendrocytes had an average peak amplitude of −100 ± 30 pA (n = 5) (125 μm MNI–d-aspartate), indicating that many more transporters were expressed by oligodendrocytes in this white matter tract than in the ventral white matter of the spinal cord. Although these cells could be clearly identified based on DsRed expression, transporter currents recorded from these oligodendrocytes were inhibited 80 ± 2% (n = 5) by DHK (300 μm) (Fig. 8 L), suggesting that only ∼20% of the cell surface transporters were GLAST. Together, these results indicate that mature oligodendrocytes in white matter express glutamate transporters and are capable of clearing glutamate within these fiber tracts.
Discussion
Here we describe the generation and analysis of two lines of BAC transgenic mice in which the expression of the fluorescent proteins DsRed or eGFP are controlled by the promoters for the glutamate transporters GLAST and GLT-1, respectively. These promoter reporter mice provide the opportunity to identify specific transporter-expressing cells, to analyze transporter function in living slices, to easily view the activation levels of each promoter in the same tissue, and to assess upregulation and downregulation of transporter promoter activation in different pathological, physiological, and pharmaceutical paradigms. The in situ analysis of the distribution and level of promoter activity reported here extends previous studies of the expression of GLAST and GLT-1 mRNA and protein (Lehre et al., 1995; Schmitt et al., 1996, 1997; Berger and Hediger, 1998; Berger et al., 2005) by providing new functional assessments of the expression and regulation of these two dominant glutamate transporters in CNS tissues.
Transporter promoter activity in the developing brain
The widespread expression of both DsRed and eGFP in these reporter mice at birth, at a time when glia are actively generated and neural circuits have only begun to form, suggests that induction of transporter expression is a very early event in CNS development. Although the formation of excitatory synapses peaks at P14 in mouse, glutamate has been shown to influence the proliferation, migration, and differentiation of both neurons and glia in the developing brain, indicating that glutamate also plays an essential role as a morphogen and trophic factor (Balazs, 2006). Consistent with these findings, mice that lack both GLAST and GLT-1 show profound developmental abnormalities, including improper cortical layering, perhaps attributable to a disruption in radial glial fibers and reduced proliferation of neuronal progenitors (Matsugami et al., 2006). Thus, initiation of glutamate transporter promoter activity appears to be essential for ensuring the proper spatial and temporal activation of receptors in both the developing and mature nervous system.
Glutamate transporter expression by neural progenitors
The GLAST promoter was rapidly downregulated in the forebrain after the first postnatal week such that, by 3 weeks of age, appreciable promoter activity was only observed in the white matter and in the dentate gyrus of the hippocampus. Neurogenesis continues throughout life within the subgranular zone of the dentate gyrus, in which asymmetric division of radial glia results in the generation of migratory neuroblasts that later differentiate into granule neurons (Sohur et al., 2006). The GLAST promoter continued to be highly active within these nestin+ radial glia, and these cells exhibited large glutamate transporter currents in response to photolysis of caged d-aspartate. However, glutamate uptake by these cells was not accomplished solely by GLAST, because they also exhibited GLT-1 promoter activity and transporter currents were inhibited ∼60% by the GLT-1 antagonist DHK. Nevertheless, these results suggest that these progenitors contribute substantially to glutamate homeostasis within this germinal layer.
In addition to the prominent DsRed expression by radial glia, much weaker DsRed expression was observed in cells within the granule cell layer. These cells had properties consistent with newly generated granule cells (Overstreet et al., 2004), several of which could be induced to fire action potentials with current injection. Because mature granule cells do not express GLAST (Rothstein et al., 1994), this promoter must be rapidly suppressed in daughter cells as they shift from expressing glial genes to neuronal genes. The presence of DsRed within these nascent granule cells likely reflects persistence of DsRed after promoter activity has stopped rather than a continued low level of activity of the promoter, because transporter currents were not detected in these cells. Nevertheless, the persistence of DsRed in these neurons provides a useful marker to identify and examine the properties of these recently born neurons.
Segregation of transporter promoter activity among different glia
From images of the GLAST–DsRed/GLT-1–eGFP double-transgenic mice, we observed that there were two populations of cells in most CNS tissues examined: one population that demonstrated primarily GLAST promoter activation and another that demonstrated primarily GLT-1 promoter activation. In fact, substantial overlap of reporter expression in the double BAC transgenic mice was rarely seen in brain or spinal cord, which correlated with a limited immunohistochemistry study of human orthologs EAAT1 and EAAT2 (Banner et al., 2002). Close inspection of brain slices from these double-transgenic mice by confocal microscopy revealed nearly complete independent expression in both white and gray matter of the spinal cord, and similar independent expression of GLAST and GLT-1 was seen in cortex, striatum, and brainstem. This could not readily be appreciated from previous immunostaining studies in which the ubiquitous expression of the transporters in neuropil membranes precluded easy and reliable colocalization. Conversely, distinct dual expression in our double-transgenic mice was observed in the dentate gyrus of the hippocampus and in cerebellar radial glia.
The combination of gene expression and functional analysis of transporter currents do not support the widespread simultaneous equivalent expression of GLAST and GLT-1 in individual cells; rather, they suggest that either GLAST or GLT-1 is strongly dominant in different cellular populations. Cells that coexpressed GLT-1 and GLAST were always GFAP+ astrocytes, outside of the germinal zone of the dentate gyrus, whereas GLAST promoter activity was often observed in oligodendroglia. Several previous studies have attempted to address GLAST/GLT-1 astrocytic colocalization using immunoelectron microscopy (Lehre et al., 1995; Haugeto et al., 1996) or in situ hybridization (Berger and Hediger, 1998). Using in situ hybridization, Berger and Hediger reported that, in the majority of brain astrocytes, there is simultaneous expression of both GLAST and GLT-1 mRNA, albeit at different levels. We also see colocalization in occasional cells of the hippocampus and corpus callosum. However, the majority of cells in the brain demonstrate either GLAST promoter activation alone or strong GLT-1 promoter activation accompanied by very weak GLAST promoter activation. The difference in results between our data and that of the double-hybridization study (Berger and Hediger, 1998) may be related to several variables, including the difference in resolution possible with the two techniques and the variable different times points examined. The differential expression in astrocyte populations suggests different promoter/cellular regulatory pathways that could be based on local environmental cues. Our previous in vitro (Swanson et al., 1997; Schlag et al., 1998) and in vivo (Ginsberg et al., 1995, 1996) work had demonstrated that neurons can provide important environmental cues to local GLT-1 and GLAST expression. The transcriptional pathways for the cell-specific regulation are unknown.
Glutamate transporter expression by glia in spinal cord
Astrocytes in the gray matter of the spinal cord from GLT-1–eGFP mice exhibited robust eGFP fluorescence, consistent with the dense expression of GLT-1 in these regions (Rothstein et al., 1994). However, comparisons of the relative amount of promoter activity, based on the intensity of eGFP fluorescence, between gray matter astrocytes in the spinal cord and brain indicated that spinal cord astrocytes exhibited less than half the promoter activity of astrocytes in brain. Measurements of GLT-1 abundance by Western blot or through recordings of glutamate transporter currents confirmed that the density of GLT-1 was dramatically lower in spinal cord. If the level of promoter activity serves to match transporter expression to the amount of glutamate released, these differences may indicate that spinal gray matter has a lower density of excitatory synapses or that these inputs exhibit lower rates of activity. Because sustained increases in ambient glutamate may be a major culprit in chronic glutamate toxicity, the lower uptake capacity of spinal cord astrocytes could make this region highly vulnerable. Indeed, in amyotrophic lateral sclerosis and animal models of the disease, in which a substantial reduction in GLT-1 expression occurs, glutamate toxicity has been shown to contribute to cell death (Fray et al., 1998). The lower overall expression of transporters in spinal cord may provide an explanation why relatively small increases in transporter expression in spinal cord were neuroprotective (Guo et al., 2003; Rothstein et al., 2005).
Expression of glutamate transporters by glia within white matter
White matter regions of the CNS contain axons that enable rapid exchange of information between specialized brain regions. Although glutamatergic signaling was thought to occur primarily at synapses in gray matter, recent studies indicate that unmyelinated axons within white matter are capable of releasing glutamate through vesicular fusion (Ziskin et al., 2007). Glutamate that is released at these sites activates AMPA receptors in NG2+ cells, a population of glial progenitors. Our studies indicate that the GLT-1 promoter is active in astrocytes within white matter tracts, and astrocytes within the corpus callosum exhibited glutamate transporter currents that were ∼60% as large as those exhibited by hippocampal astrocytes, indicating that they express glutamate transporters at a high density. In addition, both GLT-1 and GLAST were expressed by some oligodendrocytes, although at a much lower level than that in astrocytes. Glutamate receptors are also expressed by astrocytes and oligodendrocytes within these fiber tracts (Jensen, 2002, 2005; Deng et al., 2006a), suggesting that GLAST and GLT-1 may be critical for both regulating ambient glutamate levels and restricting glutamate diffusion (Huang and Bergles, 2004). Consistent with this hypothesis, pharmacological inhibition of glutamate transporters or antisense knockdown of GLT-1 expression results in widespread excitotoxic damage to oligodendrocytes in optic nerve (Domercq et al., 2005).
Glutamate-induced excitotoxic damage to oligodendrocytes and their progenitors is often observed after ischemia, which leads to a loss of myelin and could be a contributing factor in cerebral palsy and multiple sclerosis (Deng et al., 2006b; Jensen, 2006). Although these studies indicate that glutamate transporters are expressed by both astrocytes and oligodendrocytes in white matter, transporter currents decayed more than six times more slowly in white matter than in gray matter. These results suggest that the rate of glutamate clearance and thus the uptake capacity of white matter is substantially lower than that of gray matter, raising the possibility that transporter saturation contributes to prolonged elevation of extracellular glutamate during ischemic episodes. These results suggest that therapeutics that target aspects of the glutamate signaling pathway, in particular those that enhance the expression of glutamate transporters (Rothstein et al., 2005), might also prove effective in preventing excitotoxic damage to oligodendrocytes and their progenitors in white matter.
The promoter reporter mice for GLAST and GLT-1 described here have revealed a differential cellular expression of glutamate transporters in the developing and mature CNS. These new mouse models provide new tools with which to examine dynamic regulation of these transporters in astrocytes and oligodendrocytes in the normal and diseased nervous system. Genetic manipulation of astrocytes has been achieved primarily using a fragment of the human GFAP promoter (Brenner et al., 1994; Lee et al., 2006); the widespread, high level of expression of the GLT-1–BAC described here indicates that this promoter sequence also could be used to influence astrocyte biology in vivo. In addition, both lines of reporter mice will be useful for monitoring transporter expression in different cell types during disease states, for assessing the efficacy of drugs affecting glutamate transporter expression, and for targeting different groups of cells for physiological studies.
Footnotes
This work was supported by National Institutes of Health Grants NS44261 (D.E.B.) PAR-02-059 (D.E.B., J.D.R.), and NS 33958, NS50094, and NS52179 (J.D.R.). We thank the Nat Heintz laboratory for the shuttle vectors and protocols used to perform the BAC recombinations, Joe Lewcock and Shin Kang for their advice regarding generation of the BAC promoter reporter constructs, Pratima Dulloor for her cloning work, Lyudmila Mamedova and Natalie Perez for breeding and genotyping of transgenic mice, Jean Brennan for assistance with imaging, and Wendy Macklin for the PLP–eGFP promoter reporter mice. We thank Graham C. Ellis-Davies for the gift of MNI-D-aspartate.
References
- Balazs R. Trophic effect of glutamate. Curr Top Med Chem. 2006;6:961–968. doi: 10.2174/156802606777323700. [DOI] [PubMed] [Google Scholar]
- Banner SJ, Fray AE, Ince PG, Steward M, Cookson MR, Shaw PJ. The expression of the glutamate re-uptake transporter excitatory amino acid transporter 1 (EAAT1) in the normal human CNS and in motor neurone disease: an immunohistochemical study. Neuroscience. 2002;109:27–44. doi: 10.1016/s0306-4522(01)00437-7. [DOI] [PubMed] [Google Scholar]
- Berger UV, Hediger MA. Comparative analysis of glutamate transporter expression in rat brain using differential double in situ hybridization. Anat Embryol (Berl) 1998;198:13–30. doi: 10.1007/s004290050161. [DOI] [PubMed] [Google Scholar]
- Berger UV, Desilva TM, Chen W, Rosenberg PA. Cellular and subcellular mRNA localization of glutamate transporter isoforms GLT1a and GLT1b in rat brain by in situ hybridization. J Comp Neurol. 2005;492:78–89. doi: 10.1002/cne.20737. [DOI] [PMC free article] [PubMed] [Google Scholar]
- Bergles DE, Jahr CE. Synaptic activation of glutamate transporters in hippocampal astrocytes. Neuron. 1997;19:1297–1308. doi: 10.1016/s0896-6273(00)80420-1. [DOI] [PubMed] [Google Scholar]
- Brenner M, Kisseberth WC, Su Y, Besnard F, Messing A. GFAP promoter directs astrocyte-specific expression in transgenic mice. J Neurosci. 1994;14:1030–1037. doi: 10.1523/JNEUROSCI.14-03-01030.1994. [DOI] [PMC free article] [PubMed] [Google Scholar]
- Choi DW. Glutamate neurotoxicity and diseases of the nervous system. Neuron. 1988;1:623–634. doi: 10.1016/0896-6273(88)90162-6. [DOI] [PubMed] [Google Scholar]
- Choi DW, Maulucci-Gedde M, Kriegstein AR. Glutamate neurotoxicity in cortical cell culture. J Neurosci. 1987;7:357–368. doi: 10.1523/JNEUROSCI.07-02-00357.1987. [DOI] [PMC free article] [PubMed] [Google Scholar]
- Danbolt NC. Glutamate uptake. Prog Neurobiol. 2001;65:1–105. doi: 10.1016/s0301-0082(00)00067-8. [DOI] [PubMed] [Google Scholar]
- Danbolt NC, Storm-Mathisen J, Kanner BI. An [Na+ + K+]coupled l-glutamate transporter purified from rat brain is located in glial cell processes. Neuroscience. 1992;51:295–310. doi: 10.1016/0306-4522(92)90316-t. [DOI] [PubMed] [Google Scholar]
- Deng W, Neve RL, Rosenberg PA, Volpe JJ, Jensen FE. Alpha-amino-3-hydroxy-5-methyl-4-isoxazole propionate receptor subunit composition and cAMP-response element-binding protein regulate oligodendrocyte excitotoxicity. J Biol Chem. 2006a;281:36004–36011. doi: 10.1074/jbc.M606459200. [DOI] [PubMed] [Google Scholar]
- Deng W, Yue Q, Rosenberg PA, Volpe JJ, Jensen FE. Oligodendrocyte excitotoxicity determined by local glutamate accumulation and mitochondrial function. J Neurochem. 2006b;98:213–222. doi: 10.1111/j.1471-4159.2006.03861.x. [DOI] [PubMed] [Google Scholar]
- Domercq M, Etxebarria E, Perez-Samartin A, Matute C. Excitotoxic oligodendrocyte death and axonal damage induced by glutamate transporter inhibition. Glia. 2005;52:36–46. doi: 10.1002/glia.20221. [DOI] [PubMed] [Google Scholar]
- Fray AE, Ince PG, Banner SJ, Milton LD, Usher PA, Cookson MR, Shaw PJ. The expression of the glial glutamate transporter protein EAAT2 in motor neuron disease: an immunohistochemical study. Eur J Neurosci. 1998;10:2481–2489. doi: 10.1046/j.1460-9568.1998.00273.x. [DOI] [PubMed] [Google Scholar]
- Furuta A, Rothstein JD, Martin LJ. Glutamate transporter protein subtypes are expressed differentially during rat CNS development. J Neurosci. 1997;17:8363–8375. doi: 10.1523/JNEUROSCI.17-21-08363.1997. [DOI] [PMC free article] [PubMed] [Google Scholar]
- Ginsberg SD, Martin LJ, Rothstein JD. Regional deafferentation down-regulates subtypes of glutamate transporter proteins. J Neurochem. 1995;65:2800–2803. doi: 10.1046/j.1471-4159.1995.65062800.x. [DOI] [PubMed] [Google Scholar]
- Ginsberg SD, Rothstein JD, Price DL, Martin LJ. Fimbria-fornix transections selectively down-regulate subtypes of glutamate transporter and glutamate receptor proteins in septum and hippocampus. J Neurochem. 1996;67:1208–1216. doi: 10.1046/j.1471-4159.1996.67031208.x. [DOI] [PubMed] [Google Scholar]
- Gong S, Yang XW, Li C, Heintz N. Highly efficient modification of bacterial artificial chromosomes (BACs) using novel shuttle vectors containing the R6Kgamma origin of replication. Genome Res. 2002;12:1992–1998. doi: 10.1101/gr.476202. [DOI] [PMC free article] [PubMed] [Google Scholar]
- Guo H, Lai L, Butchbach ME, Stockinger MP, Shan X, Bishop GA, Butchbach ME, et al. Increased expression of the glial glutamate transporter EAAT2 modulates excitotoxicity and delays the onset but not the outcome of ALS in mice. Hum Mol Genet. 2003;12:2519–2532. doi: 10.1093/hmg/ddg267. [DOI] [PubMed] [Google Scholar]
- Hartfuss E, Galli R, Heins N, Gotz M. Characterization of CNS precursor subtypes and radial glia. Dev Biol. 2001;229:15–30. doi: 10.1006/dbio.2000.9962. [DOI] [PubMed] [Google Scholar]
- Haugeto O, Ullensvang K, Levy LM, Chaudhry FA, Honore T, Nielsen M, Lehre KP, Danbolt NC. Brain glutamate transporter proteins form homomultimers. J Biol Chem. 1996;271:27715–27722. doi: 10.1074/jbc.271.44.27715. [DOI] [PubMed] [Google Scholar]
- Huang YH, Bergles DE. Glutamate transporters bring competition to the synapse. Curr Opin Neurobiol. 2004;14:346–352. doi: 10.1016/j.conb.2004.05.007. [DOI] [PubMed] [Google Scholar]
- Huang YH, Sinha SR, Tanaka K, Rothstein JD, Bergles DE. Astrocyte glutamate transporters regulate metabotropic glutamate receptor-mediated excitation of hippocampal interneurons. J Neurosci. 2004;24:4551–4559. doi: 10.1523/JNEUROSCI.5217-03.2004. [DOI] [PMC free article] [PubMed] [Google Scholar]
- Huang YH, Sinha SR, Fedoryak OD, Ellis-Davies GC, Bergles DE. Synthesis and characterization of 4-methoxy-7-nitroindolinyl-d-aspartate, a caged compound for selective activation of glutamate transporters and N-methyl-d-aspartate receptors in brain tissue. Biochemistry. 2005;44:3316–3326. doi: 10.1021/bi048051m. [DOI] [PubMed] [Google Scholar]
- Jensen FE. The role of glutamate receptor maturation in perinatal seizures and brain injury. Int J Dev Neurosci. 2002;20:339–347. doi: 10.1016/s0736-5748(02)00012-6. [DOI] [PubMed] [Google Scholar]
- Jensen FE. Role of glutamate receptors in periventricular leukomalacia. J Child Neurol. 2005;20:950–959. doi: 10.1177/08830738050200120401. [DOI] [PubMed] [Google Scholar]
- Jensen FE. Developmental factors regulating susceptibility to perinatal brain injury and seizures. Curr Opin Pediatr. 2006;18:628–633. doi: 10.1097/MOP.0b013e328010c536. [DOI] [PubMed] [Google Scholar]
- Kim SY, Choi SY, Chao W, Volsky DJ. Transcriptional regulation of human excitatory amino acid transporter 1 (EAAT1): cloning of the EAAT1 promoter and characterization of its basal and inducible activity in human astrocytes. J Neurochem. 2003;87:1485–1498. doi: 10.1046/j.1471-4159.2003.02128.x. [DOI] [PubMed] [Google Scholar]
- Lee Y, Su M, Messing A, Brenner M. Astrocyte heterogeneity revealed by expression of a GFAP-LacZ transgene. Glia. 2006;53:677–687. doi: 10.1002/glia.20320. [DOI] [PubMed] [Google Scholar]
- Lehre KP, Levy LM, Ottersen OP, Storm-Mathisen J, Danbolt NC. Differential expression of two glial glutamate transporters in the rat brain: quantitative and immunocytochemical observations. J Neurosci. 1995;15:1835–1853. doi: 10.1523/JNEUROSCI.15-03-01835.1995. [DOI] [PMC free article] [PubMed] [Google Scholar]
- Li S, Mallory M, Alford M, Tanaka S, Masliah E. Glutamate transporter alterations in Alzheimer disease are possibly associated with abnormal APP expression. J Neuropathol Exp Neurol. 1997;56:901–911. doi: 10.1097/00005072-199708000-00008. [DOI] [PubMed] [Google Scholar]
- Mallon BS, Shick HE, Kidd GJ, Macklin WB. Proteolipid promoter activity distinguishes two populations of NG2-positive cells throughout neonatal cortical development. J Neurosci. 2002;22:876–885. doi: 10.1523/JNEUROSCI.22-03-00876.2002. [DOI] [PMC free article] [PubMed] [Google Scholar]
- Masliah E, Alford M, Mallory M, Rockenstein E, Moechars D, Van LF. Abnormal glutamate transport function in mutant amyloid precursor protein transgenic mice. Exp Neurol. 2000;163:381–387. doi: 10.1006/exnr.2000.7386. [DOI] [PubMed] [Google Scholar]
- Matsugami TR, Tanemura K, Mieda M, Nakatomi R, Yamada K, Kondo T, Ogawa M, Obata K, Watanabe M, Hashikawa T, Tanaka K. Indispensability of the glutamate transporters GLAST and GLT1 to brain development. Proc Natl Acad Sci USA. 2006;103:12161–12166. doi: 10.1073/pnas.0509144103. [DOI] [PMC free article] [PubMed] [Google Scholar]
- Overstreet LS, Hentges ST, Bumaschny VF, de Souza FS, Smart JL, Santangelo AM, Low MJ, Westbrook GL, Rubinstein M. A transgenic marker for newly born granule cells in dentate gyrus. J Neurosci. 2004;24:3251–3259. doi: 10.1523/JNEUROSCI.5173-03.2004. [DOI] [PMC free article] [PubMed] [Google Scholar]
- Rothstein JD, Martin LJ, Kuncl RW. Decreased glutamate transport by the brain and spinal cord in amyotrophic lateral sclerosis. N Engl J Med. 1992;326:1464–1468. doi: 10.1056/NEJM199205283262204. [DOI] [PubMed] [Google Scholar]
- Rothstein JD, Martin L, Levey AI, Dykes-Hoberg M, Jin L, Wu D, Nash N, Kuncl RW. Localization of neuronal and glial glutamate transporters. Neuron. 1994;13:713–725. doi: 10.1016/0896-6273(94)90038-8. [DOI] [PubMed] [Google Scholar]
- Rothstein JD, Van Kammen M, Levey AI, Martin LJ, Kuncl RW. Selective loss of glial glutamate transporter GLT-1 in amyotrophic lateral sclerosis. Ann Neurol. 1995;38:73–84. doi: 10.1002/ana.410380114. [DOI] [PubMed] [Google Scholar]
- Rothstein JD, Dykes-Hoberg M, Pardo CA, Bristol LA, Jin L, Kuncl RW, Kanai Y, Hediger MA, Wang Y, Schielke JP, Welty DF. Knockout of glutamate transporters reveals a major role for astroglial transport in excitotoxicity and clearance of glutamate. Neuron. 1996;16:675–686. doi: 10.1016/s0896-6273(00)80086-0. [DOI] [PubMed] [Google Scholar]
- Rothstein JD, Patel S, Regan MR, Haenggeli C, Huang YH, Bergles DE, Jin L, Dykes HM, Vidensky S, Chung DS, Toan SV, Bruijn LI, Su ZZ, Gupta P, Fisher PB. Beta-lactam antibiotics offer neuroprotection by increasing glutamate transporter expression. Nature. 2005;433:73–77. doi: 10.1038/nature03180. [DOI] [PubMed] [Google Scholar]
- Schlag BD, Vondrasek JR, Munir M, Kalandadze A, Zelenaia OA, Rothstein JD, Robinson MB. Regulation of the glial Na+-dependent glutamate transporters by cyclic AMP analogs and neurons. Mol Pharmacol. 1998;53:355–369. doi: 10.1124/mol.53.3.355. [DOI] [PubMed] [Google Scholar]
- Schmitt A, Asan E, Puschel B, Jons T, Kugler P. Expression of the glutamate transporter GLT1 in neural cells of the rat central nervous system: non-radioactive in situ hybridization and comparative immunocytochemistry. Neuroscience. 1996;71:989–1004. doi: 10.1016/0306-4522(95)00477-7. [DOI] [PubMed] [Google Scholar]
- Schmitt A, Asan E, Puschel B, Kugler P. Cellular and regional distribution of the glutamate transporter GLAST in the CNS of rats: nonradioactive in situ hybridization and comparative immunocytochemistry. J Neurosci. 1997;17:1–10. doi: 10.1523/JNEUROSCI.17-01-00001.1997. [DOI] [PMC free article] [PubMed] [Google Scholar]
- Scott HL, Pow DV, Tannenberg AE, Dodd PR. Aberrant expression of the glutamate transporter excitatory amino acid transporter 1 (EAAT1) in Alzheimer's disease. J Neurosci. 2002;22(RC206):1–5. doi: 10.1523/JNEUROSCI.22-03-j0004.2002. [DOI] [PMC free article] [PubMed] [Google Scholar]
- Shibata T, Yamada K, Watanabe M, Ikenaka K, Wada K, Tanaka K, Inoue Y. Glutamate transporter GLAST is expressed in the radial glia-astrocyte lineage of developing mouse spinal cord. J Neurosci. 1997;17:9212–9219. doi: 10.1523/JNEUROSCI.17-23-09212.1997. [DOI] [PMC free article] [PubMed] [Google Scholar]
- Sohur US, Emsley JG, Mitchell BD, Macklis JD. Adult neurogenesis and cellular brain repair with neural progenitors, precursors and stem cells. Philos Trans R Soc Lond B Biol Sci. 2006;361:1477–1497. doi: 10.1098/rstb.2006.1887. [DOI] [PMC free article] [PubMed] [Google Scholar]
- Su ZZ, Leszczyniecka M, Kang DC, Sarkar D, Chao W, Volsky DJ. Insights into glutamate transport regulation in human astrocytes: cloning of the promoter for excitatory amino acid transporter 2 (EAAT2) Proc Natl Acad Sci USA. 2003;100:1955–1960. doi: 10.1073/pnas.0136555100. [DOI] [PMC free article] [PubMed] [Google Scholar]
- Su M, Hu H, Lee Y, d'Azzo A, Messing A, Brenner M. Expression specificity of GFAP transgenes. Neurochem Res. 2004;29:2075–2093. doi: 10.1007/s11064-004-6881-1. [DOI] [PubMed] [Google Scholar]
- Swanson RA, Liu J, Miller JW, Rothstein JD, Farrell K, Stein BA, Longuemare MC. Neuronal regulation of glutamate transporter subtype expression in astrocytes. J Neurosci. 1997;17:932–940. doi: 10.1523/JNEUROSCI.17-03-00932.1997. [DOI] [PMC free article] [PubMed] [Google Scholar]
- Takahashi R, Ito K, Fujiwara Y, Kodaira K, Kodaira K, Hirabayashi M, Ueda M. Generation of transgenic rats with YACs and BACs: preparation procedures and integrity of microinjected DNA. Exp Anim. 2000;49:229–233. doi: 10.1538/expanim.49.229. [DOI] [PubMed] [Google Scholar]
- Tanaka K, Watase K, Manabe T, Yamada K, Watanabe M, Takahashi K, Iwama H, Nishikawa T, Ichihara N, Kikuchi T, Okuyama S, Kawashima N, Hori S, Takimoto M, Wada K. Epilepsy and exacerbation of brain injury in mice lacking glutamate transporter GLT-1. Sciences. 1997;276:1699–1702. doi: 10.1126/science.276.5319.1699. [DOI] [PubMed] [Google Scholar]
- Watase K, Hashimoto K, Kano M, Yamada K, Watanabe M, Inoue Y, Okuyama S, Sakagawa T, Ogawa S, Kawashima N, Hori S, Takimoto M, Wada K, Tanaka K. Motor discoordination and increased susceptibility to cerebellar injury in GLAST mutant mice. Eur J Neurosci. 1998;10:976–988. doi: 10.1046/j.1460-9568.1998.00108.x. [DOI] [PubMed] [Google Scholar]
- Werner P, Pitt D, Raine CS. Multiple sclerosis: altered glutamate homeostasis in lesions correlates with oligodendrocyte and axonal damage. Ann Neurol. 2001;50:169–180. doi: 10.1002/ana.1077. [DOI] [PubMed] [Google Scholar]
- Yang XW, Model P, Heintz N. Homologous recombination based modification in Escherichia coli and germline transmission in transgenic mice of a bacterial artificial chromosome. Nat Biotechnol. 1997;15:859–865. doi: 10.1038/nbt0997-859. [DOI] [PubMed] [Google Scholar]
- Zimmerman L, Parr B, Lendahl U, Cunningham M, McKay R, Gavin B, Mann J, Vassileva G, McMahon A. Independent regulatory elements in the nestin gene direct transgene expression to neural stem cells or muscle precursors. Neuron. 1994;12:11–24. doi: 10.1016/0896-6273(94)90148-1. [DOI] [PubMed] [Google Scholar]
- Ziskin JL, Nishiyama A, Rubio M, Fukaya M, Bergles DE. Vesicular release of glutamate from unmyelinated axons in white matter. Nat Neurosci. 2007;10:321–330. doi: 10.1038/nn1854. [DOI] [PMC free article] [PubMed] [Google Scholar]