

Abstract
Activity-dependent elevation of calcium within presynaptic boutons regulates many aspects of synaptic transmission. Here, we examine presynaptic residual calcium (Cares) transients in individual presynaptic boutons of cerebellar granule cells at near-physiological temperatures using two-photon microscopy. Properties of Cares under conditions of zero-added buffer were determined by measuring Cares transients while loading boutons to a steady-state indicator concentration. These experiments revealed that, in the absence of exogenous calcium buffers, a single action potential evokes transients of Cares that vary widely in different boutons both in amplitude (400–900 nm) and time course (25–55 ms). Variation in calcium influx density, endogenous buffer capacity, and calcium extrusion density contribute to differences in Cares among boutons. Heterogeneity in Cares within different boutons suggests that plasticity can be regulated independently at different synapses arising from an individual granule cell. In a given bouton, Cares signals were highly reproducible from trial to trial and failures of calcium influx were not observed. We find that a factor contributing to this reliability is that an action potential opens a large number of calcium channels (20–125) in a bouton. Presynaptic calcium signals were also used to assess the ability of granule cell axons to convey somatically generated action potentials to distant synapses. In response to pairs of action potentials or trains, granule cell boutons showed a remarkable ability to respond reliably at frequencies up to 500 Hz. Thus, individual boutons appear specialized for reliable calcium signaling during bursts of high-frequency activation such as those that are observed in vivo.
Keywords: cerebellum, granule cell, parallel fiber, presynaptic calcium, calcium buffer, action potentials
Introduction
Calcium signals within presynaptic boutons trigger neurotransmitter release and regulate synaptic strength by controlling calcium-dependent short-term plasticity. In contrast to the high calcium levels near calcium channels that trigger fast neurotransmitter release (Augustine, 2001), a spatially uniform calcium signal of tens or hundreds of nanomolar persists for tens of milliseconds to seconds (Zucker and Regehr, 2002). This residual calcium (Cares) controls asynchronous neurotransmitter release, facilitation, recovery from depression, and posttetanic potentiation (Magleby, 1987; Zucker and Regehr, 2002). Thus, the regulation of Cares in presynaptic terminals has important implications for many forms of plasticity.
Most of what is known regarding presynaptic Cares is based on either large presynaptic structures with many release sites or populations of small terminals (Augustine et al., 1985; Regehr and Atluri, 1995; Helmchen et al., 1997; Pelkey et al., 2006). Within presynaptic boutons, most calcium is bound to calcium binding proteins and only a small fraction remains free. Provided calcium-binding proteins have rapid kinetics (Roberts, 1993; Nagerl et al., 2000; Muller et al., 2007), calcium equilibrates within milliseconds and the localized calcium signals near calcium-permeable channels dissipate rapidly after the channels close. As a result, Cares has been quantitatively described for small neuronal structures by a single compartment model that considers influx, calcium buffering, extrusion, and bouton geometry (Neher and Augustine, 1992; Tank et al., 1995; Helmchen and Tank, 2005).
Few studies have examined calcium dynamics in individual small presynaptic boutons (Koester and Sakmann, 2000; Koester and Johnston, 2005). As a result, many issues regarding Cares that have important implications for short-term synaptic plasticity are unresolved. Many issues regarding the extent of variability of Cares in an individual bouton and the heterogeneity of Cares in different boutons can be addressed by measuring Cares transients in single boutons (Koester and Sakmann, 2000). Recording and imaging single neurons also permits loading specified concentrations of fluorescent indicators to determine endogenous buffer capacity and the amplitude and time course of Cares unperturbed by exogenous buffers such as fluorescent calcium indicators (Tank et al., 1995; Helmchen et al., 1997; Koester and Sakmann, 2000; Maravall et al., 2000; Jackson and Redman, 2003). This approach also allows optical measurement of action potential propagation along axons during high-frequency stimulation (Cox et al., 2000; Koester and Sakmann, 2000).
Here, we address these issues using two-photon fluorescence microscopy to measure Cares in individual boutons of cerebellar granule cells. In different boutons, action potential-evoked calcium transients vary widely in amplitude and time course, which could lead to profound heterogeneity in calcium-dependent short-term plasticity. We find that variability in presynaptic calcium influx, buffering, and extrusion underlies the heterogeneity in Cares observed in different boutons. For a given bouton, however, the properties of Cares were consistent from trial to trial. Moreover, action potentials propagated reliably along granule cell axons and evoked presynaptic calcium transients even during high-frequency trains. Thus, individual granule cell axons and presynaptic boutons appear to be specialized for reliable calcium signaling even in response to bursts of high-frequency activation.
Materials and Methods
Electrophysiology.
Transverse slices (220–250 μm thick) were cut from the cerebellum of Sprague Dawley rats (postnatal days 15–18). Dissections were performed in an ice-cold sucrose solution containing the following (in mm): 75 NaCl, 26 NaHCO3, 75 sucrose, 25 glucose, 2.5 KCl, 1.25 NaH2PO4, 7 MgCl2, and 0.5 CaCl2. Slices were incubated for 30 min at 32°C in the sucrose-containing solution, and then transferred to saline solution containing the following (in mm): 125 NaCl, 26 NaCO3, 1.25 NaH2PO4, 2.5 KCl, 1 MgCl2, 2 CaCl2, 25 glucose, and after 30 min allowed to cool to room temperature. All solutions were bubbled with 95% O2/5% CO2.
Recordings from granule cells were made at 34 ± 1°C with an intracellular solution that consisted of the following (in mm): 114 KMeSO4, 10 HEPES, 4 MgATP, 0.4 NaGTP, and 14 Tris-phosphocreatine. The intracellular solution was supplemented with Alexa 594 (50–100 μm) for visualization and either fluo-5F (150–250 μm) or Oregon Green BAPTA-6F (500 μm) for measurement of intracellular calcium. Action potentials were evoked by current injection through the patch pipette (1 ms; 400–800 pA). To evoke multiple action potentials (see Figs. 7, 8), trains of 1 ms current injections were delivered. Electrode series resistance (5–8 MΩ) was compensated by balancing the bridge in the amplifier headstage.
Figure 7.
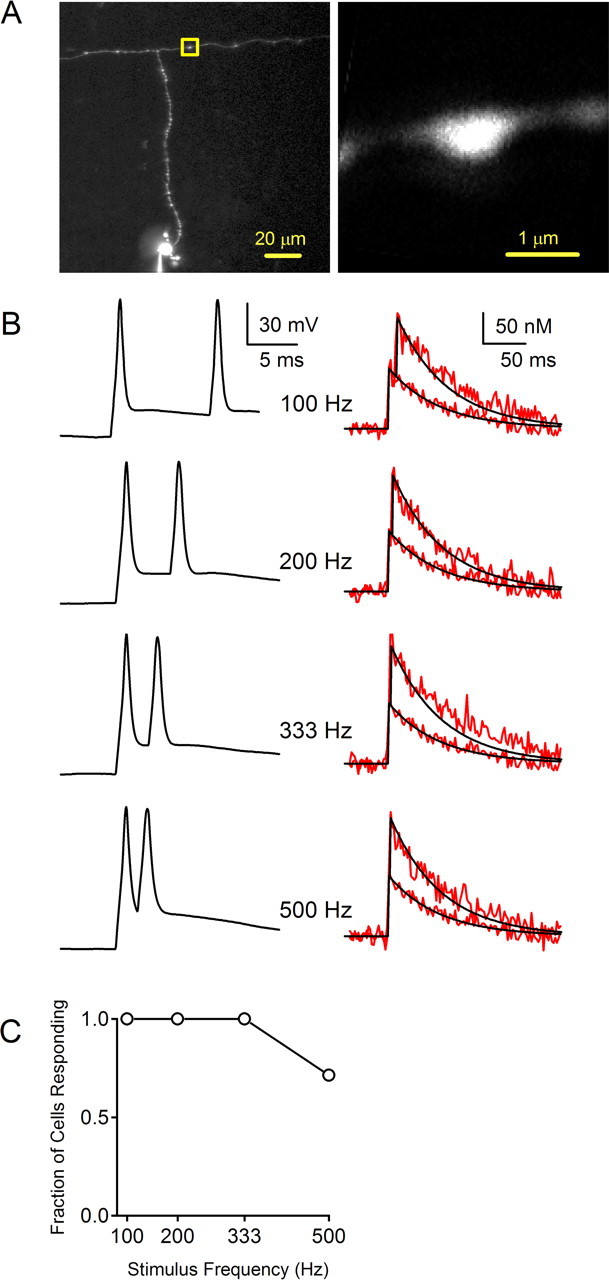
Action potential propagation in response to stimulus pairs. The ability of pairs of action potentials to invade presynaptic boutons was assessed by measuring calcium transients in a parallel fiber bouton. A, B, This is shown for a representative experiment in which calcium levels were measured in the bouton indicated by the yellow box. B, Pairs of action potentials were evoked at 100, 200, 333, and 500 Hz (left). Calcium transients evoked by one and two action potentials were measured at each frequency (right; red traces). The response to a single action potential was fit with a single exponential decay (black), and the trace was shifted and superimposed to indicate the predicted calcium transient from a pair of stimuli. C, Summary of the fraction of cells responding at the indicated frequencies (n = 7).
Figure 8.
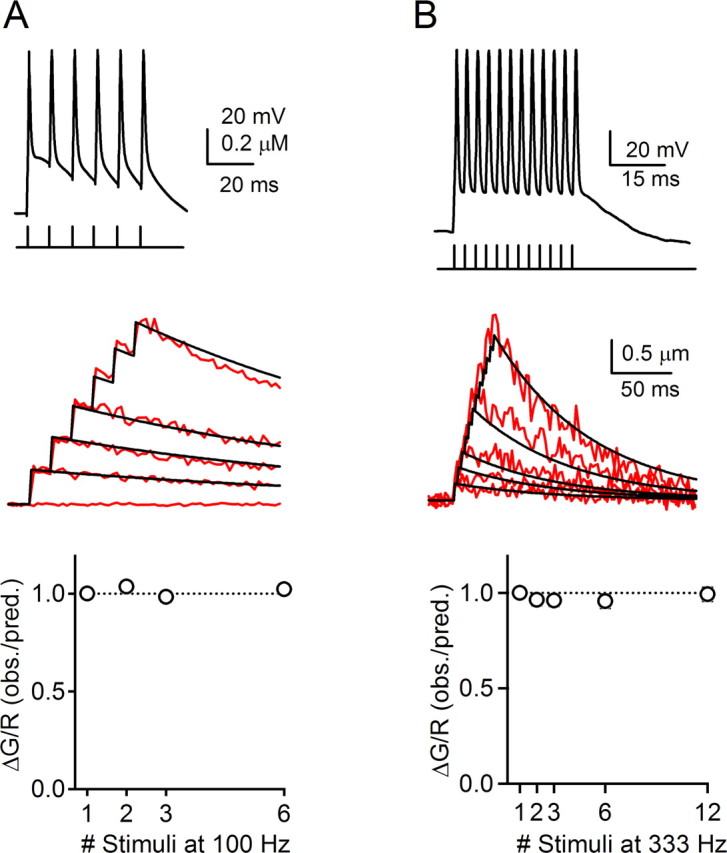
Action potential propagation in response to stimulus trains. Current injections in granule cell somata were used to evoke trains of action potentials at 100 Hz (A) and 333 Hz (B). For 100 Hz trains, n = 9 neurons (5 ascending and 5 parallel fiber boutons) and for 333 Hz trains, n = 10 neurons (8 ascending and 6 parallel fiber boutons). A, B, Top, Action potentials recorded in the soma of two representative granule cells. A, B, Middle, Red traces indicate calcium transients measured in response to 1, 2, 3, and 6 action potentials at 100 Hz (A) and 1, 2, 3, 6, and 12 action potentials at 333 Hz (B). The black traces indicate predicted calcium transients based on linear summation of a single exponential fit to the calcium transient in response to a single action potential. A, B, Bottom, Ratio of observed peak calcium levels to predicted calcium levels for trains of different lengths delivered at 100 Hz (A) and 333 Hz (B). In these experiments, ascending boutons were located 60–117 μm from the soma (mean ± SE, 94 ± 5 μm), and parallel fiber boutons were located 121–194 μm from the soma (mean ± SE, 155 ± 7 μm). obs., Observed; pred., predicted.
Two-photon imaging.
We used a custom two-photon laser-scanning microscope with a 60×, 1.1 numerical aperture (NA) objective (Olympus Optical, Tokyo, Japan) and a Ti:sapphire laser (Mira; Coherent, Santa Clara, CA). A single excitation wavelength of 810 nm was effective for simultaneous excitation of both green and red fluorophores (Bestvater et al., 2002; Yasuda et al., 2006). Fluorescence signals were collected in the epifluorescence and transfluorescence pathways (using a 1.4 NA oil immersion condenser). Green and red fluorescence were separated using a 565 nm dichroic and filtered using 495/60 and 607/45 bandpass filters, respectively (Chroma, Brattleboro, VT). Green and red fluorescence were collected using R9110 and H7422 photomultipliers (Hamamatsu, Hamamatsu City, Japan), respectively. Imaging and physiology were controlled with custom software written in MatLab (The MathWorks, Natick, MA), which was generously provided by Bernardo Sabatini (Harvard Medical School, Boston, MA). Line scans were performed at 500 Hz for 256–512 ms. Fluorescence signals were converted to calcium concentrations using values of Rmin and Rmax (Grynkiewicz et al., 1985). Rmin and Rmax refer to the minimum and maximum ratios, respectively, of the green fluorescence signal divided by the red fluorescence signal (G/R). These values were measured under conditions of zero calcium and saturating calcium, using intracellular solutions containing 0 mm Ca/3 mm EGTA and 3 mm Ca, respectively, as described previously (Brenowitz et al., 2006). Rmax for fluo-5F was also measured by delivering trains of action potentials (20–100 stimuli at 333 Hz) to saturate the indicator. Similar values of Rmax were obtained with both methods. The KD of fluo-5F and Oregon Green BAPTA-6F measured in the internal solution at 35°C using calibration solutions containing EGTA and varying amounts of CaCl2 (Tsien and Pozzan, 1989) were determined to be 585 nm and 3.0 μm, respectively. Images of granule cells with axons (see Figs. 1, 5, 7) consist of Kalman-filtered stacks of 25–80 images taken with 1 μm steps.
Figure 1.
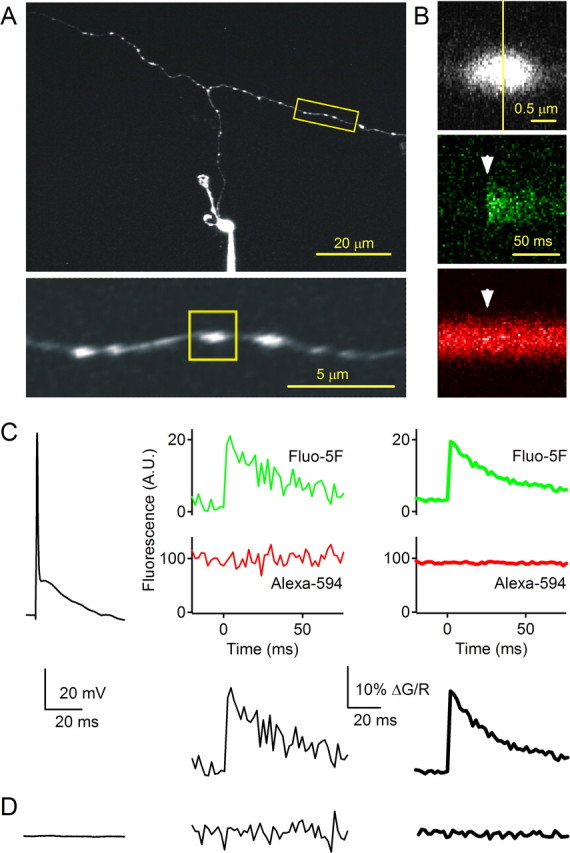
Measuring presynaptic calcium in single granule cell boutons. A, Top, Two-photon image of a granule cell loaded with a patch pipette with Alexa 594 (50 μm) and fluo-5F (100 μm). Bottom, Enlarged view of the parallel fiber from A with presynaptic boutons that appear as beadlike varicosities in granule cell axons. B, Top, Fluorescence measurements were made by performing a line scan across a bouton (vertical line). Green (middle) and red (bottom) fluorescence in response to an action potential evoked by current injection in the soma at the time indicated by the arrowhead. C, A representative experiment is shown in which action potentials were evoked by 1 ms somatic current injections. Top, The potential measured in the soma (left), the fluorescence signals in the green and red channels for a single trial (middle), and the average fluorescence signals for 56 trials (right) are shown. Bottom, The fluorescence ratio (expressed as ΔG/R) of a single trial (left) and of the average of 56 trials (right) is shown. D, The potential measured in the soma for a trial in which no current was injected (left), and the fluorescence ratio of a single trial (middle) and of the average of 19 trials (right) are shown.
Figure 5.
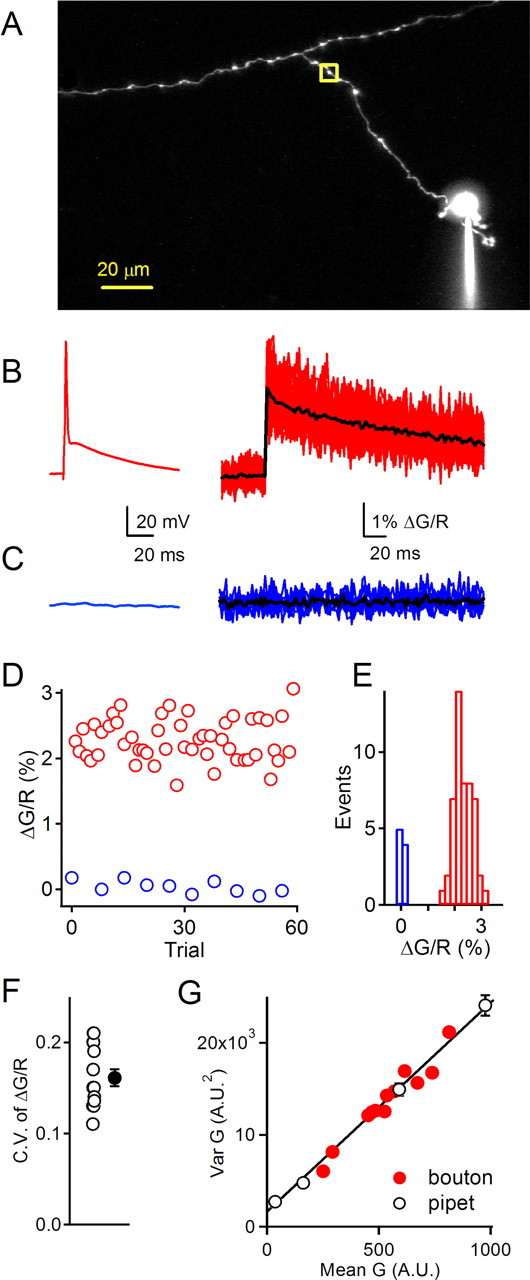
Reliability of calcium transients in single boutons. A, A representative experiment is shown in which whole-cell recordings were made from the soma of granule cells, action potentials were evoked, and the resulting calcium transients were measured in the indicated bouton. B, Action potentials (left) evoked fast presynaptic calcium transients (right). Fifty individual trials are shown in red, and the average is superimposed in black. C, Control trials in which no action potential was evoked (left) showed no calcium increase (right). Ten individual trials are shown in blue, and the average is shown in black. D, Peak fluorescence ratios for trials illustrated in B (red) and C (blue). E, Histogram of peak fluorescence ratios for single action potential trials (red) and no action potential trials (blue). F, The coefficient of variation of peak fluorescence changes from individual boutons (open symbols; n = 14) and their average (closed symbol). Error bar indicates SE. G, Variance analysis of fluorescence transients. Mean–variance relationship predicted from dark noise and shot noise alone was measured by imaging the pipette and varying the excitation intensity (black symbols). These points were fit with a line (solid line). Mean and variance of green fluorescence for the data in B were calculated over 20 ms segments of the 256 ms fluorescence transient (2 segments during the prestimulus baseline and 10 during the fluorescence decay). The slope of a linear fit to data from the pipette (slope, 23.7 ± 1.8) and the bouton (slope, 22.7 ± 0.5) were not statistically different.
Fluo-5F, Oregon Green BAPTA-6F, and Alexa 594 were from Invitrogen (Carlsbad, CA). All other chemicals were purchased from Sigma/RBI (St. Louis, MO).
Deconvolution.
The point spread function of the microscope was measured by exciting 0.22 μm fluorescent beads at 810 nm (see Fig. 3A). The line profile of the point spread function was well approximated by a Gaussian function with a SD of 0.37 μm (full width at half-maximum, 0.47 μm). This is close to the resolution limit predicted by the Rayleigh criterion [1.22 · λ/(2 · NA) = 0.45 μm].
Figure 3.
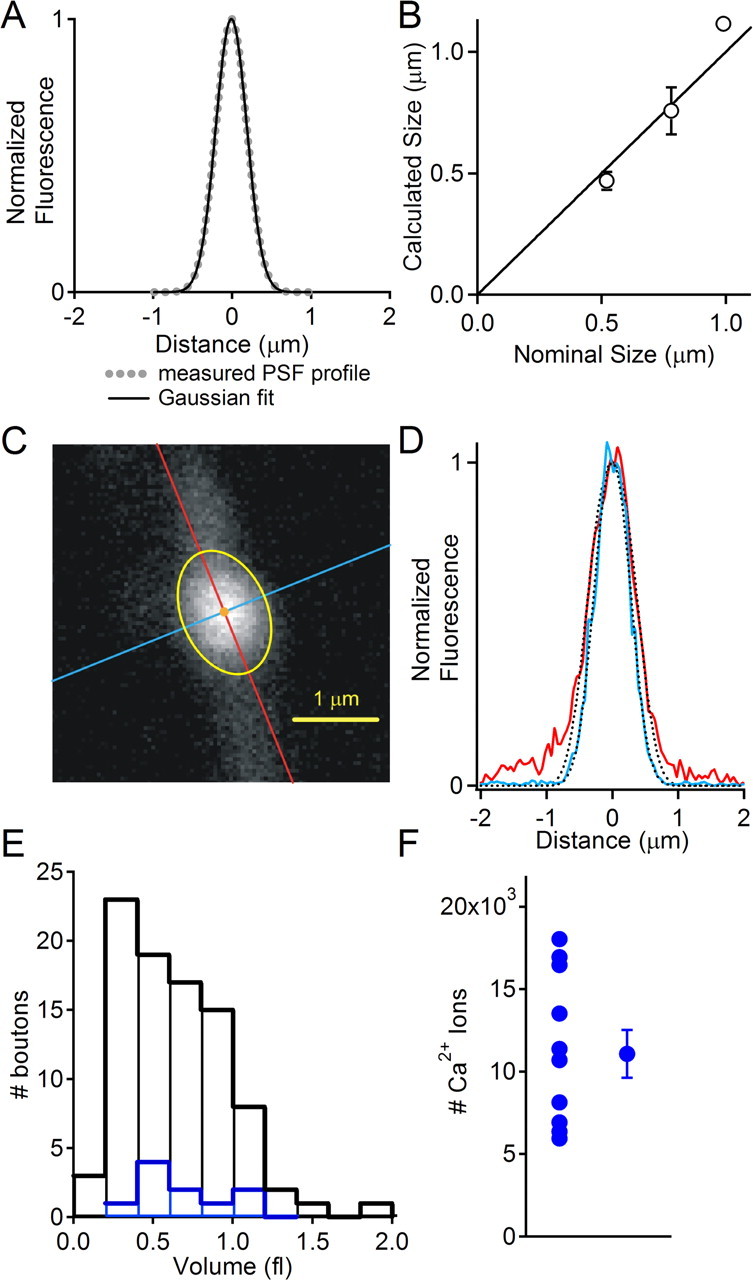
Measuring the volume of presynaptic boutons. A, Experimentally measured point spread function obtained from a fluorescent bead with diameter of 0.11 μm (dashed line). The Gaussian fit to this profile (solid line) has a half-width of 0.28 μm. B, Bead diameter (±SE) calculated as described in Materials and Methods as a function of the nominal bead diameter. A linear regression to these points constrained to pass through the origin has a slope of 1.04 ± 0.06. C, Image of a bouton illustrating the major and minor axes (red and blue lines, respectively) of the ellipsoid used for volume calculation. The ellipse obtained by deconvolution of the bouton image is shown in yellow. D, Line profiles of pixel values for the major (red) and minor (blue) axes. The dashed lines indicate the convolution of the point spread function with spheres of diameters of 1.63 and 1.03 μm. The deviation of the major axis profile from the Gaussian curve is attributable to the axon. E, Distribution of volumes for a group of 89 boutons (black) and for a sample of 11 boutons for which steady-state loading was performed as described in Figure 2 (blue). F, Total number of calcium ions entering the bouton in response to an action potential. Error bar indicates SE.
To determine bouton dimensions, we used a deconvolution method that assumed boutons could be well approximated by ellipsoids. An image of the bouton was fit with a two-dimensional Gaussian function to determine the center and orientation of the major and minor axes of the bouton. Line profiles of the fluorescence intensity of the bouton along these axes were then fit with an iterative procedure in which spheres of varying diameters were convolved with the experimentally measured point spread function. By minimizing the error between the line profiles of the bouton axes and the convolved sphere, the dimensions of the bouton axes could be determined. We verified the accuracy of this approach using fluorescent spheres of 0.52, 0.78, and 0.99 μm diameter (Bangs Laboratories, Fishers, IN) that have dimensions similar to granule cell boutons (see Fig. 3B).
Variance–mean analysis.
Optical noise analysis was performed using a method based on that of Sabatini and Svoboda (2000). First, we measured the mean and variance of fluorescence signals obtained with a sealed pipette filled with 150 μm fluo-5F. The intensity of the fluorescence signal was varied by changing the laser power. In the absence of any biological source of variability, fluctuations of the fluorescence signal from the pipette consist of dark noise from the detectors and photon shot noise. As expected, the variance–mean relationship of fluorescence signals measured from the pipette is linear, with a y-intercept that indicates the variance resulting from dark noise (see Fig. 5G, black symbols and line). Next, to determine the variance–mean relationship of bouton fluorescence, 50–100 action potential-evoked calcium transients were recorded and superimposed (see Fig. 5B, right) and the mean and variance of the fluo-5F fluorescence intensity were calculated at each time point during the trials. Variance and mean values were binned over 20 ms segments during trials of 256 ms (2 segments during the prestimulus baseline and 10 during the peak and decay of the transient). The data points were fit to a line and the ratio of the slope of this fit to the slope of a linear fit to the pipette measurements was determined (see Fig. 5G, red symbols).
Results
We measured Cares in individual presynaptic boutons of granule cell axons using two-photon microscopy. Whole-cell current-clamp recordings of granule cells in transverse cerebellar slices were obtained using a potassium-based intracellular solution that contained the red dye Alexa 594 (50 μm) for visualizing the granule cell axon and the green calcium indicator fluo-5F (150 μm; KD of 585 nm at 35°C) for measuring calcium transients. After loading the granule cell for 15–20 min, the ascending axon and parallel fiber were visible (Fig. 1A, top). At higher magnification (Fig. 1A, bottom), boutons were visible as bead-like swellings along the axon (Palay and Chan-Palay, 1974; Pichitpornchai et al., 1994). Line scans were performed across individual boutons (Fig. 1B, top) at 500 Hz and fluorescence signals from Alexa 594 and fluo-5F were simultaneously acquired. An action potential initiated in the soma (indicated by the arrowhead in Fig. 1B, middle and bottom) evoked a rapid increase in the green fluo-5F fluorescence (Fig. 1B, middle), whereas the red Alexa 594 fluorescence remained stable (Fig. 1B, bottom). Fluorescence changes were plotted as the change in the ratio of green to red fluorescence (ΔG/R). Depolarization of the soma triggered an action potential (Fig. 1C, left) that in turn evoked calcium transients (Fig. 1C, middle). Calcium transients were stable and could be imaged repeatedly for many trials and averaged (Fig. 1C, right). Trials in which no current was injected are shown for comparison (Fig. 1D). These experiments establish that we were able to reliably detect presynaptic fluorescence transients in single boutons in response to an action potential, and the signal-to-noise ratio of the fluorescence transients were sufficiently high to clearly distinguish action potential-evoked calcium transients from control trials in which no action potential was evoked.
Endogenous calcium buffers bind the majority of calcium ions entering a nerve terminal and control the amplitude and time course of Cares (Neher and Augustine, 1992; Tank et al., 1995; Helmchen and Tank, 2005). Fluorescent calcium indicators also contribute to the buffer capacity of the cell, which is defined as the ratio of the number of calcium ions bound to buffers to the number of ions that remain free (Neher and Augustine, 1992). The total buffer capacity of a cell (κT) is determined by the buffer capacity of the endogenous buffers (κ0) and the buffer capacity of the calcium indicator (κind), such that κT = κ0 + κind. By loading the granule cells with a known steady-state concentration of calcium indicator, it was possible to perturb calcium signaling in a manner that can be used to determine κ0 and the amplitude and time course of Cares under conditions of zero-added buffer (Neher and Augustine, 1992; Tank et al., 1995; Helmchen et al., 1997). For experiments in which buffer capacity was measured, granule cells were loaded with an intracellular solution containing 250 μm fluo-5F, which contributes an added buffer capacity (κind) of 427, and 100 μm Alexa 594. Experiments were restricted to ascending boutons within 100 μm of the cell body to enable steady-state loading in a reasonable time period. Loading of the bouton was monitored by measuring the intensity of red fluorescence, and the added buffer capacity was calculated as κind = [fluo-5F]/KD, where [fluo-5F] = R(t)/Rmax · [fluo-5F]pipette, and R(t) and Rmax refer to the Alexa 594 intensity at time t and at steady state, respectively (Fig. 2A). During loading, the calcium transient evoked by an action potential decreased in amplitude and decayed more slowly (Fig. 2A, bottom; B). A plot of the inverse of the calcium peak versus added buffer capacity has a linear relationship. By fitting the data points to a line (Fig. 2C), the peak inverse calcium transient in the absence of added buffer is indicated by the y-intercept. For the experiment illustrated in Figure 2, this fit yielded a value of Δ[Ca]0 = 610 nm, where Δ[Ca]0 refers to the amplitude of the calcium transient extrapolated to conditions of zero-added buffer. The x-intercept of the line indicates the endogenous buffer capacity of the terminal, which in this case was κ0 = 84. In 11 boutons, κ0 ranged from 34 to 86 (mean ± SE, 56 ± 12) (Fig. 2D, left) and peak Δ[Ca]0 ranged from 390 to 860 nm (520 ± 130 nm) (Fig. 2D, middle).
Figure 2.

Determination of endogenous buffer capacity. A, Added buffer capacity (top) and peak [Ca] in response to a single action potential in an ascending bouton during loading of the cell with Alexa 594 (50 μm) and fluo-5F (250 μm). B, Calcium transients (average of 5 traces) recorded at the times indicated (A, bottom). C, The relationship between Δ[Ca]−1 and added buffer capacity (κ) during loading of the cell. The horizontal arrowhead indicates the unperturbed inverse peak calcium increase that would be observed with zero-added buffer (Δ[Ca]0−1). The vertical arrowhead indicates endogenous buffer capacity of the bouton (κ0). D, Endogenous buffer capacity κ0 (left), unperturbed peak calcium Δ[Ca]0 (middle), and unperturbed decay time constant (τ0) of calcium transient (right) (n = 11 boutons from 11 cells). Error bars indicate SE.
As calcium indicator loads into the cell, the time constant of calcium decay gets progressively slower. This allows a plot of τ versus κT to be used for determining κ0 and τ0 (Helmchen et al., 1997; Sabatini et al., 2002). However, to avoid photodamage, we minimized exposure times and this prevented accurate measurements of τ during loading without extensive averaging (Fig. 2Bc). This approach allowed accurate measurement of peak calcium levels, which were used to determine κ0 (Fig. 2C). The time constant of calcium decay in the absence of added indicator was calculated as τ0 = τSS[κ0/(κ0 + κIND)]. Here, τSS refers to the steady-state decay time constant and ranged from 290 to 569 ms (395 ± 36 ms). The unperturbed decay time constant (τ0) was ∼10-fold faster and ranged from 24 to 54 ms (42 ± 3 ms) (Fig. 2D, right).
The average properties of Cares signaling determined from single boutons are consistent with estimates from previous studies in which calcium signals were monitored in large populations of granule cell boutons. In studies in which many fibers were loaded with a low concentration of a low-affinity calcium indicator, it was possible to measure average τ (25–52 ms) under conditions in which the effects of the indicator on Cares were minimal (Atluri and Regehr, 1996; Beierlein et al., 2004). Thus, there is good agreement between the properties of Cares signaling determined previously from population responses and averages of estimates of Cares in single presynaptic boutons described here.
To further quantify the calcium transients in single presynaptic boutons and investigate geometric factors that could regulate Cares, we estimated the volumes of granule cell boutons using a simplified deconvolution method (see Materials and Methods). We tested this approach by using the measured point spread function of the microscope (Fig. 3A) to deconvolve images of fluorescent beads of known diameters that ranged from 0.52 to 0.99 μm (Fig. 3B). This method provided accurate estimates of the sizes of fluorescent beads that have dimensions very similar to granule cell boutons. We approximated each bouton with an ellipsoid (see Materials and Methods), as shown for a representative bouton with the lines indicating the orientation of the major and minor axes of the bouton (Fig. 3C). We then used an iterative fitting procedure to determine the major and minor radii of the ellipsoid (Fig. 3D) (major axis, 1.63 μm; minor axis, 1.03 μm). This allowed us to estimate the volume of the bouton, which in this example was 0.91 fl. Volumes ranged from 0.1 to 1.9 fl (mean ± SE, 0.63 ± 0.04 fl; n = 89 boutons) (Fig. 3E, black). A similar volume distribution was observed for 11 boutons in which buffer capacity measurements were made (Fig. 3E, blue).
The ability to determine the volume of the boutons allowed us to quantify the calcium influx evoked by an action potential for the 11 boutons in which buffer capacity measurements were made (Fig. 2). The number of calcium ions (Nions) was calculated with Equation 1, where V is the volume, nA is Avogadro's number, Δ[Ca]SS is the steady-state calcium increase, and κT is the combined buffer capacity of the endogenous buffer and the added indicator.
The number of ions ranged from 6000 to 19,000 (Fig. 3F). We also calculated Nions as follows:
where Δ[Ca]0 is the calcium increase with no added indicator and κ0 is the buffer capacity of the endogenous buffer. On average, these two approaches gave similar estimates of the number of calcium ions entering a bouton [mean ± SE, 11,000 ± 1400 (Eq. 1) and 11,600 ± 2200 (Eq. 2)], although values differed slightly for individual boutons.
We estimated the number of calcium channels that opened (nch) in response to a single action potential using the following equation:
 |
where i is the current through a single calcium channel, t is the time the calcium channel is open, and e is charge of an electron. We calculated i using a driving force of 100 mV and a conductance of either 2.4 or 5.5 pS, which correspond to the range of single-channel conductances of calcium channels measured in physiological Ca2+ (Gollasch et al., 1992; Church and Stanley, 1996), as opposed to higher values of 15–20 pS measured in the presence of high concentrations of Ba2+ (Forti et al., 1994). The duration of channel opening was assumed to be 200 μs (Borst and Sakmann, 1996; Sabatini and Regehr, 1998; Geiger and Jonas, 2000; Sabatini and Svoboda, 2000). Using these parameters, the number of calcium channels opened by an action potential in a single bouton ranged from 42 to 125 (based on a single-channel conductance of 2.4 pS) or 18 to 55 channels (based on a conductance of 5.5 pS).
We also determined the extrusion rate (j) for each bouton using the following equation:
 |
where V is the volume of the presynaptic bouton, κT is the total buffer capacity, and τSS is the steady-state time constant of decay. The extrusion rate for ([Ca]i − [Ca]rest) = 100 nm ranged from 22 to 104 ions/ms (mean ± SE, 50 ± 7 ions/ms).
Factors influencing Cares within presynaptic boutons
The surface-to-volume ratio of the bouton can be an important factor in controlling calcium transients, with calcium transients tending to be larger and more rapid in small structures that have a larger surface-to-volume ratio. For a given density of calcium channels (nch/A), the total calcium influx varies as the surface area (A) and the change in calcium concentration varies as 1/V as follows:
 |
where k is a constant. Thus, if nch/A and κ0 were constant, the change in calcium as a function of bouton volume could be roughly approximated by the following:
where a is a constant. According to Equation 6, the observed range of bouton volumes should result in only small variations in Δ[Ca]0 (Fig. 4A, solid line). However, a comparison of the observed relationship between Δ[Ca]0 and bouton volume with the prediction of Equation 6 suggests that the surface-to-volume ratio is not the primary determinant of differences in Δ[Ca]0. Similarly, if the extrusion density and buffer capacity were constant, the decay of calcium should depend on the surface-to-volume ratio and hence the volume of the bouton according to the following:
where b is a constant, and it is predicted that the observed differences in V would result in differences in τ0 (Fig. 4B, solid line). However, the relationship between τ0 and V indicates that many of the observed differences in τ0 cannot be accounted for by differences in bouton volume (Fig. 4D).
Figure 4.
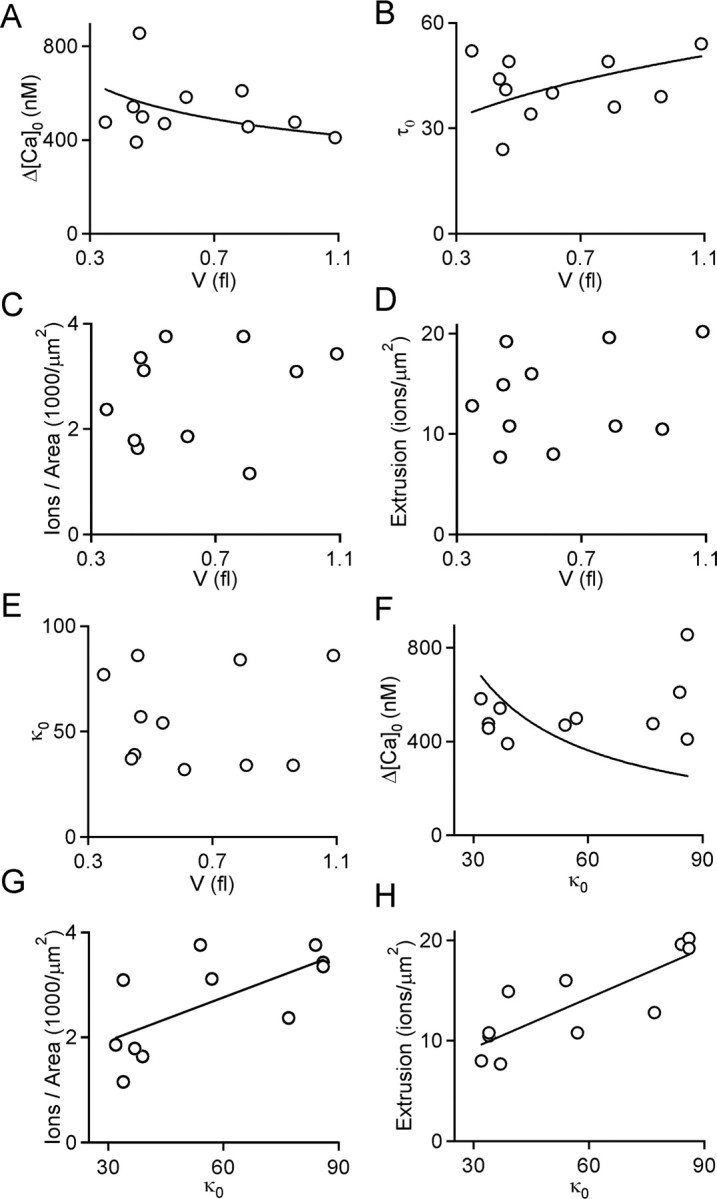
Properties of individual boutons. A–E, Parameters for calcium regulation in individual boutons are plotted as a function of bouton volume for the calcium increase (A) and the time constant of calcium decay produced by a single action potential in the absence of added buffer (B), the number of ions entering the bouton divided by the surface area of the bouton (in square micrometers) (C), the calcium extrusion per square micrometer · millisecond for Δ[Ca]i = 100 nm (D), and the buffer capacity of the endogenous buffer (E). The trace in A is a fit to Equation 6, where a = 435, and the trace in B is a fit to Equation 7, where b = 49. The calcium increase produced by a single action potential in the absence of added buffer (F), the number of ions entering the bouton per square micrometer (G), and the calcium extrusion per square micrometer · millisecond for Δ[Ca] = 100 nm (H) are plotted as a function of the buffer capacity. The trace in F is a fit to Δ[Ca]i = k(κ0)−1, where k = 22,000, and the traces in G and H are fits to the function j = mκ0 + b, where m = 0.027 and b = 1.116 (R2 = 0.67; p < 0.05) for G, and m = 0.165 and b = 4.36 (R2 = 0.82; p < 0.05) for H.
Differences in several properties of boutons other than volume contribute to differences in Δ[Ca]0 and τ0. There was considerable variability in the calcium influx/area (Fig. 4C), the calcium extrusion/area (Fig. 4D), and in the endogenous buffer capacity (Fig. 4E). In all cases, there was no dependence of the properties on the volume of the bouton. Although influx density, extrusion density, and buffer capacity affect Δ[Ca]0 and τ0 in predictable ways, there is no simple dependence on any of these properties. For example, it is predicted that, provided the density of calcium channels is uniform, Δ[Ca]0 varies inversely with buffer capacity as follows:
However, a plot of Δ[Ca]0 versus the buffer capacity is not well approximated by a fit to Equation 8 (Fig. 4F, line).
Departures from the predicted dependence of Δ[Ca]0 on the buffer capacity indicate that some factor must offset the effects of large endogenous buffer capacities. A plot of the density of calcium influx as a function of the endogenous buffer capacity suggests that boutons with a large buffer capacity also have a higher density of calcium channels (Fig. 4G). This tends to reduce the effects of an elevation in buffer capacity and accounts for the deviation from the predictions of Equation 8. Provided the density of calcium extrusion is constant, an increase in κ0 also affects the time constant of calcium decay as follows:
We found that boutons with a large buffer capacity also had an elevated extrusion density (Fig. 4H). This also tends to counteract the effects of a high endogenous buffer capacity. Our observation that both calcium channel density and extrusion capacity increase with κ0 suggests the possibility that mechanisms underlying calcium signaling in presynaptic boutons may be coordinately regulated.
Low variability of calcium transients in individual granule cell boutons
We determined the variability of calcium transients in granule cell boutons by measuring action potential-evoked calcium transients in individual boutons for 50–100 trials. A representative experiment is shown (Fig. 5) in which a granule cell was loaded for >20 min with a pipette solution containing 150 μm fluo-5F and 50 μm Alexa 594 (Fig. 5A). An action potential triggered in the soma (Fig. 5B, left) evoked a rapidly rising calcium transient in the bouton (Fig. 5B, right). When action potentials were evoked at 15 s intervals, the calcium transients were highly consistent, as illustrated by superimposing 50 consecutive traces (Fig. 5B, right), by a plot of the amplitude of evoked calcium transients in successive trials (Fig. 5D), and in histogram of response amplitudes (Fig. 5E). The coefficient of variation of the peak fluorescent change in response to an action potential was 0.14 for this experiment and was 0.16 ± 0.01 for similar experiments (n = 14). In no case was a failure of calcium influx observed, which is consistent with our finding that a large number of calcium channels open during an action potential.
Because the opening of presynaptic calcium channels is expected to be a binomial process, trial-to-trial variability of Cares varies inversely with the number of channels present in a bouton. We therefore performed variance–mean analysis on single bouton fluorescence transients (Sabatini and Svoboda, 2000) to investigate whether there was significant variability in the number of calcium channels that open during each action potential. We first determined the variance–mean relationship expected from the dark noise of the detectors and photon shot noise by imaging a pipette while varying the laser intensity (Fig. 5G, black symbols and line) (see Materials and Methods). Next, the variance–mean relationship was determined for fluorescence transients measured in a granule cell bouton (Fig. 5G, red symbols). Between 50 and 100 consecutive trials were used to calculate mean and variance. The variance–mean relationship of the bouton fluorescence transients was indistinguishable from that obtained from pipette measurements, indicating that trial-to-trial variability in the number of calcium channels opened by an action potential did not contribute a detectable amount of noise to fluorescence signals measured in the bouton. The ratio of the slope of the variance–mean relationship of the bouton to that of the pipette was 1.03 ± 0.03 (n = 4 boutons). These results further support our finding that a large number of calcium channels open during an action potential.
Heterogeneity of calcium transients in neighboring boutons
To determine the heterogeneity of calcium signaling in different presynaptic terminals formed by an individual granule cell, we compared Cares transients in neighboring boutons. Calcium transients were measured sequentially in adjacent boutons after >20 min of recording to minimize complications that could arise from differential loading of indicators. As shown in a representative experiment, calcium transients were measured in three adjacent boutons (Fig. 6A). Calcium transients measured in these three boutons exhibited large differences in their peak levels and decay time constants (Fig. 6A, left). There were more than twofold differences in the amplitudes (127–290 nm) and decay time constants (125–280 ms) of calcium transients measured in these boutons.
Figure 6.
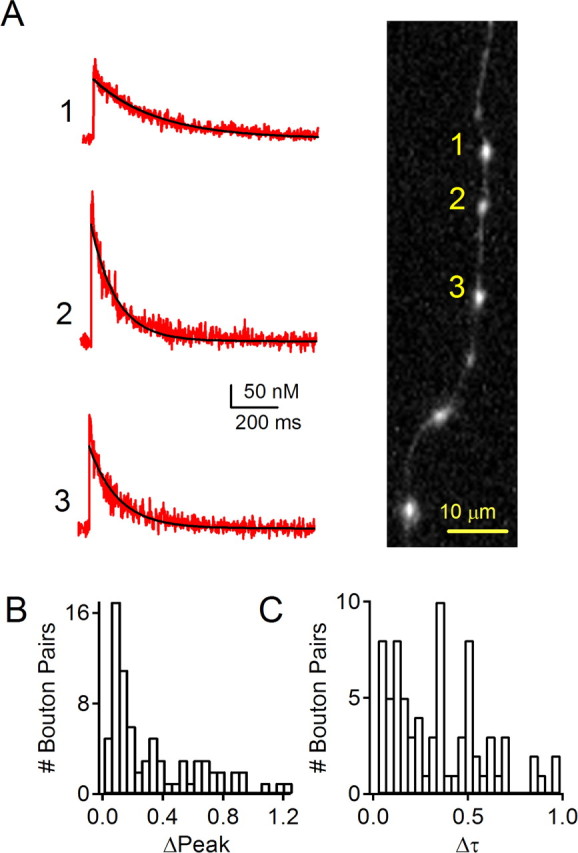
Variability in calcium signaling between neighboring boutons. The properties of calcium signals evoked by single action potentials were compared for neighboring boutons. Granule cells were loaded with 150 μm fluo-5F and 50 μm Alexa 594. This is shown for a representative experiment in which calcium was measured in three neighboring boutons located on the parallel fiber 109–124 μm from the soma. A, Recordings made in succession 40–50 min after breaking into the granule cell revealed differences in calcium signals in these boutons. The volume, time constant of calcium decay, and peak calcium increases [V (fl), τ (ms), Δ[Ca] (nm)] for these boutons were (0.97, 276, 127), (0.39, 109, 287), and (0.51, 125, 191), respectively. B, Histogram of the absolute value of the relative change in peak Δ[Ca] between adjacent boutons ([Ca]2 − [Ca]1)/[([Ca]2 + [Ca]2)/2]. C, Histogram of relative change in decay time constant between adjacent boutons, calculated as the absolute value of Δτ = (τ2 − τ1)/[(τ1 + τ2)/2].
The difference between calcium signaling in neighboring boutons was a consistent finding. This was apparent for 76 comparisons of 92 boutons (67 ascending and 25 parallel fiber boutons) from nine cells. Nearly all adjacent boutons were located <20 μm apart. Both the amplitudes and decay time constants of Cares showed considerable variability (Fig. 6B,C). Under our experimental conditions, it is likely that calcium buffering was dominated by the calcium indicator loaded from the patch pipette. Therefore, the differences observed in presynaptic calcium dynamics reflect heterogeneity in calcium influx and extrusion rates among neighboring boutons. This heterogeneity persists despite the observed correlation between κ0, influx density, and extrusion density, which tends to reduce differences in calcium signals among boutons (Fig. 4). These findings suggest that the properties of synapses made by granule cells are likely to exhibit heterogeneity in calcium-dependent short-term plasticity.
In these experiments, we could not identify the postsynaptic targets of individual boutons. However, it has been estimated that ∼94% of granule cell boutons contact Purkinje cells (Palkovits et al., 1971), with the remainder targeting stellate, basket, and Golgi neurons (Palay and Chan-Palay, 1974). Also, because the average properties of paired-pulse facilitation and delayed release at different postsynaptic targets of granule cells are similar (Atluri and Regehr, 1996; Xu-Friedman and Regehr, 2000), it is unlikely that the observed heterogeneity in Cares could be a consequence of boutons forming synapses with different types of postsynaptic cells.
Reliability of axonal action potential propagation with multiple stimuli
In vivo studies have shown that granule cells fire at high rates in response to sensory stimuli (Chadderton et al., 2004; Jorntell and Ekerot, 2006), but the capacity of granule cell axons to propagate action potentials at high frequency is not known. We therefore measured Cares to assess the ability of action potentials to propagate at high frequencies in granule cell axons. First, we examined responses to pairs of action potentials evoked at different intervals by injecting current in the soma with the patch pipette (Fig. 7). In the example shown, a parallel fiber bouton located 158 μm from the soma was selected for analysis (Fig. 7A). In alternating trials, action potentials were evoked singly and in pairs with intervals that ranged from 2 to 10 ms (Fig. 7B, left), and the fluorescence transient in the bouton was monitored. The averaged responses to one and two action potentials were compared (Fig. 7B, right, red traces). The decay of the calcium transient in response to a single action potential was fit with an exponential function and the predicted response to two action potentials was determined by the linear sum of two transients offset by the interval between successive stimuli (Fig. 7B, right, black traces). In this example the measured calcium transient in response to a pair of action potentials was closely matched by the predicted response for all frequencies examined. These experiments demonstrate that, for this representative granule cell, pairs of action potentials evoked at up to 500 Hz reliably propagate along the ascending branch of the axon into the parallel fiber. It was not possible to reliably evoke action potentials at frequencies >500 Hz using current injection in granule cell somata. Ascending branch boutons were located 56–129 μm from the soma (mean ± SE, 81 ± 16 μm) and parallel fiber boutons were located 122–158 μm from the soma (mean ± SE, 145 ± 11 μm). In all cells tested in this manner (four ascending and three parallel fiber boutons), pairs of action potentials propagated reliably at stimulus intervals of 100, 200, and 333 Hz ms. For 500 Hz stimulation, five of seven cells responded reliably, and for two boutons (one ascending and one parallel fiber bouton) the second somatic action potential failed to evoke an additional calcium response.
To further investigate the ability of granule cell axons to signal reliably at high frequency, we delivered stimulus trains of 1–6 action potentials at 100 Hz (Fig. 8A, top) and 1–12 action potentials at 333 Hz (Fig. 8B, top) and measured the resulting calcium transients in presynaptic boutons (Fig. 8A,B, middle, red traces). For 100 Hz stimulation, 250 μm fluo-5F was used because it gave good resolution of the calcium transients, whereas for 333 Hz stimulation the low-affinity indicator Oregon Green BAPTA-6F was used (500 μm; Kd = 3.0 μm) to more accurately report the high levels of calcium evoked by such high-frequency trains. The fluorescence transient in response to a single action potential was well described with a single exponential decay function. To predict the fluorescence change during a stimulus train based on the assumption that calcium influx for each action potential remains constant during a train, we calculated the linear sum of this function (Fig. 8A,B, middle, black traces). As seen in the data from a representative granule cell bouton, the observed fluorescence changes during 100 and 333 Hz trains closely matched the linear sum of the fluorescence transients in response to a single action potential. To combine data from many cells, it was not possible to directly average fluorescence transients because of differences in peak amplitudes and decay rates among boutons from different neurons. Therefore, we calculated the ratio of the observed peak of the calcium transient to the predicted peak for each train duration (Fig. 8A,B, bottom). The observed peak of the calcium transient was determined by fitting a single exponential function to the decay of the transient and the predicted value of the peak was based on summing the fit of the transient in response to a single action potential. In each case, the observed and predicted amplitudes closely match, indicating that, in all granule cells tested, action potentials reliably produced calcium transients in presynaptic boutons during trains of up to 12 stimuli at 333 Hz.
These experiments indicate that spikes initiated in granule cell somata generate action potentials that invade granule cell axons and reliably evoke action potentials at high frequencies. Furthermore, branch point failures were not observed at the junction between the ascending axon and parallel fiber axon. Our results demonstrate that action potentials evoked by high rates of firing in granule cells reliably transmit information to postsynaptic targets in the cerebellar cortex.
Discussion
Measurements of Cares transients in individual presynaptic boutons revealed heterogeneity in Cares signaling in different boutons, but remarkable trial-to-trial reproducibility for a given bouton. Moreover, even during high-frequency trains of up to 500 Hz, action potentials propagated reliably in granule cell axons and each action potential evoked the same increase in Cares. Thus, heterogeneity of Cares is likely to underlie heterogeneity in synaptic plasticity in different boutons, but individual boutons appear to be specialized for faithful and consistent signaling even at the high rates of granule cell activity observed in vivo.
Heterogeneity of Cares in presynaptic boutons
Anatomic studies using biocytin or Golgi staining combined with serial electron microscopic reconstruction have confirmed the correlation between granule cell axonal varicosities and presynaptic boutons (Palay and Chan-Palay, 1974; Pichitpornchai et al., 1994; Gundappa-Sulur et al., 1999; Xu-Friedman et al., 2001). By measuring Cares in single boutons, we observed a high degree of heterogeneity in presynaptic calcium dynamics of different granule cell boutons. Using the steady-state loading technique, we found that peak Δ[Ca]0 varied from ∼400 to 900 nm and decay rates ranged from 25 to 55 ms. This established that amplitude and decay time constant of Cares can vary by more than a factor of 2 for boutons from different granule cells. We examined the extent of variability of Cares in different boutons from the same neuron by comparing calcium transients in adjacent boutons. This approach minimized the effects of variable loading of calcium indicator in different boutons. These experiments revealed that the wide range of peak levels and decay rates of Cares observed in boutons from different neurons was also observed in boutons along the same axon.
Heterogeneity of presynaptic Cares has also been observed in other cells (Llano et al., 1997; Koester and Sakmann, 2000) and is likely to contribute to heterogeneity in properties of synaptic transmission. In some cases, the identity of the postsynaptic neuron may regulate properties of Cares and short-term plasticity (Rozov et al., 2001; Koester and Johnston, 2005; Watanabe et al., 2005). Heterogeneity in calcium signaling in boutons of cortical pyramidal cells could also be controlled in a target-dependent manner, because these cells synapses onto a variety of cell types (Koester and Sakmann, 2000). In the cerebellum, synapses formed by granule cells do not appear to be regulated in a target-dependent manner. However, synapses made by granule cells exhibit a wide range in the time course and amplitude of paired-pulse facilitation and extent of delayed release, which are controlled by Cares (Atluri and Regehr, 1996, 1998; Xu-Friedman and Regehr, 2000). For example, Cares and delayed release have a power law relationship with an exponential value of 2.5. Based on a 2- to 3-fold difference in Cares levels, the amount of delayed release will vary by 5- to 15-fold. Thus, bouton-specific regulation of Cares could provide a mechanism to allow synapse-specific control of calcium-dependent short-term plasticity at synapses made by granule cells.
Factors influencing Cares within presynaptic boutons
To investigate factors that may contribute to the observed properties of Cares, we examined the relationship between calcium influx, endogenous buffer capacity, extrusion, and bouton geometry. Variations in either the bouton volume or the surface-to-volume ratio of small boutons were not a strong determinant of the bouton-to-bouton variability in the amplitude and time course of Cares signaling. However, there were larger differences in the buffer capacity, the density of calcium influx, and the density of extrusion that contributed to differences in Cares signaling. The observed range in presynaptic endogenous buffer capacity of 30–90 could account for threefold differences in the peak and decay time constants of Cares. These values of κ0 indicate that an action potential elevates total calcium within a granule cell presynaptic terminal to 15–45 μm, of which 1–3% remains free and the remaining Ca2+ is bound to endogenous buffers. Prominent calcium binding proteins such as the kinetically slow parvalbumin (Lee et al., 2000) and calbindin are not expressed in granule cells (Bastianelli, 2003). It is likely that calretinin, a calcium binding protein with rapid kinetics (Schwaller et al., 1997) that is expressed in granule cells, makes a prominent contribution to the endogenous buffer capacity (Bastianelli, 2003; Gall et al., 2005).
Despite large differences in κ0 among boutons, peak Cares did not vary inversely with κ0 as predicted by Equation 8 (Fig. 4F). This is because boutons with higher buffer capacity had both a higher density of calcium channels and a greater capacity for extrusion (Fig. 4G,H). These factors partially compensate for the differences in endogenous buffer capacity among boutons and produce the net effect of reducing overall differences in peak calcium levels and decay rates that are predicted to occur in boutons with different buffer capacities. Our findings suggest that mechanisms regulating Cares dynamics in a bouton-specific manner can act to reduce but not eliminate this overall heterogeneity.
Low variability of Cares in response to an action potential
Despite the wide range of calcium transients observed in different boutons, the amplitude of calcium transients in a single granule cell bouton varied little from trial to trial. Failures of calcium influx were not observed in response to a single action potential. To examine possible contributions to the reliability of Cares in presynaptic boutons, we determined the number of calcium channels that open during an action potential based on peak Cares, endogenous buffer capacity, and bouton volume. We calculate that 20–125 calcium channels open in a single bouton during an action potential. Given this relatively large number of calcium channels, it is predicted that Cares will show little variability among trials. Similar conclusions have been reached in cortical pyramidal cells (Koester and Sakmann, 2000). As an additional approach to exploring trial-to-trial variability of Cares, we examined the relationship between the variance and mean of fluorescence transients in individual boutons. This approach has been applied to dendritic spines of hippocampal neurons to demonstrate that in some spines <10 calcium channels open in response to a backpropagating action potential, contributing to trial-to-trial fluctuations in the fluorescence transient resulting from variability in the number of channels that open during each trial (Sabatini and Svoboda, 2000). However, in granule cell boutons, no such variance was observed, which is consistent with a larger number of open channels during an action potential. The large numbers of calcium channels may therefore provide a reliable calcium signal to control short-term plasticity at individual synapses.
Reliability of axonal signaling at high frequency
In vivo recordings from cerebellar granule cells indicate that granule cells can fire very rapidly: bursts of three to five action potentials at ∼100 Hz in anesthetized rats in response to brief sensory stimulation (Chadderton et al., 2004), and >500 Hz in unanaesthetized decerebrate cats (Jorntell and Ekerot, 2006). The high activity rates of granule cells raises the question of how reliably action potentials can propagate at high frequency through the unmyelinated axons of granule cells, which we addressed by imaging calcium transients in presynaptic boutons. By comparing calcium transients in response to a single action potential and pairs of action potentials evoked at varying intervals, it was possible to clearly detect failures of calcium influx into granule cell boutons. All boutons tested responded to pairs of action potentials without failures at 333 Hz, and most cells responded at 500 Hz. At no frequency were mixtures of failures and successes observed. When trains were delivered at 100 Hz, it was possible to clearly resolve each increment in calcium during the train. These experiments indicated that calcium influx for each action potential remains uniform, suggesting that endogenous buffers in granule cell axons do not become saturated during trains, in contrast to previous findings in hippocampus (Jackson and Redman, 2003) and cortex (Blatow et al., 2003). When action potentials were delivered at 333 Hz, responses to individual stimuli could not be resolved but the observed transients closely matched the predicted response based on a linear summation of the calcium transient in response to a single action potential. These experiments demonstrated that granule cell axons respond reliably to repetitive stimulation at up to 500 Hz. In addition, calcium influx for each action potential during trains remains uniform under these stimulus conditions.
These findings indicate that granule cell axons exhibit remarkable specialization for reliable propagation of action potentials at high frequency. In the cortex, propagation of 8–10 action potentials at 50–100 Hz has been shown, but higher frequencies were not tested (Koester and Sakmann, 2000). In extracellular recordings of action potentials from axons of hippocampal CA3 pyramidal neurons, the maximum rate of reliable propagation of APs was ∼160 Hz (Raastad and Shepherd, 2003; Meeks et al., 2005). In Purkinje cell axons, simple spikes propagated with a high success rate at up to 200 Hz but became unreliable at 300 Hz (Khaliq and Raman, 2005; Monsivais et al., 2005). Thus, in comparison with other classes of neurons in which high-frequency action potential propagation has been examined, granule cells are remarkable in their ability to reliably signal at up to 500 Hz.
Footnotes
This work was supported by National Institutes of Health Grant 5R37NS032405. We thank members of the Regehr Laboratory for critical comments on this manuscript.
References
- Atluri PP, Regehr WG. Determinants of the time course of facilitation at the granule cell to Purkinje cell synapse. J Neurosci. 1996;16:5661–5671. doi: 10.1523/JNEUROSCI.16-18-05661.1996. [DOI] [PMC free article] [PubMed] [Google Scholar]
- Atluri PP, Regehr WG. Delayed release of neurotransmitter from cerebellar granule cells. J Neurosci. 1998;18:8214–8227. doi: 10.1523/JNEUROSCI.18-20-08214.1998. [DOI] [PMC free article] [PubMed] [Google Scholar]
- Augustine GJ. How does calcium trigger neurotransmitter release? Curr Opin Neurobiol. 2001;11:320–326. doi: 10.1016/s0959-4388(00)00214-2. [DOI] [PubMed] [Google Scholar]
- Augustine GJ, Charlton MP, Smith SJ. Calcium entry into voltage-clamped presynaptic terminals of squid. J Physiol (Lond) 1985;367:143–162. doi: 10.1113/jphysiol.1985.sp015818. [DOI] [PMC free article] [PubMed] [Google Scholar]
- Bastianelli E. Distribution of calcium-binding proteins in the cerebellum. Cerebellum. 2003;2:242–262. doi: 10.1080/14734220310022289. [DOI] [PubMed] [Google Scholar]
- Beierlein M, Gee KR, Martin VV, Regehr WG. Presynaptic calcium measurements at physiological temperatures using a new class of dextran-conjugated indicators. J Neurophysiol. 2004;92:591–599. doi: 10.1152/jn.00057.2004. [DOI] [PubMed] [Google Scholar]
- Bestvater F, Spiess E, Stobrawa G, Hacker M, Feurer T, Porwol T, Berchner-Pfannschmidt U, Wotzlaw C, Acker H. Two-photon fluorescence absorption and emission spectra of dyes relevant for cell imaging. J Microsc. 2002;208:108–115. doi: 10.1046/j.1365-2818.2002.01074.x. [DOI] [PubMed] [Google Scholar]
- Blatow M, Caputi A, Burnashev N, Monyer H, Rozov A. Ca2+ buffer saturation underlies paired pulse facilitation in calbindin-D28k-containing terminals. Neuron. 2003;38:79–88. doi: 10.1016/s0896-6273(03)00196-x. [DOI] [PubMed] [Google Scholar]
- Borst JG, Sakmann B. Calcium influx and transmitter release in a fast CNS synapse. Nature. 1996;383:431–434. doi: 10.1038/383431a0. [DOI] [PubMed] [Google Scholar]
- Brenowitz SD, Best AR, Regehr WG. Sustained elevation of dendritic calcium evokes widespread endocannabinoid release and suppression of synapses onto cerebellar Purkinje cells. J Neurosci. 2006;26:6841–6850. doi: 10.1523/JNEUROSCI.1280-06.2006. [DOI] [PMC free article] [PubMed] [Google Scholar]
- Chadderton P, Margrie TW, Hausser M. Integration of quanta in cerebellar granule cells during sensory processing. Nature. 2004;428:856–860. doi: 10.1038/nature02442. [DOI] [PubMed] [Google Scholar]
- Church PJ, Stanley EF. Single L-type calcium channel conductance with physiological levels of calcium in chick ciliary ganglion neurons. J Physiol (Lond) 1996;496:59–68. doi: 10.1113/jphysiol.1996.sp021665. [DOI] [PMC free article] [PubMed] [Google Scholar]
- Cox CL, Denk W, Tank DW, Svoboda K. Action potentials reliably invade axonal arbors of rat neocortical neurons. Proc Natl Acad Sci USA. 2000;97:9724–9728. doi: 10.1073/pnas.170278697. [DOI] [PMC free article] [PubMed] [Google Scholar]
- Forti L, Tottene A, Moretti A, Pietrobon D. Three novel types of voltage-dependent calcium channels in rat cerebellar neurons. J Neurosci. 1994;14:5243–5256. doi: 10.1523/JNEUROSCI.14-09-05243.1994. [DOI] [PMC free article] [PubMed] [Google Scholar]
- Gall D, Roussel C, Nieus T, Cheron G, Servais L, D'Angelo E, Schiffmann SN. Role of calcium binding proteins in the control of cerebellar granule cell neuronal excitability: experimental and modeling studies. Prog Brain Res. 2005;148:321–328. doi: 10.1016/S0079-6123(04)48025-X. [DOI] [PubMed] [Google Scholar]
- Geiger JR, Jonas P. Dynamic control of presynaptic Ca2+ inflow by fast-inactivating K+ channels in hippocampal mossy fiber boutons. Neuron. 2000;28:927–939. doi: 10.1016/s0896-6273(00)00164-1. [DOI] [PubMed] [Google Scholar]
- Gollasch M, Hescheler J, Quayle JM, Patlak JB, Nelson MT. Single calcium channel currents of arterial smooth muscle at physiological calcium concentrations. Am J Physiol. 1992;263:C948–C952. doi: 10.1152/ajpcell.1992.263.5.C948. [DOI] [PubMed] [Google Scholar]
- Grynkiewicz G, Poenie M, Tsien RY. A new generation of Ca2+ indicators with greatly improved fluorescence properties. J Biol Chem. 1985;260:3440–3450. [PubMed] [Google Scholar]
- Gundappa-Sulur G, De Schutter E, Bower JM. Ascending granule cell axon: an important component of cerebellar cortical circuitry. J Comp Neurol. 1999;408:580–596. doi: 10.1002/(sici)1096-9861(19990614)408:4<580::aid-cne11>3.0.co;2-o. [DOI] [PubMed] [Google Scholar]
- Helmchen F, Tank DW. Cold Spring Harbor, NY: Cold Spring Harbor Laboratory; 2005. A single-compartment model of calcium dynamics in nerve terminals and dendrites. [DOI] [PubMed] [Google Scholar]
- Helmchen F, Borst JG, Sakmann B. Calcium dynamics associated with a single action potential in a CNS presynaptic terminal. Biophys J. 1997;72:1458–1471. doi: 10.1016/S0006-3495(97)78792-7. [DOI] [PMC free article] [PubMed] [Google Scholar]
- Jackson MB, Redman SJ. Calcium dynamics, buffering, and buffer saturation in the boutons of dentate granule-cell axons in the hilus. J Neurosci. 2003;23:1612–1621. doi: 10.1523/JNEUROSCI.23-05-01612.2003. [DOI] [PMC free article] [PubMed] [Google Scholar]
- Jorntell H, Ekerot CF. Properties of somatosensory synaptic integration in cerebellar granule cells in vivo. J Neurosci. 2006;26:11786–11797. doi: 10.1523/JNEUROSCI.2939-06.2006. [DOI] [PMC free article] [PubMed] [Google Scholar]
- Khaliq ZM, Raman IM. Axonal propagation of simple and complex spikes in cerebellar Purkinje neurons. J Neurosci. 2005;25:454–463. doi: 10.1523/JNEUROSCI.3045-04.2005. [DOI] [PMC free article] [PubMed] [Google Scholar]
- Koester HJ, Johnston D. Target cell-dependent normalization of transmitter release at neocortical synapses. Science. 2005;308:863–866. doi: 10.1126/science.1100815. [DOI] [PubMed] [Google Scholar]
- Koester HJ, Sakmann B. Calcium dynamics associated with action potentials in single nerve terminals of pyramidal cells in layer 2/3 of the young rat neocortex. J Physiol (Lond) 2000;529:625–646. doi: 10.1111/j.1469-7793.2000.00625.x. [DOI] [PMC free article] [PubMed] [Google Scholar]
- Lee SH, Schwaller B, Neher E. Kinetics of Ca2+ binding to parvalbumin in bovine chromaffin cells: implications for [Ca2+] transients of neuronal dendrites. J Physiol (Lond) 2000;525:419–432. doi: 10.1111/j.1469-7793.2000.t01-2-00419.x. [DOI] [PMC free article] [PubMed] [Google Scholar]
- Llano I, Tan YP, Caputo C. Spatial heterogeneity of intracellular Ca2+ signals in axons of basket cells from rat cerebellar slices. J Physiol (Lond) 1997;502:509–519. doi: 10.1111/j.1469-7793.1997.509bj.x. [DOI] [PMC free article] [PubMed] [Google Scholar]
- Magleby KL. Synaptic function. New York: Wiley; 1987. Short-term changes in synaptic efficacy; pp. 21–56. [Google Scholar]
- Maravall M, Mainen ZF, Sabatini BL, Svoboda K. Estimating intracellular calcium concentrations and buffering without wavelength ratioing. Biophys J. 2000;78:2655–2667. doi: 10.1016/S0006-3495(00)76809-3. [DOI] [PMC free article] [PubMed] [Google Scholar]
- Meeks JP, Jiang X, Mennerick S. Action potential fidelity during normal and epileptiform activity in paired soma-axon recordings from rat hippocampus. J Physiol (Lond) 2005;566:425–441. doi: 10.1113/jphysiol.2005.089086. [DOI] [PMC free article] [PubMed] [Google Scholar]
- Monsivais P, Clark BA, Roth A, Hausser M. Determinants of action potential propagation in cerebellar Purkinje cell axons. J Neurosci. 2005;25:464–472. doi: 10.1523/JNEUROSCI.3871-04.2005. [DOI] [PMC free article] [PubMed] [Google Scholar]
- Muller M, Felmy F, Schwaller B, Schneggenburger R. Parvalbumin is a mobile presynaptic Ca2+ buffer in the calyx of held that accelerates the decay of Ca2+ and short-term facilitation. J Neurosci. 2007;27:2261–2271. doi: 10.1523/JNEUROSCI.5582-06.2007. [DOI] [PMC free article] [PubMed] [Google Scholar]
- Nagerl UV, Novo D, Mody I, Vergara JL. Binding kinetics of calbindin-D(28k) determined by flash photolysis of caged Ca2+ Biophys J. 2000;79:3009–3018. doi: 10.1016/S0006-3495(00)76537-4. [DOI] [PMC free article] [PubMed] [Google Scholar]
- Neher E, Augustine GJ. Calcium gradients and buffers in bovine chromaffin cells. J Physiol (Lond) 1992;450:273–301. doi: 10.1113/jphysiol.1992.sp019127. [DOI] [PMC free article] [PubMed] [Google Scholar]
- Palay S, Chan-Palay V. New York: Springer; 1974. Cerebellar cortex. [Google Scholar]
- Palkovits M, Magyar P, Szentagothai J. Quantitative histological analysis of the cerebellar cortex in the cat. 3. Structural organization of the molecular layer. Brain Res. 1971;34:1–18. doi: 10.1016/0006-8993(71)90347-7. [DOI] [PubMed] [Google Scholar]
- Pelkey KA, Topolnik L, Lacaille JC, McBain CJ. Compartmentalized Ca2+ channel regulation at divergent mossy-fiber release sites underlies target cell-dependent plasticity. Neuron. 2006;52:497–510. doi: 10.1016/j.neuron.2006.08.032. [DOI] [PubMed] [Google Scholar]
- Pichitpornchai C, Rawson JA, Rees S. Morphology of parallel fibres in the cerebellar cortex of the rat: an experimental light and electron microscopic study with biocytin. J Comp Neurol. 1994;342:206–220. doi: 10.1002/cne.903420205. [DOI] [PubMed] [Google Scholar]
- Raastad M, Shepherd GM. Single-axon action potentials in the rat hippocampal cortex. J Physiol (Lond) 2003;548:745–752. doi: 10.1113/jphysiol.2002.032706. [DOI] [PMC free article] [PubMed] [Google Scholar]
- Regehr WG, Atluri PP. Calcium transients in cerebellar granule cell presynaptic terminals. Biophys J. 1995;68:2156–2170. doi: 10.1016/S0006-3495(95)80398-X. [DOI] [PMC free article] [PubMed] [Google Scholar]
- Roberts WM. Spatial calcium buffering in saccular hair cells. Nature. 1993;363:74–76. doi: 10.1038/363074a0. [DOI] [PubMed] [Google Scholar]
- Rozov A, Burnashev N, Sakmann B, Neher E. Transmitter release modulation by intracellular Ca2+ buffers in facilitating and depressing nerve terminals of pyramidal cells in layer 2/3 of the rat neocortex indicates a target cell-specific difference in presynaptic calcium dynamics. J Physiol (Lond) 2001;531:807–826. doi: 10.1111/j.1469-7793.2001.0807h.x. [DOI] [PMC free article] [PubMed] [Google Scholar]
- Sabatini BL, Regehr WG. Optical measurement of presynaptic calcium currents. Biophys J. 1998;74:1549–1563. doi: 10.1016/S0006-3495(98)77867-1. [DOI] [PMC free article] [PubMed] [Google Scholar]
- Sabatini BL, Svoboda K. Analysis of calcium channels in single spines using optical fluctuation analysis. Nature. 2000;408:589–593. doi: 10.1038/35046076. [DOI] [PubMed] [Google Scholar]
- Sabatini BL, Oertner TG, Svoboda K. The life cycle of Ca2+ ions in dendritic spines. Neuron. 2002;33:439–452. doi: 10.1016/s0896-6273(02)00573-1. [DOI] [PubMed] [Google Scholar]
- Schwaller B, Durussel I, Jermann D, Herrmann B, Cox JA. Comparison of the Ca2+-binding properties of human recombinant calretinin-22k and calretinin. J Biol Chem. 1997;272:29663–29671. doi: 10.1074/jbc.272.47.29663. [DOI] [PubMed] [Google Scholar]
- Tank DW, Regehr WG, Delaney KR. A quantitative analysis of presynaptic calcium dynamics that contribute to short-term enhancement. J Neurosci. 1995;15:7940–7952. doi: 10.1523/JNEUROSCI.15-12-07940.1995. [DOI] [PMC free article] [PubMed] [Google Scholar]
- Tsien R, Pozzan T. Measurement of cytosolic free Ca2+ with quin2. Methods Enzymol. 1989;172:230–262. doi: 10.1016/s0076-6879(89)72017-6. [DOI] [PubMed] [Google Scholar]
- Watanabe J, Rozov A, Wollmuth LP. Target-specific regulation of synaptic amplitudes in the neocortex. J Neurosci. 2005;25:1024–1033. doi: 10.1523/JNEUROSCI.3951-04.2005. [DOI] [PMC free article] [PubMed] [Google Scholar]
- Xu-Friedman MA, Regehr WG. Probing fundamental aspects of synaptic transmission with strontium. J Neurosci. 2000;20:4414–4422. doi: 10.1523/JNEUROSCI.20-12-04414.2000. [DOI] [PMC free article] [PubMed] [Google Scholar]
- Xu-Friedman MA, Harris KM, Regehr WG. Three-dimensional comparison of ultrastructural characteristics at depressing and facilitating synapses onto cerebellar Purkinje cells. J Neurosci. 2001;21:6666–6672. doi: 10.1523/JNEUROSCI.21-17-06666.2001. [DOI] [PMC free article] [PubMed] [Google Scholar]
- Yasuda R, Harvey CD, Zhong H, Sobczyk A, van Aelst L, Svoboda K. Supersensitive Ras activation in dendrites and spines revealed by two-photon fluorescence lifetime imaging. Nat Neurosci. 2006;9:283–291. doi: 10.1038/nn1635. [DOI] [PubMed] [Google Scholar]
- Zucker RS, Regehr WG. Short-term synaptic plasticity. Annu Rev Physiol. 2002;64:355–405. doi: 10.1146/annurev.physiol.64.092501.114547. [DOI] [PubMed] [Google Scholar]