

Abstract
Recent progress in the molecular biology of taste reception has revealed that in mammals, the heteromeric receptors T1R1/3 and T1R2/3 respond to amino acids and sweeteners, respectively, whereas T2Rs are receptors for bitter tastants. Similar taste receptors have also been characterized in fish, but their ligands have not been identified yet. In the present study, we conducted a series of experiments to identify the fish taste receptor ligands. Facial nerve recordings in zebrafish (Danio rerio) demonstrated that the fish perceived amino acids and even denatonium, which is a representative of aversive bitter compounds for mammals and Drosophila. Calcium imaging analysis of T1Rs in zebrafish and medaka fish (Oryzias latipes) using an HEK293T heterologous expression system revealed that both T1R1/3 and a series of T1R2/3 responded to amino acids but not to sugars. A triple-labeling, in situ hybridization analysis demonstrated that cells expressing T1R1/3 and T1R2/3s exist in PLCβ2-expressing taste bud cells of medaka fish. Functional analysis using T2Rs showed that zfT2R5 and mfT2R1 responded to denatonium. Behavior observations confirmed that zebrafish prefer amino acids and avoid denatonium. These results suggest that, although there may be some fish-specific way of discriminating ligands, vertebrates could have a conserved gustatory mechanism by which T1Rs and T2Rs respond to attractive and aversive tastants, respectively.
Keywords: taste, receptor, T1R, T2R, amino acid, fish
Introduction
Vertebrates perceive a variety of exotic substances using the two chemosensory systems, taste and olfaction. For taste reception, vertebrates express the two families of G-protein-coupled receptors (GPCRs), T1Rs and T2Rs, in their taste buds (Hoon et al., 1999; Adler et al., 2000; Zhao et al., 2003; Ishimaru et al., 2005). In mammals, the heteromeric T1R1/3 receptor responds to umami tastants such as amino and nucleic acids, whereas T1R2/3 responds to sweet tastants such as sugars, artificial sweeteners, and sweet proteins (Nelson et al., 2001, 2002; Li et al., 2002; Zhao et al., 2003; Jiang et al., 2004; Nakajima et al., 2006). In contrast, T2Rs respond to bitter tastants, including poisonous chemicals (Chandrashekar et al., 2000; Mueller et al., 2005). Sweet, umami, and bitter tastants are discriminated at the peripheral taste cell level because receptors for different taste modalities are expressed in different subsets of taste bud cells (Hoon et al., 1999; Adler et al., 2000; Mueller et al., 2005). However, intracellular signals occurring downstream of taste receptors are mediated by common molecules such as PLCβ2 and TRPM5 (Zhang et al., 2003; Damak et al., 2006). Recently, it was also reported that the cells receiving sour taste exist in segregation from those receiving other taste modalities (Huang et al., 2006; Ishimaru et al., 2006).
Small fish such as zebrafish (Danio rerio) and medaka fish (Oryzias latipes) are useful model vertebrates because of their short generation span, ease of transgenic manipulation, small genome sizes, and plenty of accumulated sequence data. Bioinformatics of animal genomes has revealed a number of homologous T1R, T2R, and PLCβ2 genes (Yasuoka et al., 2004; Ishimaru et al., 2005; Go, 2006; Shi and Zhang, 2006). We reported previously that parts of taste bud cells in mammals and fish express T1Rs or T2Rs together with PLCβ2 (Asano-Miyoshi et al., 2001; Ishimaru et al., 2005), strongly suggesting that, among vertebrates, there are common mechanisms of taste reception and transduction, although both the ligands for taste receptors in fish and signal transduction pathways in association with receptor–ligand interactions remain to be elucidated.
Fish ingest and metabolize amino acids, lipids, and organic acids as nutrients. Many fish do not prefer sugars, although they hesitate to avoid them positively (Kasumyan and Doving, 2003). Recordings from fish facial nerves innervating the taste cells of the maxillary and nasal barbels, flank, rostral palate, and lips have revealed that the facial taste system is highly responsive to amino, nucleic, and organic acids (Caprio, 1975; Funakoshi et al., 1981; Caprio et al., 1993). Goldfish (Carassius auratus), although biting diets containing quinine alone, reject them at last, but the fish do not avert a quinine-containing diet if this contains l-Ala together (Lamb and Finger, 1995). Thus, there is a taste-dependent system for diet selection.
Here, we report on ligands characteristic to fish T1R and T2R taste receptors. We also provide evidence for the different taste reception rule in fish, not found in mammals, that T1R2/3s respond exclusively to amino acids.
Materials and Methods
Animals.
Zebrafish (D. rerio), ∼3.0 cm in body length, were obtained from a local commercial source. The fish were held in a glass aquarium, fed commercial fish diet, and kept in continuously filtrated and aerated water (26 ± 1°C) for several days before use. Medaka fish (O. latipes; Cab strain) were a kind gift from Dr. Makoto Furutani-Seiki (ERATO, Kondoh Differentiation Signaling Project, Kyoto, Japan). The fish were maintained in a 14/10 h day/night cycle in a closed circulating system at 25°C (AQUA, Tokyo, Japan).
Taste nerve recordings with electrophysiological techniques.
Zebrafish were anesthetized with MS-222 (ethyl 3-amino benzoate methanesulfonic acid) and immobilized with Flaxidil (gallamine triethiodide, 0.3 mg/kg body weight). The fish were then wrapped in tissue paper and positioned on a silicone plate in a Plexiglas container for the electrophysiological experiments. Artificial pond water (APW) (in mm: 0.3 NaCl, 0.02 KCl, and 0.2 CaCl2, pH ∼5.7) was perfused through the mouth and over the gills throughout the experiments (Yoshii et al., 1979). Supplemental Flaxidil was administrated as required. By removing an eyeball, a branch of trigemino-facial complex nerves running through the eye socket was exposed and then severed centrally. The extracellular recordings of electrical activities of nerve twigs were made on the cut end of the ramus mandibularis of the facial nerve, innervating a lower lip, barbels, and the anterior portion of the oral floor, with a glass suction electrode filled with fish Ringer's solution (in mm: 140 NaCl, 10 KCl, 1.8 CaCl2, 2 MgCl2, and 5 HEPES, adjusted to pH 7.2 with NaOH) (Michel et al., 1999). Neural activities were amplified with an AVB-11A AC amplifier (Nihon Kohden, Tokyo, Japan), digitized, and stored on a computer through a Power-Lab/8s (AD Instruments Pty, Castle Hill, Australia). The activities were filtered and integrated (time constant, 0.5 s) with Chart 5 computer software (AD Instruments Pty).
Stimulus solutions (1 ml in 1 mm) were introduced into the constant flow (∼1.5 ml/min flow rate) line of APW bathing the lower lip and barbels by injection through a stimulus injection port, using a disposable syringe. Interstimulus intervals were at least 3 min for lower concentrations of stimulants and were prolonged for up to 7 min for the higher concentrations. Stock solutions of stimulus compounds were made with distilled water at 10 or 100 mm (sucrose and glucose at 300 mm in APW), and all subsequent dilutions were made daily with APW. The pH of all stimulus solutions was adjusted to 6 with NaOH or HCl. The reproducibility of gustatory responsiveness was frequently checked by an application of the standard, 1 mm l-Ala. The magnitudes of taste responses were measured as the peak heights (in millimeters) of the integrated responses.
Ca2+ imaging analysis.
Human embryonic kidney 293T (HEK293T) cells were cultured at 37°C in DMEM (Sigma-Aldrich Japan, Tokyo, Japan) supplemented with 10% fetal bovine serum [JRH Biosciences (Lenexa, KS) or Invitrogen (San Diego, CA)]. For transfection, cells were seeded onto dishes (35 mm in diameter) and transiently transfected with T1Rs or T2Rs, and a G-protein and DsRed2 (pDsRed2-N1; Takara Bio, Shiga, Japan) using Lipofectamine 2000 reagent (Invitrogen). For the T1Rs assay, zebrafish or medaka fish T1Rs (zfT1R1, GenBank accession number AB200899 or AB289804; zfT1R2a, AB200900; zfT1R2b, AB289806; zfT1R3, AB200902; mfT1R1, AB200905; mfT1R2a, AB200906; mfT1R2b, AB200907; mfT1R2c, AB200908; and mfT1R3, AB200909), and G16/gust44 (Ueda et al., 2003) were subcloned into the pEAK10 expression vector (Edge Biosystems, Gaithersburg, MD). For the T2Rs assay, T2Rs (zfT2R1a, AB200903; zfT2R1b, AB200904; zfT2R2a, AB290684; zfT2R2b, AB290685; zfT2R4, AB290687; zfT2R5, AB290688; and mfT2R1, AB290689) tagged at the N terminus with bovine Rhodopsin amino acids 1–39 were subcloned into the pME18SFL3 expression vector (Ueda et al., 2003), and G16/gust44 was subcloned into the pcDNA3.1(+) expression vector (Invitrogen).
Cells were transferred into a glass-based 96-well plate (Iwaki Glass, Chiba, Japan) or a 96 CytoWell plate (Nalge Nunc International, Rochester, NY) ∼6 or 24 h after transfection for T2R or T1R assays, respectively. After an additional 16–30 h, cells were loaded with 5 μm of the calcium indicator dye fura-2 AM (Invitrogen) diluted in assay buffer (in mm: 130 NaCl, 10 glucose, 5 KCl, 2 CaCl2, and 1.2 MgCl2 in 10 HEPES, pH 7.4) for 30–40 min at room temperature. Cells were rinsed and incubated in 100 μl of assay buffer for >10 min and then the stimulation was performed by the addition of 100 μl of 2× concentrated tastants solution by pipette. For the perfused assay of T2Rs, cells were transferred onto glass coverslips ∼6 h after transfection. After 16–30 h, cells were loaded with 10 μm fura-2 AM for 30 min at room temperature. The cells were washed with assay buffer perfusing under gravity at a flow rate of 10 ml/min. Each tastant was applied to the cells for a period of 12 s. The fura-2 fluorescence intensities resulting from excitation at 340 and 380 nm were measured at 510 nm using a computer-controlled filter changer (Lambda 10–2; Sutter Instrument, San Rafael, CA), a MicroMax cooled charge-coupled device camera (Princeton Instruments, Trenton, NJ), and an inverted fluorescence microscope (IX-70; Olympus, Tokyo, Japan). Images were recorded at 4 s intervals up to 30 s after the addition and analyzed using MetaFluor software (Molecular Devices, Sunnyvale, CA). Changes in intracellular calcium ion concentration ([Ca2+]i) were measured for the computationally selected 100 of DsRed2-positive cells using changes in the ratio of fluorescence emitted at the two excitation wavelengths (F340/F380). Cells were defined as responding when the increase in the F340/F380 ratio was >0.2. We confirmed that no responses were detected in the absence of the receptors or the G-protein (data not shown).
Triple-labeling in situ hybridization.
A triple-fluorescence labeling in situ hybridization analysis was performed as described previously (Ishimaru et al., 2005), with the following modifications: adult medaka fish and zebrafish were fixed with 4% paraformaldehyde (PFA) in PBS for 18 h at 4°C, dehydrated with methanol for 24 h at −20°C, decalcified with 0.5 m EDTA for 18 h at 4°C, cryoprotected with 30% sucrose in PBS, embedded in Tissue-Tek O.C.T. compound (Sakura Finetechnical, Tokyo, Japan) in liquid nitrogen, and sectioned horizontally in 7 μm thicknesses. The sections were fixed with PFA, carboethoxylated, treated with 20 μg/ml proteinase K for 15 min at 37°C, postfixed with 4% PFA in PBS for 10 min, and hybridized with riboprobes and hybridization buffer supplemented with 5% dextran sulfate.
Antisense riboprobes for mfT1Rs, zfT1Rs, zfT2Rs, and zfPLCβ2 were synthesized from the clones containing the full coding sequence of the genes, and that for mfPLCβ2 was described previously (Yasuoka et al., 2004; Ishimaru et al., 2005; Aihara et al., 2007). The probes were hydrolyzed to ∼500 base length before hybridization.
Zebrafish behavioral analysis.
Diets for fish were prepared as described previously (Y. Aihara, A. Yasuoka, S. Iwamoto, Y. Yoshida, T. Misaka, and K. Abe, unpublished observations). In brief, two tastant solutions and placebo were prepared: one was 100 mm denatonium benzoate, and the other was a mixture of l-Glu monosodium salt, Gly, l-Pro, l-Ser (100 mm each), and inosine monophosphate (IMP) disodium salt (20 mm). The placebo was only water. A 15 ml portion of each tastant solution was mixed in 300 ml of 2% EMASOL (Kao Corporation, Tokyo, Japan) with 30 g of melted glycerol tripalmitate containing DiIC12(3) (Invitrogen) and emulsified at 60°C. Immediately, the emulsion was added with 150 g of starch at 60°C and steamed for solidification at 100°C. The solidified starch was freeze-dried, pulverized, and sieved to obtain particles 200–300 μm in diameter
A colony of zebrafish was adapted to laboratory conditions. The fish were split into three groups (n = 5 each) and given 10 mg each of either amino acid-, denatonium-, or water (placebo)-containing diet. The behaviors were recorded by digital video camera during 7 min of ad libitum access. Unconsumed diets were collected by filtration, and fluorescent images were obtained.
Results
Taste response in zebrafish facial nerve to amino acids and bitter compounds
Fish perceive food-borne chemicals via their taste systems, but the chemicals to be ingested or avoided vary depending on the fish species (Marui and Caprio, 1992; Kasumyan and Doving, 2003). There are few studies concerning functional recordings from taste nerves of zebrafish and medaka fish. To determine which chemicals can be perceived as tastants by zebrafish, taste responses in the facial nerve of zebrafish were electrophysiologically recorded using a glass capillary suction electrode. It resulted that the nerve responded strongly to l-Ala and l-Pro, moderately to l-Cys, Gly, l-Ser, l-Tyr, quinine HCl, and denatonium, and weakly to some other amino acids (Fig. 1A,B). However, the nerve hardly responded to d-Ala, IMP, and betaine, in which sucrose and glucose, even at 300 mm, did not influence the taste nerve responses. The magnitudes of integrated facial nerve responses to l-Ala were dose dependent in the range of 10 nm to 10 mm, with an EC50 of 17 μm (Fig. 1C, squares). We prepared eight binary mixtures of each of l-Ala, l-Pro, l-Ser, and l-Cys and either IMP or betaine, which are known to enhance the taste intensity of amino acids in mammals and fish, respectively (Lindemann, 2001; Kasumyan and Doving, 2003). As a result of recording response, there was no synergy between any amino acid and IMP and between any amino acid and betaine in the case of zebrafish taste nerve responses (Fig. 1C,D). These results show that zebrafish perceive several amino acids and bitter compounds via the taste system.
Figure 1.

Facial nerve responses to various tastants in zebrafish. A, Integrated neural responses to various tastants. The concentrations of ligands used are 1 mm for l-Ala, l-Glu, Gly, l-Pro, l-Ser, d-Ala, and quinine HCl (QHCl), 10 mm for denatonium (Den), and 300 mm for sucrose. Horizontal bars indicate the duration of stimulation by each tastant. B, The neural responses, such as those shown in A, were normalized to the magnitude of responses to the standard, 1 mm l-Ala. Each column represents the mean ± SE of at least three independent assays (l-Lys and l-Leu at n = 2; mean). Sucrose (Sucr) and glucose (Gluc) were used at 300 mm, denatonium at 10 mm, and all other tastants at 1 mm. Beta, Betaine. C, Dose-dependent response of facial nerves to l-Ala in the absence (squares; n = 3) or presence of either 1 mm IMP (triangles with dashed line; n = 2) or 1 mm betaine (gray circles; n = 2). Responses were normalized to the mean response at 1 mm l-Ala. Each point represents the mean ± SE (squares) or the mean (triangles and circles). D, Quantification of the responses to the chemicals. Each amino acid was used at 0.1 mm in the absence (black bars) or presence of either 1 mm IMP (white bars) or 1 mm betaine (hatched bars). Responses were also normalized to the mean response at 1 mm l-Ala.
Zebrafish T1R2a/3 and T1R2b/3 responding to several l-amino acids
To characterize the ligands, we performed calcium imaging analysis of zebrafish T1Rs transiently expressed in HEK293T cells together with the chimeric G-protein G16/gust44 (Ueda et al., 2003). Zebrafish expresses two T1R2 subtypes (T1R2a and T1R2b) in their taste buds (Ishimaru et al., 2005). When we transfected each of the T1R receptors (T1R1, T1R2a, T1R2b, and T1R3), no calcium response was observed even in the presence of (in mm) 150 sucrose, 150 glucose, 50 saccharin, 50 sodium citrate, 10 IMP, 50 NaCl, or 50 l-amino acids (l-Tyr and l-Trp used at 5 mm) (data not shown).
We then tried cotransfection with another T1R. When the transfection was performed with T1R2a-T1R3 (T1R2a/3) or T1R2b-T1R3 (T1R2b/3), a part of cells responded to the l-amino acids applied. Representative results are shown in Figure 2A, in which l-Pro was used as the tastant. Zebrafish T1R2a/3 responded to l-Ala, l-Pro, l-Ser, and l-Tyr, but not to d-Ala, sucrose, glucose, or saccharin (Figs. 2A,B, 3A). The response of T1R2a/3 to l-Ala was dose dependent, with a threshold of ∼10 μm and an EC50 of 180 μm (Fig. 3C, squares). Transfection with another combination, zfT1R2b/3, also resulted in responding to certain l-amino acids; the response was strong to l-Ala (EC50, 1.2 mm), l-Pro, l-Ser, and l-Tyr, moderate to l-Cys and Gly, and weak to several other l-amino acids (Figs. 2A,B, 3B,C), with no response to d-Ala, sugars, or saccharin observed. Coincidentally to taste nerve response (Fig. 1C,D), the addition of either 1.25 or 10 mm IMP showed no synergistic effect on either T1R2a/3 or T1R2b/3 responses to 0.5 mm l-Ala (Fig. 3D). When other T1R combinations were tested, we failed to detect any response of T1R1/2s, T1R1/3, or T1R2a/2b to the amino acids and other tastants used above (Fig. 2A and data not shown). These results show that the zebrafish heteromeric receptors T1R2/3 respond to some l-amino acids but not to sugars or saccharin.
Figure 2.

Representative ratiometric images of fura-2-loaded HEK293T cells coexpressing zebrafish T1Rs and G16/gust44 to tastant stimuli. A, Top and bottom show the cell image immediately (2 s) and 30 s after stimulation with 50 mm l-Pro, respectively. The combinations of T1Rs used for the transfection are shown at the top of the panel. B, Ratiometric images of zfT1R2a/3 (top) or zfT1R2b/3 (bottom) transfected cells were obtained 30 s after stimulation with the tastants indicated. Concentrations were 50 mm for l-Ala and d-Ala, 150 mm for sucrose, and 10 mm for denatonium. Color scales indicate the fura-2 340/380 ratio from 0.5 (cyan) to 1.5 (red) as pseudocolor.
Figure 3.

Responses of HEK293T cells coexpressing zebrafish T1Rs and G16/gust44 to tastant stimuli. A, B, Quantification of responses of zfT1R2a/3- (A) or zfT1R2b/3- (B) transfected cells. Amino acids were used at 50 mm (l-Tyr and l-Trp used at 5 mm), sucrose (Sucr) and glucose (Gluc) at 150 mm, saccharin (Sac), trisodium citrate (Cit), and NaCl concentrations were 50 mm, and IMP and denatonium (Den) were 10 mm. C, Dose-dependent responses of zfT1R2a/3 (squares) and zfT1R2b/3 (gray circles) to l-Ala. Responses were normalized to the mean response at the highest concentrations. D, The response of zfT1R2a/3 and zfT1R2b/3 to 0.5 mm l-Ala in the absence (black bars) or presence of either 1.25 or 10 mm IMP (white bars or hatched bars, respectively). Each column and point in A–D represents the mean ± SE of at least three independent determinations.
Both medaka fish T1R1/3 and T1R2/3s responding to l-amino acids
We also performed calcium imaging analysis of medaka fish T1Rs characterized in our previous study (Ishimaru et al., 2005). We first confirmed that when HEK293T cells were transfected with T1R1, T1R2a, T1R2b, T1R2c, or T1R3 alone or in combinations with T1R1/2, there was no response to the tastants used in the assay of zebrafish T1Rs (data not shown).
However, when cells were transfected with combined T1R1/3, a part of cells responded to some l-amino acids such as l-Arg and l-Ser, but not to d-Arg (Fig. 4A). The response of mfT1R1/3 to l-Arg was dose dependent, with a response threshold of ∼0.5 mm and an EC50 of 6.5 mm (Fig. 5A, squares). The addition of either 1.25 mm IMP or betaine to various concentrations of l-Arg did not significantly influence the activation of mfT1R1/3 (Fig. 5A, triangles or circles).
Figure 4.

Responses of HEK293T cells coexpressing medaka fish T1Rs and G16/gust44 to tastant stimuli. A–D, Quantification of responses of mfT1R1/3 (A), mfT1R2a/3 (B), mfT1R2b/3 (C), and mfT1R2c/3 (D). Tastants used were the same as described in Figure 3, A and B, except that d-Arg was used instead of d-Ala for mfT1R1/3. Each column represents the mean ± SE of at least three independent determinations. Sucr, Sucrose; Gluc, glucose; Sac, saccharin; Cit, trisodium citrate; Den, denatonium.
Figure 5.

Dose-dependent response of medaka fish T1Rs. A, Dose-dependent response of mfT1R1/3 to l-Arg in the absence (squares) or presence of either 1.25 mm IMP (triangles with broken line) or 1.25 mm betaine (Beta; gray circles). B, Dose-dependent response of mfT1R2a/3 (squares), mfT1R2b/3 (triangles with dashed line), and mfT1R2c/3 (gray circles) to l-Ala. Responses in A and B were normalized to the mean response at the highest concentration, and each point represents the mean ± SE of at least three independent assays.
Interestingly, cells transfected with three T1R2/3 combinations responded to several l-amino acids as well. medaka fish T1R2a/3 and T1R2b/3 each responded to a broad spectrum of amino acids but not to the other tastants (Fig. 4B,C). However, mfT1R2c/3 responded only to a limited set of amino acids, such as l-Ala and l-Pro (Fig. 4D). The responses of mfT1R2/3s to l-Ala also occurred in a dose-dependent manner, with the EC50 values for T1R2a/3, T1R2b/3, and T1R2c/3 at 1.3, 0.7, and 17 mm, respectively (Fig. 5B). Similarly to the case of zfT1R2/3s and mfT1R1/3, the activation of mfT1R2/3s by l-Ala was not enhanced by the addition of IMP or betaine (data not shown). It should be noted that HEK293T cells transfected with the mfT1R2/3 combinations gradually rounded up, and many cells died from ∼15 h after the transfection, presumably because amino acids contained in the culture medium continually activate the T1R2/3s to induce prolonged calcium signaling.
A subset of taste bud cells coexpressing T1R1/3 or T1R2/3s in medaka fish
The above results suggest that the fish T1R1/3 and T1R2/3s could function as receptors for several l-amino acids. We previously showed that there are actually the cells coexpressing T1R1/3 or T1R2/3s in a subset of taste bud cells in zebrafish (Ishimaru et al., 2005). However, the expression pattern for mfT1Rs in taste bud cells is unknown. In this study, we performed a triple-labeling, in situ hybridization analysis to determine whether medaka fish T1R1 or T1R2s are coexpressed with T1R3 in taste bud cells. As observed in zebrafish, medaka fish T1R1, T1R2a, T1R2b, T1R2c, and T1R3 were expressed in a small subset of PLCβ2-expressing taste bud cells (Fig. 6). In particular, a part of T1R3-expressing cells also expressed T1R1 (Fig. 6A). Similarly, T1R2a, T1R2b, and T1R2c were expressed in parts of T1R3-expressing cells (Fig. 6B–D). These results indicate that, in medaka fish as well as in zebrafish and mammals, subsets of taste bud cells coexpress T1R1/3 or T1R2/3s, suggesting the possibility that these combinations function as heteromeric receptors in vivo.
Figure 6.

A triple-labeling in situ hybridization analysis for T1Rs and PLCβ2 in medaka fish taste buds. A–D, In situ hybridization was performed using horizontal sections of medaka fish gill raker, palate, and pharynx with antisense riboprobes for T1R3, PLCβ2 and T1R1 (A), T1R2a (B), T1R2b (C), or T1R2c (D). Signals are shown in pseudocolor as indicated at the bottom of the panel, and merged images for each result are shown in the right panels. Scale bar, 20 μm.
Zebrafish T2R5 and medaka fish T2R1 responding to denatonium
We searched for T2R candidate genes in the genome databases of zebrafish and medaka fish using homology search and bioinformatical methods (Ishimaru et al., 2005) (S. Okada, T. Nagai, S. Nakamura, Misaka, and Abe, unpublished observations). These analyses identified seven T2R candidates in zebrafish and one in medaka fish. We have already confirmed by in situ hybridization experiments the event that most of the T2R candidates are expressed in some of the cells in the taste buds (Okada, Nagai, Nakamura, Misaka, and Abe, unpublished observations).
In the present study, we performed calcium imaging analysis of the zebrafish and medaka fish T2Rs for the purpose of determining their ligands. We hypothesized that some bitter tastants for mammals would be included in their ligands because of the similarities among T2Rs. As expected, zfT2R5-transfected HEK293T cells responded strongly to 10 mm denatonium (Fig. 7A,B), an aversive compound for mammals and Drosophila (Chandrashekar et al., 2000; Marella et al., 2006). However, no response was observed for other tastants, including 10 mm l-amino acids (l-Tyr was not tested), 100 mm saccharin, 100 mm acesulfame K, 1 mm cycloheximide, 1 mm phenylthiocarbamide, 0.25 mm sucrose octaacetate, 10 mm salicin, 0.01 mm quinine HCl, 0.25 mm strychnine, 0.1 mm naringin, 3 mm colchicine, 10 mm caffeine, 10 mm theophylline, 0.05 mm nicotine, 0.5 mm brucine, 2.5 mm atropine, and 100 mm MgCl2 (Fig. 7B and data not shown). Moreover, mfT2R1, a medaka fish ortholog of zfT2R5, also responded to denatonium (Fig. 7A), with no response to other tastants described above (data not shown). The response of these receptors to denatonium was dose dependent, with thresholds of ∼1 mm (Fig. 7C).
Figure 7.
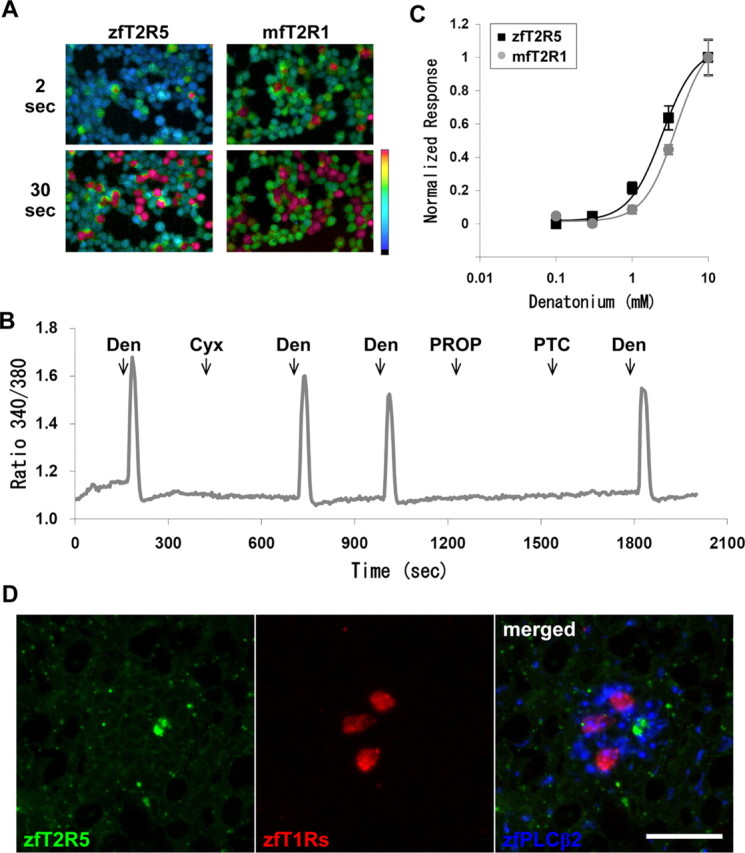
Responses of HEK293T cells coexpressing zfT2R5 or mfT2R1 with G16/gust44 to denatonium, and the expression relationship between zfT2R5 and zfT1Rs in taste buds. A, Representative ratiometric images of fura-2-loaded HEK293T cells during the application of 10 mm denatonium. Top and bottom show the cell images that were obtained 2 and 30 s after stimulation, respectively. Color scale indicates F340/F380 ratio from 0.5 (cyan) to 1.5 (red) as pseudocolor. B, Responses of HEK293T cells coexpressing zfT2R5 and G16/gust44 to various stimuli. Ligands were used at a concentration of 10 mm for denatonium (Den) and 1 mm for cycloheximide (Cyx), 6-n-propylthiouracil (PROP), and phenylthiocarbamide (PTC). All stimuli were perfused for 12 s, and the starting points for each stimulation are indicated by arrows. The trace was derived from 13 responding cells. C, Dose-dependent response of zfT2R5 (squares) and mfT2R1 (gray circles) to denatonium. Responses were normalized to the mean response at the highest concentration. Each point represents the mean ± SE of at least three independent assays. D, A triple-labeling in situ hybridization of T2R5, T1Rs, and PLCβ2 in zebrafish taste buds. In situ hybridization was performed using horizontal sections of zebrafish gill raker, palate, and pharynx with antisense riboprobes for T2R5, T1Rs, and PLCβ2. Signals are shown in pseudocolor as indicated at the bottom of the panel, and a merged image is shown in the right panel. Scale bar, 20 μm.
Zebrafish T2R5 expressing in a subset of taste bud cells segregated from T1R-expressing cells
In mammals, T1Rs and T2Rs are expressed in segregated populations of taste bud cells (Hoon et al., 1999; Adler et al., 2000). Similarly, we showed that, in zebrafish, T2R1a and T2R1b were expressed in taste bud cells not expressing T1Rs (Ishimaru et al., 2005). In this study, we examined the expression relationships between zfT2R5 and zfT1Rs by in situ hybridization and found that T2R5 was expressed in a small subset of PLCβ2-expressing taste bud cells (Fig. 7D). More than 100 signals for each probe were observed, none of the signals for T2R5 merged with those using T1R mixed probes. This result shows that T2R5, as well as T1R1a and T2R1b, is expressed in the cells that lack T1Rs (i.e., T1R1, T1R2a, T1R2b, and T1R3), indicating that the taste cells expressing T1Rs and T2Rs are segregated from each other in fish as well as in mammals.
Zebrafish prefers diets containing amino acids and avoids those containing denatonium
We performed behavioral analysis of zebrafish diet consumption to confirm the preference and avoidance. We prepared three kinds of starch diets (Aihara, Yasuoka, Iwamoto, Yoshida, Misaka, and Abe, unpublished observations): one containing amino acids such as Gly, l-Glu, l-Pro, and l-Ser, another containing denatonium, and the third being placebo with no particular tastants contained. During ad libitum access to each of the diets, zebrafish positively ingested the diet containing amino acids and spewed out that containing denatonium as soon as it entered the mouth. The amount of each diet consumed by zebrafish was quantified by measurement of the fluorescence intensity of the uneaten diet remaining in the tank (Fig. 8). It resulted that the fish consumed the amino acid-containing diet much more than the placebo and that they consumed the denatonium-containing diet slightly less than the placebo. The result may also mean that the placebo is rather an aversive diet for the fish. The behavioral analysis clearly shows that zebrafish perceive amino acids as attractive tastants, whereas denatonium is aversive.
Figure 8.

Differences in feeding behaviors. The images were obtained when zebrafish was given the diets containing amino acids (left column), denatonium (right column), and the placebo (middle column), with time course differences in top and bottom. The fluorescence intensities of the uneaten diets remaining in the tank were taken photographically 420 s after the start of ad libitum access to the diets (bottom).
Discussion
T1Rs as receptors for attractive tastants
As shown in this study, fish T1R1 and T1R2 each couple to T1R3, and the resulting combinations function as receptors for attractive tastants. This reception feature in fish is quite similar to that in mammals. However, fish detect amino acids not only by T1R1/3 but also by multiple T1R2/3s. This is consistent with the experimental data that fish have multiple amino acid receptors in their taste systems (Kanwal et al., 1987; Wegert and Caprio, 1991; Finger et al., 1996; Ogawa and Caprio, 1999, 2000). The finding that the receptors of l-Ala and l-Arg exist in different taste cells of channel catfish (Finger et al., 1996) may be explained by the existence of T1R1/3 and T1R2/3, although some reports suggest the existence of the ligand-gated ion channel in channel catfish as the l-Arg receptor (Teeter et al., 1990; Grosvenor et al., 2004). This accords with our data that mfT1R1/3 responds well to l-Arg and mfT1R2/3s to l-Ala (Fig. 4), and that T1R1 and T1R2s are expressed in segregated taste bud cells in zebrafish (Ishimaru et al., 2005). Moreover, the data that T1Rs in each fish species respond to different amino acids (Figs. 3, 4) provide a good explanation on how the amino acid responding profiles of taste nerves vary depending on fish species (Kasumyan and Doving, 2003).
The profile of taste nerve response in zebrafish is in good agreement with the calcium imaging data on zfT1R2a/3 and zfT1R2b/3 (Figs. 1, 3), suggesting that fish mainly detect the taste of amino acids by T1R2/3s rather than by T1R1/3. Most amino acids are recognized by T1R2/3s in medaka fish as well, although l-Arg is specifically received by T1R1/3. In the response to l-Ala, the threshold in the nerve recording is lower than that in cell based assay (Figs. 1, 3). This may be due to a difference among signaling components, because in our cell based assay we used the G16/gust44 chimeric G-protein, which did not exist in actual taste cells. Neither the nerve response data nor the calcium imaging data showed the presence of any response to sugars; this result is consistent with the observation that many fish do not prefer sugars (Kasumyan and Doving, 2003).
Each fish needs to adapt its taste receptors to foods existing in drastically changeable circumstances in a small aquatic world. It may be advantageous to possess multiple T1R2s that have different sensitivities and responding profiles. Although the reason that T1R1 and T1R2s are expressed in separate cells remains to be fully explained, one possibility is that the availability of two segregated taste modalities allows fish to efficiently discriminate body-constituting substances and energy resources, as is the case for mammalian T1R1/3 and T1R2/3.
Evolution of vertebrate T1R2
Recent genomic studies have revealed that T1R genes exist in fish, amphibians, avian and mammalian species, but not in invertebrate species. This suggests that the gene has appeared after the separation of vertebrates and invertebrates (Ishimaru et al., 2005; Pfister and Rodriguez, 2005; Go, 2006; Shi and Zhang, 2006). T1Rs belong to GPCR family C, which comprises mGluRs (metabotropic glutamate receptors), CaSRs (calcium-sensing receptors), GABAB receptors as well as several chemosensory receptors such as V2Rs and 5.24 olfactory receptors. A common feature of these family C receptors is that they possess an amino acid-binding pocket in a long N-terminal extracellular domain (Alioto and Ngai, 2006; Conigrave and Hampson, 2006; Kuang et al., 2006; Wang and Hampson, 2006). This indicates that ancestral T1R2/3 as well as T1R1/3 could respond to amino acids. T1R2 differs markedly from other T1Rs. T1R2 exists as a multigene family in fish but is absent in chicken and frog (Lagerstrom et al., 2006; Shi and Zhang, 2006); it exists as a pseudogene in cats (Li et al., 2005). The sequences also display low similarity between fish and mammalian species (Ishimaru et al., 2005; Pfister and Rodriguez, 2005; Go, 2006; Shi and Zhang, 2006). These results suggest that T1R2 is a changeable gene that has passed several times through duplication and deletion. It is possible that several T1R2 genes had existed before the separation of teleost fish and tetrapods. During the evolution of mammals, their T1R2/3 receptors have acquired sugar-responding ability, although some mammals such as cats failed to respond to sugars. In contrast, fish may have acquired a duplicated T1R2 gene organization to give them a broad responding spectrum and a prominent sensitivity to amino acids.
T2Rs as receptors for aversive tastants
In our previous study, we used sequence analysis to identify three fish T2R genes in two fish species, zebrafish and fugu fish (Ishimaru et al., 2005), but since then, the fish genome database has expanded. Other researchers have also identified candidate T2R genes by computational analysis (Pfister and Rodriguez, 2005; Go, 2006; Shi and Zhang, 2006). More recently, we identified several candidate T2R genes in four fish species and found that most of the T2R candidates in zebrafish and medaka fish were expressed in taste buds (Okada, Nagai, Nakamura, Misaka, and Abe, unpublished observations). This suggests that these genes are homologs of mammalian T2Rs despite a low degree of sequence similarity. Furthermore, we confirmed that expression of T2Rs was segregated from that of T1Rs in fish as well as in mammals and found that denatonium acted as a ligand for fish T2Rs (Fig. 7). We have shown that zebrafish avoids denatonium (Fig. 8), which, however, is not contained in usual foods. In a separate study, we observed that medaka fish also avoided denatonium and preferred amino acids (Aihara, Yasuoka, Iwamoto, Yoshida, Misaka, and Abe, unpublished observations). Together, these results indicate that T2Rs are functionally conserved as receptors for aversive tastants in vertebrates.
There are 20–50 T2R genes in mammals and frog (Xenopus tropicalis), whereas there are only a few in fish and chicken (Gallus gallus) (Go, 2006) (Okada, Nagai, Nakamura, Misaka, and Abe, unpublished observations). One possible explanation for this is the incompleteness of the genome databases. Some additional genes in fish may not have been found yet. However, it appears that different numbers of T2Rs do occur in different types of vertebrates. T2Rs of fish are phylogenetically segregated from those of mammals, frog, or chicken T2Rs, suggesting that T2R gene families have expanded after the separation of each lineage. Similarly, there are a few fish V1R receptors known that have apparently diverged from mammalian V1Rs. These function as pheromone receptors and are closely related to T2R genes. Thus, T2Rs and V1Rs may not have been so many before the separation of teleost fish and tetrapods, and their numbers in fish may not have expanded to the degree as in mammals.
Taste modalities in fish
It is not yet known how many taste modalities are discriminated in fish. As far as we can see from our experiments, the ligands of T2R and the cells in which T2Rs are expressed are distinct from those of T1Rs in fish, similar to the situation in mammals. This shows that in vertebrates there are at least two common taste modalities for attraction and aversion. Fish, as well as mammals, may discriminate the two attractive taste modalities, because zfT1R1 and zfT1R2s are expressed in segregated populations of taste bud cells (Ishimaru et al., 2005). Moreover, it may be possible to separate other attractive taste modalities from one another, because unlike mammals, fish have cells expressing only T1R2s. Fish taste nerves responded to organic and fatty acids (Kasumyan and Doving, 2003), which may be perceived as other taste modalities. Although it is still unknown whether fish perceive sourness and saltiness, our results revealed the existence of at least two taste modalities conserved in vertebrates at the levels of peripheral taste receptors.
Conclusion
We have demonstrated that fish T1R1/3 and T1R2/3s act as receptors for amino acids, whereas denatonium is a ligand for zfT2R5 and mfT2R1. These results suggest the presence of a fundamental rule that, among vertebrates, attractive tastants are recognized by T1Rs and aversive tastants by T2Rs. Unlike mammals, fish are characterized by having multiple T1R2s, all of which act as receptors to amino acids. Vertebrate T1R2s have probably evolved to adapt themselves to necessary nutrients depending on the species: fish to amino acids and mammals to sugars.
Footnotes
This work was supported by Ministry of Education, Culture, Sports, Science, and Technology Grant-in-Aid 16108004 (K.A.) and by Salt Science Research Foundation Grant 05S4 (K.A.).
References
- Adler E, Hoon MA, Mueller KL, Chandrashekar J, Ryba NJ, Zuker CS. A novel family of mammalian taste receptors. Cell. 2000;100:693–702. doi: 10.1016/s0092-8674(00)80705-9. [DOI] [PubMed] [Google Scholar]
- Aihara Y, Yasuoka A, Yoshida Y, Ohmoto M, Shimizu-Ibuka A, Misaka T, Furutani-Seiki M, Matsumoto I, Abe K. Transgenic labeling of taste receptor cells in model fish under the control of the 5′-upstream region of medaka phospholipase C-beta 2 gene. Gene Expr Patterns. 2007;7:149–157. doi: 10.1016/j.modgep.2006.06.004. [DOI] [PubMed] [Google Scholar]
- Alioto TS, Ngai J. The repertoire of olfactory C family G protein-coupled receptors in zebrafish: candidate chemosensory receptors for amino acids. BMC Genomics. 2006;7:309. doi: 10.1186/1471-2164-7-309. [DOI] [PMC free article] [PubMed] [Google Scholar]
- Asano-Miyoshi M, Abe K, Emori Y. IP(3) receptor type 3 and PLCbeta2 are co-expressed with taste receptors T1R and T2R in rat taste bud cells. Chem Senses. 2001;26:259–265. doi: 10.1093/chemse/26.3.259. [DOI] [PubMed] [Google Scholar]
- Caprio J. High sensitivity of catfish taste receptors to amino acids. Comp Biochem Physiol A. 1975;52:247–251. doi: 10.1016/s0300-9629(75)80160-5. [DOI] [PubMed] [Google Scholar]
- Caprio J, Brand JG, Teeter JH, Valentincic T, Kalinoski DL, Kohbara J, Kumazawa T, Wegert S. The taste system of the channel catfish: from biophysics to behavior. Trends Neurosci. 1993;16:192–197. doi: 10.1016/0166-2236(93)90152-c. [DOI] [PubMed] [Google Scholar]
- Chandrashekar J, Mueller KL, Hoon MA, Adler E, Feng L, Guo W, Zuker CS, Ryba NJ. T2Rs function as bitter taste receptors. Cell. 2000;100:703–711. doi: 10.1016/s0092-8674(00)80706-0. [DOI] [PubMed] [Google Scholar]
- Conigrave AD, Hampson DR. Broad-spectrum L-amino acid sensing by class 3 G-protein-coupled receptors. Trends Endocrinol Metab. 2006;17:398–407. doi: 10.1016/j.tem.2006.10.012. [DOI] [PubMed] [Google Scholar]
- Damak S, Rong M, Yasumatsu K, Kokrashvili Z, Perez CA, Shigemura N, Yoshida R, Mosinger B, Jr, Glendinning JI, Ninomiya Y, Margolskee RF. Trpm5 null mice respond to bitter, sweet, and umami compounds. Chem Senses. 2006;31:253–264. doi: 10.1093/chemse/bjj027. [DOI] [PubMed] [Google Scholar]
- Finger TE, Bryant BP, Kalinoski DL, Teeter JH, Bottger B, Grosvenor W, Cagan RH, Brand JG. Differential localization of putative amino acid receptors in taste buds of the channel catfish, Ictalurus punctatus. J Comp Neurol. 1996;373:129–138. doi: 10.1002/(SICI)1096-9861(19960909)373:1<129::AID-CNE11>3.0.CO;2-F. [DOI] [PubMed] [Google Scholar]
- Funakoshi M, Kawakita K, Marui T. Taste response in the facial nerve of the carp, Cyprinus carpio L. Jpn J Physiol. 1981;31:381–390. doi: 10.2170/jjphysiol.31.381. [DOI] [PubMed] [Google Scholar]
- Go Y. Proceedings of the SMBE Tri-National Young Investigators' Workshop 2005. Lineage-specific expansions and contractions of the bitter taste receptor gene repertoire in vertebrates. Mol Biol Evol. 2006;23:964–972. doi: 10.1093/molbev/msj106. [DOI] [PubMed] [Google Scholar]
- Grosvenor W, Kaulin Y, Spielman AI, Bayley DL, Kalinoski DL, Teeter JH, Brand JG. Biochemical enrichment and biophysical characterization of a taste receptor for L-arginine from the catfish, Ictalurus puntatus. BMC Neurosci. 2004;5:25. doi: 10.1186/1471-2202-5-25. [DOI] [PMC free article] [PubMed] [Google Scholar]
- Hoon MA, Adler E, Lindemeier J, Battey JF, Ryba NJ, Zuker CS. Putative mammalian taste receptors: a class of taste-specific GPCRs with distinct topographic selectivity. Cell. 1999;96:541–551. doi: 10.1016/s0092-8674(00)80658-3. [DOI] [PubMed] [Google Scholar]
- Huang AL, Chen X, Hoon MA, Chandrashekar J, Guo W, Trankner D, Ryba NJ, Zuker CS. The cells and logic for mammalian sour taste detection. Nature. 2006;442:934–938. doi: 10.1038/nature05084. [DOI] [PMC free article] [PubMed] [Google Scholar]
- Ishimaru Y, Okada S, Naito H, Nagai T, Yasuoka A, Matsumoto I, Abe K. Two families of candidate taste receptors in fishes. Mech Dev. 2005;122:1310–1321. doi: 10.1016/j.mod.2005.07.005. [DOI] [PubMed] [Google Scholar]
- Ishimaru Y, Inada H, Kubota M, Zhuang H, Tominaga M, Matsunami H. Transient receptor potential family members PKD1L3 and PKD2L1 form a candidate sour taste receptor. Proc Natl Acad Sci USA. 2006;103:12569–12574. doi: 10.1073/pnas.0602702103. [DOI] [PMC free article] [PubMed] [Google Scholar]
- Jiang P, Ji Q, Liu Z, Snyder LA, Benard LM, Margolskee RF, Max M. The cysteine-rich region of T1R3 determines responses to intensely sweet proteins. J Biol Chem. 2004;279:45068–45075. doi: 10.1074/jbc.M406779200. [DOI] [PubMed] [Google Scholar]
- Kanwal JS, Hidaka I, Caprio J. Taste responses to amino acids from facial nerve branches innervating oral and extra-oral taste buds in the channel catfish, Ictalurus puntatus. Brain Res. 1987;406:105–112. doi: 10.1016/0006-8993(87)90774-8. [DOI] [PubMed] [Google Scholar]
- Kasumyan AO, Doving KB. Taste preferences in fishes. Fish Fish. 2003;4:289–347. [Google Scholar]
- Kuang D, Yao Y, Maclean D, Wang M, Hampson DR, Chang BS. Ancestral reconstruction of the ligand-binding pocket of family C G protein-coupled receptors. Proc Natl Acad Sci USA. 2006;103:14050–14055. doi: 10.1073/pnas.0604717103. [DOI] [PMC free article] [PubMed] [Google Scholar]
- Lagerstrom MC, Hellstrom AR, Gloriam DE, Larsson TP, Schioth HB, Fredriksson R. The G protein-coupled receptor subset of the chicken genome. PLoS Comput Biol. 2006;2:e54. doi: 10.1371/journal.pcbi.0020054. [DOI] [PMC free article] [PubMed] [Google Scholar]
- Lamb CF, Finger TE. Gustatory control of feeding behavior in goldfish. Physiol Behav. 1995;57:483–488. doi: 10.1016/0031-9384(94)00287-f. [DOI] [PubMed] [Google Scholar]
- Li X, Staszewski L, Xu H, Durick K, Zoller M, Adler E. Human receptors for sweet and umami taste. Proc Natl Acad Sci USA. 2002;99:4692–4696. doi: 10.1073/pnas.072090199. [DOI] [PMC free article] [PubMed] [Google Scholar]
- Li X, Li W, Wang H, Cao J, Maehashi K, Huang L, Bachmanov AA, Reed DR, Legrand-Defretin V, Beauchamp GK, Brand JG. Pseudogenization of a sweet-receptor gene accounts for cats' indifference toward sugar. PLoS Genet. 2005;1:27–35. doi: 10.1371/journal.pgen.0010003. [DOI] [PMC free article] [PubMed] [Google Scholar]
- Lindemann B. Receptors and transduction in taste. Nature. 2001;413:219–225. doi: 10.1038/35093032. [DOI] [PubMed] [Google Scholar]
- Marella S, Fischler W, Kong P, Asgarian S, Rueckert E, Scott K. Imaging taste responses in the fly brain reveals a functional map of taste category and behavior. Neuron. 2006;49:285–295. doi: 10.1016/j.neuron.2005.11.037. [DOI] [PubMed] [Google Scholar]
- Marui T, Caprio J. Teleost gustation. In: Hara TJ, editor. Fish chemoreception. London: Chapman and Hall; 1992. pp. 171–198. [Google Scholar]
- Michel WC, Steullet P, Cate HS, Burns CJ, Zhainazarov AB, Derby CD. High-resolution functional labeling of vertebrate and invertebrate olfactory receptor neurons using agmatine, a channel-permeant cation. J Neurosci Methods. 1999;90:143–156. doi: 10.1016/s0165-0270(99)00077-1. [DOI] [PubMed] [Google Scholar]
- Mueller KL, Hoon MA, Erlenbach I, Chandrashekar J, Zuker CS, Ryba NJ. The receptors and coding logic for bitter taste. Nature. 2005;434:225–229. doi: 10.1038/nature03352. [DOI] [PubMed] [Google Scholar]
- Nakajima K, Asakura T, Oike H, Morita Y, Shimizu-Ibuka A, Misaka T, Sorimachi H, Arai S, Abe K. Neoculin, a taste-modifying protein, is recognized by human sweet taste receptor. NeuroReport. 2006;17:1241–1244. doi: 10.1097/01.wnr.0000230513.01339.3b. [DOI] [PubMed] [Google Scholar]
- Nelson G, Hoon MA, Chandrashekar J, Zhang Y, Ryba NJ, Zuker CS. Mammalian sweet taste receptors. Cell. 106:381–390. doi: 10.1016/s0092-8674(01)00451-2. [DOI] [PubMed] [Google Scholar]
- Nelson G, Chandrashekar J, Hoon MA, Feng L, Zhao G, Ryba NJ, Zuker CS. An amino-acid taste receptor. Nature. 2002;416:199–202. doi: 10.1038/nature726. [DOI] [PubMed] [Google Scholar]
- Ogawa K, Caprio J. Facial taste responses of the channel catfish to binary mixtures of amino acids. J Neurophysiol. 1999;82:564–569. doi: 10.1152/jn.1999.82.2.564. [DOI] [PubMed] [Google Scholar]
- Ogawa K, Caprio J. Glossopharyngeal taste responses of the channel catfish to binary mixtures of amino acids. Chem Senses. 2000;25:501–506. doi: 10.1093/chemse/25.5.501. [DOI] [PubMed] [Google Scholar]
- Pfister P, Rodriguez I. Olfactory expression of a single and highly variable V1r pheromone receptor-like gene in fish species. Proc Natl Acad Sci USA. 2005;102:5489–5494. doi: 10.1073/pnas.0402581102. [DOI] [PMC free article] [PubMed] [Google Scholar]
- Shi P, Zhang J. Contrasting modes of evolution between vertebrate sweet/umami receptor genes and bitter receptor genes. Mol Biol Evol. 2006;23:292–300. doi: 10.1093/molbev/msj028. [DOI] [PubMed] [Google Scholar]
- Teeter JH, Brand JG, Kumazawa T. A stimulus-activated conductance in isolated taste epithelial membranes. Biophys J. 1990;58:253–259. doi: 10.1016/S0006-3495(90)82370-5. [DOI] [PMC free article] [PubMed] [Google Scholar]
- Ueda T, Ugawa S, Yamamura H, Imaizumi Y, Shimada S. Functional interaction between T2R taste receptors and G-protein α subunits expressed in taste receptor cells. J Neurosci. 2003;23:7376–7380. doi: 10.1523/JNEUROSCI.23-19-07376.2003. [DOI] [PMC free article] [PubMed] [Google Scholar]
- Wang M, Hampson DR. An evaluation of automated in silico ligand docking of amino acid ligands to family C G-protein coupled receptors. Bioorg Med Chem. 2006;14:2032–2039. doi: 10.1016/j.bmc.2005.10.052. [DOI] [PubMed] [Google Scholar]
- Wegert S, Caprio J. Receptor sites for amino acids in the facial taste system of the channel catfish. J Comp Physiol A Neuroethol Sens Neural Behav Physiol. 1991;168:201–211. doi: 10.1007/BF00218412. [DOI] [PubMed] [Google Scholar]
- Yasuoka A, Aihara Y, Matsumoto I, Abe K. Phospholipase C-beta 2 as a mammalian taste signaling marker is expressed in the multiple gustatory tissues of medaka fish, Oryzias latipes. Mech Dev. 2004;121:985–989. doi: 10.1016/j.mod.2004.03.009. [DOI] [PubMed] [Google Scholar]
- Yoshii K, Kamo N, Kurihara K, Kobatake Y. Gustatory responses of eel palatine receptors to amino acids and carboxylic acids. J Gen Physiol. 1979;74:301–317. doi: 10.1085/jgp.74.3.301. [DOI] [PMC free article] [PubMed] [Google Scholar]
- Zhang Y, Hoon MA, Chandrashekar J, Mueller KL, Cook B, Wu D, Zuker CS, Ryba NJ. Coding of sweet, bitter, and umami tastes: different receptor cells sharing similar signaling pathways. Cell. 2003;112:293–301. doi: 10.1016/s0092-8674(03)00071-0. [DOI] [PubMed] [Google Scholar]
- Zhao GQ, Zhang Y, Hoon MA, Chandrashekar J, Erlenbach I, Ryba NJ, Zuker CS. The receptors for mammalian sweet and umami taste. Cell. 2003;115:255–266. doi: 10.1016/s0092-8674(03)00844-4. [DOI] [PubMed] [Google Scholar]