

Abstract
Acetylcholine is a major neurotransmitter that modulates cortical functions. In addition to basal forebrain neurons that give rise to the principal cholinergic input into the cortex, a second source constituted by intrinsic cholinergic interneurons has been identified. Although these cells have been characterized anatomically, little is known about their functional role in cortical microcircuits. The paucity of this cell population has been a major hindrance for detailed electrophysiological investigations. To facilitate functional studies, we generated transgenic mice that express enhanced green fluorescent protein (EGFP) in choline acetyltransferase (ChAT)-positive neurons. Aided by the transgene expression, the characterization of distinct cholinergic interneurons was possible. These cells were located in layer 2–3, had a bipolar morphology, were calretinin- and vasoactive intestinal peptide positive, but had a non-GABAergic phenotype. Paired recordings showed that EGFP/ChAT-positive neurons receive excitatory and inhibitory input from adjacent principal cells and various types of interneurons. However, EGFP/ChAT-positive neurons do not exert direct postsynaptic responses in neighboring neurons. Interestingly, prolonged activation of EGFP-labeled cholinergic neurons induces an increase in spontaneous EPSCs in adjacent pyramidal neurons. This indirect effect is mediated by nicotinic receptors that are presumably presynaptically localized. Thus, intrinsic bipolar cholinergic neurons can modulate cortical function locally.
Keywords: ChAT, acetylcholine receptor, nicotinic receptor, calretinin, VIP, BAC, EGFP, GABAergic neuron
Introduction
The cholinergic innervation of the cortex is an important modulatory system that is involved in numerous cognitive functions, including attention (Voytko et al., 1994), learning (Fine et al., 1997), and memory (Hasselmo et al., 1992). The main cholinergic input to the forebrain has its origin in the basal forebrain with the nucleus basalis magnocellularis constituting the principal source of cholinergic fibers that project to the cortex (Mesulam et al., 1983a). For a long time it had been a matter of debate whether the subcortical input is the only cholinergic input to the cortex. Occasional reports about the existence of intrinsic cholinergic neurons in the cortex remained controversial until the late 1980s, but the presence of this cell population that constitutes the second source of cholinergic input to cortical neurons is now well accepted (Levey et al., 1984; Houser et al., 1985). However, little is known about cortical cholinergic neurons because their scarcity has precluded systematic functional/electrophysiological investigations. Anatomical studies have indicated that cholinergic neurons are small bipolar neurons, located mainly in layer 2–3 in nearly all cortical areas (Eckenstein and Thoenen, 1983; Houser et al., 1985), and many coexpress vasoactive intestinal peptide (VIP) (Eckenstein and Baughman, 1984) and calretinin (Cauli et al., 1997). In the rat cortex, cholinergic neurons of both a GABAergic and non-GABAergic phenotype have been described (Kosaka et al., 1988; Bayraktar et al., 1997). Overall, the function of cortical cholinergic neurons has remained elusive. Most electrophysiological studies pertaining to the function of acetylcholine in the cortex had to resort to local or bath-application of acetylcholine or other agonists and antagonists. This often hampered determining the exact site of action given the localization of acetylcholine receptors (AChRs) both presynaptically and postsynaptically. Receptor diversity, their differential expression with respect to neuronal cell types as well as neuronal compartments, can explain the numerous effects of acetylcholine in the brain, including postsynaptic currents, presynaptic modulation of transmitter release, influence on the membrane potential, input resistance, and firing pattern, to name just a few (for review, see Lucas-Meunier et al., 2003). In addition, the influence on cortical activity seems to be highly dependent on the concentration of acetylcholine (Kuczewski et al., 2005). The functional consequence at the network level of cell type-specific cholinergic modulation by acetylcholine leading to either an increase or decrease of neuronal activity is still widely unknown (Lucas-Meunier et al., 2003).
To gain more insight into the intrinsic cholinergic system of the cortex, we generated transgenic mice expressing enhanced green fluorescent protein (EGFP) under the control of the choline acetyltransferase (ChAT) promoter and characterized cortical cholinergic interneurons with respect to their anatomical and electrophysiological properties. Although no direct cholinergic effects such as nicotinic postsynaptic potentials could be observed, a potentially presynaptic nicotinergic influence on the frequency of spontaneous EPSCs (sEPSCs) of principal cells in the vicinity of the cholinergic interneurons was seen. In contrast to basal forebrain neurons that innervate large cortical areas (Miettinen et al., 2002), cortical bipolar cholinergic interneurons with their restricted columnar organization are ideally suited to modulate locally cortical activity.
Materials and Methods
Generation of ChAT-EGFP transgenic mice.
A transgene was constructed by homologous recombination of a bacterial artificial chromosome (BAC) containing the ChAT gene and used for pronucleus injection into mouse zygotes for generating transgenic lines.
The CITB mouse BAC library (Research Genetics, Huntsville, AL) was screened for the ChAT gene by hybridization with an exon 14–16-derived 275 bp probe generated by PCR with the following primers: 5′-primer (GGTCGGGTGGACAACATCAGA) and 3′-primer (CCTGGCTGGTGGAGAGAATA). Hybridizing BACs were further analyzed for size after NotI digestion and pulse-field gel electrophoresis (PFGE) (CHEF-DR III; Bio-Rad, Hercules, CA) and for the extent of the 5′-flanking and 3′-flanking regions of the ChAT gene by Southern blots of PFGE-resolved SacII-digested BAC DNA with suitable PCR-generated probes (5′-primer CATAGGCTGATCTGTTCAGCCTGTCGCCTG and 3′-primer CTAAGTGCCTGTGGCCTTTACAACTGGAAA). Of the isolated BAC clones, clone 585J12 with an approximate size of 150 kb, containing >50 kb upstream and >64 kb downstream of the ChAT gene, was chosen for transgene construction. A targeting vector was constructed to introduce a cassette of the EGFP coding sequence fused to the bovine growth hormone polyadenylation signal into the ChAT gene on BAC 585J12 such that the initiator methionine codon became the initiator codon for EGFP. The cassette was flanked by recombinogenic arms (RAs) spanning 921 bp 5′ and 472 bp 3′ of the initiator codon, and generated by PCR with primers 5′-primer1 (GGCTCTCGAGGGCTAATAAAG), 3′-primer1 (CTAGCGATTCTTAATCCAGAG), 5′-primer2 (ATGCCTATCCTGGAAAAGGT), and 3′-primer1 (TATCCTGATTGTTCCTCTAAA). The EGFP coding cassette and RAs were assembled by standard cloning techniques, and the correct sequence assembly was cloned into the SalI site of the pSV1recA shuttle vector. For homologous recombination of the targeting cassette into BAC clone 585J12, cointegrates were generated by transforming 585J12-containing DH10B cells with pSV1.RecA-5′3′RA-EGFP DNA. Cointegration and resolution steps were as described previously (Yang et al., 1997). The modified BAC DNA separated from bacterial genomic DNA by cesium chloride gradient ultracentrifugation was released from the vector by NotI digestion and isolated by Sepharose column chromatography with column fractions analyzed by PFGE.
Purified, linearized BAC DNA (0.7 μg/ml) was microinjected into B6D2F2 mouse zygotes. Tail DNA of founders served to test the presence of the EGFP cDNA and integrity of the integrated BAC DNA using the following primers: 5′-primer1 (TAACTATGCGGCATCAGAGC), 3′-primer1 (GCCTGCAGGTCGACTCTAGAG), 5′-primer2 (GTGTCACCTAAATAGCTTGGCG), and 5′-primer2 (GGGGTTCGCGTTGGCCGATTC). Copy numbers of the integrated transgene were determined via Southern blot after HindIII digestion of genomic DNA and hybridization with a 5′ recombinogenic arm probe. Of four founders with the integrated BAC containing both vector arms, a line with multiple copy integration was selected for additional analysis. Breeding transgenic with C57BL/6 mice produced wild-type and transgenic mice at Mendelian ratios. The EGFP expression pattern was analyzed in transgenic mice, starting with the F2 generation.
Immunohistochemistry.
Immunohistochemical studies were performed on 30–100 μm free-floating sections obtained from perfused brains of postnatal day 25 (P25) to P35 mice [4% paraformaldehyde (PFA)/PBS, pH 7.4]. For colocalization studies of ChAT and EGFP immunohistochemistry in the cortex, 250-μm-thick transverse slices were prepared from the brains of P12–P15 transgenic mice. The sections were kept for 8 h in an incubation chamber in artificial CSF (ACSF; 22–24°C) containing (in mm) 125 NaCl, 2.5 KCl, 2 CaCl2, 1 MgCl2, 1.25 NaH2PO4, 25 NaHCO3, and 25 glucose, pH 7.2 (maintained by continuous bubbling with carbogen), with 100 μg/ml colchicine (Sigma, St. Louis, MO) to enhance the immunoreactivity for the anti-ChAT antibody (Ab) in the cell body. The slices were subsequently fixed for 1 h (2% PFA/PBS, pH 7.4). The following primary monoclonal Abs were used: mouse monoclonal anti-ChAT Ab, 1:1000 (Cozzari et al., 1990); rabbit anti-EGFP Ab, 1:10000 (Invitrogen, Goettingen, Germany); rabbit anti-calretinin Ab, 1:5000 (Swant, Bellinzona, Switzerland); mouse anti-calretinin Ab, 1:5000 (Swant); rabbit anti-calbindin Ab, 1:5000 (Swant); mouse anti-calbindin Ab, 1:5000 (Swant); rabbit anti-parvalbumin Ab, 1:1000 (Swant); mouse anti-parvalbumin Ab, 1:3000 (Sigma); rabbit anti-somatostatin Ab, 1:1000 (Millipore, Temecula, CA); rat anti-somatostatin Ab, 1:1000 (Millipore); rabbit anti- cholecystokinin (CCK) Ab, 1:1000 (Millipore); mouse anti-CCK Ab, 1:1000 (University of California Los Angeles RIA Core, Los Angeles, CA); rabbit anti-VIP Ab, 1:500 (Incstar, Stillwater, MN). For visualization of primary Abs, slices were incubated with FITC- or Cy3-conjugated secondary Abs: anti-mouse Cy3-coupled secondary Ab, 1:200; anti-rabbit FITC-coupled secondary Ab 1:200; anti-rat Cy3-coupled secondary Ab 1:200 (Jackson ImmunoResearch, West Grove, PA). Sections were analyzed using an upright fluorescent microscope (BX51; Olympus, Hamburg, Germany) or a confocal microscope (DM IRE2; Leica, Wetzlar, Germany).
In situ hybridization for GAD67 mRNA and EGFP immunohistochemistry. In situ hybridization was performed essentially as described previously (Catania et al., 1995). In situ hybridization studies were performed on 30 μm free-floating sections obtained from perfused brains of P25–P30 mice. GAD67 riboprobes were transcribed from Bluescript transcription vectors (SK polylinker; Stratagene, La Jolla, CA) containing rat GAD67 cDNA (Erlander et al., 1991) T3 RNA polymerase (Boehringer, Mannheim, Germany). The subsequent immunohistochemistry was performed as described above with a rabbit anti-EGFP Ab, 1:10000 (Invitrogen), and a Cy3-coupled secondary Ab 1:200 (Jackson ImmunoResearch).
Electrophysiology.
Two-hundred and fifty-micrometer-thick transverse slices were prepared from the brains of P12–P15 transgenic mice. Whole-cell recordings in current- and voltage-clamp mode were performed at room temperature (22–25°C) simultaneously from two neurons using pipettes with resistance of 5–7 MΩ when filled with the following (in mm): 105 K gluconate, 30 KCl, 4 Mg-ATP, 10 phosphocreatine, 0.3 GTP, and 10 HEPES, pH 7.3, KOH, 293 mOsm. In synaptically connected neurons, suprathreshold intracellular stimulation of presynaptic cells evoked depolarizing EPSPs and IPSPs. EGFP-positive neurons were visually identified using an upright microscope (Axioskop FS2; Zeiss, Oberkochen, Germany) equipped with infrared-differential interference contrast and standard epifluorescence. Stimulus delivery and data acquisition was performed using Pulse software (Heka Elektronik, Lambrecht, Germany). Slices were continuously superfused with ACSF (22–24°C) containing (in mm) 125 NaCl, 2.5 KCl, 2 CaCl2, 1 MgCl2, 1.25 NaH2PO4, 25 NaHCO3, and 25 glucose, pH 7.2 (maintained by continuous bubbling with carbogen). Signals were filtered at 1–3 kHz, sampled at 10 kHz, and off-line analysis was performed using Igor Pro (Wavemetrics, Lake Oswego, OR).
Electrophysiological analysis.
The analysis of electrophysiological properties was performed essentially as described previously (Cauli et al., 1997). Hyperpolarizing and depolarizing current pulses (1000 ms) were applied to calculate input resistance and threshold potential. Action potential (AP) waveforms were analyzed at threshold potential. The AP and afterhyperpolarization (AHP) amplitude was measured from threshold to the peak of the AP or AHP. The duration of the AP was measured at half amplitude. ƒburst, ƒ200, and ƒlast (all in hertz) were measured at the maximal current step applied before spike inactivation became evident and were calculated from the reciprocal of the first interspike interval (ISI), the ISI after 200 ms, and the last ISI respectively. The early and late accommodation (in percent) was calculated according to (100 × ƒburst − ƒ200)/ƒburst and (100 × ƒ200 − ƒlast)/ƒ200 respectively. Frequency-dependent changes in EPSPs and IPSPs were examined by measuring paired-pulse ratios (PPR; mean amplitude of second response/mean amplitude of first response) after stimulation of pyramidal neurons or interneurons (AP induction at 20 Hz). During the recording of sEPSCs, bicuculline methiodide (20 μm; Sigma) was used to block GABA receptor channels, and during the recording of spontaneous IPSCs (sIPSCs), CNQX (10 μm; Tocris, Bristol, UK) was used to block AMPA receptor channels. Current was injected into EGFP/ChAT-positive neurons for a 1.6 s duration and the current strength was chosen such to induce several action potentials (35 ± 16 APs) in the EGFP/ChAT-positive neurons. The frequency of spontaneous activity was recorded during (stim) as well as 1.6 s before (pre) and after (post) the activation of the EGFP-expressing cells. We calculated the changes in the frequency from the pre to the stim and post periods (Δfstim − pre and Δfpost − pre) and compared these changes to the changes in frequency from the pre period to control periods in which the EGFP/ChAT-positive neuron was not stimulated (Δfctr(stim) − pre and Δfctr(post) − pre). EGFP/ChAT-positive neurons were repetitively activated (with an interval of 15 s) to observe a sufficient number of sEPSCs and sIPSCs (sEPSCs, n = 148 ± 96; sIPSCs, n = 296 ± 168; mean ± SD) during the time of activation. The average frequency of sEPSCs and sIPSCs in the pre period was 3.8 ± 4.2 and 1.2 ± 0.6 Hz (mean ± SD), respectively.
Biocytin filling and fluorescence immunohistochemistry for ChAT in slices.
Brain slices of P12–P15 mice were prepared as described for electrophysiology. Neurons were patch clamped for 1 min with biocytin in the pipette. After the pipette was withdrawn, slices were kept in the recording chamber for additional 10 min. Slices were immersed in 2% PFA/PBS for 1 h at RT followed by several washes in phosphate buffer (PB). After cryoprotection in 30% PBS-sucrose for 2–3 h, slices were permeabilized by three to four freeze–thaw cycles. Slices were incubated in 1% H2O2/PB for 15 min, washed thoroughly, and preincubated with 10% NGS in 1% Triton-PBS. Slices were incubated overnight at 4°C with the anti-ChAT Ab, 1:1000 (Cozzari et al., 1990), followed by incubation with Cy3-conjugated secondary Ab (1:400; Vector Laboratories, Burlingame, CA) to visualize ChAT immunoreactivity, and FITC-conjugated Avidin (1:400; Vector Laboratories) to visualize biocytin-filled cells.
Cell reconstruction.
Two-hundred and fifty-micrometer-thin slices with biocytin-filled cells were fixed with 2% PFA and 2.5% glutaraldehyde in phosphate buffer, pH 7.4, overnight at 4°C, washed, cryoprotected, permeabilized as described above, and processed according to standard avidin-biotin complex protocol (Vector Laboratories) by using diaminobenzidine chromogen. Next, the slices were Vibratome sectioned at 80 μm thickness, treated with osmium tetroxide, dehydrated, infiltrated with Epon, sandwiched between Aclar platelets, and cured at 70°C for 24 h. Subsequently, flat embedded tissue was mounted onto microscope slides and biocytin-filled cells were reconstructed with the aid of a Neurolucida 3D reconstruction system.
Statistics.
Data are presented as mean ± SEM. For statistical analysis, Friedman ANOVA for repeated measures and Student–Newman–Keuls multiple comparison analysis were used. Values of p < 0.05 were considered statistically significant.
Results
Transgenic ChAT-EGFP mice express EGFP in various brain areas
To express the in vivo marker EGFP under the control of the ChAT promoter, we used BAC transgene technology. The enzyme ChAT acetylates choline to acetylcholine. Thus, it is a good marker for cholinergic neurons and was used in several immunohistochemical studies to specifically stain cholinergic neurons (Mesulam et al., 1983b). The ChAT gene consists of 17 exons spanning a region of >64 kb of genomic DNA (Hahn et al., 1992). The EGFP coding sequence was inserted such that the initiator methionine codon located in exon four became the initiator codon for EGFP. Four founder animals were generated from pronuclear injection of the modified BAC clone, one with single and three with multiple integrated copies of the transgene (Fig. 1). One of the three lines with multiple integrations was selected for additional investigation.
Figure 1.

Generation of transgenic animals with EGFP expression in ChAT-positive neurons. A, Schematic representation of the ChAT gene structure, the recombination cassette, and the modified ChAT gene located on a BAC. The EGFP coding sequence followed by a bovine growth hormone polyadenylation signal (pA) was inserted into the translational start of the ChAT gene. Positions of HindIII and NotI restriction sites are indicated. The PCR fragment used as probe for the Southern blot is indicated as a black bar. B, Southern blot analysis of tail DNA isolated from transgenic mice with a single copy and with multiple integrated copies of the transgene (tg) and digested with HindIII to compare signal intensity of the wild-type (wt; 7.2 kb) and modified (8.2 kb) alleles.
In all areas known to contain cholinergic neurons, EGFP expression could be observed. Thus, green neurons were found in all cortical areas (Fig. 2). The majority of EGFP-positive neurons in the cortex (73%; n = 289) had a bipolar shape. These neurons were preferentially located in layer 2–3. Twenty-seven percent of EGFP-positive neurons were bigger and multipolar, and were mainly located in lower layers. In the hippocampus, few green cells were located in the dentate gyrus and in the CA1 region, and rarely in the CA3 region. Big and very bright cells were found throughout the basal forebrain (Fig. 2). Few and less bright cells were seen in the striatum. In the midbrain and brainstem, big and strongly fluorescent neurons were located in all motor nuclei (supplemental Fig. 1, available at www.jneurosci.org as supplemental material), the pedunculopontine and laterodorsal tegmental nuclei, and the parabigeminal nuclei. In the spinal cord, we observed green cells especially in the anterior horn at the location of motor neurons, around the central canal, in the intermediate horn, and, rarely, in the dorsal horn. Brain regions in which ChAT is not expressed, like the cerebellum, were devoid of EGFP.
Figure 2.

EGFP expression in the brain. A, B, Transgene expression visualized with EGFP Abs in the somatosensory cortex (A) and the cinguli gyri (B). C, D, Coexpression of EGFP (green) and ChAT (red) in the cortex (C) and the nucleus basalis (D). Arrows indicate double-labeling. Few EGFP-positive cells (arrows) are not ChAT-IR. Scale bars: A, B, 200 μm; C, 25 μm; D, 100 μm.
EGFP colocalizes with ChAT in most brain areas
To investigate the fidelity of the transgene expression at the cellular level we performed double-labeling studies and analyzed the coexpression of ChAT and EGFP. In most brain areas, there was a good correspondence between EGFP and ChAT expression (Fig. 2, Table 1). The transgene recapitulates faithfully the expression of the endogenous gene particularly in areas in which ChAT levels are high. Thus, in a number of brainstem nuclei, in the striatum, and the spinal cord, virtually all EGFP-positive cells are also ChAT-immunoreactive (IR). In some regions such as the striatum, the labeling (defined as the percentage of ChAT-IR cells expressing EGFP) was only ∼30%. In areas with weaker ChAT expression such as the cortex, the colocalization (defined as the percentage of EGFP-positive cells expressing ChAT) and labeling was lower than in areas with strong ChAT immunoreactivity. The anti-ChAT Ab was quite sensitive to the fixative PFA, resulting in very weak immunoreactivity in cells with little ChAT content such as interneurons in the cortex. In addition, there was strong immunoreactivity of a dense fibernet in the cortex, most likely axons from cholinergic neurons located in the basal forebrain, which often masked weakly ChAT-IR cell bodies. To reduce the immunoreactivity of axons with a subcortical origin, we performed immunohistochemical experiments on slices, which were kept for 8 h in ACSF before fixation. In addition, we added colchicine during this incubation time to enhance the immunoreactivity of the cell body of cortical interneurons and used a very weak fixation protocol (1 h with 2% PFA). The majority of ChAT-IR cells have a bipolar morphology, but increasing the sensitivity of their detection after colchicine treatment revealed the presence of weakly ChAT-IR cells with a multipolar shape. These cells constitute 10.9% (n = 201) of ChAT-IR neurons and they have also been described in the rat brain (Bayraktar et al. 1997). Colocalization studies show that, in the cortex, 73.8% (n = 500) of EGFP-positive neurons are ChAT-IR. It is of note that the correspondence of EGFP expression and ChAT immunoreactivity is significantly better in the bipolar EGFP-positive cells with stronger ChAT immunoreactivity (91.4%; n = 454) compared with those EGFP-positive neurons with multipolar morphology and weaker ChAT immunoreactivity (45.5%; n = 129). A total of 41.5% (n = 677) of all cholinergic interneurons expressed EGFP. “False negative” cells (i.e., ChAT-IR cells that did not express EGFP) were found for both populations alike. Thus, 40% of bipolar (n = 179) and 54% of multipolar (n = 22) ChAT-IR neurons express EGFP (Fig. 2).
Table 1.
Colocalization (defined as percentage of EGFP-positive cells expressing ChAT) and labeling (defined as percentage of ChAT-IR cells expressing EGFP) in different brain areas
| Brain region | % colocalization | % labeling |
|---|---|---|
| Nucleus basalis | 96 (n = 125) | 65 (n = 237) |
| Medial septum | 100 (n = 65) | 48.6 (n = 70) |
| Striatum | 97 (n = 67) | 35 (n = 150) |
| Cortex | 74 (n = 500) | 42 (n = 677) |
| Cranial nerve nuclei | 100 (n = 110) | 100 (n = 100) |
| Pedunculopontine tegmental nucleus | 100 (n = 46) | 77 (n = 47) |
| Laterodorsal tegmental nucleus | 100 (n = 100) | 48 (n = 188) |
| Parabigeminal nucleus | 100 (n = 300) | 100 (n = 150) |
| Spinal cord motor neurons | 100 (n = 196) | 100 (n = 211) |
| Spinal cord sympathetic neurons | 100 (n = 192) | 100 (n = 187) |
| Spinal cord central canal | 100 (n = 146) | 80 (n = 180) |
| Retina | 12 (n = 170) | <1% |
ChAT and EGFP colocalize in the cortex with VIP and calretinin
The presence of markers such as parvalbumin, calbindin, calretinin, somatostatin, CCK, and VIP is one criterion by which interneurons have been divided into subgroups that are in part overlapping. Several studies demonstrated that cortical cholinergic interneurons have a high colocalization with calretinin (Cauli et al., 1997) and VIP (Eckenstein and Baughman, 1984). Consistent with these findings, our analysis showed that nearly all ChAT-IR interneurons were VIP-IR (98%; n = 417) and calretinin-IR (92%; n = 515). No colocalization with parvalbumin (n = 107), calbindin (n = 150), somatostatin (n = 430), and CCK (n = 44) was seen (Fig. 3).
Figure 3.

Expression profile of interneuron markers in EGFP-positive and ChAT-IR neurons. A, B, EGFP-positive (A) and ChAT-IR (B) neurons coexpress calretinin (CR) (A', B'). C, D, EGFP-positive (C) and ChAT-IR (D) neurons are calbindin negative (CB) (C', D'). A“–D”, Overlay. E, The graph shows that most EGFP-positive (green bars) and ChAT-IR (red bars) are VIP-IR and calretinin-IR, but there is little or no coexpression with somatostatin, CCK, calbindin, and parvalbumin. Scale bars, 50 μm.
Double-immunohistochemical studies with Abs against EGFP and different interneuronal markers demonstrated that most EGFP-expressing cells were also VIP-IR and calretinin-IR. Of all EGFP-expressing interneurons, 95% were VIP-IR (n = 46), 77% calretinin-IR (n = 322), 14% somatostatin-IR (n = 1312), 7% CCK-IR (n = 100), and 5% calbindin-IR (n = 100). No colocalization with parvalbumin (n = 100) could be observed (Fig. 3).
The analysis at the cellular level revealed that both ChAT and EGFP were preponderantly expressed in VIP and calretinin cells. However, EGFP also labeled a minority of somatostatin-, calbindin-, and CCK-positive cells. The labeling of this apparent “false positive” cell population occurred only in multipolar cells and could thus also be a problem of detectability of ChAT in these cells (see above).
Because previous studies indicated that 53–88% of bipolar cholinergic interneurons in the cortex coexpress GABA (Kosaka et al., 1988; Bayraktar et al., 1997), GAD67 and EGFP coexpression were studied in transgenic mice. Whereas bipolar EGFP-positive interneurons were GAD67 negative (n = 37), most multipolar EGFP-positive interneurons were positive for GAD67 (96.3; n = 27) (Fig 4). These findings are not necessarily in contradiction with studies that reported ChAT and GAD coexpression also in bipolar cells because in the cortex the transgene expression was detected only in 41.5% of all ChAT-IR cells.
Figure 4.

Differential coexpression of GAD67 in bipolar and multipolar EGFP-positive neurons. A–D, EGFP immunohistochemistry (A, B) combined with in situ hybridization for GAD67 (C, D). Bipolar EGFP-positive cells are GAD67 negative, and multipolar EGFP-positive cells are GAD67 positive. Scale bars, 20 μm. E, Quantitative evaluation.
Morphological and basic electrophysiological properties of EGFP/ChAT-positive neurons
The subsequent analysis focused on bipolar ChAT-IR neurons because they constitute the majority of EGFP-expressing cells in the cortex. For the above-described coexpression studies, an EGFP-Ab was used and, hence, the signal was enhanced. To verify whether EGFP levels suffice to reliably detect cholinergic bipolar cells in acutely prepared slices, ChAT immunoreactivity was studied in biocytin-filled cells. Of 15 EGFP-expressing interneurons, 14 (93.3%), but none of adjacent biocytin-filled “control cells” (EGFP negative), were CHAT-IR (Fig. 5).
Figure 5.

Biocytin-filled EGFP-positive neurons in the cortex are ChAT-IR. A, Biocytin labeling of a bipolar EGFP-positive neuron (small arrow) and an adjacent EGFP-negative neuron (big arrow). B, The EGFP-positive neuron, but not the EGFP-negative neuron is ChAT-IR. Other small ChAT-IR neurons are also visible. C, Overlay of A and B. Scale bar, 25 μm.
To study the morphology of layer 2–3 bipolar cholinergic cells, biocytin-filled EGFP/ChAT-positive neurons were reconstructed (n = 28 cells). Cell somata had a spindle-like to ovoid shape and were small. Typically, the somatodendritic morphology was bipolar-bitufted and the dendrites emerged from the upper and lower poles extending into layers 1–4. The dendrites, emerging from the lower pole of the somata, had stronger branching. Dendrites were mildly varicose and occasionally spiny. In most cases, the axon emanated from one of the primary basal dendrites close to the cell body. The axon branched in the vicinity of the cell body and extended into layers 4 and 5, but rarely into layer 6. In few cells (n = 2), one or two axon collaterals ascended vertically, spanning layers 2 and 1. Usually, the main portion of the axon was restricted to the dendritic field and extended only rarely into neighboring cortical areas (Fig. 6).
Figure 6.

Morphological and electrophysiological characterization of bipolar EGFP/ChAT-positive neurons. A, Reconstruction showing the typical morphology of a bipolar cholinergic neuron. Red, Axon; blue, dendrites. B, Voltage responses to hyperpolarizing and depolarizing current injections. At threshold, the cell shows regular firing. The inset illustrates the characteristic triphasic waveform of the AHP. At higher current injection, the cell shows a regular firing pattern with an initial burst of two action potentials and no frequency adaptation after the burst. C, Example of a cell with a stuttering firing pattern. D, Current–frequency plot; mean ± SEM; n = 32 cells. Scale bar, 50 μm.
The basic properties of bipolar EGFP/ChAT-positive interneurons are summarized in Table 2. Many EGFP/ChAT-positive neurons showed at threshold current injection a stuttering firing pattern (defined as clusters of APs with a regular frequency intermingled with irregular periods of inactivity). With stronger current injection, most cells exhibited a firing pattern characterized by an initial burst of two APs (86% of the cells) and little or no accommodation (88% of the cells). Also, few cells (12%) continued to exhibit a stuttering firing pattern with strong current injection. In 82% of the cells, a first and fast AHP was followed by a short depolarization and a subsequent slower second AHP, which together formed a characteristic triphasic waveform (Fig. 6).
Table 2.
Basic electrophysiological properties of EGFP/ChAT-positive bipolar neurons in the cortex (mean ± SD)
| Number of cells | 33 |
|---|---|
| Input resistance (MΩ) | 358 ± 97.8 |
| Resting Potential (mV) | 67.1 ± 4.2 |
| Threshold Potential (mV) | 43.8 ± 4.3 |
| First spike amplitude (mV) | 65.5 ± 7.7 |
| Second spike amplitude (mV) | 62.2 ± 8.2 |
| First AHP amplitude (mV) | 7.5 ± 2.7 |
| Second AHP amplitude (mV) | 8.9 ± 2.5 |
| First spike duration (ms) | 1.6 ± 0.3 |
| Second spike duration (ms) | 1.7 ± 0.3 |
| fmean (Hz) | 33.4 ± 9.4 |
| fburst (Hz) | 89.5 ± 36.9 |
| f200 (Hz) | 33.1 ± 8.8 |
| flast (Hz) | 31.4 ± 9.9 |
| Early accommodation (%) (100 × fburst − f200)/fburst) | 60.4 ± 16.9 |
| Late accommodation (%) (100 × f200 − flast)/f200) | 4.9 ± 18.8 |
EGFP/ChAT-positive interneurons are innervated by adjacent pyramidal neurons and interneurons
One hundred and eighty-six pairs comprising an EGFP/ChAT-positive cell and a nearby pyramidal neuron and 40 pairs of an EGFP/ChAT-positive cell and another interneuron were tested. The activation of EGFP/ChAT-positive interneurons never induced cholinergic postsynaptic potentials in pyramidal neurons or interneurons. Only in two of the total 40 pairs with an EGFP/ChAT-positive cell and an interneuron could GABAergic postsynaptic potentials that were blocked by bicuculline be measured.
The activation of postsynaptic muscarinic AChRs (mAChRs) has been shown to change the conductance of K+-channels and, thus, has an influence not only on the membrane potential but also on input resistance and firing pattern of neurons in the cortex (McCormick and Prince, 1986; Cox et al., 1994; Kawaguchi, 1997; Xiang et al., 1998). To study the potential occurrence of slower events mediated by the activation of mAChR, EGFP/ChAT-positive cells were activated for 3 s and the membrane potential of 16 pyramidal neurons and 20 interneurons was recorded. Hyperpolarizing and suprathreshold depolarizing currents were injected for 3 s in parallel with the activation of the EGFP/ChAT-positive interneuron to determine input resistance and firing pattern. There was no alteration of any of these parameters (percent change of membrane potential, input resistance, and number of APs during activation of the EGFP/ChAT-positive neuron was +0.09, +0.1, and +0.04%, and +0.05, −0.19, and −0.34% in pyramidal neurons and interneurons, respectively) (Fig. 7).
Figure 7.
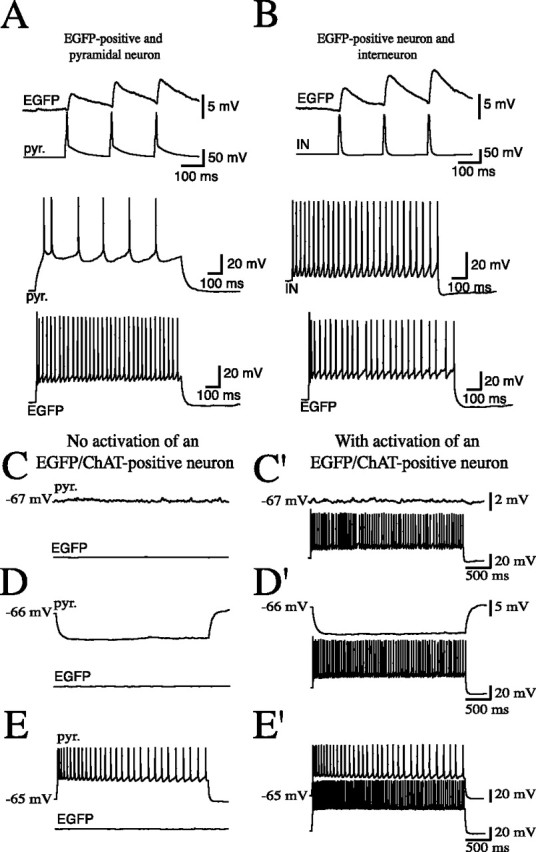
Paired recordings of EGFP/ChAT-positive (EGFP) and adjacent pyramidal neurons (pyr.) and interneurons (IN). A, B, The activation of a pyramidal neuron (A) and an interneuron (B) induces PSPs in the postsynaptic EGFP/ChAT-positive neuron. Identity of the recorded pyramidal neurons and interneurons was verified by their firing pattern (traces shown below). C–E', Prolonged activation of EGFP/ChAT-positive cells had no influence on membrane potential (C, C'), input resistance (D, D'), or firing pattern (E, E') in adjacent neurons. Recordings before (C–E) and during (C'–E') activation of EGFP/ChAT-positive neurons are shown.
Stimulation of the pyramidal cell led to EPSPs in 11 of 147 EGFP/ChAT-positive cells. Pairs of presynaptic APs were delivered at 20 Hz to investigate short-term plasticity. Seven of the 11 pyramidal cell-to-EGFP/ChAT-positive cell pairs showed paired-pulse facilitation (PPF) (1.93 ± 0.63; mean ± SD) and in four pairs, paired-pulse depression was observed (0.79 ± 0.14%; mean ± SD). Activation of 40 interneurons (18 nonaccommodating, 12 accommodating, 10 fast-spiking) induced IPSPs in six EGFP/ChAT-positive cells. Of these six connected interneurons, two showed a nonaccommodating, two an accommodating, and two a fast-spiking behavior. The pairs with nonaccommodating and accommodating spiking behavior showed PPF (1.23 ± 0.16 and 1.21 ± 0.07, respectively; mean ± SD). Of the two fast-spiker to EGFP/ChAT-positive cell connections, one was facilitating (PPR, 1.35) and the other depressing (PPR, 0.71). Thus, the direct synaptic output of EGFP/ChAT-positive interneurons to adjacent pyramidal neurons and interneurons is sparse and their activity is controlled by both neighboring pyramids and different types of inhibitory neurons (Fig. 7).
Activation of EGFP/ChAT-positive neurons leads to an increase of spontaneous EPSCs in pyramidal neurons
Both nicotinic and muscarinic receptors are known also to be located presynaptically. Activation of these presynaptic receptors was shown to modulate transmitter release (McCormick and Prince, 1986; Wonnacott et al., 1989; McCormick, 1992; Caulfield, 1993; Vidal and Changeux, 1993; McGehee et al., 1995; Kawaguchi, 1997; Gioanni et al., 1999; Radcliffe et al., 1999; Dani, 2001; McGehee, 2002). Thus, we recorded spontaneous EPSCs and IPSCs in adjacent layer 3 and 4 pyramidal neurons to test whether excitatory input onto them is presynaptically modulated by the activation of EGFP/ChAT-positive neurons. Spontaneous activity was recorded before (pre), during (stim), and after stimulation (post) of the EGFP/ChAT-positive neurons. We calculated the changes in the frequency from the pre to the stim and post periods (Δfstim − pre and Δfpost − pre) and compared these changes to the changes in frequency from the pre period to control periods in which the EG FP/ChAT-positive neuron was not stimulated (Δfctr(stim) − pre and Δfctr(post) − pre). A modest increase of the frequency of spontaneous EPSCs during stimulation of EGFP/ChAT-positive neurons could be observed (Δfstim − pre sEPSC, 0.64 ± 0.21 Hz; Δfctr(stim) − pre sEPSC, 0.01 ± 0.05 Hz; p < 0.05, mean ± SEM; n = 28). Although not significant, there was a trend to an increased frequency of sEPSCs also after stimulation of the EGFP/ChAT-positive neurons (Δfpost − pre sEPSC, 0.31 ± 0.19 Hz; Δfctr(post) − pre sEPSC, −0.08 ± 0.07 Hz; p > 0.05, mean ± SEM; n = 28). No significant change in the frequency of sIPSCs was seen (Δfstim − pre sIPSC, −0.04 ± 0.02 Hz; Δfpost − pre sIPSC, 0.01 ± 0.01 Hz; Δfctr(stim) − pre sIPSC, −0.01 ± 0.02 Hz; Δfctr(post) − pre sIPSC, −0.01 ± 0.02 Hz; p > 0.05, mean ± SEM; n = 25). The amplitude of sEPSCs and of sIPSCs did not change significantly (sEPSCpre, 8.6 ± 0.5 pA; sEPSCstim, 8.9 ± 0.5 pA; sEPSCpost, 8.6 ± 0.5 pA; sIPSCpre, 15.91 ± 1.46 pA; sIPSCstim, 16.01 ± 1.36 pA; sIPSCpost, 15.25 ± 1.23 pA; p > 0.05, mean ± SEM; n = 28 for sEPSCs and 25 for sIPSCs). The increase of frequency of sEPSCs during activation of EGFP/ChAT-positive cells was mediated by nAChR because it could be blocked by hexamethonium (100 μm), a nicotinic AChR (nAChR) antagonist (with hexamethonium, Δfstim − pre sEPSC, −0.04 ± 0.05 Hz; Δfpost − pre sEPSC, 0.03 ± 0.04 Hz; Δfctr(stim) − pre sEPSC, −0.01 ± 0.05 Hz; Δfctr(post) − pre sEPSC, 0.05 ± 0.04 Hz; p > 0.05, mean ± SEM; n = 24). The specificity of this effect is further corroborated by experiments in which the same protocol led to no changes in sEPSC frequency or amplitude when adjacent “control” pyramidal instead of EGFP/ChAT-positive cells were stimulated (change in frequency of pyramidal cells, Δfstim − pre sEPSC, −0.01 ± 0.05 Hz; Δfpost − pre sEPSC, −0.01 ± 0.03 Hz; Δfctr(stim) − pre sEPSC, 0.05 ± 0.04 Hz; Δfctr(post) − pre sEPSC, −0.01 ± 0.04 Hz; amplitude, sEPSCpre, 8.5 ± 0.6 pA; sEPSCstim, 8.6 ± 0.6 pA; sEPSCpost, 8.5 ± 0.5 pA; p > 0.05, mean ± SEM; n = 14) (Fig. 8).
Figure 8.

Activation of EGFP/ChAT-positive neurons leads to an increase in the frequency of spontaneous EPSCs in pyramidal neurons. A, Spontaneous EPSCs were recorded in a pyramidal neuron (2) before, during, and after activation of an adjacent EGFP/ChAT-positive neurons (1). B, The average increase of spontaneous sEPSC frequency in pyramidal neurons is 0.6 Hz after the activation of the EGFP/ChAT-positive neurons (Δfstim − pre). The increase is significantly different from the change from the pre period to control periods, during which the EGFP/ChAT cell was not stimulated (Δfctr(stim) − pre, Δfctr(post) − pre). There is no significant increase in the sEPSC frequency in the post period (Δfpost − pre). The effect can be blocked with hexamethonium, a blocker of nAChRs. Activation of “control” pyramidal (pyr, 3 in C) cells does not show this effect. The activation of EGFP/ChAT-positive neurons does not alter the frequency of sIPSCs. Error bars indicate ±SEM (p < 0.05). C, Experimental configuration and proposed mechanism. The modulatory effect induced by EGFP/ChAT-positive neuron activation (1) is mediated by presynaptic nAChRs. SEPSCs were recorded in pyramidal cells (2). Stimulation of control pyramidal cells (3).
Discussion
The cortex receives strong cholinergic innervation from the basal forebrain nuclei and the modulatory effect of acetylcholine in the cortex is well established. However, little is known about how intrinsic cortical cholinergic interneurons may modulate cortical activity. Most studies so far focused on the expression of interneuron markers in this cell population (Eckenstein and Thoenen, 1983; Levey et al., 1984; Houser et al., 1985; Bayraktar et al., 1997). Systematic electrophysiological studies have been hampered by the paucity of cortical cholinergic interneurons. To overcome this hindrance, we generated transgenic mice that express the in vivo marker EGFP in cholinergic neurons using BAC technology. The faithful expression of the transgene was investigated by immunohistochemistry. The ChAT promoter ensured correct expression of EGFP in most brain regions. In the cortex, colocalization and labeling was lower than in other brain regions. Of all EGFP-positive neurons, 74% were found to be ChAT-IR and 42% of cholinergic interneurons were EGFP positive. Based on the somatic shape, EGFP-positive neurons in the cortex fall into two groups, bipolar and multipolar cells. The former constituted the majority of EGFP-positive interneurons (89%) and were located mainly in layer 2–3, whereas the latter were preferentially located in lower layers. The morphology and location of bipolar EGFP-positive neurons is in agreement with previous descriptions of cholinergic neurons in the cortex (Eckenstein and Thoenen, 1983; Levey et al., 1984; Houser et al., 1985), although some cholinergic neurons with multipolar shape were also mentioned (Bayraktar et al., 1997). The analysis of ChAT expression in EGFP-positive interneurons revealed a significantly better correspondence in bipolar compared with multipolar cells, with 91% of the former but only 46% of the latter being ChAT-IR. In the subsequent analysis, we focused on bipolar EGFP-positive interneurons not only because the transgene expression guaranteed reliable identification, but also because they represent the majority of cortical ChAT-positive interneurons. The EGFP signal per se sufficed for accurate recognition of bipolar EGFP-positive cells in the acute slice preparation as demonstrated by ChAT staining of biocytin-filled EGFP-positive cells (93% ChAT-IR).
Interneurons have been categorized based on the expression of Ca2+-binding proteins and neuropeptides. In agreement with previous studies (Eckenstein and Baughman, 1984; Bayraktar et al., 1997), we could show that ChAT-IR interneurons in the mouse cortex colocalize with VIP and calretinin (98 and 92% for VIP and calretinin, respectively), but not with parvalbumin, calbindin, somatostatin, or CCK. Also, the vast majority of EGFP-expressing cells were VIP-IR and calretinin-IR (95 and 77%, respectively). There was, in addition, some overlap with somatostatin (14%), CCK (7%), and calbindin (5%). Whereas bipolar EGFP-expressing interneurons expressed VIP and calretinin, the less numerous multipolar neurons were also found to express somatostatin, CCK, and calbindin.
Bipolar and multipolar EGFP-positive cortical interneurons also differed when analyzed for GAD67 coexpression. Thus, bipolar EGFP-positive interneurons were devoid of GAD67 in contrast to multipolar EGFP-positive interneurons that were GAD67 positive. These results were also corroborated by the electrophysiological results showing that in only 2 of 226 pairs of neurons, activation of the EGFP/ChAT-positive interneurons elicited GABAergic IPSPs in the postsynaptic interneuron. It is conceivable that few bipolar EGFP/ChAT-positive cells are also GABAergic, but the GAD67 mRNA content is too low to be detected. Alternatively, in these two cases, the putative bipolar cell may have been in fact multipolar. Indeed, it was more difficult in acute slices to distinguish the bipolar- from multipolar-shaped EGFP cells, where one had to rely on the EGFP signal, whereas for anatomical studies, Abs enhanced the signal.
The non-GABAergic phenotype of EGFP/ChAT-positive neurons was unexpected because a significant number (53–88%) of bipolar cholinergic interneurons in the rat cortex are thought to be GABAergic (Kosaka et al., 1988; Bayraktar et al., 1997). Several explanations might account for these discrepancies. (1) Because only 42% of ChAT-IR interneurons expressed EGFP, it is likely that our analyses focused on a subgroup of cholinergic interneurons that are non-GABAergic. (2) Species differences with more non-GABAergic cholinergic interneurons in mice compared with rats cannot be ruled out. (3) Technical problems pertaining to the sensitivity in detecting low levels of GAD67 could also produce false negatives.
The firing pattern has frequently served as one parameter based on which neurons were classified (Kawaguchi and Kubota, 1996; Cauli et al., 1997; Markram et al., 2004). EGFP/ChAT-positive interneurons are fairly uniform in this respect. In most cells, current injection induced regular firing with an initial burst and little accommodation, although few cells with a stuttering firing pattern were also observed. According to the classification proposed by Henry Markram and colleagues (Gupta et al., 2000), the majority of the firing patterns could be classified as nonaccommodating with an initial burst. Interestingly, no irregular spiking interneurons were found although this firing pattern was described for rat bipolar cholinergic (Cauli et al., 1997) and VIP-positive interneurons (Porter et al., 1998). It is unclear whether these discrepancies reflect a species difference (rat vs mouse) or differences in the recording conditions.
To obtain information regarding the connectivity of EGFP/ChAT-positive bipolar interneurons in the cortex, we performed patch-clamp recordings on pairs of neurons consisting of one EGFP/ChAT-positive bipolar neuron and either a pyramidal neuron or another GABAergic interneuron. The results demonstrated that EGFP/ChAT-positive bipolar neurons obtained input from local pyramidal neurons and from different types of interneurons. In contrast, cholinergic PSPs were never found when testing for the output of EGFP/ChAT-positive cells onto neighboring pyramidal cells and interneurons. Only in two pairs did activation of the EGFP/ChAT-positive cell induce GABAergic IPSPs in a postsynaptic interneuron.
The influence of ACh on cortical neurons is manifold. Postsynaptic potentials that were mediated by nicotinic receptors were described in pyramidal neurons and GABAergic interneurons (Roerig et al., 1997; Xiang et al., 1998; Porter et al., 1999; Alkondon et al., 2000). Activation of postsynaptic muscarinic receptors have been shown to depolarize some cortical neurons and hyperpolarize others, and other studies reported changes in the firing pattern and input resistance (Krnjevic et al., 1971; McCormick and Prince, 1986; Cox et al., 1994; Kawaguchi, 1997; Xiang et al., 1998; Gulledge and Stuart, 2005). Such changes were not found in either pyramidal cells or interneurons after activation of EGFP/ChAT-positive cells. The fact that we never observed direct cholinergic postsynaptic effects does not necessarily mean that EGFP/ChAT-positive neurons do not establish synapses and innervate other neurons. Several scenarios can be envisaged: (1) distal localization of AChR on the postsynaptic cell might be associated with changes too small to be measured; (2) the connectivity of cholinergic interneurons with adjacent neurons is very low; or (3) the target neurons are not in the vicinity. This last explanation, however, is unlikely because, even when extending the measurements to neurons located at a distance of up to 250 μm, stimulation of EGFP/ChAT-positive neurons had no direct cholinergic effect on the postsynaptic neuron.
Several studies demonstrated that acetylcholine can modulate transmitter release of pyramidal cells and interneurons (McCormick and Prince, 1986; McCormick, 1992; Vidal and Changeux, 1993; Kawaguchi, 1997; Gioanni et al., 1999). Thus, we tested whether EGFP/ChAT-positive interneurons might influence spontaneous activity in cortical neurons. We investigated a potential modulatory effect on spontaneous EPSCs and IPSCs. Spontaneous activity was measured in pyramidal neurons in layers 3 and 4 close to the EGFP/ChAT-positive neuron. We observed a modest increase in the mean frequency of sEPSCs (0.64 Hz), but not of sIPSCs. The amplitude of sEPSCs and sIPSCs was not altered. The effect on the frequency of sEPSCs was specific for the activation of EGFP/ChAT-positive cells because the activation of adjacent “control” pyramidal neurons did not lead to a change in sEPSC frequency. Previous studies proposed that an increase in glutamate release occurs via activation of presynaptic nAChRs (Vidal and Changeux, 1993; Wonnacott, 1997; Gioanni et al., 1999). In another study, the authors demonstrated that the increase in transmitter release mediated by nicotinic receptors could be blocked by hexamethonium (Lopez et al., 2001). The data presented here are consistent with the following scenario: activation of cortical bipolar EGFP/ChAT-positive cells lead to an enhancement of spontaneous sEPSCs by an indirect effect mediated by presynaptic nAChRs. Indeed, the enhancement of spontaneous EPSCs was mediated by AChRs of the nicotinic type because it could be reduced to basal levels by the antagonist hexamethonium. The localization of the nAChR is presumably presynaptic because a direct postsynaptic effect was not observed. The positive modulatory influence on the frequency of sEPSCs and the lack of an influence on sIPSCs might indicate that intrinsic cortical bipolar cholinergic/non-GABAergic neurons can increase net activity in the cortex.
The cholinergic innervation stemming from the nucleus basalis targets all cortical areas and layers (Mechawar et al., 2000). From the small cell number (7000) (Miettinen et al., 2002) in the nucleus basalis it can be inferred that the average target area of each neurons is large. In contrast, with their columnar orientation, intrinsic cholinergic cortical interneurons are ideally suited to exert a restricted modulatory effect on small cortical units. This effect is most likely distinct from that exerted by multipolar cholinergic and by the previously described bipolar cholinergic/GABAergic (Bayraktar et al., 1997) intracortical interneurons.
Footnotes
This work was supported by the Schilling Foundation (H.M.) and Deutsche Forschungsgemeinschaft Grant ME1985/1-1. We thank Ulla Amtmann for helping with the reconstructions, Imre Vida and Aleksandar Zivkovic for discussions, and Costantino Cozzari for the generous gift of the anti-ChAT antibody.
References
- Alkondon M, Pereira EF, Eisenberg HM, Albuquerque EX. Nicotinic receptor activation in human cerebral cortical interneurons: a mechanism for inhibition and disinhibition of neuronal networks. J Neurosci. 2000;20:66–75. doi: 10.1523/JNEUROSCI.20-01-00066.2000. [DOI] [PMC free article] [PubMed] [Google Scholar]
- Bayraktar T, Staiger JF, Acsady L, Cozzari C, Freund TF, Zilles K. Co-localization of vasoactive intestinal polypeptide, gamma-aminobutyric acid and choline acetyltransferase in neocortical interneurons of the adult rat. Brain Res. 1997;757:209–217. doi: 10.1016/s0006-8993(97)00218-7. [DOI] [PubMed] [Google Scholar]
- Catania MV, Tolle TR, Monyer H. Differential expression of AMPA receptor subunits in NOS-positive neurons of cortex, striatum, and hippocampus. J Neurosci. 1995;15:7046–7061. doi: 10.1523/JNEUROSCI.15-11-07046.1995. [DOI] [PMC free article] [PubMed] [Google Scholar]
- Caulfield MP. Muscarinic receptors—characterization, coupling and function. Pharmacol Ther. 1993;58:319–379. doi: 10.1016/0163-7258(93)90027-b. [DOI] [PubMed] [Google Scholar]
- Cauli B, Audinat E, Lambolez B, Angulo MC, Ropert N, Tsuzuki K, Hestrin S, Rossier J. Molecular and physiological diversity of cortical nonpyramidal cells. J Neurosci. 1997;17:3894–3906. doi: 10.1523/JNEUROSCI.17-10-03894.1997. [DOI] [PMC free article] [PubMed] [Google Scholar]
- Cox CL, Metherate R, Ashe JH. Modulation of cellular excitability in neocortex: muscarinic receptor and second messenger-mediated actions of acetylcholine. Synapse. 1994;16:123–136. doi: 10.1002/syn.890160206. [DOI] [PubMed] [Google Scholar]
- Cozzari C, Howard J, Hartman B. Analysis of epitopes on choline acetyltransferase (ChAT) using monoclonal antibodies (Mabs) Soc Neurosci Abstr. 1990;16:200. [Google Scholar]
- Dani JA. Overview of nicotinic receptors and their roles in the central nervous system. Biol Psychiatry. 2001;49:166–174. doi: 10.1016/s0006-3223(00)01011-8. [DOI] [PubMed] [Google Scholar]
- Eckenstein F, Baughman RW. Two types of cholinergic innervation in cortex, one co-localized with vasoactive intestinal polypeptide. Nature. 1984;309:153–155. doi: 10.1038/309153a0. [DOI] [PubMed] [Google Scholar]
- Eckenstein F, Thoenen H. Cholinergic neurons in the rat cerebral cortex demonstrated by immunohistochemical localization of choline acetyltransferase. Neurosci Lett. 1983;36:211–215. doi: 10.1016/0304-3940(83)90002-2. [DOI] [PubMed] [Google Scholar]
- Erlander MG, Tillakaratne NJ, Feldblum S, Patel N, Tobin AJ. Two genes encode distinct glutamate decarboxylases. Neuron. 1991;7:91–100. doi: 10.1016/0896-6273(91)90077-d. [DOI] [PubMed] [Google Scholar]
- Fine A, Hoyle C, Maclean CJ, Levatte TL, Baker HF, Ridley RM. Learning impairments following injection of a selective cholinergic immunotoxin, ME20.4 IgG-saporin, into the basal nucleus of Meynert in monkeys. Neuroscience. 1997;81:331–343. doi: 10.1016/s0306-4522(97)00208-x. [DOI] [PubMed] [Google Scholar]
- Gioanni Y, Rougeot C, Clarke PB, Lepouse C, Thierry AM, Vidal C. Nicotinic receptors in the rat prefrontal cortex: increase in glutamate release and facilitation of mediodorsal thalamo-cortical transmission. Eur J Neurosci. 1999;11:18–30. doi: 10.1046/j.1460-9568.1999.00403.x. [DOI] [PubMed] [Google Scholar]
- Gulledge AT, Stuart GJ. Cholinergic inhibition of neocortical pyramidal neurons. J Neurosci. 2005;25:10308–10320. doi: 10.1523/JNEUROSCI.2697-05.2005. [DOI] [PMC free article] [PubMed] [Google Scholar]
- Gupta A, Wang Y, Markram H. Organizing principles for a diversity of GABAergic interneurons and synapses in the neocortex. Science. 2000;287:273–278. doi: 10.1126/science.287.5451.273. [DOI] [PubMed] [Google Scholar]
- Hahn M, Hahn SL, Stone DM, Joh TH. Cloning of the rat gene encoding choline acetyltransferase, a cholinergic neuron-specific marker. Proc Natl Acad Sci USA. 1992;89:4387–4391. doi: 10.1073/pnas.89.10.4387. [DOI] [PMC free article] [PubMed] [Google Scholar]
- Hasselmo ME, Anderson BP, Bower JM. Cholinergic modulation of cortical associative memory function. J Neurophysiol. 1992;67:1230–1246. doi: 10.1152/jn.1992.67.5.1230. [DOI] [PubMed] [Google Scholar]
- Houser CR, Crawford GD, Salvaterra PM, Vaughn JE. Immunocytochemical localization of choline acetyltransferase in rat cerebral cortex: a study of cholinergic neurons and synapses. J Comp Neurol. 1985;234:17–34. doi: 10.1002/cne.902340103. [DOI] [PubMed] [Google Scholar]
- Kawaguchi Y. Selective cholinergic modulation of cortical GABAergic cell subtypes. J Neurophysiol. 1997;78:1743–1747. doi: 10.1152/jn.1997.78.3.1743. [DOI] [PubMed] [Google Scholar]
- Kawaguchi Y, Kubota Y. Physiological and morphological identification of somatostatin- or vasoactive intestinal polypeptide-containing cells among GABAergic cell subtypes in rat frontal cortex. J Neurosci. 1996;16:2701–2715. doi: 10.1523/JNEUROSCI.16-08-02701.1996. [DOI] [PMC free article] [PubMed] [Google Scholar]
- Kosaka T, Tauchi M, Dahl JL. Cholinergic neurons containing GABA-like and/or glutamic acid decarboxylase-like immunoreactivities in various brain regions of the rat. Exp Brain Res. 1988;70:605–617. doi: 10.1007/BF00247609. [DOI] [PubMed] [Google Scholar]
- Krnjevic K, Pumain R, Renaud L. The mechanism of excitation by acetylcholine in the cerebral cortex. J Physiol (Lond) 1971;215:247–268. doi: 10.1113/jphysiol.1971.sp009467. [DOI] [PMC free article] [PubMed] [Google Scholar]
- Kuczewski N, Aztiria E, Gautam D, Wess J, Domenici L. Acetylcholine modulates cortical synaptic transmission via different muscarinic receptors, as studied with receptor knockout mice. J Physiol (Lond) 2005;566:907–919. doi: 10.1113/jphysiol.2005.089987. [DOI] [PMC free article] [PubMed] [Google Scholar]
- Levey AI, Wainer BH, Rye DB, Mufson EJ, Mesulam MM. Choline acetyltransferase-immunoreactive neurons intrinsic to rodent cortex and distinction from acetylcholinesterase-positive neurons. Neuroscience. 1984;13:341–353. doi: 10.1016/0306-4522(84)90234-3. [DOI] [PubMed] [Google Scholar]
- Lopez E, Arce C, Vicente S, Oset-Gasque MJ, Gonzalez MP. Nicotinic receptors mediate the release of amino acid neurotransmitters in cultured cortical neurons. Cereb Cortex. 2001;11:158–163. doi: 10.1093/cercor/11.2.158. [DOI] [PubMed] [Google Scholar]
- Lucas-Meunier E, Fossier P, Baux G, Amar M. Cholinergic modulation of the cortical neuronal network. Pflügers Arch. 2003;446:17–29. doi: 10.1007/s00424-002-0999-2. [DOI] [PubMed] [Google Scholar]
- Markram H, Toledo-Rodriguez M, Wang Y, Gupta A, Silberberg G, Wu C. Interneurons of the neocortical inhibitory system. Nat Rev Neurosci. 2004;5:793–807. doi: 10.1038/nrn1519. [DOI] [PubMed] [Google Scholar]
- McCormick DA. Cellular mechanisms underlying cholinergic and noradrenergic modulation of neuronal firing mode in the cat and guinea pig dorsal lateral geniculate nucleus. J Neurosci. 1992;12:278–289. doi: 10.1523/JNEUROSCI.12-01-00278.1992. [DOI] [PMC free article] [PubMed] [Google Scholar]
- McCormick DA, Prince DA. Mechanisms of action of acetylcholine in the guinea-pig cerebral cortex in vitro. J Physiol (Lond) 1986;375:169–194. doi: 10.1113/jphysiol.1986.sp016112. [DOI] [PMC free article] [PubMed] [Google Scholar]
- McGehee DS. Nicotinic receptors and hippocampal synaptic plasticity… it's all in the timing. Trends Neurosci. 2002;25:171–172. doi: 10.1016/s0166-2236(00)02127-5. [DOI] [PubMed] [Google Scholar]
- McGehee DS, Heath MJ, Gelber S, Devay P, Role LW. Nicotine enhancement of fast excitatory synaptic transmission in CNS by presynaptic receptors. Science. 1995;269:1692–1696. doi: 10.1126/science.7569895. [DOI] [PubMed] [Google Scholar]
- Mechawar N, Cozzari C, Descarries L. Cholinergic innervation in adult rat cerebral cortex: a quantitative immunocytochemical description. J Comp Neurol. 2000;428:305–318. doi: 10.1002/1096-9861(20001211)428:2<305::aid-cne9>3.0.co;2-y. [DOI] [PubMed] [Google Scholar]
- Mesulam MM, Mufson EJ, Levey AI, Wainer BH. Cholinergic innervation of cortex by the basal forebrain: cytochemistry and cortical connections of the septal area, diagonal band nuclei, nucleus basalis (substantia innominata), and hypothalamus in the rhesus monkey. J Comp Neurol. 1983a;214:170–197. doi: 10.1002/cne.902140206. [DOI] [PubMed] [Google Scholar]
- Mesulam MM, Mufson EJ, Wainer BH, Levey AI. Central cholinergic pathways in the rat: an overview based on an alternative nomenclature (Ch1-Ch6) Neuroscience. 1983b;10:1185–1201. doi: 10.1016/0306-4522(83)90108-2. [DOI] [PubMed] [Google Scholar]
- Miettinen RA, Kalesnykas G, Koivisto EH. Estimation of the total number of cholinergic neurons containing estrogen receptor-alpha in the rat basal forebrain. J Histochem Cytochem. 2002;50:891–902. doi: 10.1177/002215540205000703. [DOI] [PubMed] [Google Scholar]
- Porter JT, Cauli B, Staiger JF, Lambolez B, Rossier J, Audinat E. Properties of bipolar VIPergic interneurons and their excitation by pyramidal neurons in the rat neocortex. Eur J Neurosci. 1998;10:3617–3628. doi: 10.1046/j.1460-9568.1998.00367.x. [DOI] [PubMed] [Google Scholar]
- Porter JT, Cauli B, Tsuzuki K, Lambolez B, Rossier J, Audinat E. Selective excitation of subtypes of neocortical interneurons by nicotinic receptors. J Neurosci. 1999;19:5228–5235. doi: 10.1523/JNEUROSCI.19-13-05228.1999. [DOI] [PMC free article] [PubMed] [Google Scholar]
- Radcliffe KA, Fisher JL, Gray R, Dani JA. Nicotinic modulation of glutamate and GABA synaptic transmission of hippocampal neurons. Ann NY Acad Sci. 1999;868:591–610. doi: 10.1111/j.1749-6632.1999.tb11332.x. [DOI] [PubMed] [Google Scholar]
- Roerig B, Nelson DA, Katz LC. Fast synaptic signaling by nicotinic acetylcholine and serotonin 5-HT3 receptors in developing visual cortex. J Neurosci. 1997;17:8353–8362. doi: 10.1523/JNEUROSCI.17-21-08353.1997. [DOI] [PMC free article] [PubMed] [Google Scholar]
- Vidal C, Changeux JP. Nicotinic and muscarinic modulations of excitatory synaptic transmission in the rat prefrontal cortex in vitro. Neuroscience. 1993;56:23–32. doi: 10.1016/0306-4522(93)90558-w. [DOI] [PubMed] [Google Scholar]
- Voytko ML, Olton DS, Richardson RT, Gorman LK, Tobin JR, Price DL. Basal forebrain lesions in monkeys disrupt attention but not learning and memory. J Neurosci. 1994;14:167–186. doi: 10.1523/JNEUROSCI.14-01-00167.1994. [DOI] [PMC free article] [PubMed] [Google Scholar]
- Wonnacott S. Presynaptic nicotinic ACh receptors. Trends Neurosci. 1997;20:92–98. doi: 10.1016/s0166-2236(96)10073-4. [DOI] [PubMed] [Google Scholar]
- Wonnacott S, Irons J, Rapier C, Thorne B, Lunt GG. Presynaptic modulation of transmitter release by nicotinic receptors. Prog Brain Res. 1989;79:157–163. doi: 10.1016/s0079-6123(08)62475-9. [DOI] [PubMed] [Google Scholar]
- Xiang Z, Huguenard JR, Prince DA. Cholinergic switching within neocortical inhibitory networks. Science. 1998;281:985–988. doi: 10.1126/science.281.5379.985. [DOI] [PubMed] [Google Scholar]
- Yang XW, Model P, Heintz N. Homologous recombination based modification in Escherichia coli and germline transmission in transgenic mice of a bacterial artificial chromosome. Nat Biotechnol. 1997;15:859–865. doi: 10.1038/nbt0997-859. [DOI] [PubMed] [Google Scholar]