Abstract
The brain is spontaneously active even in the absence of external input. This ongoing background activity impacts neural information processing. We used functional multineuron calcium imaging (fMCI) to analyze the net structure of spontaneous CA3 network activity in hippocampal slice cultures loaded with Oregon Green 488 BAPTA-1 using a spinning disk confocal microscope (10–30 frames/s). Principal component analysis revealed that network states, defined by active cell ensembles, were stable but heterogenous and discrete. These states were stabilized through synaptic activity and maintained against external perturbations. A few discrete states emerged during our observation period of up to 30 min. Networks tended to stay in a single state for tens of seconds and then suddenly jump to a new state. After a state transition, the old state was rarely, if ever, revisited by the network during our observation period. This temporal profile of state transitions could not be simulated by a hidden Markov model, indicating that the state dynamics is nonrandomly organized. Within each state, the pattern of network activity tended to stabilize in a specific configuration. Neither maintenance nor transition of the network states required NMDA receptor activity. These findings suggest that the network states are metastable, rather than multistable, and might be governed by local attractor-like dynamics. The fMCI data analyzed here are available at http://hippocampus.jp/data/
Keywords: calcium imaging, spontaneous activity, action potential, attractor, network, microcircuit
Introduction
Most neuronal activity is internally generated and not directly linked to environmental input (Fiser et al., 2004). The spontaneous activity actively contributes to network development (Penn and Shatz, 1999; Zhang and Poo, 2001), representation of sensory stimuli (Kenet et al., 2003; MacLean et al., 2005), information processing (Pare et al., 1998; Anderson et al., 2000; Petersen et al., 2003; Shu et al., 2003), and trial-to-trial variability of neural (Arieli et al., 1996; Azouz and Gray, 1999; Kisley and Gerstein, 1999; Fox et al., 2005; Sasaki et al., 2006) and behavioral responses (Briggman et al., 2005; Otten et al., 2006). Spontaneous activity in brain slice preparations purely reflects the intrinsic properties of local circuits and individual neurons and hence allows for the investigation of the internal dynamics of neuronal networks (Sanchez-Vives and McCormick, 2000; Beggs and Plenz, 2003, 2004; Shu et al., 2003; Stewart and Plenz, 2006). Previous studies using functional multineuron Ca2+ imaging (fMCI) to probe action potentials with single-cell resolution revealed that spontaneous network activity is nonrandomly structured (Mao et al., 2001; Cossart et al., 2003; Ikegaya et al., 2004; MacLean et al., 2005). In these studies, however, activity was monitored for only a few minutes, and thus, little is known about long-term dynamics.
There are ∼300,000 pyramidal cells in the rat CA3 pyramidal cell layer in vivo, which constitutes a huge autoassociative network. On average, each pyramidal cell projects to ∼6000 other pyramidal cells, a significant portion of which are located within a radius of only a few millimeters (Amaral et al., 1990). Thus, the probability that two CA3 pyramidal cells located within 500 μm of each other are synaptically connected is ∼10–25% (Gomez-Di Cesare et al., 1997). This probability, however, is extremely low in acute slice preparations because the slicing procedure cuts CA3 associational fibers extending into the longitudinal axis of the hippocampus. Our previous study demonstrated that, when slices are organotypically cultured, ∼20% of the cell pairs within 300 μm have monosynaptic connections, suggesting that axonal reorganization restores the complexity of a CA3 recurrent network to a realistic extent (Fujisawa et al., 2006). In the present study, therefore, we used hippocampal slice cultures to investigate spontaneous activity generated by a recurrent neural circuit. Hippocampal slice cultures were bulk loaded with Ca2+ fluorophores, and spontaneous activity was recorded from individual CA3 neurons for up to 30 min. Our simple method for taming the entity of large-scale network activity revealed that the global pattern of spontaneous activity jumps between discrete states over time.
Materials and Methods
Materials.
Oregon Green 488 BAPTA 1-AM (OGB-1) and Pluronic F-127 were obtained from Invitrogen (Carlsbad, CA). Cremophor EL, d,l-2-amino-5-phosphonopentanoic acid (AP-5), 6-cyano-7-nitroquinoxoxaline-2,3-dione (CNQX), picrotoxin, and sulfinpyrazone were purchased from Sigma (St. Louis, MO). The antagonists were dissolved in double-distilled water to make 1000× stock solutions. The stock solutions were stored at −20°C and diluted immediately before use. Drugs were bath applied.
Slice preparations.
Hippocampal slice cultures were prepared from postnatal day 7 Wistar/ST rats (SLC, Shizuoka, Japan) as described previously (Yamamoto et al., 1989; Stoppini et al., 1991), according to the National Institutes of Health guidelines for laboratory animal care and safety. Briefly, rat pups were chilled, and the brains were removed and horizontally cut into 300-μm-thick slices using a DTK-1500 vibratome (Dosaka, Kyoto, Japan) in aerated, ice-cold Gey's balanced salt solution (Invitrogen, Gaithersburg, MD) supplemented with 25 mm glucose. Entorhino-hippocampal stumps were cultivated on Millicell-CM membranes (Millipore, Bedford, MA). Cultures were fed 1 ml of 50% minimal essential medium, 25% HBSS (Invitrogen), 25% horse serum (Cell Culture Laboratory, Cleveland, OH), and antibiotics in a humidified incubator at 37°C in 5% CO2. The medium was changed every 3.5 d.
Functional multineuron Ca2+ imaging.
On days 7–14 in vitro, slices were washed three times with oxygenated artificial CSF (ACSF) consisting of the following (in mm): 127 NaCl, 26 NaHCO3, 1.5 KCl, 1.24 KH2PO4, 1.4 MgSO4, 2.4 CaCl2, and 10 glucose. Slices were transferred into a 35 mm dish filled with 2 ml of dye solution and incubated for 1 h in a humidified incubator at 37°C in 5% CO2 (Sasaki et al., 2006). The dye solution was ACSF containing 10 μl of 0.1% OGB-1/DMSO, 2 μl of 10% Pluronic F-127/DMSO, 2 μl of 5% Cremophor EL/DMSO, and 2 μl of 100 mm sulfinpyrazone/DMSO. After being washed, slices were incubated at room temperature for at least 30 min, mounted in a recording chamber, and perfused with modified ACSF at 32°C to facilitate spontaneous activity. The modified ACSF consisted of the following (in mm): 127 NaCl, 26 NaHCO3, 3.3 KCl, 1.24 KH2PO4, 1.0 MgSO4, 1.0 CaCl2, and 10 glucose (Sanchez-Vives and McCormick, 2000). In some experiments, slices were perfused with culture medium (67% minimal essential medium and 33% HBSS) to achieve a more physiologic culture environment. After 10 min, we began to image Ca2+ signals evoked by spontaneous hippocampal CA3 neuron activity. Images (653 × 492 pixels = 383 × 289 μm, 16-bit intensity) were captured at 10–30 frames/s with Nipkow disk confocal microscopes (CSU10; Yokogawa Electric, Tokyo, Japan), cooled CCD cameras [iXon DV885 (Andor, Belfast, UK); Cascade 512B/F (Roper Scientific, Tucson, AZ)], upright microscopes [ECLIPSE FN1 (Nikon, Tokyo, Japan); AxioSkop2 (Zeiss, Oberkochen, Germany)], water-immersion objectives [16×, 0.80 numerical aperture (NA), CFI75LWD16×W (Nikon); 20×, 0.5 NA, Achroplan (Zeiss)], and MetaMorph software (Molecular Devices, Union City, CA). Fluorophores were excited at 488 nm with an argon–krypton laser (5–10 mW, 641-YB-A01; Melles Griot, Carlsbad, CA) and visualized with a 507 nm long-pass emission filter. Slices with epilepsy-like (or ripple-like) spontaneous synchronized activity were not used in the following analysis. In some experiments, glass pipettes were filled with ACSF and placed in the stratum granulosum to activate the mossy fiber pathway. The stimulation intensity was adjusted to induce ∼20% of the CA3 neurons to fire (50 μs, 40–120 μA).
Event onset times were reconstructed from the onsets of Ca2+ transients with custom-written software in Microsoft (Seattle, WA) Visual Basic (Ikegaya et al., 2004). For each cell, the fluorescence change ΔF/F was calculated as (F1 − F0)/F0, where F1 is fluorescence intensity at any time point, and F0 is the average baseline across 10 s before and after the time point. Spike-triggered Ca2+ signals were semiautomatically detected with the criteria being a Ca2+ transient with a >3% amplitude, >3.5%/s maximal first derivative (Δt = 0.7 s), and a 1-to-2-frame peak latency after the onset. The signals were then inspected manually to remove noise detected in error.
Electrophysiological recordings.
Loose patch-clamp recordings were obtained from CA1 pyramidal cells with an Axopatch 700B amplifier (Molecular Devices). Borosilicate glass pipettes (4–9 MΩ) were filled with ACSF. Signals were low-pass filtered at 1–2 kHz, digitized at 20 kHz, and analyzed with pClamp 9.2 software (Molecular Devices).
Immunohistochemistry.
After Ca2+ imaging, the cultures were fixed in 4% paraformaldehyde in 0.1 m PBS and permeabilized with 0.3% Triton X-100 for 60 min. Nonspecific antibody binding was blocked by 60 min incubation with 2% goat serum at 4°C. The slices were stained with a primary mouse monoclonal antibody against neuronal-specific nuclear protein (NeuN) (1:500, MAB377; Chemicon, Temecula, CA) overnight at 4°C and with secondary anti-mouse IgG Alexa-594 (1:500) (A-11032; Invitrogen) for 3 h at room temperature and imaged with a Nipkow disk confocal microscope.
Multineuronal activity analysis.
Raster plots were binned every 1–50 s, and spike activity onsets of individual neurons were counted in each bin to construct a set of the N-dimension vectors g⃗1, g⃗2, …, g⃗T, where N and T denote the total numbers of neurons and bins, respectively (e.g., T = 120 for a 20 min period with a 10 s bin size). This vector series represents a time change in the spatiotemporal pattern (i.e., active cell sets and activity levels) of network activity. We defined the similarity si,j between g⃗i and g⃗j as their normalized dot product:
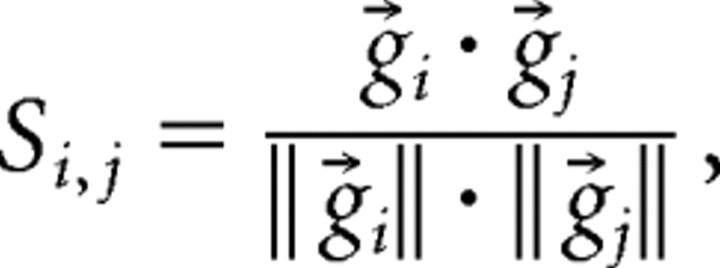 |
which is equivalent to the cosine of the angle between g⃗i and g⃗j, having a value between 0 and 1 (Schreiber et al., 2003; Sasaki et al., 2006).
We also inspected the vector series in a dimensional space reduced by principal component analysis (PCA) (Joliffe, 1986). Based on the locations of data points in a principal component (PC) coordinate system, g⃗ was categorized into one of the clusters defined by the fuzzy K-means algorithm, in which a cluster validity measure, the Dunn index, was used to find the most appropriate number of clusters (Bezdek et al., 1997).
The cluster that g⃗i belongs to is referred to here as the network state at time i. The stability of the state is reflected in the density of data points in the PC coordinate. Based on statistical physics, the normalized density (or probability P) is ideally described by the Fokker–Planck equation as a function of space x⃗ and time t:
 |
where kB is Boltzmann's constant, U is potential energy, and T is temperature (Risken, 1989). In a short timescale, network dynamics can be practically approximated as an equilibrium state (see below). For a limited time, therefore,
 |
Assuming that T is constant, we obtain the following from Equations 1 and 2:
Thus,
 |
in which Z is a normalization constant (or partition function). Incidentally, Equations 3 is equivalent to the Maxwell–Boltzmann distribution. Therefore, we can estimate U as follows:
 |
where a ∝ b indicates that a is proportional to b. We used this equation to evaluate the stability of a network state.
Measurement of cell viability.
Cell viability was determined by the 3-(4,5-dimethylthiazol-2-yl)-2,5-diphenyltetrazolium bromide (MTT) reduction assay. MTT is a yellow water-soluble tetrazolium salt. This dye is converted to water-insoluble purple formazan during reductive cleavage of its tetrazolium ring by the succinate dehydrogenase system of active mitochondria. Thus, the amount of formazan formed can be determined spectrophotometrically and serves as an estimate of mitochondrial activity and hence the viability of living cells in the sample (Denizot and Lang, 1986). Cultured slices were loaded with OGB-1 and exposed to a laser (10 mW at 488 nm) for 30 min. As a positive control experiment, some cultures were immersed in glucose-free, non-oxygenated PBS for 4 h. The slices were then incubated with 0.5 mg/ml MTT for 1 h at 37°C and solubilized by 50% dimethylformamide and 20% SDS, pH 4.7. The amount of MTT formazan produced was measured as its absorbance at a test wavelength of 570 nm versus a reference wavelength of 655 nm.
We report the means ± SDs for all averaged measurements.
Results
Optical imaging of multineuronal activity
Hippocampal slice cultures were loaded with OGB-1, and their fluorescence images were compared with post hoc immunostaining against NeuN, a neuron-specific marker (Fig. 1A). More than 90% of CA3 neurons were loaded with OGB-1. Non-neuronal cells were also loaded with the fluorophores, but they had smaller somata and higher basal fluorescence intensity and were therefore distinguishable from neurons (error detection of ∼3%) (Fig. 1B); that is, neurons could be identified in OGB-1 images with ∼97% confidence.
Figure 1.
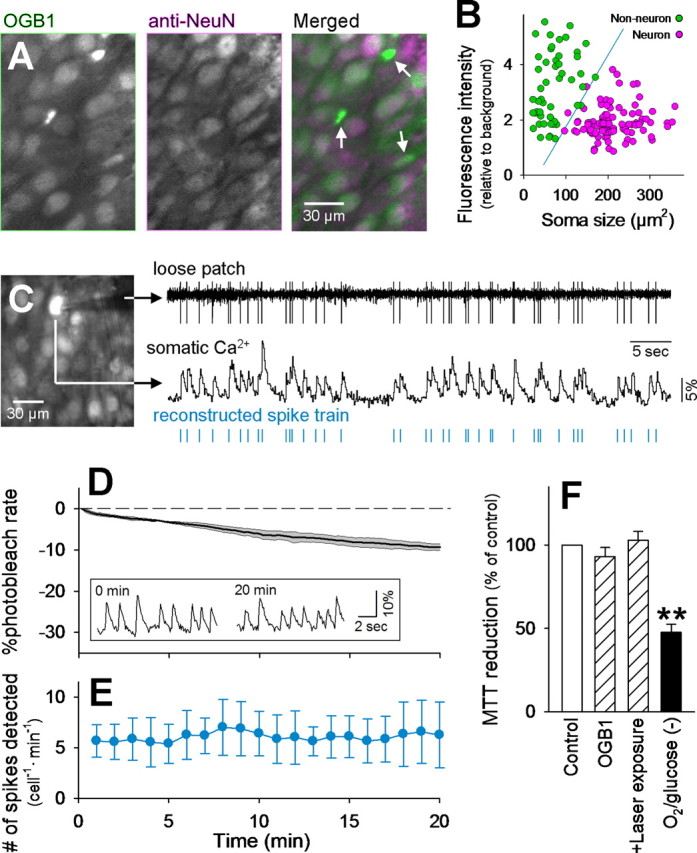
Optical long-time recording of neuronal action potentials with OGB-1. A, An fMCI photograph obtained from the CA3 pyramidal cell layer of a hippocampal slice culture bulk-loaded with OGB-1 (left) and post hoc immunostaining against NeuN (middle) in the same field. Non-neuronal cells are marked by arrows in the merged image (right). B, Distribution of the soma size and baseline fluorescence intensity of OGB-1-loaded cells. Neurons and non-neuronal cells are separable by the blue line that was determined using linear discriminant analysis. The failure rate was <3%. C, Simultaneous loose patch-clamp recording and Ca2+ imaging. The monitored cell is shown by arrows in the confocal image (left). The timing of ∼80% of spikes could be reconstructed from the onsets of individual Ca2+ transients (right). This movie is published in part as supplemental movie 1 (available at www.jneurosci.org as supplemental material). D, Time course of photobleaching. The laser shutter was kept open for 20 min, and the mean fluorescence intensity of the whole imaged field was measured to determine how fast the OGB-1 signal decreased during imaging. The photobleaching rate was ∼0.5%/min, and this rate did not differ among movies. Means and SD are shown as a thick line and shaded area, respectively (n = 6). The inset indicates that the Ca2+ transients of a cell were clearly separable from basal noise immediately (left) and 20 min (right) after the beginning of imaging. E, The number of spikes reconstructed by fMCI was almost invariant during the 20 min period, indicating that detection of spike activity was stable for at least this period. F, MTT reduction of intact (Control) or OGB-1-loaded (OGB-1) slices exposed to laser for 30 min (+Laser exposure). No significant photodamage was observed. As a positive control, some slices were maintained in the absence of oxygen and glucose for 4 h [O2/glucose(−)]. **p < 0.01, Tukey's test after ANOVA. Data are means ± SD of four to six slices.
Simultaneous loose patch-clamp recording and fMCI revealed that action potentials were reflected in somatic Ca2+ transients (Fig. 1C) (supplemental movie 1, available at www.jneurosci.org as supplemental material). Because of slow [Ca2+]i decays (time constant of 300–400 ms) and a low rate of scan speed (10–30 Hz), individual spikes emitted at higher firing rates (>5 Hz) were inseparable, and thus our datasets consist of the onset of each burst train or a single spike (Fig. 1C, bottom).
Glial Ca2+ waves usually have much slower kinetics and higher amplitudes than spike-triggered neuronal Ca2+ transients (Ikegaya et al., 2005). We thus discarded the data of cells that displayed slow Ca2+ transients with a more than two-frame peak latency. Using this procedure, ∼10% of the cells were discarded. Therefore, our data were only minimally contaminated with non-neuronal signals.
The mean photobleaching rate was 0.46 ± 0.04%/min (Fig. 1D). Spontaneous Ca2+ transients were evident even after 20 min, and the overall frequency of reconstructed spikes did not decrease during the recording epoch (Fig. 1E). In addition, cell viability, as assessed by MTT reduction activity, of OGB-1-loaded slices was not reduced after 30 min exposure to the laser (Fig. 1F). Thus, our fMCI technique is reliable, at least in the range of tens of minutes.
Network states defined by spontaneous activity
We imaged the CA3b subregions of 38 hippocampal slice cultures at 10–30 frames/s for 10–30 min. An example raster plot representing the spatiotemporal patterns of spontaneous activity is shown in Figure 2A. Unless otherwise specified, we show the analyzed data of this raster plot because we obtained similar results in all control movies.
Figure 2.
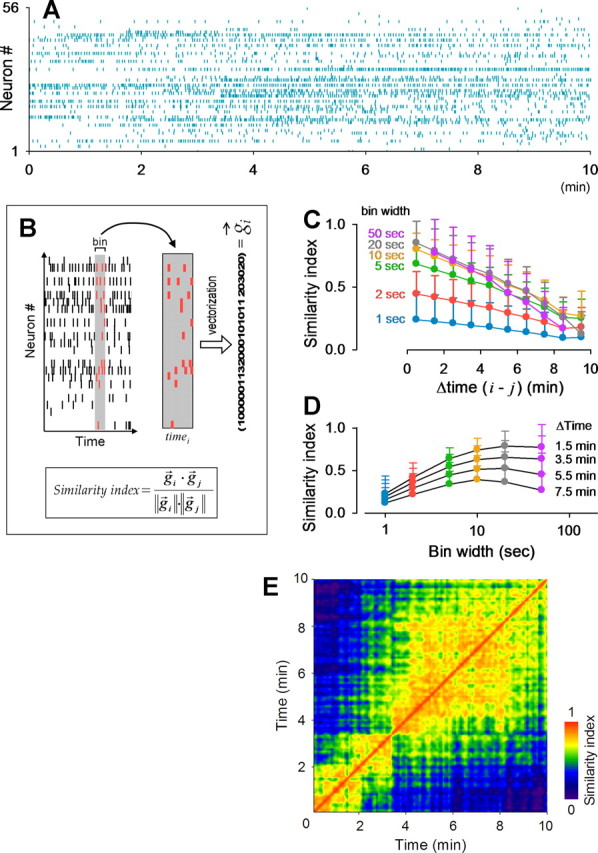
Sets of spontaneously active cells change over time. A, Example raster plot. Of 88 monitored cells, 56 cells were spontaneously active during our observation time. Each row represents a single cell, and each dot represents a single Ca2+ transient. B, Activities in a given time window (shaded area) were counted for each cell and converted to a vector, g⃗. The similarity index between times i and j is defined as g⃗i × g⃗j/‖g⃗i‖ × ‖g⃗j‖. C, Similarity indices decreased as the time difference between two vectors increased. Data were binned with different time windows (1–50 s) and pooled for all possible vector pairs. D, The same data as in C were plotted versus bin widths. E, Each similarity index is shown as a pseudocolored matrix for all possible pairs of 10 s time windows. Note the similarity indices seem to be discontinuously distributed in this matrix.
Each raster plot was transformed into a time series of g⃗ by sliding a 1–50 s time window along the time axis (Fig. 2B). The vector g⃗ represents the spatiotemporal weight of network activity, i.e., the set of active cells and their individual activity levels at a given time. We compared g⃗i and g⃗i (at times i and j, respectively) by computing a similarity index between them (Fig. 2B). The index was plotted versus the time difference |i − j | for all possible vector pairs (Fig. 2C). The vector similarity decreased as the time difference increased. The relative decay rate was ∼8%/min and almost independent of the bin width in the range of 10–50 s (Fig. 2C), indicating that the network activity patterns changed over time. Conversely, the absolute value of the similarity index increased as the bin size increased and reached a near-maximal steady state at a bin size of >10 s (Fig. 2D). In the following analysis, we thus analyzed 10 s binned vectors unless otherwise specified. To evaluate the temporal modulation of the similarity indices in more detail, they were plotted as a matrix for individual vector pairs (Fig. 2E). In this matrix, the similarity index occasionally showed relatively abrupt, discontinuous transitions at some time points, depicting cluster-like structures.
PCA is a data-reduction technique that linearly decomposes the data into a lower-dimensional set of new orthogonal vectors. We used PCA to relieve redundancies in the descriptions of network activity (Stopfer et al., 2003; Briggman et al., 2005) and tried to facilitate visualization of the global similarities and differences in a g⃗ series. The dimension that accounts for the single greatest portion of the total variance was termed PC1, and we adopted the top PCs that contributed to 70% of the total variance. On average, the first 7.6 ± 3.5 PCs (n = 15 slices) were required to meet this criterion. In the movie shown in Figure 2A, the first eight PCs reached 70% (Fig. 3A,C). Each PC is expressed as a linear combination (or eigenvector) of the observed neurons in the 56-dimensional dataset (Fig. 3A). We visualized the results, for illustration purposes, with the first two PCs and found that the time series of network activity depicted a trajectory-like structure (Fig. 3B).
Figure 3.
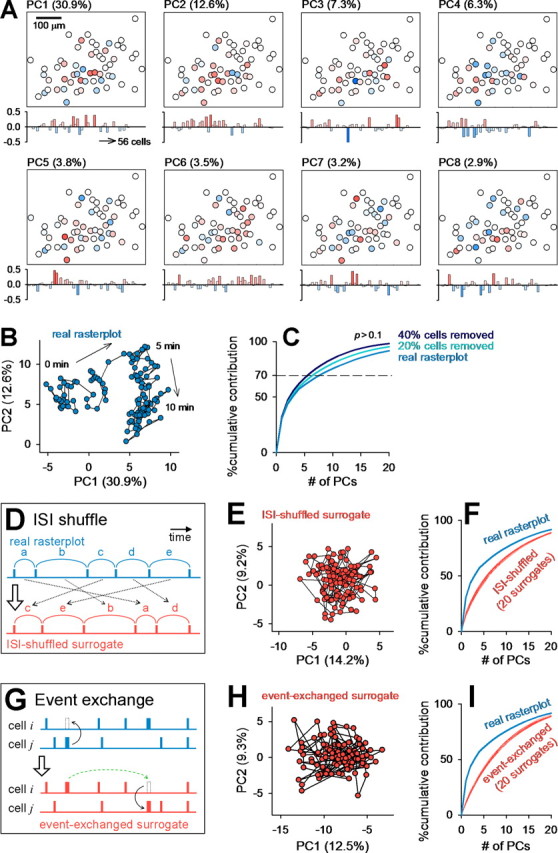
PCA-defined network states are nonrandomly organized. The raster plot shown in Figure 2A was analyzed. A, Cell maps (top) and pseudocolored eigenvectors (bottom) of the first eight PCs that accounted for >70% of the total variance. Values in the parentheses indicate contribution ratios to the total variance. B, Spatiotemporal patterns of spontaneous activity illustrated in the two-dimensional PC1–PC2 space. C, A portion (20–40%) of neurons were randomly selected and removed from the raster plot, and PCA was performed for the remaining neurons. This cell-ablation procedure did not significantly affect the contribution ratios of PCs. D, ISIs were transposed at random within cells to collapse temporal correlations between the events. E, PCA of a surrogate raster plot generated by the ISI-shuffling procedure. For this surrogate, we determined a new set of eigenvectors and depicted the data in a new PC coordinate. F, The contribution ratios of the original raster plot were higher than those of ISI-shuffled surrogates. Simulations were repeated 20 times, and all data are represented as red lines. G, A cell event was exchanged with a randomly selected event of another randomly selected cell, and this procedure was repeated for all events of all cells to randomize the raster plot while preserving both the activity levels of individual cells and the temporal correlation at the population level. H, PCA of a surrogate raster plot generated by the event-exchanging procedure. I, The real contribution ratios were higher than those of any of 20 event-exchanged surrogates.
To determine whether this structure can arise from a stochastic process, we created surrogate raster plots with two shuffle methods. First, the intersignal intervals (ISIs) were transposed at random within each cell to eliminate temporal correlations between cells (Fig. 3D). Second, each single event was exchanged between a pair of cells, maintaining their relative timing (Fig. 3G). The procedures were repeated for all Ca2+ transients. This randomization preserves event frequencies of individual cells and population modulation of event timings such as global synchronization. For each shuffled surrogate, we determined a new set of eigenvectors and plotted the data in a new PC coordinate. In both ISI-shuffled and event-exchanged surrogates, the trajectory-like structure disappeared (Fig. 3E,H), and the contribution ratios of PCs to the total variance were lower than those of the original raster plot (Fig. 3F,I). This implies that the dynamics of network states (i.e., data points in the PC coordinate) are more organized than expected by chance alone. We also performed the same analysis for different bin sizes (1–50 s); trajectory-like structures began to appear at a 5 s bin width, and the difference from surrogates became more evident for larger bins (supplemental Fig. 1, available at www.jneurosci.org as supplemental material).
To examine the robustness of these network dynamics, we performed “cell-ablation” simulations, in which we randomly selected 20–40% of the neurons and removed them from the raster plot. The contribution ratios were almost unchanged by cell ablation (Fig. 3C). These results suggest that the structures of network states are maintained by the global entity (not a specific fraction) of multineuronal activity.
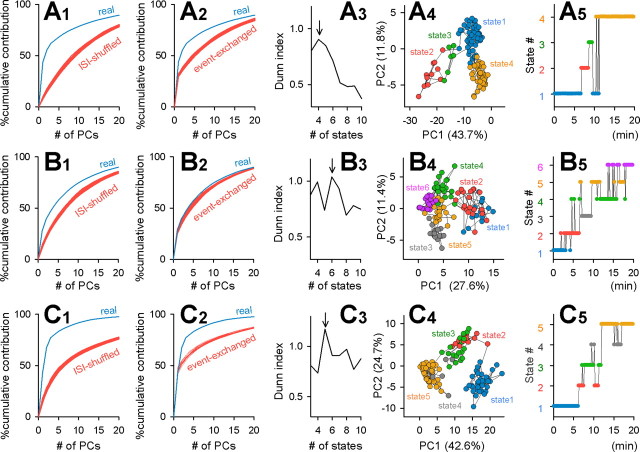
We next used the fuzzy K-means clustering algorithm to separate network states. The optimal number of groups was determined using the Dunn index (Fig. 4A). In the example movie, network states were most plausibly separated into four groups (Fig. 4A,B). The time course of changes in network states is shown in Figure 4C. On average, networks displayed 2.2 ± 0.8 states per 10 min (n = 15 movies). Without PCA, fuzzy K-means could not separate the vector data very well (data not shown; see also Fig. 2E). Thus, the combination of PCA, Dunn index, and fuzzy K-means provides a powerful tool for analyzing this type of high-dimensional data.
Figure 4.
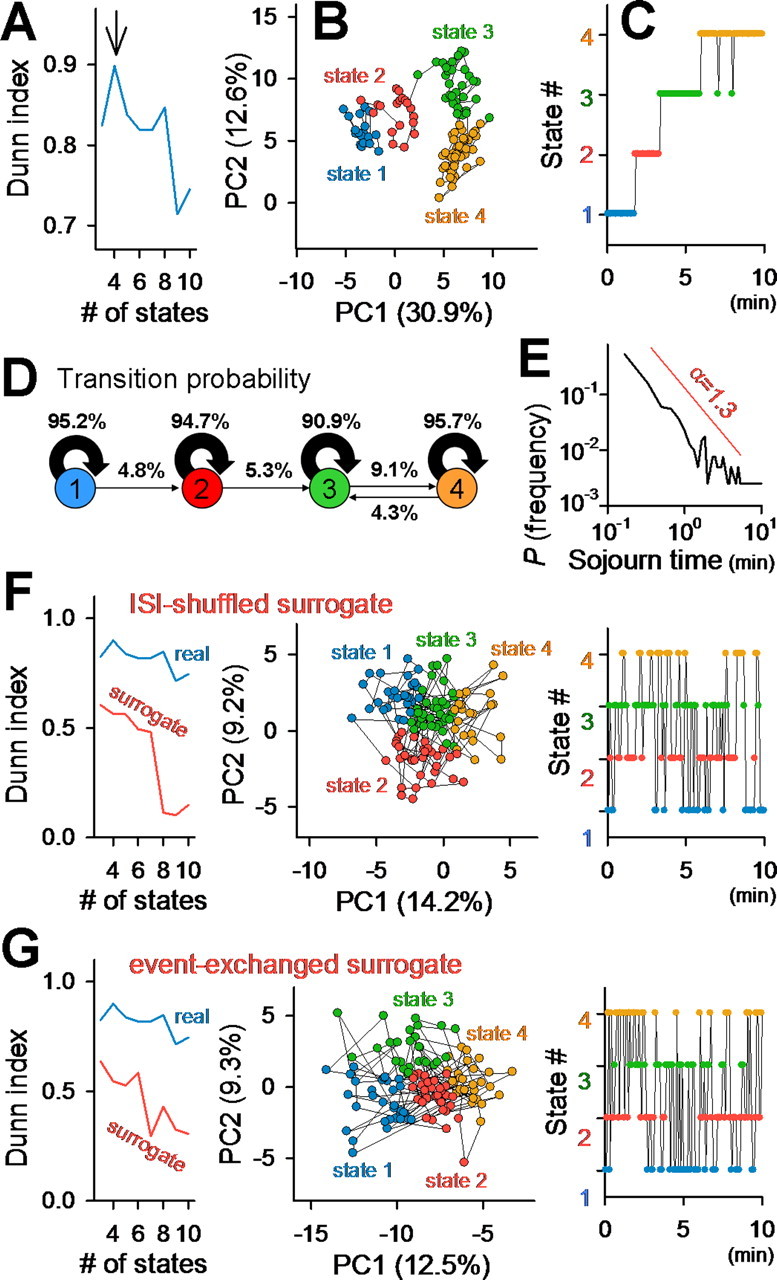
Network states are stable and diverse. Data shown in Figure 2A were analyzed except for E. A, Dunn index indicates the plausibility of separation (4 clusters, here). B, Data in the PC coordinate were divided into four discrete states with the fuzzy K-means algorithm. C, Time course of a shift in network states. D, Probabilities of state transitions between neighboring 10 s segments. E, Distribution of time spent for remaining in a single state showed a 1/timeα structure with α = 1.3. Data were collected from 15 slices. F, G, In ISI-shuffled (F) and event-exchanged (G) surrogates, Dunn indices were lower than those of the real data and not separable into stable states.
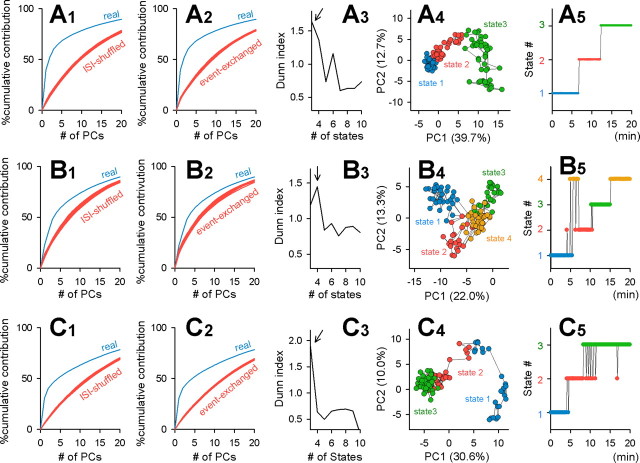
We calculated the probability of state transitions by comparing the states of two consecutive vectors g⃗i and g⃗i + 1, i.e., neighboring 10 s segments (Fig. 4D). The probability of remaining in the same state was much higher than that of drifting to another state. In other words, the network tended to maintain the same state as that of the previous 10 s period. Importantly, state transitions seemed to be unidirectional; that is, the states shifted up in the order of 1 → 2 → 3 → 4 and rarely returned to an earlier state. This trend was observed in all movies obtained (n = 15) (Fig. 5) and also in all slices perfused with culture medium instead of ACSF (n = 3) (supplemental Fig. 2, available at www.jneurosci.org as supplemental material). The quasi-unidirectional state transitions were evident even in the presence of 50 μm d,l-AP-5, an NMDA receptor antagonist (n = 6 slices) (Fig. 6). Thus, the state transitions were independent of NMDA receptor activity.
Figure 5.
Examples of other control movies. A–C, Contribution rates were significantly higher than those of ISI-shuffled (1) and event-exchanged (2) surrogates. Data were divided into the optimal number of clusters, determined by the Dunn index (3), with the fuzzy K-means algorithm (4). The time course of a change in network states (5) reveals that states tended to shift up to other states and drifted away from the original state.
Figure 6.
Neither maintenance nor transition of states requires NMDA receptor activity. Experiments were performed in the presence of 50 μm d,l-AP-5. For details, see the legend of Figure 5. Similar results were obtained in all six slices perfused with AP-5.
The durations for which the network stayed at a single state without transitions conformed to a power law distribution, i.e., showed a quasilinear relationship in a log–log coordinate (Fig. 4E) (n = 15 movies). Because the data format of Figure 4E can be interpreted as a transition probability map in the so-called hidden Markov model (Rabiner, 1989), we performed computer simulations by assuming a Markov process on the transition maps. The hidden Markov algorithm almost precisely reproduced the total residence time in each state, but it did not replicate individual sojourn times; that is, it did not produce a power-law distribution of sojourn times (n = 15 movies; data not shown). Thus, the state transitions observed here cannot be accounted for by a simple stochastic chain process.
In ISI-shuffled or event-exchanged surrogates, the Dunn indices were lower than that in the original raster plot (Fig. 4F,G). When they were forced to separate into four virtual clusters with the fuzzy K-means algorithm (because the original data had four states), they unstably jumped from cluster to cluster and did not remain in a single state for very long (Fig. 4F,G, right).
We next examined what determines the network states. The global excitability of a network was almost unchanged over time (Figs. 1E, 7A, bottom). Thus, we hypothesized that sets of active cells differed among states, yielding discrete states. The map of cells that were activated in each state is illustrated in Figure 7B. The percentage of cells that was commonly activated in two different states is shown in Figure 7C. As expected, different subsets of neurons were recruited in different states, although some cells were reused across states (“core” population). A hierarchically clustered dendrogram revealed cell groups that potentially contributed to network state dynamics (Fig. 7D).
Figure 7.
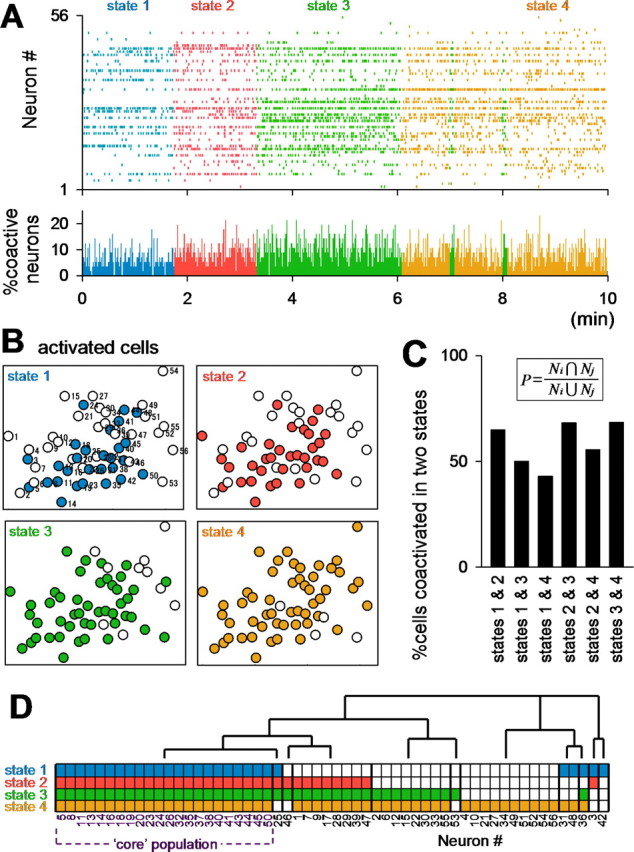
Different cell ensembles are involved in network states. Data of Figure 2A were analyzed. A, Colored raster plot. Each color indicates a different state. The bottom histogram represents the percentage of active cells at a given time (1 s bin). B, Maps of cells activated during each state. C, Overlap ratios of cells activated in two different states. The ratio is calculated by 100 × Ni + j/(Ni + Nj − Ni + j), where Ni and Nj indicate the total numbers of cells activated at states i and j, respectively, and Ni + j indicates the number of cells activated in both states. D, Hierarchical clustering of cells participating in each state reveals the existence of distinct neural cliques. Each small colored box indicates the state at which the cell was activated. Some cells fired specifically in one or a few specific state(s), whereas there also was a core population that was activated in all states.
To determine whether the states of spontaneous activity are maintained by network activity (i.e., synaptic input from surrounding neurons embedded in the network), fast synaptic transmission was blocked by applying application of a combination of 10 μm CNQX, a non-NMDA receptor antagonist, 50 μm d,l-AP-5, and 50 μm picrotoxin, a GABAA receptor antagonist. In the presence of this inhibitor mixture, spontaneous activity was reduced but did not completely disappear (Fig. 8A,B). Thus, some CA3 neurons were autonomously active, independent of synaptic input. As expected, such network-independent activity did not show an organized structure in the PC coordinate (Fig. 8C,D). The data were separated into two clusters using fuzzy K-means (i.e., state 3 and state 4) (Fig. 8B,D), but they were unstable compared with Figure 8, A and C.
Figure 8.
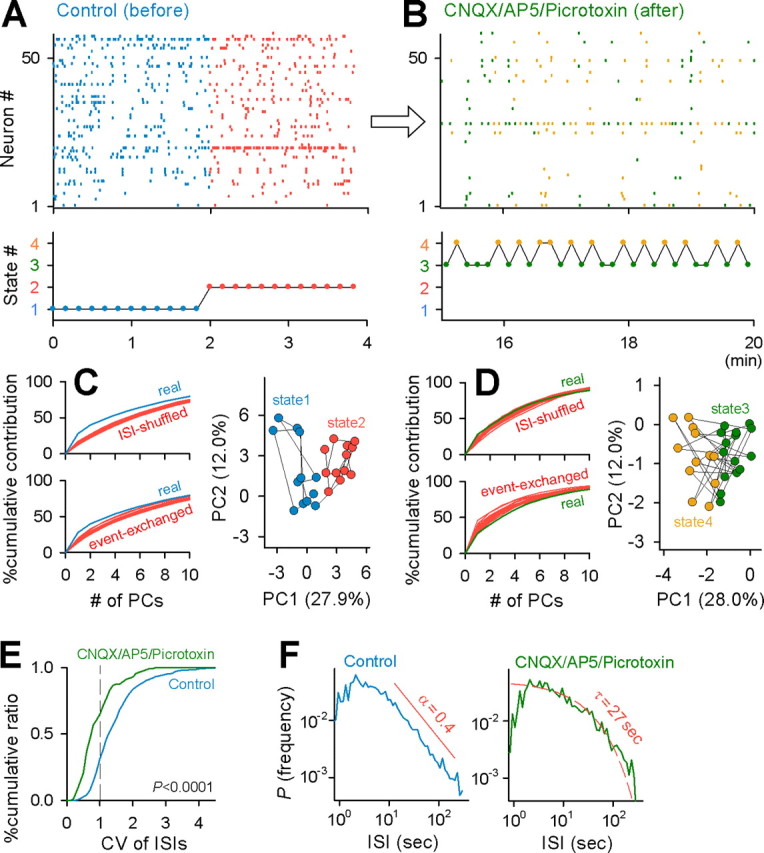
State stability depends on network activity. A, B, Representative raster plot (top) and the corresponding states (bottom) before (A, Control) and after perfusion with a combination of 10 μm CNQX, 50 μm AP-5, and 50 μm picrotoxin (B, CNQX/AP5/Picrotoxin). C, In the control period, the contribution ratios of the real data were higher than those of ISI-shuffled and event-exchanged surrogates (left), and the data were separated into two states in two-dimensional PC coordinates (right). D, In the presence of CNQX, AP-5, and picrotoxin, the contribution ratios were no longer different from chance (left), and there was no apparent stable state (right). E, Cumulative probability of the CV of ISIs in 558 cells in 15 control slices and 111 cells in 10 CNQX/AP-5/picrotoxin-treated slices. CV was significantly lower in the presence of CNQX, AP-5, and picrotoxin (p < 0.0001, Kolmogorov–Smirnov test). F, In controls, ISIs showed a power-law distribution with an exponent of α = 0.4, whereas in the presence of CNQX, AP-5, and picrotoxin, the ISI distribution was approximated by an exponential distribution with a decay constant of τ = 27 s.
The coefficient of variance (CV) of ISIs is defined as the SD σ divided by the mean μ of the ISI distribution in individual neurons, i.e., CV = σ/μ (Stevens and Zador, 1998). The CV value decreased after treatment with the inhibitor mixture (p < 0.0001, Kolmogorov–Smirnov test) (Fig. 8E). The average CV values were 1.56 ± 0.77 for controls (n = 558 cells in 15 slices) and 1.00 ± 0.54 for the inhibitor mixture (n = 111 cells in 10 slices). Because the average CV was >1 in control slices, ISIs could be nonrandomly patterned (note that CV = 1 for a random Poisson process). We thus plotted the distribution of ISIs in Figure 8F. In control slices, the ISI distribution had a power-law distribution. In the inhibitor mixture, the ISI distribution showed an exponential decay, suggesting a time-independent stochastic process.
Stability of network states
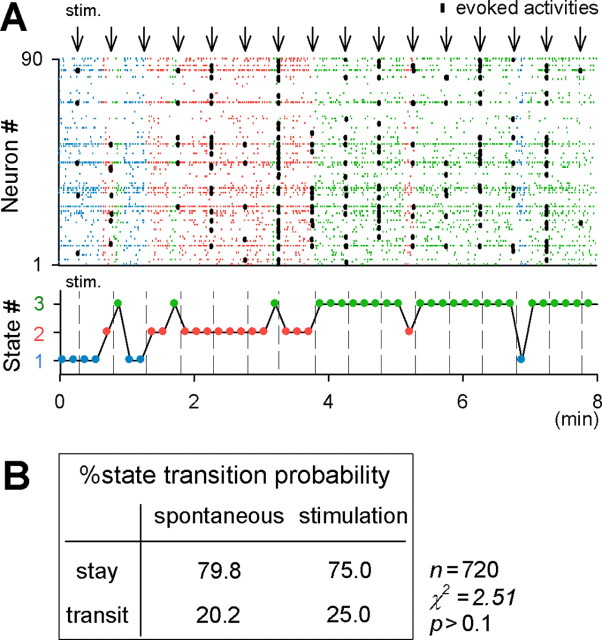
From a mathematical point of view, the stable state of an open system could represent an attractor, related to a local minimum in a potential energy function. To examine whether our network state was associated with an attractor, we delivered weak electric stimulation to the dentate granule cell layer. Because granule cells send mossy fiber axons to CA3 pyramidal cells and interneurons (Acsady et al., 1998), dentate stimulation applies an external perturbation to the CA3 network. If a state is linked to an attractor, the system will return to a particular stable configuration after receiving a slight perturbation. This was indeed true. The dentate stimulation elicited spike activities in a small fraction of CA3 neurons (Fig. 9A, thick black dots), but, in most cases, the network continued in the same state (Fig. 9A).
Figure 9.
Network states are robust to external perturbations. A, Weak stimulation of the dentate gyrus (arrows, every 30 s) evoked spikes in a CA3 network (black dots) but did not induce a state transition in most cases. Each color indicates a different state. Note that very strong stimulation often induces a change in sates (data not shown). B, Summary of the probability of spontaneous and stimulus-evoked state transitions. Stimulation did not induce state transitions with frequencies higher than the spontaneous transition level (p > 0.1; χ2 = 2.51; n = 240 stimuli in 6 slices).
At the same time, we noticed that the networks occasionally jumped to other states after stimulation (Fig. 9A). We thus calculated the probability of state transitions by collecting data from six slices that received stimulation (Fig. 9B). The probability that the state was different before and after a stimulus, i.e., the probability of stimulation-evoked state transitions, was 25.0% (n = 240 stimuli). This value was much lower than the probability that the network continued to stay in the same state (75.0%), indicating that network states are resistant to external perturbations. When states were compared between neighboring 10 s segments that were not interposed by stimulation (i.e., spontaneously occurring state transitions), the probability was 20.2% (n = 480 segment pairs), which was not significantly different from that of the evoked state transitions (p > 0.1; χ2 = 2.51) (Fig. 9B).
We next investigated the inner structures of network states. For each state, the centroid of data points (z⃗) was determined by
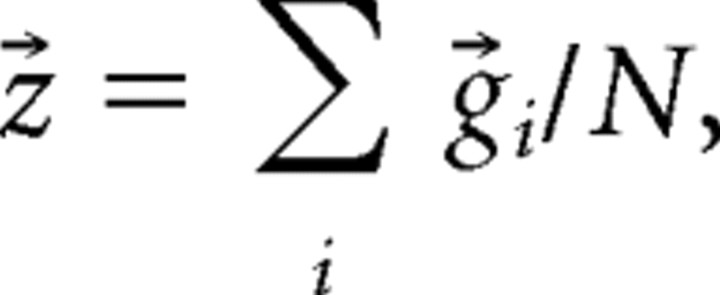 |
where g⃗ is a data vector in the PC space, and N is the number of g⃗i involved in the state. To facilitate data comparisons across states, the g⃗i trajectory relative to the centroid was normalized as r⃗i = (g⃗i − z⃗)/σ, where α represents the SD of the distance between g⃗ and z⃗, i.e.,
 |
such that the mean distance was 0 and the SD was 1 (Fig. 10A). To enhance computational accuracy, a 10 s time window was slid with 1 s steps along the time axis of a raster plot. We plotted the distributions of r⃗ and the angles θ between r⃗ and z⃗ as cosθ = r⃗ · z⃗/(|r⃗ | · | z⃗ |) (n = 61 states in 15 movies). We found that θ was almost uniformly distributed (Fig. 10C), whereas the r⃗ distribution seemed to be Gaussian (Fig. 10B); that is, r⃗ remained in the proximity of the centroid and did not stray far from it.
Figure 10.
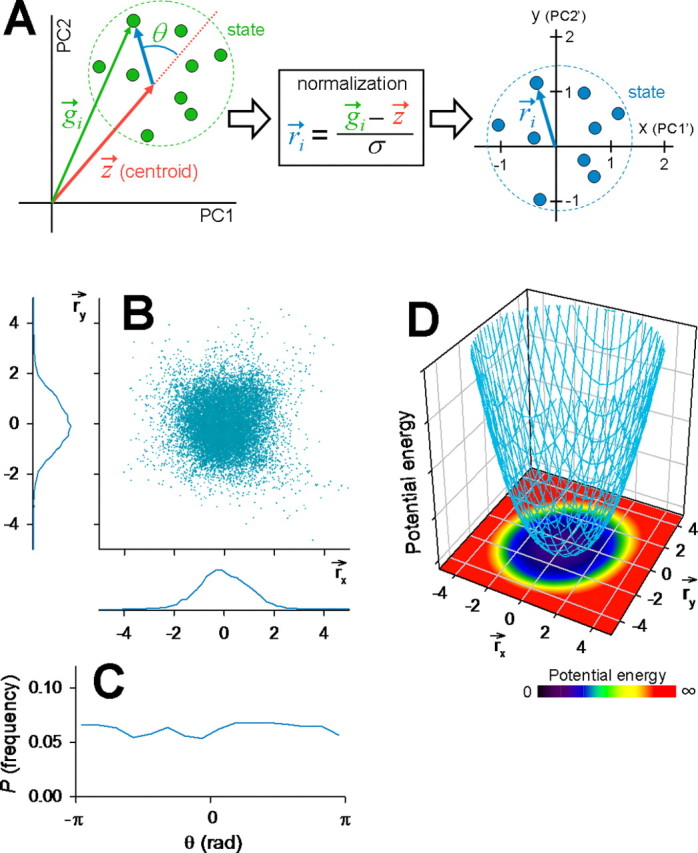
Internal structures and dynamics of network states. A, Schematic illustration for a normalization procedure to quantify network stability. The PC1–PC2 space (left) was transformed to a new plane coordinate (right). r⃗i is a normalized differential vector between an original data point (g⃗i) and the state centroid (z⃗). B, Scatter plots of r⃗i in a new plane (n = 15 slices). The bottom and left histograms show the distributions of r⃗x and r⃗y, respectively. C, Probability density of the angle (θ) between r⃗i and z⃗ in the PC coordinate system. D, Pseudocolored potential energy in the r⃗x versus r⃗y coordinate, which was calculated based on the density of r⃗i obtained from B (see Materials and Methods). The z-axis indicates a three-dimensional representation of this potential energy function (an arbitrary unit).
We sought to quantify this attractor-like stability of network states. As a fundamental result of statistical mechanics, the potential energy function U is given by U ∝ − log P, where P is the normalized density of the data point r⃗ (see Materials and Methods). For P obtained from Figure 10B, the potential energy U around a putative attractor is depicted in Figure 10D.
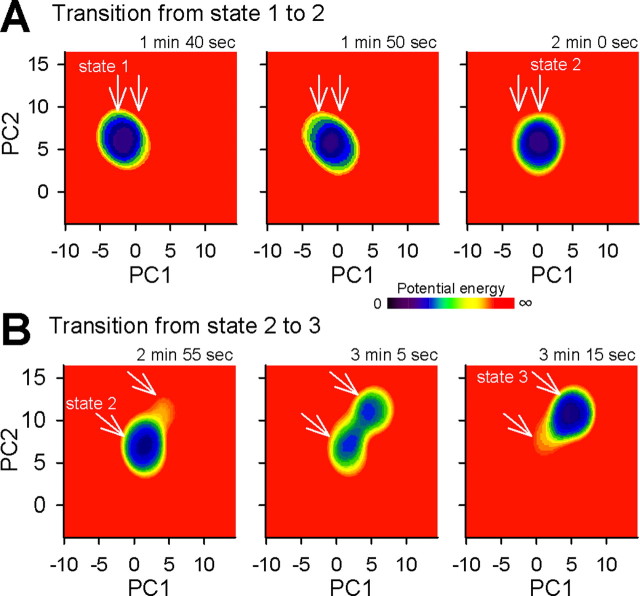
We then quantified the time-varying dynamics of network states (Fig. 11). The periods during the network stayed at a single state had a long-tailed distribution (Fig. 4E), but the mean residence time was calculated to be 41 s. During this residence time, the network state is considered to be approximately equilibrated, and, therefore, data for each 41 s epoch (i.e., from −20.5 to 20.5 s) were used to measure P. We present the whole time series of the example raster plot in supplemental movie 2 (available at www.jneurosci.org as supplemental material). Here, the U dynamics during the transitions from state 1 to 2 and from state 2 to 3 are shown in Figure 11, A and B, respectively. In both cases, the lowest energy points moved during the state transition; that is, the putative attractor was dynamic.
Figure 11.
Time-varying potential energy of network states. The raster plot shown in Figure 2A was analyzed. A, B, The low potential area (cold color) moved to a new locus during the transition from state 1 to 2 (A) and state 2 to 3 (B). See also supplemental movie 2 (available at www.jneurosci.org as supplemental material).
Discussion
Using a simple method with PCA and fuzzy K-means algorithm, we revealed that the internal states of spontaneous network activity are dynamic but locally stable, resulting in states that are heterogenous and discrete in nature.
Network states defined by active cell ensembles
To monitor the suprathreshold activity of a large population of neurons, we adopted fMCI, a functional imaging technique with multicell loading of the calcium fluorophore OGB-1. Compared with electrophysiologic single-unit or multiunit recordings, fMCI has some advantages, including the following: (1) simultaneous recordings from ∼100 neurons in a wide area (>0.1 mm2), (2) single-cell resolution (compared with in unit recordings, spike separation procedures are technically imperfect), (3) identifiable locations of neurons, and (4) detection of non-active neurons during the recording period. Unfortunately, the time resolution of fMCI is not very fast (at best 30 frames/s in this paper), so the fine temporal structure of spike dynamics cannot be investigated. Instead, we focused on the ensemble dynamics of active neurons by taking advantage of the outstanding spatial resolution of fMCI. Specifically, because the similarity index approached the maximum with a 10 s bin, our main analysis focused on the slow dynamics of ensemble structures of spontaneous network activities.
The similarity index of spontaneous activity decreased as the time interval between the compared vectors increased. This indicates that spontaneous activity drifted with time, engaging different cell subsets. Similar results have been reported in other brain regions in vitro and in vivo (Ikegaya et al., 2004; Kerr et al., 2005; MacLean et al., 2005). The possibility that this activity shift is attributable to photodamage caused by a long laser exposure is excluded for the following reasons. (1) The laser intensity used here (5–10 mW) was lower than that usually used in conventional confocal laser scanning microscopy (∼20 mW). In fact, the photobleaching rate was as slow as 0.5%/min (Wang et al., 2005), (2) the global level of spontaneous network activity did not change over time, and (3) the cell viability, as assessed by MTT reduction, did not decline during the imaging period.
The mean similarity index was gradually reduced at a rate of ∼8%/min. Importantly, however, data points in the PC coordinate were scattered in a few noncontiguous areas. This vector separation did not emerge through a stochastic process because ISI-shuffling and event-exchanging procedures collapsed this noncontiguous data structure. We thus conclude that spontaneous activity contains a series of stable states at the population level.
Attractor-like behavior of network states
A stable state of an open system could indicate a specific point toward which activity is attracted and eventually converges. More specifically, it is related to a local minimum in a potential energy function. Although experimental studies alone cannot conclusively demonstrate that the network states are directly linked to attractors, the fact that the network tended to return to the prestimulus activity state when spontaneous activities were perturbed by artificial electric stimulation is suggestive of the presence of attractor-like stable points.
It is also intriguing that, without external inputs, the network underwent a spontaneous change in global activity patterns. Once the network shifted to a new state, the earlier state was not stably revisited, at least during our observation periods. This shift did not require NMDA receptor activity, consistent with the space-selective “place cell” activity of hippocampal neurons, which is regarded as a stable cell-ensemble configuration that can develop independent of NMDA receptors (Kentros et al., 1998). Interestingly, the time interval of functional state transitions we described here ranged from a few seconds to minutes, approximately equal to the time required for establishing stable place-cell activities (Wills et al., 2005) and also approximately equal to the retention time of working memory in behaving animals and humans (Baddeley, 2003). Thus, this in vitro study might provide an insight into a fundamental feature of cortical memory traces.
Speculation on network dynamics
State transitions are theoretically achievable through two different modes. First, several stable points preexist in a potential energy function, and a network itinerates among them. Thus, a network state shows ergodic multistability. In this case, the potential function can be estimated by globally averaging the dynamics across time and space. Second, the potential function itself is variable, and the lowest energy point moves over time. In this case, the network is metastable, and, thus, any measurement cannot be time averaged to quantify it. In all movies we obtained, state transitions were approximately unidirectional and irreversible from a global, long-term viewpoint, suggesting that the stable point at which the network previously stayed no longer exists. We thus speculate that the network state is metastable. Metastable dynamics cannot, in general, be quantified with time averaging, but fortunately here, the states were locally stable (the mean time spent in a single state was 41 s). During this short period, we could estimate the potential energy function U.
In a strict sense, however, the recording length of our large-scale data are insufficient. Definitive conclusions might require recordings for hours and days. Indeed, Beggs and Plenz (2004) reported that spontaneous activity patterns are repeated with return times on the order of hours in cortical slice cultures, although their multielectrode recordings did not discriminate individual neuron identities, and thus it is unclear that such pattern repetitions represent exactly the same replay at the single-cell level. For now, we can only state that the spontaneous activity observed in cultured hippocampal CA3 networks behaves in a metastable mode for at least tens of minutes. Rather importantly, our statistical physics approach is a new strategy to quantify an attractor present in a biologic network (see also Wills et al., 2005; Wagenaar et al., 2006). This work therefore provides a novel framework to disclose the latent dynamics and structures hidden in multineuronal activity.
Footnotes
This work was supported in part by a Grant-in-Aid for Science Research on Priority Areas (Elucidation of Neural Network Function in the Brain, numbers 18021008 and 17023015), Grants-in-Aid for Science Research 17650090 and 17689004 from the Ministry of Education, Culture, Sports, Science, and Technology of Japan, Sumitomo Foundation Grant 050038, KONICA MINOLTA Imaging Science Foundation, and the Narishige Neuroscience Research Foundation. We are grateful to Dr. Shigeyoshi Fujisawa (The Buzsáki Laboratory, Rutgers University, Newark, NJ) for his important contribution to the computation of potential energy functions, Dr. Hiroyuki Nakahara (RIKEN Brain Science Institute, Wako, Saitama, Japan) for his original idea on the quantification of state structures, Dr. Tomoki Fukai (RIKEN Brain Science Institute) and Dr. Hideyuki Cateau (RIKEN Brain Science Institute) for their critical comments on a previous version of the manuscript, Dr. Ichiro Tsuda (Hokkaido University, Kita-Ku, Sapporo, Japan) for his suggestions on our statistical physical approach, and Hiroki Akashiba for his technical support on the MTT assay.
References
- Acsady L, Kamondi A, Sik A, Freund T, Buzsaki G. GABAergic cells are the major postsynaptic targets of mossy fibers in the rat hippocampus. J Neurosci. 1998;18:3386–3403. doi: 10.1523/JNEUROSCI.18-09-03386.1998. [DOI] [PMC free article] [PubMed] [Google Scholar]
- Amaral DG, Ishizuka N, Claiborne B. Neurons, numbers and the hippocampal network. Prog Brain Res. 1990;83:1–11. doi: 10.1016/s0079-6123(08)61237-6. [DOI] [PubMed] [Google Scholar]
- Anderson JS, Lampl I, Gillespie DC, Ferster D. The contribution of noise to contrast invariance of orientation tuning in cat visual cortex. Science. 2000;290:1968–1972. doi: 10.1126/science.290.5498.1968. [DOI] [PubMed] [Google Scholar]
- Arieli A, Sterkin A, Grinvald A, Aertsen A. Dynamics of ongoing activity: explanation of the large variability in evoked cortical responses. Science. 1996;273:1868–1871. doi: 10.1126/science.273.5283.1868. [DOI] [PubMed] [Google Scholar]
- Azouz R, Gray CM. Cellular mechanisms contributing to response variability of cortical neurons in vivo. J Neurosci. 1999;19:2209–2223. doi: 10.1523/JNEUROSCI.19-06-02209.1999. [DOI] [PMC free article] [PubMed] [Google Scholar]
- Baddeley A. Working memory: looking back and looking forward. Nat Rev Neurosci. 2003;4:829–839. doi: 10.1038/nrn1201. [DOI] [PubMed] [Google Scholar]
- Beggs JM, Plenz D. Neuronal avalanches in neocortical circuits. J Neurosci. 2003;23:11167–11177. doi: 10.1523/JNEUROSCI.23-35-11167.2003. [DOI] [PMC free article] [PubMed] [Google Scholar]
- Beggs JM, Plenz D. Neuronal avalanches are diverse and precise activity patterns that are stable for many hours in cortical slice cultures. J Neurosci. 2004;24:5216–5229. doi: 10.1523/JNEUROSCI.0540-04.2004. [DOI] [PMC free article] [PubMed] [Google Scholar]
- Bezdek CW, Li WQ, Attikiouzel Y, Windham M. A geometric approach to cluster validity for normal mixtures. Soft Comput. 1997;4:166–179. [Google Scholar]
- Briggman KL, Abarbanel HD, Kristan WB., Jr Optical imaging of neuronal populations during decision-making. Science. 2005;307:896–901. doi: 10.1126/science.1103736. [DOI] [PubMed] [Google Scholar]
- Cossart R, Aronov D, Yuste R. Attractor dynamics of network UP states in the neocortex. Nature. 2003;423:283–288. doi: 10.1038/nature01614. [DOI] [PubMed] [Google Scholar]
- Denizot F, Lang R. Rapid colorimetric assay for cell growth and survival. J Immunol Methods. 1986;89:271–277. doi: 10.1016/0022-1759(86)90368-6. [DOI] [PubMed] [Google Scholar]
- Fiser J, Chiu C, Weliky M. Small modulation of ongoing cortical dynamics by sensory input during natural vision. Nature. 2004;431:573–578. doi: 10.1038/nature02907. [DOI] [PubMed] [Google Scholar]
- Fox MD, Snyder AZ, Zacks JM, Raichle ME. Coherent spontaneous activity accounts for trial-to-trial variability in human evoked brain responses. Nat Neurosci. 2005;9:23–25. doi: 10.1038/nn1616. [DOI] [PubMed] [Google Scholar]
- Fujisawa S, Matsuki N, Ikegaya Y. Single neurons can induce phase transitions of cortical recurrent networks with multiple internal states. Cereb Cortex. 2006;16:639–654. doi: 10.1093/cercor/bhj010. [DOI] [PubMed] [Google Scholar]
- Gomez-Di Cesare CM, Smith KL, Rice FL, Swann JW. Axonal remodeling during postnatal maturation of CA3 hippocampal pyramidal neurons. J Comp Neurol. 1997;384:165–180. [PubMed] [Google Scholar]
- Ikegaya Y, Aaron G, Cossart R, Aronov D, Lampl I, Ferster D, Yuste R. Synfire chains and cortical songs: temporal modules of cortical activity. Science. 2004;304:559–564. doi: 10.1126/science.1093173. [DOI] [PubMed] [Google Scholar]
- Ikegaya Y, Le Bon-Jego M, Yuste R. Large-scale imaging of cortical network activity with calcium indicators. Neurosci Res. 2005;52:132–138. doi: 10.1016/j.neures.2005.02.004. [DOI] [PubMed] [Google Scholar]
- Joliffe IT. Principal component analysis. New York: Springer; 1986. [Google Scholar]
- Kenet T, Bibitchkov D, Tsodyks M, Grinvald A, Arieli A. Spontaneously emerging cortical representations of visual attributes. Nature. 2003;425:954–956. doi: 10.1038/nature02078. [DOI] [PubMed] [Google Scholar]
- Kentros C, Hargreaves E, Hawkins RD, Kandel ER, Shapiro M, Muller RV. Abolition of long-term stability of new hippocampal place cell maps by NMDA receptor blockade. Science. 1998;280:2121–2126. doi: 10.1126/science.280.5372.2121. [DOI] [PubMed] [Google Scholar]
- Kerr JN, Greenberg D, Helmchen F. Imaging input and output of neocortical networks in vivo. Proc Natl Acad Sci USA. 2005;102:14063–14068. doi: 10.1073/pnas.0506029102. [DOI] [PMC free article] [PubMed] [Google Scholar]
- Kisley MA, Gerstein GL. Trial-to-trial variability and state-dependent modulation of auditory-evoked responses in cortex. J Neurosci. 1999;19:10451–10460. doi: 10.1523/JNEUROSCI.19-23-10451.1999. [DOI] [PMC free article] [PubMed] [Google Scholar]
- MacLean JN, Watson BO, Aaron GB, Yuste R. Internal dynamics determine the cortical response to thalamic stimulation. Neuron. 2005;48:811–823. doi: 10.1016/j.neuron.2005.09.035. [DOI] [PubMed] [Google Scholar]
- Mao BQ, Hamzei-Sichani F, Aronov D, Froemke RC, Yuste R. Dynamics of spontaneous activity in neocortical slices. Neuron. 2001;32:883–898. doi: 10.1016/s0896-6273(01)00518-9. [DOI] [PubMed] [Google Scholar]
- Otten LJ, Quayle AH, Akram S, Ditewig TA, Rugg MD. Brain activity before an event predicts later recollection. Nat Neurosci. 2006;9:489–491. doi: 10.1038/nn1663. [DOI] [PubMed] [Google Scholar]
- Pare D, Shink E, Gaudreau H, Destexhe A, Lang EJ. Impact of spontaneous synaptic activity on the resting properties of cat neocortical pyramidal neurons in vivo. J Neurophysiol. 1998;79:1450–1460. doi: 10.1152/jn.1998.79.3.1450. [DOI] [PubMed] [Google Scholar]
- Penn AA, Shatz CJ. Brain waves and brain wiring: the role of endogenous and sensory-driven neural activity in development. Pediatr Res. 1999;45:447–458. doi: 10.1203/00006450-199904010-00001. [DOI] [PubMed] [Google Scholar]
- Petersen CC, Hahn TT, Mehta M, Grinvald A, Sakmann B. Interaction of sensory responses with spontaneous depolarization in layer 2/3 barrel cortex. Proc Natl Acad Sci USA. 2003;100:13638–13643. doi: 10.1073/pnas.2235811100. [DOI] [PMC free article] [PubMed] [Google Scholar]
- Rabiner LR. A tutorial on hidden Markov models and selected applications in speech recognition. Proc IEEE. 1989;77:257–286. [Google Scholar]
- Risken H. The Fokker-Planck equation. Berlin: Springer; 1989. [Google Scholar]
- Sanchez-Vives MV, McCormick DA. Cellular and network mechanisms of rhythmic recurrent activity in neocortex. Nat Neurosci. 2000;3:1027–1034. doi: 10.1038/79848. [DOI] [PubMed] [Google Scholar]
- Sasaki T, Kimura R, Tsukamoto M, Matsuki N, Ikegaya Y. Integrative spike dynamics of rat CA1 neurons: a multineuronal imaging study. J Physiol (Lond) 2006;574:283–290. doi: 10.1113/jphysiol.2006.108480. [DOI] [PMC free article] [PubMed] [Google Scholar]
- Schreiber S, Fellous J-M, Tiesinga PH, Sejnowski TJ. A new correlation-based measure of spike timing reliability. Neurocomputing. 2003;52–54:925–931. doi: 10.1016/S0925-2312(02)00838-X. [DOI] [PMC free article] [PubMed] [Google Scholar]
- Shu Y, Hasenstaub A, Badoual M, Bal T, McCormick DA. Barrages of synaptic activity control the gain and sensitivity of cortical neurons. J Neurosci. 2003;23:10388–10401. doi: 10.1523/JNEUROSCI.23-32-10388.2003. [DOI] [PMC free article] [PubMed] [Google Scholar]
- Stevens CF, Zador AM. Input synchrony and the irregular firing of cortical neurons. Nat Neurosci. 1998;1:210–217. doi: 10.1038/659. [DOI] [PubMed] [Google Scholar]
- Stewart CV, Plenz D. Inverted-U profile of dopamine–NMDA-mediated spontaneous avalanche recurrence in superficial layers of rat prefrontal cortex. J Neurosci. 2006;26:8148–8159. doi: 10.1523/JNEUROSCI.0723-06.2006. [DOI] [PMC free article] [PubMed] [Google Scholar]
- Stopfer M, Jayaraman V, Laurent G. Intensity versus identity coding in an olfactory system. Neuron. 2003;39:991–1004. doi: 10.1016/j.neuron.2003.08.011. [DOI] [PubMed] [Google Scholar]
- Stoppini L, Buchs PA, Muller D. A simple method for organotypic cultures of nervous tissue. J Neurosci Methods. 1991;37:173–182. doi: 10.1016/0165-0270(91)90128-m. [DOI] [PubMed] [Google Scholar]
- Wagenaar DA, Nadasy Z, Potter SM. Persistent dynamic attractors in activity patterns of cultured neuronal networks. Phys Rev E Stat Nonlin Soft Matter Phys. 2006;73:051907. doi: 10.1103/PhysRevE.73.051907. [DOI] [PMC free article] [PubMed] [Google Scholar]
- Wang E, Babbey CM, Dunn KW. Performance comparison between the high-speed Yokogawa spinning disc confocal system and single-point scanning confocal systems. J Microsc. 2005;218:148–159. doi: 10.1111/j.1365-2818.2005.01473.x. [DOI] [PubMed] [Google Scholar]
- Wills TJ, Lever C, Cacucci F, Burgess N, O'Keefe J. Attractor dynamics in the hippocampal representation of the local environment. Science. 2005;308:873–876. doi: 10.1126/science.1108905. [DOI] [PMC free article] [PubMed] [Google Scholar]
- Yamamoto N, Kurotani T, Toyama K. Neural connections between the lateral geniculate nucleus and visual cortex in vitro. Science. 1989;14:192–194. doi: 10.1126/science.2749258. [DOI] [PubMed] [Google Scholar]
- Zhang LI, Poo MM. Electrical activity and development of neural circuits. Nat Neurosci. 2001;4:1207–1214. doi: 10.1038/nn753. [DOI] [PubMed] [Google Scholar]


