

Abstract
Several disorders have been associated with mutations in Na,K-ATPase α isoforms (rapid-onset dystonia parkinsonism, familial hemiplegic migraine type-2), as well as reduction in Na,K-ATPase content (depression and Alzheimer's disease), thereby raising the issue of whether haploinsufficiency or altered enzymatic function contribute to disease etiology. Three isoforms are expressed in the brain: the α1 isoform is found in many cell types, the α2 isoform is predominantly expressed in astrocytes, and the α3 isoform is exclusively expressed in neurons. Here we show that mice heterozygous for the α2 isoform display increased anxiety-related behavior, reduced locomotor activity, and impaired spatial learning in the Morris water maze. Mice heterozygous for the α3 isoform displayed spatial learning and memory deficits unrelated to differences in cued learning in the Morris maze, increased locomotor activity, an increased locomotor response to methamphetamine, and a 40% reduction in hippocampal NMDA receptor expression. In contrast, heterozygous α1 isoform mice showed increased locomotor response to methamphetamine and increased basal and stimulated corticosterone in plasma. The learning and memory deficits observed in the α2 and α3 heterozygous mice reveal the Na,K-ATPase to be an important factor in the functioning of pathways associated with spatial learning. The neurobehavioral changes seen in heterozygous mice suggest that these mouse models may be useful in future investigations of the associated human CNS disorders.
Keywords: knock-out mice; learning and memory; learning memory; Morris water maze; movement (motion, motor activity); Na,K- ATPase; NMDA receptor
Introduction
Cellular transmembrane sodium and potassium ion gradients are generated by Na,K-ATPase, and mutations in α2 and α3 isoforms of these genes are involved in two known neurological disorders: familial hemiplegic migraine type-2 and rapid-onset dystonia parkinsonism (De Fusco et al., 2003; de Carvalho Aguiar et al., 2004). Cells transfected with mutant enzyme support the idea that Na,K-ATPase haploinsufficiency contributes to these diseases (De Fusco et al., 2003; de Carvalho Aguiar et al., 2004). Na,K-ATPase is composed of two essential subunits: the α subunit hydrolyzes ATP coupled with Na+ and K+ transport, whereas the β subunit is required for protein folding and modulates substrate affinity. An auxiliary subunit, FXYD, modulates substrate affinity but is not required for enzymatic activity (Geering, 2006). There are four α subunit isoforms (α1, α2, α3, and α4) encoded by different genes (Shull et al., 1986; Shamraj and Lingrel, 1994). All four isoforms have a high degree of amino acid identity, but studies have shown differences in the kinetic properties among the α isoforms and differences in substrate affinity (Jewell and Lingrel, 1991; Segall et al., 2001)
It is unknown whether, under physiological conditions, these affinity differences or differences in tissue distribution of the α isoforms confer uniquely identifiable functional consequences, although the human data cited above suggest isoform-specific functions. Three isoforms of the Na,K-ATPase are found in the brain but vary in the type of cell and level of expression. The α1 isoform is found in many CNS cell types, the α2 isoform is predominantly expressed in glia (although it is expressed in neurons during early development and in pyramidal cells of the hippocampus in adults), and α3 is only expressed in neurons (McGrail et al., 1991; Moseley et al., 2003).
Modulation of Na,K-ATPase activity directly affects neurotransmitter signaling, neural activity, as well as whole animal behavior. Na,K-ATPase inhibition by ouabain is known to decrease norepinephrine (Vatta et al., 2004), dopamine, and serotonin (5-HT) uptake (Steffens and Feuerstein, 2004) and increase acetylcholine release (Blasi et al., 1988). Administration of ouabain or related Na,K-ATPase inhibitors alters neuronal firing (Johnson et al., 1992; Vaillend et al., 2002) and impairs spatial and other forms of learning (Mizumori et al., 1987; Sato et al., 2004; Zhan et al., 2004). The α2 and α3 isoforms have similar affinities for cardiac glycoside inhibitors, and this precludes a pharmacological approach to determining isoform specificity.
To test the hypothesis that the regulation of individual Na,K-ATPase isoforms is an important adaptive response to anxiety or learning behavior, Na,K-ATPase genes were individually genetically deleted, and the heterozygous mice were studied for differences in behavior. Homozygous knock-out mice for the three α isoforms are embryonic or neonatal lethal; therefore, function of Na,K-ATPase isoforms were assessed in heterozygous mice lacking one copy of each allele. Two general behavioral areas were examined, anxiety and learning. Anxiety and motor activity were assessed in an elevated zero maze and an automated open field based on data that α2 heterozygous mice exhibit increased anxiety on these tests and show increased c-Fos expression in the amygdala and piriform cortex after conditioned fear (Ikeda et al., 2003). Furthermore, because dopamine and serotonin uptake are affected by Na,K-ATPase inhibition and these neurotransmitters directly modulate motor activity, locomotor activity after methamphetamine-induced stimulation was used as a means to unmask monoamine dysfunction in the heterozygous mice to determine whether individual Na,K-ATPase isoforms contribute to dopamine or serotonin signaling (Steffens and Feuerstein, 2004). Hippocampal-dependent learning and memory were examined using the Morris water maze (MWM) (spatial learning) and novel-object recognition test. Ouabain impairs spatial learning (Zhan et al., 2004), but this inhibitor will act directly on both the α2 and α3 isoforms that are expressed in hippocampal pyramidal cells (McGrail et al., 1991) resulting in CA1 pyramidal cell hyperexcitability leading to impaired neurotransmission (Vaillend et al., 2002). Therefore, examining the gene-targeted mice using the Morris water maze and the novel-object recognition tests will help define a specific contribution to learning and memory by each Na,K-ATPase isoform. In addition, corticosterone levels were also assessed based on evidence that some steroid hormones reverse ouabain-induced memory impairment (Sato et al., 2004).
Materials and Methods
Generation of Na,K-ATPase α3 isoform-deficient mice.
The α3 isoform-deficient mice were generated from gene targeting that produced a single base pair mutation in intron 4 adjacent to the exon–intron splice site. This mutation results in aberrant splicing of the α3 gene, adding an additional 126 bp to the RNA transcript. This mutant transcript does not express the α3 isoform protein product because no band except the predicted 110 kDa product was observed by Western blot, the size of the protein expected for the α subunit (Kaplan, 2002). When bred to homozygosity for the mutant allele, pups died shortly after birth, but mice heterozygous for the α3 gene are viable and fertile. Generation of the Na,K-ATPase α1 and α2 isoform-deficient mice were reported as described previously (James et al., 1999) and obtained from our colony at the University of Cincinnati. Heterozygous mice for the α1, α2, and α3 Na,K-ATPase isoforms were transferred from the University of Cincinnati to Cincinnati Children's Research Foundation at ∼2 months of age. All procedures were approved by the Laboratory Animal Care and Use Committee of the Cincinnati Children's Research Foundation and the Institution Animal Care and Use Committee of the University of Cincinnati. Only adult male mice, 4–6 months of age for each genotype (α1, α2, and α3 heterozygous animals), were used in these experiments, and all mice were maintained on a 129/Black Swiss genetic background. The same group of animals received all behavioral tests, but a separate cohort of animals was used in biochemical assays except when noted.
Northern blot analysis.
Brains were isolated from pups at embryonic day 18.5 (E18.5), RNA was extracted, and 20 μg of total RNA was electrophoresed, blotted, and probed with an α3-specific cDNA probe (Orlowski and Lingrel, 1988). The blot was stripped and reprobed for the ribosomal protein L32 as a loading control.
Reverse transcription-PCR.
cDNA from fetal brain RNA (E18.5) was prepared by random priming (Invitrogen, Carlsbad, CA). PCR was performed with primers to amplify exons 3–5 and 5–8. Products were gel purified and sequenced. There were no detectable sequence differences between the three genotypes in the α3 gene-targeted colony for exons 5–8 (data not shown). Sequencing of the lower band in the homozygous sample showed correctly spliced sequence. The upper band in the homozygous reaction was found to have 126 extra base pairs during sequencing.
Western blot analysis.
Hippocampi were dissected from adult male mice and homogenized in buffer containing 250 mm sucrose, 30 mm imidazole, and 2 mm EDTA, pH 7.2. Samples were aliquoted and stored at −80°C. Protein content was determined by the BCA assay (Pierce, Rockford, IL). Homogenate samples were incubated in 50 mm Tris-HCl, 5% SDS, 1% β-mercaptoethanol, and 10% glycerol, pH 6.9, for 30 min at 37°C, resolved by SDS-PAGE, and then transferred to polyvinylidene fluoride (PVDF) membranes. The PVDF membranes were incubated with the primary antibody at 4°C and then the secondary antibody overnight at 4°C. The PVDF membranes were developed using chemiluminescence (Amersham Biosciences, Piscataway, NJ). Signals were quantified by densitometry using ImageQuant software (Molecular Dynamics, Sunnyvale, CA). The Na,K-ATPase isoform-specific antibodies used were as follows: α6f, a monoclonal antibody against the α1 isoform, used at 1:1000 dilution (University of Iowa Developmental Studies Hybridoma Bank, Iowa City, IA); HERED, a polyclonal antibody raised in rabbit against the HERED sequence of the rat α2 isoform (Pressley, 1992), used at a 1:500 dilution, and MA3-915, a monoclonal antibody against the α3 isoform, used at a 1:1000 dilution (Affinity BioReagents, Golden, CO); and a polyclonal antibody against NMDA NR1, used at a 1:1000 dilution (Upstate Biotechnology, Charlottesville, VA).
Swim-induced c-Fos immunohistochemistry.
Stress was initiated in mice using a 5 min swim in cold water (10–12°C); 75 min after the cold swim, mice were deeply anesthetized and transcardially perfused via the ascending aorta with ice-cold PBS, followed by cold 4% paraformaldehyde in PBS. The brains were excised and postfixed for 2 h in fresh fixative, followed by 2 h of wash in PBS. Brains were then submersed in PBS with 30% sucrose and kept for 48 h at 4°C. Using a microtome, brains were cryosectioned in the coronal plane at a thickness of 40 μm and collected in a series of three consecutive wells containing a cryoprotectant (30% sucrose and 30% ethylene glycol in 0.1 m phosphate buffer) and stored at −20°C until use. Every third section of the brain was used for c-Fos immunolabeling. Free-floating tissue sections were incubated in six-well tissue culture plates with screen inserts and washed with PBS. Endogenous peroxidase activity was quenched with 1% hydrogen peroxide in PBS for 10 min, and sections were blocked for 1 h with 0.1% BSA and 0.4% Triton X-100 in PBS. Incubation with the primary antibody [rabbit anti-c-Fos (Ab-5), 1:6700; Oncogene, Cambridge, MA] was performed overnight. Sections were incubated with biotinylated goat anti-rabbit secondary antibody (1:400) for 1 h, exposed to an avidin–biotin complex (Elite ABC; Vector Laboratories, Burlingame, CA) for 1 h, and visualized using diaminobenzidine as a chromogen for no more than 10 min. Sections were washed several times with PBS between each step, and all immunolabeling procedures were performed at room temperature. The stained sections were mounted on positively charged glass slides, air dried, dehydrated through an ascending alcohol series, and coverslipped. Immunohistochemical controls in which the primary antibodies were omitted resulted in a lack of positive staining on a random sample of experimental tissue.
Sections containing the regions of interest were identified with reference to the Paxinos and Franklin mouse brain atlas (Paxinos and Franklin, 2004). The analysis of sections for each brain corresponds to the following coordinates in bregma: paraventricular hypothalamic nucleus, posterior part (PVN), −0.82 to −1.06 mm; posteromedial cortical amygdaloid nucleus, −2.06 to −2.30 mm). Regions of interest were photographed in eight-bit grayscale at a magnification of 100× using ImagePro Software. c-Fos-immunoreactive cells were counted by using image analysis software as described by others (Gammie and Nelson, 2001). In brief, the background for all photographs was normalized, density thresholds were set to 85 (minimum) and 255 (maximum), and the image was inverted; thus, labeled cells were visualized in black on a white background. Counting was performed by using NIH ImageJ particle analysis algorithm with the acceptable range of particle size between 5 and 50 pixels. For each region of interest, a spot check was performed by visually counting the cells under the microscope, and the consistency of results obtained with both methods was found to exceed 95%. Cell counting was performed in a blind manner with respect to genotype.
Behavioral tests.
Behavioral testing was done at Cincinnati Children's Research Foundation. Before behavioral testing, and after removal from quarantine, the animals were allowed at least 1 week of habituation to the vivarium that was maintained on a standard 12 h light/dark cycle with lights on at 7:00 A.M. Food and water were available ad libitum, and all behavior was assessed during the light portion of the cycle. The mice were housed in cages with a maximum of four mice per cage.
Elevated zero maze.
On the first day of behavioral testing, animals were placed in an elevated zero maze (Shepherd et al., 1994) as modified (Williams et al., 2003b). The apparatus consists of a circular runway divided in four equal quadrants. Two quadrants have high black walls on both sides of the runway, and the opposite two quadrants are open except for a short (1 cm), clear acrylic curb to demarcate the edge. Animals were placed in the apparatus in one of the walled quadrants, and the test continued for 5 min. Time in the open, number of open entries (2× open entries = number of transitions because there is no unscored zone at the intersection as in the elevated plus maze), and number of head dips over the side of open quadrants were scored for each animal from video recordings made of each session.
Automated open field.
At least 1 h after the elevated zero maze, animals were placed in an Accuscan (Columbus, OH) activity monitor (42 cm length × 42 cm width × 30 cm height), and spontaneous locomotor activity was measured in 5 min intervals for 60 min. Data analyzed included total horizontal distance (in centimeters), central and margin distance (the boundary was three photobeams from each edge that counted as the margin and the remainder counted as central), and time spent in corners (corners were defined as three photobeams out from each corner). Arenas were cleaned with 70% EtOH between animals.
Morris water maze.
Spatial learning and memory was tested next using the MWM. The apparatus was a 122 cm circular stainless steel tank painted white on the interior. Animals began a series of tests in the MWM 1 week after locomotor activity testing using procedures described previously (Vorhees and Williams, 2006). The first phase consisted of cued trials, in which animals were required to find a submerged platform (10 cm2) that had a black cylindrical “cue” (5 cm diameter × 5 cm height) mounted 7 cm above the platform on a brass rod. Curtains were drawn around the maze to reduce visibility of extramaze cues, and the animals were given four trials per day for 6 d. Both the platform position and start position were changed at random on each trial to inhibit reliance on spatial cues (Vorhees and Williams, 2006). Latency to reach the platform was recorded. The cued procedure introduces the animals to the main task requirements (e.g., swimming, the fact that the platform is not near the perimeter, and climbing on the platform to escape). This also reduces the number of animals that float in the water or that jump off the platform after finding it.
Subsequent to the cued version, animals were then tested in the first phase of spatial (hidden platform) learning (Vorhees and Williams, 2006). There were three learning phases for the hidden platform: acquisition, reversal, and double reversal. At 24 h after the end of each of these phases, a single 30 s probe trial was given with the platform removed to determine whether the animals had learned the location sufficiently to be able to swim back to the location where the platform had been. During these phases, the curtains were open, and the platform remained stationary throughout each phase. For acquisition, the platform (10 cm2) was located in the southwest quadrant and start positions were as defined previously (Williams et al., 2003b). Animals were given four daily trials for 6 d with a 15 s intertrial interval. Each trial lasted up to 1 min, latency to reach the platform was recorded, and animals were tracked using Smart tracker software (San Diego Instruments, San Diego, CA) that digitizes images received from a camera located over the maze. Latency to reach the platform on learning trials was used as the principal measure because we have shown previously that it correlates >0.95 with path length and cumulative distance from the platform (Vorhees and Williams, 2006); other indices were analyzed to corroborate the latency findings. When an animal was unsuccessful at locating the platform, it was removed from the water and placed on the platform for 15 s. On the day after acquisition, the platform was removed from the apparatus, and the mouse was given one 30 s probe trial started from a novel location to determine its memory for where the platform had been.
The next day, animals were trained in the reversal phase for 6 d in which animals were required to learn a new platform position in the northeast quadrant with the same 10 cm2 platform. All test conditions were the same as for acquisition except the sequence of start locations was new. At 24 h after the last reversal trial, a single 30 s probe trial was given as above. One day later, the animals began the double-reversal procedure, in which platform position was placed back at the original position (i.e., southwest), and the platform was reduced to 5 cm2. This phase was also followed by a single 30 s probe trial 24 h later.
Novel-object recognition test.
Beginning 1–2 d after the MWM, animals were habituated to the test arena for 10 min/d for 4 d; the apparatus was a circular polyethylene arena 91 cm diameter × 51 cm high. On day 5, testing for novel-object preference was performed as described previously (Clark et al., 2000) with modification (Brunskill et al., 2005). Animals were first exposed to two identical objects, equal distance from the walls and 41 cm apart. Once animals accumulated 30 s of exploration time between the two objects, the animal was removed from the arena. Animals that did not accumulate 30 s within 10 min were not included in this test. After a 1 h intertrial interval, animals were placed back in the arena with two new objects, one an identical copy of the original object and one a completely new object. Cumulative exploration up to 30 s between both objects was recorded. The trial was stopped if an animal did not accumulate 30 s of object exploration within 10 min.
Locomotor activity with methamphetamine challenge.
The final test was locomotor behavior with methamphetamine challenge. During this test, animals were reintroduced to the locomotor test chambers for 30 min of habituation followed by subcutaneous administration of 1 mg/kg (+)-methamphetamine (expressed as the freebase, >95% pure; from the National Institute on Drug Abuse, Bethesda, MD). Locomotor activity was then recorded for another 120 min in 5 min intervals.
Tissue collection.
Immediately on removal from the locomotor apparatus, animals were transferred to an adjacent suite and decapitated without anesthesia (Holson, 1992). Trunk blood was collected and plasma was obtained for the evaluation of corticosterone as described previously (Williams et al., 2003a) with minor modification (i.e., samples were diluted 1:5 before assessment). The neostriatum and hippocampus from each brain were dissected on ice for monoamine level determination.
Monoamine assays.
HPLC analysis of monoamine levels was performed as described previously (Koprich et al., 2003). Briefly, samples were homogenized in an antioxidant solution (0.4 N perchlorate, 1.343 mm EDTA, and 0.526 mm sodium metabisulfite) and centrifuged for 20 min at 14,000 × g, and the supernatant was collected for HPLC. A Microsorb MV C-18 column (5 μm, 4.6 × 250 mm; Varian, Walnut Creek, CA) attached to a 12-channel coulometric array detector (CoulArray 5200; ESA, Chelmsford, MA) and Waters (Milford, MA) 2695 Solvent Delivery System were used to determine concentrations of norepinephrine, dopamine, 3,4-dihydroxyphenylacetic acid, homovanillic acid, 5-hydroxyindolacetic acid, and 5-HT; a flow rate of 1 ml/min with detection potentials of 50, 175, 350, 400, and 525 mV, respectively, were used. The mobile phase consisted of a 10% methanol solution containing 0.1 m citric acid, 0.075 m Na2HPO4, 0.8 mm heptanesulfonic acid, and 0.097 mm EDTA, pH 4.1. The concentration of monoamines in the tissue samples was quantified against a six-point standard curve, expressed as micrograms per milligram of protein. The amount of protein in each sample was determined by the BCA assay (Pierce).
Statistical methods.
For the analysis of protein semiquantification with Western blots, a one-tailed paired t test was used for each isoform comparing the densitometry value in wild-type (WT) mice versus heterozygous mice. One-way general linear model ANOVA (SAS, Cary, NC) was used for data for the elevated zero maze, novel-object recognition, corticosterone, and monoamines. When significant F ratios were obtained, post hoc group comparisons were analyzed using the method of Newman–Keuls. For all tests that had a within-subject variable (locomotor activity, MWM), data were analyzed using mixed-model ANOVAs. For the analysis of locomotor activity after methamphetamine challenge, differences in activity among the groups in the last 10 min of the prechallenge period were used as a covariate, and the data were analyzed by analysis of covariance (ANCOVA) (which adjusts for differences in the covariate in the calculation of F ratios). MWM learning data were also analyzed by mixed ANOVA using the AR(1) solution for the variance–covariance matrices. Mixed linear model ANOVA provides adjusted degrees of freedom that do not match those used in standard ANOVAs and can be fractional. Interactions were further analyzed by simple effect ANOVAs, followed by the step-down Bonferroni's method for pairwise group comparisons. Some Morris maze data were also analyzed by ANCOVA using swimming speed as the covariate to segregate swimming speed differences from learning effects. Significance was defined as p ≤ 0.05, and only comparisons between WT and the α isoforms will be described.
Results
Verification of gene-targeted Na,K-ATPase isoform knock-out mice
Na,K-ATPase α1 and α2 isoform-deficient mice were generated by standard gene-targeting procedures (James et al., 1999). The α3 isoform-deficient mice were generated from gene targeting that produced a mutation in intron 4, causing aberrant mRNA processing and an unstable transcript leading to loss of expression. Heterozygosity of the α3 isoform was confirmed by examining RNA and protein expression in fetal brains. Northern blot analysis revealed decreased abundance of the α3 transcript from α3+/− animals and very low level expression of α3 mRNA in α3−/− mice compared with WT mice (Fig. 1A). Two RNA species were observed in the α3−/− animal by reverse transcription (RT)-PCR, whereas one product was found in α3+/− and WT mice (Fig. 1B). Therefore, the α3−/− animal expresses some α3 transcript, albeit at a much lower level of α3 mRNA than WT animals, and the α3−/− cannot be considered a complete knock-out. Na,K-ATPase α isoform content was examined in the three Na,K-ATPase α isoform gene-targeted mice by Western blot (Fig. 1C,D) in whole tissue hippocampal extracts, and semiquantitation was obtained by densitometry from at least four membrane blots from three independent pools. In the α1+/− mice, α1 isoform was reduced ∼70% compared with WT levels (p < 0.05), with no significant change in α2 or α3 isoform levels. In the α2+/− mice, the α2 isoform was reduced ∼50% (p < 0.05), the α1 isoform was not significantly changed, and the α3 isoform was reduced ∼25% (p < 0.05) compared with WT. In the α3+/− mice, the α3 isoform was reduced ∼60% (p < 0.05), the α1 isoform was increased ∼35% (p < 0.05), and the α2 isoform was not significantly changed compared with WT.
Figure 1.

Na,K-ATPase isoforms are reduced in gene-targeted mice. A, Reduced Na,K-ATPase α3 isoform mRNA expression in embryonic E18.5 d brains from WT, heterozygous (+/−), and homozygous (−/−) α3 knock-out mice by Northern blot. L32 was used as a loading control. Twenty micrograms of total RNA were loaded per lane. B, RT-PCR analysis of RNA from WT, heterozygous (+/−), and homozygous (−/−) α3 knock-out mice shows larger RNA transcript in −/− (arrow) but not +/− or WT mice. C, Western blot analysis of Na,K-ATPase isoforms in whole tissue extracts from hippocampus of adult male α1+/−, α2+/−, and α3+/− mice. Total protein loaded per lane was as follows: 10, 0.5, and 1 μg for α1, α2, and α3 isoform expression, respectively. D, Semiquantitation by densitometry on whole tissue extracts from adult hippocampus of α1+/−, α2+/−, and α3+/− mice shows reduction in α1, α2, and α3 isoforms, respectively. *p < 0.05 versus WT.
Elevated zero maze
The α2+/− mice spent significantly less time in the open quadrants (ANOVA, F(3,79) = 4.7; p < 0.005) and entered open arms fewer times than WT (ANOVA F(3,79) = 4.0; p < 0.01) (Fig. 2A,B). No differences were observed for time in open or open arm entries between α1+/− and WT or α3+/− and WT controls (Fig. 2A,B). No significant differences in the number of head dips were observed among the genotypes (Fig. 2C). To determine whether α2 animals spent less time in the open because they were less active, we analyzed time in open per number of open entries. No genotype differences were found, indicating that all groups spent the same amount of time in the open per visit to an open quadrant (data not shown).
Figure 2.

Elevated zero maze. Na,K-ATPase α2+/− mice display reduced time in open and a reduced number of entries into open quadrants compared with WT (WT, n = 36; α1+/−, n = 17; α2+/−, n = 19; and α3+/−, n = 11). Number of transitions is simply two times the number of open quadrant entries. A, Time in the open. B, Number open quadrant entries. C, Number of head dips. Mean ± SEM; *p < 0.05 versus WT.
c-Fos expression
Ikeda et al. (2003) reported increased expression of c-Fos in the piriform cortex and amygdala in homozygous null α2 mutants on E17.5–E18.5 and increased expression in adult heterozygous mutants after conditioned fear compared with no differences in expression in heterozygotes kept in their home cage. To determine whether a 5 min forced swim would also produce differences in c-Fos in α2 heterozygotes, we examined c-Fos expression in α2+/− mice as adults by immunohistochemistry. No significant changes were seen in any brain region (data not shown; regions examined included the amygdala and PVN).
Open-field locomotor activity
In addition to testing anxiety with the elevated zero maze, we also used an automated open field to assess spontaneous locomotor activity and anxiety-related conflict (Weisstaub et al., 2006), i.e., the conflict that arises between the drive to explore by venturing into the center of the arena and safety by remaining in a corner or along a wall. Animals were examined 1 h after the elevated zero maze test in the automated open field. For distance traveled (in centimeters), there was a significant genotype main effect (F(3,81.9) = 6.43; p < 0.001). Group comparisons showed that the α2+/− mice were less active on average across intervals and the α3+/− mice more active than WT (Fig. 3A, inset). There was also a significant genotype × interval interaction (F(33,798) = 3.85; p < 0.0001). Additional analyses for each interval showed that the α3+/− mice were hyperactive relative to WT during the first four intervals, whereas the α2+/− mice were significantly less active during the first interval.
Figure 3.

Open-field locomotor activity. Altered distance moved (in centimeters) in Na,K-ATPase mice. Number of animals tested was as follows: WT, n = 36; α1+/−, n = 18; α2+/−, n = 19; α3+/−, n = 11. A, α2+/− mice tended to be hypoactive overall (inset) and were hypoactive during the first interval; α3+/− mice were hyperactive overall (inset) and during the first four intervals. No differences were noted between α1+/− and WT mice. B, Center distance (in centimeters) defined as activity more than three photobeams (3 cm) in from the side walls. α1+/− mice moved more during the first three intervals, α2+/− moved less during the first three intervals, and α3+/− mice moved more during the first four intervals in the central zone than WT. C, Margin (peripheral) distance (in centimeters) is distance moved within three photobeams of the side walls. The pattern is nearly the same as in A. D, Corner time (in seconds) is cumulative time within each interval spent interrupting one of the three photobeams closest to each corner. Inset, Total time spent in corners averaged across intervals. α1+/− and α3+/− spent less time in the corners and α2+/− spent more time in the corners than WT. Mean ± SEM; †p < 0.10, *p < 0.05, **p < 0.01, ***p < 0.001 versus WT.
In the zero maze, α2+/− mice spent less time in the open as well as making fewer open quadrant entries; therefore, the open-field data were further analyzed for evidence of altered anxiety. Distance moved was fractionated into central versus peripheral (margin) distance (Fig. 3B,C, respectively). There was a significant main effect of genotype (F(3,82.6) = 6.09; p < 0.001) and a genotype × interval interaction on central distance (F(33,807) = 1.86; p < 0.01). The interaction effects were significant on the first four intervals by simple-effect ANOVAs. Group comparisons on each significant interval revealed that the α2+/− group was less active during the first 3 intervals, the α1+/− group was more active during the first 3 intervals, and the α3+/− group was more active during the first four intervals in distance moved in the central portions of the open field compared with the WT group. There was also a significant genotype main effect on distance moved in the margins (F(3,81) = 6.38; p < 0.001) and a significant genotype × interval interaction (F(33,795) = 4.91; p < 0.0001). When analyzed by interval for group differences, the same general pattern emerged as for total distance (Fig. 3C), i.e., the α3+/− mice were more active during early intervals and the α2+/− mice were less active during only the first interval.
The central distance analysis suggested that α2+/− animals were more anxious and the α1+/− and α3+/− animals less anxious than WT animals. To further test the anxiety state of the animals, we examined time spent in the corners because anxious animals tend to spend more time located there. There was a significant main effect of genotype on time spent in corners (F(3,82.3) = 4.17; p < 0.01) and a genotype × interval interaction (F(33,811) = 1.86; p < 0.01) (Fig. 3D). Group comparisons showed that, even as all genotypes spent progressively more time in the corners across successive intervals, the α2+/− group spent proportionately more time in the corners and the α1+/− and α3+/− significantly less time (Fig. 3D, inset) than the WT group.
Locomotor activity with methamphetamine challenge
At the end of behavioral testing, the indirect dopaminergic agonist methamphetamine was administered to determine whether stimulant-induced locomotor activity would unmask latent differences attributable to Na,K-ATPase isoform deficiency. During the retest habituation period, genotype differences remained (Fig. 4, left set of curves). Therefore, we analyzed the post-methamphetamine activity using a repeated-measure ANCOVA (Fig. 4, right set of curves). The ANCOVA adjusts the variance estimates of post-methamphetamine activity using the correlation between pre- and post-methamphetamine activity (Kirk, 1995). ANCOVA showed a significant interaction of genotype × interval (F(69,1817) = 1.75; p < 0.001). The interaction revealed a pattern in which α3+/− animals had the highest peak activity and returned to WT levels by 70 min. The α1+/− animals showed a smaller increase than the α3+/− mice, but their habituation pattern over time was different, showing prolonged higher activity that extended to the end of the test session compared with WT animals. The α2+/− animals tracked closely with WT throughout post-methamphetamine testing.
Figure 4.

Open-field locomotor activity as distance moved (in centimeters) before and after stimulant challenge with methamphetamine. Activity was monitored for 30 min before administration of 1 mg/kg subcutaneous dose of (+)-methamphetamine and for 2 h after injection. Number of animals used was as follows: WT, n = 36; α1+/−, n = 18; α2+/−, n = 19; α3+/−, n = 11. There was a genotype × interval interaction by ANCOVA. Post-methamphetamine distances are adjusted means ± SEM for the covariate (last 2 pre-methamphetamine intervals). α3+/− mice showed an increased response compared with WT during the first 13 intervals, whereas the α1+/− mice showed increased activity during the first 12 intervals similar to the α3+/− mice (but not to the same extent) and then continued at a higher level than WT. α2+/− mice showed a response that was comparable with WT mice.
Monoamine neurotransmitters and corticosterone
Immediately on removal from locomotor with methamphetamine challenge, corticosterone levels in plasma were examined as well as monoamine content in the neostriatum and hippocampus (regions were chosen based on MWM findings). No differences in tissue content of norepinephrine, dopamine, serotonin, or their metabolites were observed in striatum or hippocampus in any of the genotypes compared with WT mice (data not shown).
Plasma corticosterone determinations were made on two sets of animals: an unmanipulated group to obtain basal levels and in those given a methamphetamine challenge to obtain stimulated levels. Basal corticosterone was significantly higher in α1+/− mice than for WT with no differences observed between the α2+/− or α3+/− and WT mice (Fig. 5A) (F(3,36) = 3.8; p < 0.02). In animals that received the methamphetamine challenge, corticosterone was also elevated in α1+/− mice (F(3,79) = 4.67; p < 0.005), whereas corticosterone levels in the α2+/− and α3+/− mice did not differ from those in WT mice (Fig. 5B).
Figure 5.

Plasma corticosterone. Augmentation of corticosterone in α1+/− mice but not α2+/− or α3+/− mice compared with WT. Data are mean ± SEM. A, Release of corticosterone under basal conditions in α1+/− mice is augmented relative to α2+/−, α3+/−, and WT mice. Group sizes are as follows: WT, n = 10; α1+/−, n = 10; α2+/−, n = 10; α3+/−, n = 10. B, Mice were challenged with methamphetamine and examined by locomotor testing for 2.5 h, and then corticosterone was assayed in plasma by enzyme immunoassay. Group sizes are as follows: WT, n = 35; α1+/−, n = 18; α2+/−, n = 19; α3+/−, n = 11. *p < 0.05 versus WT.
Morris water maze
Previous work showed that Na,K-ATPase inhibition by ouabain impaired learning in rats (Zhan et al., 2004). We examined Na,K-ATPase mutant mice to assess whether reduction of specific isoforms of the Na,K-ATPase resulted in impaired learning. Two versions of the MWM test were used: cued platform, which relies on proximal cues, and the hidden platform, which relies on distal cues. On the first and last day of testing, no significant differences were noted among the genotypes compared with WT in locating the cued platform (Fig. 6A). However, the α3+/− animals took longer to locate the platform on days 2–5 relative to animals of all other genotypes (Fig. 6A) (genotype main effect, F(3,80.2) = 5.0, p < 0.01; genotype × day interaction, F(15,349) = 2.38, p < 0.01). Although it appeared that the α1+/− mice took slightly less time to locate the platform on days 2, 5, and 6, this was not significant. No other differences were noted.
Figure 6.
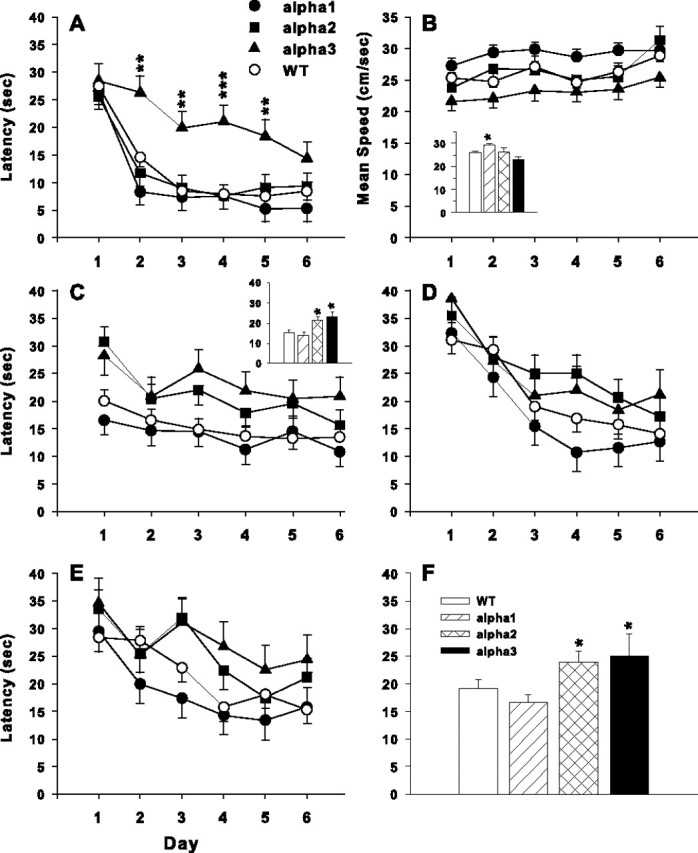
Morris water maze. A, Na,K-ATPase α3+/− mice took significantly longer to reach the visible platform on days 2–5 on cued trials but caught up to WT by day 6. B, Average speed during the hidden platform acquisition phase. There was a main effect of genotype (inset) that showed that the α1+/− mice swam significantly faster than WT, and α3+/− mice swam slightly slower compared with WT. C, Latencies to reach the platform during the acquisition phase of hidden platform learning. There was a significant main effect of genotype in which the α2+/− and α3+/− mice had longer escape latencies than WT mice (inset). D, Latencies on the reversal phase of hidden platform learning; there were no significant effects of genotype. E, Latencies on the double-reversal phase of hidden platform learning using a smaller platform (25% the size of the starting platform. The smaller platform was used to increase the accuracy required to locate the goal). There was a significant interaction between day of testing and genotype (for details, see Results). F, Latencies to reach the platform combined across each of the three phases of hidden platform learning. There was an overall effect in which the α2+/− and α3+/− mice had longer escape latencies than WT. Data are mean ± SEM. Number of animals tested are as follow: WT, n = 36; α1+/−, n = 18; α2+/−, n = 19; α3+/−, n = 11. *p < 0.05; **p < 0.01; ***p < 0.001 versus WT.
During hidden platform training, three different phases of testing were used in which the platform position was changed for each phase. Before analyzing indices of learning, swimming speed data were first analyzed (Fig. 6B). There was a significant main effect of genotype for swimming speed during acquisition (F(3,59.7) = 6.26; p < 0.001). Group comparisons showed that the α1+/− mice swam faster than WT (Fig. 6B, inset). In contrast, the α3+/− mice appeared to swim slower, but this was not significant compared with WT animals, and α2+/− mice swam similarly to WT mice.
In the hidden platform acquisition phase, latency to find the platform (Fig. 6C) demonstrated a significant main effect of genotype (F(3,79.8) = 5.12; p < 0.01). Group comparisons showed that the α2+/− and α3+/− mice had longer latencies to reach the platform than WT (Fig. 6C, inset).
During reversal, the platform was moved to the opposite quadrant (Fig. 6D). Neither the main effect of genotype nor the genotype × day interaction was significant. During the third phase, the goal was moved again, and a smaller (5 × 5 cm) platform was used (Fig. 6E). The main effect of genotype was not significant, but there was a significant genotype × day interaction (F(15,340) = 2.05; p = 0.01). Additional analyses of the interaction showed that none of the simple-effect ANOVAs on each day were significant, but the α3+/− mice had slightly longer latencies than WT. In examining the data across the three hidden platform test phases, it was evident that the patterns were similar. Accordingly, we performed an additional ANOVA using test phase as an additional repeated-measure factor. Genotype influenced the ability of animals to learn regardless of phase (F(3,79) = 3.2; p < 0.03). The α2+/− and α3+/− mice had longer latencies to reach the platform than the WT mice, and no differences were noted between the α1+/− mice and WT mice (Fig. 6F).
Because there were swimming speed differences obtained during acquisition and it is known that latency is affected by swimming speed, we also analyzed the tracking records for path length and cumulative distance from the platform, measures that are less influenced by swimming speed (Gallagher et al., 1993). Both measures showed similar effects; therefore, only the results of the cumulative distance analysis are presented (Fig. 7). Cumulative distance is the linear distance (in centimeters) from the animal to the center of the platform measured every 200 ms. Because of difficulties for the camera to see and track mice having a light coat color (independent of genotype), group sizes are somewhat smaller than with latency, but a direct comparison of latency data using the subset with complete tracking versus the total dataset for latency shows the identical outcome. ANOVA of cumulative distance during acquisition showed a significant main effect of genotype (F(3,62.1) = 4.38; p < 0.01). A posteriori group comparisons showed that the α3+/− mice were significantly farther from the platform on average than WT mice.
Figure 7.

Morris water maze. Data are for cumulative distance from the platform during the acquisition phase of hidden platform learning. Cumulative distance is the distance from the mouse to the center of the platform (in centimeters) recorded every 200 ms. There was a main effect across days of genotype in which the α3+/− mice were farther from the platform on average than were WT mice. Number of animals tested were as follows: WT, n = 31; α1+/−, n = 18; α2+/−, n = 5; α3+/−, n = 10. Data are mean ± SEM. **p < 0.01 versus WT.
In an additional effort to ensure that the differences observed during the acquisition phase of hidden platform learning were not the result of differences in swimming speed, we used swimming speed data from the first probe trial (obtained 24 h after the last acquisition training trial) in an ANCOVA on latency. Probe trial swimming speed was used because speed on the probe trial is uncontaminated by trial length because all probe trials lasted 30 s. As noted above, the ANOVA on acquisition latency showed a genotype main effect at p < 0.01. The same data by ANCOVA with speed as the covariate also showed a main effect of genotype (p < 0.05). Although the p value changed slightly attributable to a small decrease in the F ratio, the ANCOVA reveals that most of the variance was attributable to differences in latency to learn the short route to the goal rather than to differences in swimming speed.
After each learning phase, one probe trial was given with the platform removed, and the animals started from a novel position to assess memory for the position of the platform. Because of tracking difficulties, complete records on the α2+/− mice were not available. Therefore, these data were analyzed twice, once with the α2+/− group included and again with it removed. The results were nearly identical in both cases because the same group effects were significant. The probe trial after acquisition showed a significant effect of genotype on distance swum in the target quadrant (F(2,54) = 4.14; p < 0.05). A posteriori group comparisons showed that the α1+/− mice spent significantly more time in the target quadrant than WT (Fig. 8A). An analysis of average distance from the target quadrant was not significant. There were no significant genotype effects on the probe trial after reversal learning (data not shown). On the probe trial after double reversal with the smaller platform, there were significant genotype main effects found on distance swum in the target quadrant (F(2,55) = 3.64; p < 0.05), time spent in the target quadrant (F(2,55) = 3.22; p < 0.05), and average distance to the target site (F(2,55) = 5.47; p < 0.01). A posteriori group comparisons showed that the group accounting for the effect on distance swum in the target quadrant was the α3+/− group (Fig. 8B). This was also the case for time spent in target quadrant (Fig. 8C) and for average distance from the platform site (Fig. 8D). Each of these measures indicates that α3+/− mice had significantly greater difficulty remembering both the specific location of the platform and its general location within the goal quadrant.
Figure 8.

Morris water maze probe trials. At 24 h after receiving 24 learning trials to find the hidden platform, a single probe trial is given to determine whether the animal remembers the location of the platform. For the probe trial, the platform is removed and the performance of the mouse is monitored for 30 s. A, Distance (in centimeters) swum in the target quadrant after acquisition training and α1+/− mice spent more time in the quadrant compared with WT mice. B, Distance (in centimeters) swum in the target quadrant after double-reversal training with the small platform, and the α3+/− mice showed slightly reduced distance traveled. C, Time in the target quadrant during double-reversal training, and the α3+/− mice spent less time in the target quadrant. D, Average distance from the center point in which the platform used to be and the α3+/− mice were farther from the former platform site. Number of animals tested was as follows: WT, n = 31; α1+/−, n = 18; α2+/−, n = 5; α3+/−, n = 10. Data shown are mean ± SEM. Data were analyzed with and without the α2+/− group to determine whether this groups smaller n affected the outcome; it did not. †p < 0.10, *p < 0.05, **p < 0.01 compared with WT for three-group ANOVA.
Novel-object recognition
No significant differences in preference for a novel object were found between any of the Na,K-ATPase-deficient mice compared with WT mice. The percentage of time spent attending to the novel object relative to the familiar object 1 h after familiarization was as follows: WT, 67.9 ± 2.6%; α1+/−, 63.7 ± 3.1%; α2+/−, 73.1 ± 3.2%; and α3+/−, 72.8 ± 5.4%. Group sizes of those tested relative to those that completed the test are as follows: WT, 35 and 28; α1+/−, 18 and 17; α2+/−, 19 and 18; and α3+/−, 11 and 9.
NMDA NR1 in hippocampus
Having found the spatial learning differences in the α2+/− and α3+/− mice, we asked whether these effects might be related to hippocampal NMDA receptor expression resulting from the α isoform deficiency. Accordingly, we examined hippocampal extracts by Western blot and found a 40% reduction of protein abundance of the NMDA NR1 isoform in the α3+/− mice but not in α1+/− or α2+/− mice compared with wild type (Fig. 9A,B).
Figure 9.

NMDA receptor expression. NR1 subunit is downregulated in the Na,K-ATPase α3+/− mice. A, Representative Western blot analysis of the NMDA receptor NR1 subunit in whole tissue extracts from hippocampus of adult male α1+/−, α2+/−, and α3+/− mice. Total protein loaded per lane is 2 μg. B, Semiquantitation by densitometry on whole tissue extracts from hippocampus from adult α1+/−, α2+/−, and α3+/− mice show reduction in NR1 in the α3+/− mice only (n = 3 per group). *p < 0.05 versus WT.
Discussion
The data demonstrate that disruption of one copy of the α isoforms of the Na,K-ATPase leads to isoform-specific behavioral changes. Importantly, we examined the effect of reduction of all three Na,K-ATPase α isoforms in parallel, under the same conditions, and demonstrated that Na,K-ATPase isoforms differentially modulate behavior (summarized in Table 1). The hippocampus was examined for Na,K-ATPase isoform expression attributable to the well known role of this structure in learning and memory. We are not precluding, however, the possibility that other regions of the brain contribute to behavioral defects observed in these gene-targeted mice, but we used the hippocampus as an area of the brain to initially gauge the extent of reduction of protein expression of each of the Na,K-ATPase isoforms in the three mouse models. However, even in the hippocampus, the expression of the three α isoforms is complex in each of the gene-targeted mice, including compensatory upregulation and downregulation of other Na,K-ATPase isoforms, depending on which isoform gene is ablated. The behavioral defects observed in the gene-targeted mice in this report provide a rational basis to further examine isoform expression in more detail in defined regions of the brain based on regional brain function.
Table 1.
Summary of effects for Na,K-ATPase α isoform mice relative to wild-type controls
| α1+/− | α2+/− | α3+/− | |
|---|---|---|---|
| Zero maze (n) | (18) | (19) | (11) |
| Time in open | ↓ | ||
| Open entries | ↓ | ||
| Open field (n) | (18) | (19) | (11) |
| Total distance | ↓ | ↑ | |
| Center distance | ↑ | ↓ | ↑ |
| Corner time | ↓ | ↑ | ↓ |
| Total distance (post-Methamphetamine)b | xa | x | |
| Corticosterone (n) | (10, 18) | (10, 19) | (10, 11) |
| Basal | ↑ | ||
| Post-Methamphetamine | ↑ | ||
| Morris maze (n) | (18) | (19) | (11) |
| Learning | |||
| Cued latency | ↑ | ||
| Speed (acq.)c | ↑ | ||
| Latency (acq.) | ↑ | ↑ | |
| Cumulative distance (acq.) | ↑ | ||
| Latency (rev.)d | |||
| Latency (dbl. rev.) | |||
| Latency (all) | ↑ | ↑ | |
| Probe | (18) | (5) | (10) |
| Acquisitione | ↑ | ||
| Double-rev.f | ↑ | ||
| NMDA-R (n) | (3) | (3) | (3) |
| NR1 expressiong | ↓ |
ax, Interaction (for details, see Results).
bDistance traveled (in centimeters) after methamphetamine challenge.
cAcq, Acquisition performance during the initial phase of testing to the hidden platform.
dRev, Reversal is the second phase of testing in which the platform was moved to the opposite quadrant of the maze.
eAcquisition, Distance swum in target quadrant (in centimeters) during the no-platform trial given at the end of the acquisition phase of maze testing.
fAverage distance to platform site during the probe trial given at the end of the third phase of maze testing, i.e., double reversal, which was after the acquisition and reversal phases.
gNR1 subunit expression in the hippocampus.
We show for the first time that reduction in either the α2 or α3 isoform results in spatial learning/memory deficits, whereas reduction in the α1 isoform does not. The α2+/− mice also showed reduced locomotor activity compared with wild-type mice, whereas the α3+/− mice were hyperactive. The α1+/− and α2+/− mice have been examined previously for muscle contractile function and muscle fatigue by performing electrical stimulation of extensor digitorum longus (EDL) muscle, a fast-twitch muscle in the lower leg (He et al., 2001). EDL muscle from the α1+/− displayed hypocontractility, whereas the α2+/− muscle was hypercontractile. Because reduced Na,K-ATPase activity by ouabain has been shown to lead to altered contractile function and muscle fatigue (Clausen, 2003), we further examined whether muscle from the α1+/− and α2+/− were more prone to fatigue. We showed that the α1+/− and α2+/− mice did not fatigue faster than the WT mice, and, in addition, we did not observe any gross indications of muscle fatigue during the behavioral testing. Furthermore, correcting for differences in swimming speed (because α3+/− mice swam slightly slower) did not eliminate the learning deficits observed in the α3+/− mice. Spatial learning deficits were also confirmed by analyzing measures that are less sensitive to swimming speed, such as cumulative distance from the platform and path length (Gallagher et al., 1993). In addition to the learning deficits, after the platform was reduced in size to make the task more difficult, α3+/− mice showed reference memory deficits on the probe trial.
Both the α1+/− and α3+/− mice displayed an exaggerated response to methamphetamine, suggesting abnormalities in dopamine pathways, although no changes in dopamine content were found in striatum, nor did we observe visible neurological defects, such as tremors or seizures in any of the gene-targeted mice as might be expected with reduced Na,K-ATPase function because this enzyme contributes to the electrical excitability of cells. The findings are unique in that we observed altered behavior in heterozygous mice in which only one allele is knocked out, whereas many gene-targeted mice show behavioral deficits only when both alleles are knocked out (Bolivar et al., 2000; Anagnostopoulos et al., 2001). Hence, a set of enzymes essential to cell survival resulted in specific functional changes when levels are only partially reduced. This suggests that, in some brain regions, absolute concentrations or redundant function from overlapping expression of the different isoforms may be sufficient to maintain cell membrane potential, whereas in other regions, such as hippocampal NMDA-containing cells, reduced Na,K-ATPase may become the limiting factor in maintaining function, thereby compromising sensitive networks involved in processes such as spatial learning and reference memory.
The behavioral abnormalities suggest different functions for each of the α isoforms. The α1 isoform is ubiquitously expressed in most cell types, including neurons and glia. Given the large reduction in α1 protein abundance (70%) and its ubiquitous expression, the lack of behavioral deficiencies suggests that other isoforms provide sufficient redundancy to compensate for reductions in α1+/− in most brain regions. However, in contrast to the modest behavioral changes in locomotor activity after methamphetamine, the α1+/− mice had significantly elevated resting and stimulated corticosterone levels in plasma, whereas no differences were noted between the other genotypes and WT mice. Hormones of the hypothalamic–pituitary–adrenal axis are known to be important in various behaviors, such as learning and memory, locomotion, and anxiety; therefore, the lack of behavioral changes in the α1+/− mice appears contradictory. However, it may be that mineralocorticoid and glucocorticoid receptors are downregulated to compensate for the chronic increased levels of corticosterone in α1+/− mice. If correct, this would explain why altered basal levels of corticosterone may be less important than the percentage change in corticosterone after a stressful stimulation.
Only the α2+/− mice displayed an anxiety-related phenotype. This supports a previous report by Ikeda et al. (2003) showing that Na,K-ATPase α2+/− mice spent less time in the open in the elevated plus maze (and had fewer open entries) and light/dark box and showed increased freezing in a conditioned fear test (Ikeda et al., 2003). Unfortunately, the light/dark box was tested by measuring emergence after being placed in the dark compartment and hence measures essentially the same behavior as time in the open in the elevated plus maze, providing little convergent evidence. The conditioned fear data are convergent, and, in addition, a new report based on tissues from a human brain bank suggest that Na,K-ATPases are reduced in cortical samples from patients with mood disorders, especially depression (Goldstein et al., 2006). Lesion and pharmacological challenge studies have implicated specific areas of the brain in anxiety and mood, including the amygdala, hypothalamus, hippocampus, and brainstem (Gordon and Hen, 2004). Therefore, we examined c-Fos expression as an indicator of enhanced neural activity in the amygdala and paraventricular nucleus of the hypothalamus. In response to a short 5 min swim stress, we found no significant difference in c-Fos expression between α2+/− and wild-type mice. In contrast, Ikeda et al. (2003) observed a qualitative increase in c-Fos expression in the amygdala and piriform cortex after footshock in their α2+/− mice. This disparity may be attributable to differences in the effects of swimming versus footshock, because different stressors are known to elicit different physiological responses and the effect Ikeda et al. observed on c-Fos was very subtle and not quantified. However, the reduced locomotor activity, lack of c-Fos changes in anxiety-related brain structures, and normal corticosterone levels both before and after a stressor suggest that caution is needed in interpreting the elevated zero maze differences seen here and elevated plus maze differences observed by Ikeda et al. Other tests of anxiety or possibly depression, such as the tail suspension test, swimming immobility, acoustic startle prepulse inhibition, marble burying, or burrowing behavior may shed additional light on the α2+/− phenotype.
Because the α2 isoform has been found throughout most brain regions in astrocytes, it is difficult to pinpoint a functional role for this isoform based solely on its expression pattern in the brain. However, during development, the α2 isoform is highly expressed in neurons throughout the mouse brain at the time of birth (Moseley et al., 2003) and expression persists in some neurons, such as in hippocampal pyramidal cells. The absence of the α2 isoform in neurons during fetal development has been associated with impaired glutamate and GABA uptake that leads to excitotoxicity and impaired neural activity and eventually death in another knock-out mouse for the Na,K-ATPase α2 isoform (Ikeda et al., 2004). It is possible that chronic reduction of the α2 isoform in neurons during development and in adult hippocampal pyramidal cells leads to impaired neural function in the adult. However, to determine whether this is a developmental or adult phenomenon will require a conditional knock-out.
We measured total cellular content of serotonin, dopamine, and norepinephrine in the striatum and hypothalamus and did not see altered levels of these monoamines in any of the Na,K-ATPase heterozygous mice compared with wild type. This finding was of interest because the Na,K-ATPase provides the Na+ gradient for the Na+-dependent uptake of GABA, glutamate, and norepinephrine (Inoue and Matsui, 1990; Pellerin and Magistretti, 1994; Masson et al., 1999; Inazu et al., 2003; Munhoz et al., 2005). It is possible that the active process of release or reuptake is impaired (rather than total cellular content), because these two processes are dependent on the activity of the Na,K-ATPase.
The α1+/− and α3+/− mice displayed more locomotor activity in response to (+)-methamphetamine challenge compared with WT mice. Dopamine-releasing reuptake inhibitors such as methamphetamine can unmask dopamine dysfunction in rodents that may not otherwise be apparent during spontaneous locomotor testing (Reed et al., 2002). The enhanced response of the α3+/− mice to methamphetamine suggests abnormalities in the dopamine and/or serotonin pathways, and future experiments could profitably be directed toward further defining the role of the α3 isoform in monoamine signaling. This is especially intriguing because other dystonias and parkinsonism are associated with dysfunctional dopamine signaling and rapid-onset dystonia parkinsonism is associated with the α3 isoform, thereby suggesting a possible connection between the α3 isoform and dopamine signal transduction (de Carvalho Aguiar et al., 2004).
We observed hippocampal-associated learning deficits in both the α2+/− and α3+/− mice. This is interesting in that the α2 isoform is expressed in glia and the α3 isoform is found in neurons, but only the α3+/− mice showed a concomitant NMDA receptor expression deficit. The α3+/− mice also showed reference memory deficits on the probe trial in the Morris water maze during the most difficult phase of testing; therefore, together with the reduced NMDA receptor expression, these mice were more severely affected than the α2+/− mice. Differences in learning performance among the gene-targeted mice suggest that the isoforms may have differential function in the hippocampus or related pathways. Therefore, subregions of the hippocampus that are important for different types of learning, i.e., such as the dorsal hippocampus that is important for spatial learning and memory (Bannerman et al., 2004) compared with the ventral hippocampus that is more important for novel-object recognition (Broadbent et al., 2004), suggests that efforts to further localize the affected regions may allow the site of the defect to be specified in greater detail.
To understand the mechanism by which a reduction in the Na,K-ATPase leads to impaired learning and memory, we examined the expression of the NMDA receptor, a glutamate-activated calcium channel associated with synaptic plasticity, and learning and memory (Cull-Candy et al., 2001). Downregulation of the NMDA receptor NR1 isoform was observed in the α3+/− mice. These results reveal that a previously unrecognized isoform-specific connection may exist between the Na,K-ATPase α3 isoform and the NMDA receptor. This could be a direct relationship because both the α3 isoform and the NMDA receptor are neural-specific genes. Because NMDA receptor signaling can be modified by neural activity (Kvajo et al., 2004), it is possible that reduced α3 isoform expression during development causes chronic depolarization of the neuron, reducing neural activity and therefore leading to NMDA receptor downregulation. Other brain regions may also be involved because different aspects of spatial mapping are mediated in different regions (Burgess et al., 2002).
In summary, the data show that specific Na,K-ATPase isoforms differentially modulate locomotor activity, anxiety-like behavior, and spatial learning and memory. The deficiencies described here are of importance because of the essential role of these enzymes in maintaining membrane electrochemical polarity. Moreover, the Na,K-ATPase isoform genes have been implicated in several human disorders (De Fusco et al., 2003; de Carvalho Aguiar et al., 2004; Goldstein et al., 2006). Recently, the Na,K-ATPase has been reported to be decreased in expression in patients with Alzheimer's disease by postmortem examination and in a transgenic mouse model of Alzheimer's disease (Chauhan et al., 1997; Hattori et al., 1998; Dickey et al., 2004). Furthermore, the expression and enzyme activity is reduced by amyloid β peptide (Harris et al., 1996; Dickey et al., 2005). Future studies focusing on defining the cellular processes in the brain to which each isoform contributes will be important for understanding the functional role of each isoform in the CNS.
Footnotes
This research was supported by National Institutes of Health Grants HL28573, HL66062, DA06733, and DA14269.
References
- Anagnostopoulos AV, Mobraaten LE, Sharp JJ, Davisson MT. Transgenic and knockout databases: behavioral profiles of mouse mutants. Physiol Behav. 2001;73:675–689. doi: 10.1016/s0031-9384(01)00525-x. [DOI] [PubMed] [Google Scholar]
- Bannerman DM, Rawlins JN, McHugh SB, Deacon RM, Yee BK, Bast T, Zhang WN, Pothuizen HH, Feldon J. Regional dissociations within the hippocampus: memory and anxiety. Neurosci Biobehav Rev. 2004;28:273–283. doi: 10.1016/j.neubiorev.2004.03.004. [DOI] [PubMed] [Google Scholar]
- Blasi JM, Cena V, Gonzalez-Garcia C, Marsal J, Solsona C. Ouabain induces acetylcholine release from pure cholinergic synaptosomes independently of extracellular calcium concentration. Neurochem Res. 1988;13:1035–1041. doi: 10.1007/BF00973147. [DOI] [PubMed] [Google Scholar]
- Bolivar V, Cook M, Flaherty L. List of transgenic and knockout mice: behavioral profiles. Mamm Genome. 2000;11:260–274. doi: 10.1007/s003350010051. [DOI] [PubMed] [Google Scholar]
- Broadbent NJ, Squire LR, Clark RE. Spatial memory, recognition memory, and the hippocampus. Proc Natl Acad Sci USA. 2004;101:14515–14520. doi: 10.1073/pnas.0406344101. [DOI] [PMC free article] [PubMed] [Google Scholar]
- Brunskill EW, Ehrman LA, Williams MT, Klanke J, Hammer D, Schaefer TL, Sah R, Dorn GW, Potter SS, Vorhees CV. Abnormal neurodevelopment, neurosignaling and behaviour in Npas3-deficient mice. Eur J Neurosci. 2005;22:1265–1276. doi: 10.1111/j.1460-9568.2005.04291.x. [DOI] [PubMed] [Google Scholar]
- Burgess N, Maguire EA, O'Keefe J. The human hippocampus and spatial and episodic memory. Neuron. 2002;35:625–641. doi: 10.1016/s0896-6273(02)00830-9. [DOI] [PubMed] [Google Scholar]
- Chauhan NB, Lee JM, Siegel GJ. Na,K-ATPase mRNA levels and plaque load in Alzheimer's disease. J Mol Neurosci. 1997;9:151–166. doi: 10.1007/BF02800498. [DOI] [PubMed] [Google Scholar]
- Clark RE, Zola SM, Squire LR. Impaired recognition memory in rats after damage to the hippocampus. J Neurosci. 2000;20:8853–8860. doi: 10.1523/JNEUROSCI.20-23-08853.2000. [DOI] [PMC free article] [PubMed] [Google Scholar]
- Clausen T. Na+-K+ pump regulation and skeletal muscle contractility. Physiol Rev. 2003;83:1269–1324. doi: 10.1152/physrev.00011.2003. [DOI] [PubMed] [Google Scholar]
- Cull-Candy S, Brickley S, Farrant M. NMDA receptor subunits: diversity, development and disease. Curr Opin Neurobiol. 2001;11:327–335. doi: 10.1016/s0959-4388(00)00215-4. [DOI] [PubMed] [Google Scholar]
- de Carvalho Aguiar P, Sweadner KJ, Penniston JT, Zaremba J, Liu L, Caton M, Linazasoro G, Borg M, Tijssen MA, Bressman SB, Dobyns WB, Brashear A, Ozelius LJ. Mutations in the Na+/K+-ATPase alpha3 gene ATP1A3 are associated with rapid-onset dystonia parkinsonism. Neuron. 2004;43:169–175. doi: 10.1016/j.neuron.2004.06.028. [DOI] [PubMed] [Google Scholar]
- De Fusco M, Marconi R, Silvestri L, Atorino L, Rampoldi L, Morgante L, Ballabio A, Aridon P, Casari G. Haploinsufficiency of ATP1A2 encoding the Na+/K+ pump alpha2 subunit associated with familial hemiplegic migraine type 2. Nat Genet. 2003;33:192–196. doi: 10.1038/ng1081. [DOI] [PubMed] [Google Scholar]
- Dickey CA, Gordon MN, Mason JE, Wilson NJ, Diamond DM, Guzowski JF, Morgan D. Amyloid suppresses induction of genes critical for memory consolidation in APP + PS1 transgenic mice. J Neurochem. 2004;88:434–442. doi: 10.1111/j.1471-4159.2004.02185.x. [DOI] [PubMed] [Google Scholar]
- Dickey CA, Gordon MN, Wilcock DM, Herber DL, Freeman MJ, Morgan D. Dysregulation of Na+/K+ ATPase by amyloid in APP+PS1 transgenic mice. BMC Neurosci. 2005;6:7. doi: 10.1186/1471-2202-6-7. [DOI] [PMC free article] [PubMed] [Google Scholar]
- Gallagher M, Burwell R, Burchinal M. Severity of spatial learning impairment in aging: development of a learning index for performance in the Morris water maze. Behav Neurosci. 1993;107:618–626. doi: 10.1037//0735-7044.107.4.618. [DOI] [PubMed] [Google Scholar]
- Gammie SC, Nelson RJ. cFOS and pCREB activation and maternal aggression in mice. Brain Res. 2001;898:232–241. doi: 10.1016/s0006-8993(01)02189-8. [DOI] [PubMed] [Google Scholar]
- Geering K. FXYD proteins: new regulators of Na-K-ATPase. Am J Physiol Renal Physiol. 2006;290:F241–F250. doi: 10.1152/ajprenal.00126.2005. [DOI] [PubMed] [Google Scholar]
- Goldstein I, Levy T, Galili D, Ovadia H, Yirmiya R, Rosen H, Lichtstein D. Involvement of Na+, K+-ATPase and endogenous digitalis-like compounds in depressive disorders. Biol Psychiatry. 2006;60:491–499. doi: 10.1016/j.biopsych.2005.12.021. [DOI] [PubMed] [Google Scholar]
- Gordon JA, Hen R. Genetic approaches to the study of anxiety. Annu Rev Neurosci. 2004;27:193–222. doi: 10.1146/annurev.neuro.27.070203.144212. [DOI] [PubMed] [Google Scholar]
- Harris ME, Wang Y, Pedigo NW, Jr, Hensley K, Butterfield DA, Carney JM. Amyloid beta peptide (25–35) inhibits Na+-dependent glutamate uptake in rat hippocampal astrocyte cultures. J Neurochem. 1996;67:277–286. doi: 10.1046/j.1471-4159.1996.67010277.x. [DOI] [PubMed] [Google Scholar]
- Hattori N, Kitagawa K, Higashida T, Yagyu K, Shimohama S, Wataya T, Perry G, Smith MA, Inagaki C. CI-ATPase and Na+/K+-ATPase activities in Alzheimer's disease brains. Neurosci Lett. 1998;254:141–144. doi: 10.1016/s0304-3940(98)00654-5. [DOI] [PubMed] [Google Scholar]
- He S, Shelly DA, Moseley AE, James PF, James JH, Paul RJ, Lingrel JB. The alpha(1)- and alpha(2)-isoforms of Na-K-ATPase play different roles in skeletal muscle contractility. Am J Physiol Regul Integr Comp Physiol. 2001;281:R917–R925. doi: 10.1152/ajpregu.2001.281.3.R917. [DOI] [PubMed] [Google Scholar]
- Holson RR. Euthanasia by decapitation: evidence that this technique produces prompt, painless unconsciousness in laboratory rodents. Neurotoxicol Teratol. 1992;14:253–257. doi: 10.1016/0892-0362(92)90004-t. [DOI] [PubMed] [Google Scholar]
- Ikeda K, Onaka T, Yamakado M, Nakai J, Ishikawa TO, Taketo MM, Kawakami K. Degeneration of the amygdala/piriform cortex and enhanced fear/anxiety behaviors in sodium pump alpha2 subunit (Atp1a2)-deficient mice. J Neurosci. 2003;23:4667–4676. doi: 10.1523/JNEUROSCI.23-11-04667.2003. [DOI] [PMC free article] [PubMed] [Google Scholar]
- Ikeda K, Onimaru H, Yamada J, Inoue K, Ueno S, Onaka T, Toyoda H, Arata A, Ishikawa TO, Taketo MM, Fukuda A, Kawakami K. Malfunction of respiratory-related neuronal activity in Na+, K+-ATPase α2 subunit-deficient mice is attributable to abnormal Cl− homeostasis in brainstem neurons. J Neurosci. 2004;24:10693–10701. doi: 10.1523/JNEUROSCI.2909-04.2004. [DOI] [PMC free article] [PubMed] [Google Scholar]
- Inazu M, Takeda H, Matsumiya T. Functional expression of the norepinephrine transporter in cultured rat astrocytes. J Neurochem. 2003;84:136–144. doi: 10.1046/j.1471-4159.2003.01514.x. [DOI] [PubMed] [Google Scholar]
- Inoue N, Matsui H. Activation of a brain type Na pump after glutamate excitation of cerebral neurons. Brain Res. 1990;534:309–312. doi: 10.1016/0006-8993(90)90146-3. [DOI] [PubMed] [Google Scholar]
- James PF, Grupp IL, Grupp G, Woo AL, Askew GR, Croyle ML, Walsh RA, Lingrel JB. Identification of a specific role for the Na,K-ATPase alpha 2 isoform as a regulator of calcium in the heart. Mol Cell. 1999;3:555–563. doi: 10.1016/s1097-2765(00)80349-4. [DOI] [PubMed] [Google Scholar]
- Jewell EA, Lingrel JB. Comparison of the substrate dependence properties of the rat Na,K-ATPase alpha 1, alpha 2, and alpha 3 isoforms expressed in HeLa cells. J Biol Chem. 1991;266:16925–16930. [PubMed] [Google Scholar]
- Johnson SW, Seutin V, North RA. Burst firing in dopamine neurons induced by N-methyl-d-aspartate: role of electrogenic sodium pump. Science. 1992;258:665–667. doi: 10.1126/science.1329209. [DOI] [PubMed] [Google Scholar]
- Kaplan JH. Biochemistry of Na,K-ATPase. Annu Rev Biochem. 2002;71:511–535. doi: 10.1146/annurev.biochem.71.102201.141218. [DOI] [PubMed] [Google Scholar]
- Kirk RE. Pacific Grove, CA: Brooks/Cole; 1995. Experimental design: procedures for the behavioral sciences. [Google Scholar]
- Koprich JB, Campbell NG, Lipton JW. Neonatal 3,4-methylenedioxymethamphetamine (ecstasy) alters dopamine and serotonin neurochemistry and increases brain-derived neurotrophic factor in the forebrain and brainstem of the rat. Dev Brain Res. 2003;147:177–182. doi: 10.1016/s0165-3806(03)00219-0. [DOI] [PubMed] [Google Scholar]
- Kvajo M, Albrecht H, Meins M, Hengst U, Troncoso E, Lefort S, Kiss JZ, Petersen CC, Monard D. Regulation of brain proteolytic activity is necessary for the in vivo function of NMDA receptors. J Neurosci. 2004;24:9734–9743. doi: 10.1523/JNEUROSCI.3306-04.2004. [DOI] [PMC free article] [PubMed] [Google Scholar]
- Masson J, Sagne C, Hamon M, El Mestikawy S. Neurotransmitter transporters in the central nervous system. Pharmacol Rev. 1999;51:439–464. [PubMed] [Google Scholar]
- McGrail KM, Phillips JM, Sweadner KJ. Immunofluorescent localization of three Na,K-ATPase isozymes in the rat central nervous system: both neurons and glia can express more than one Na,K-ATPase. J Neurosci. 1991;11:381–391. doi: 10.1523/JNEUROSCI.11-02-00381.1991. [DOI] [PMC free article] [PubMed] [Google Scholar]
- Mizumori SJ, Sakai DH, Rosenzweig MR, Bennett EL, Wittreich P. Investigations into the neuropharmacological basis of temporal stages of memory formation in mice trained in an active avoidance task. Behav Brain Res. 1987;23:239–250. doi: 10.1016/0166-4328(87)90024-6. [DOI] [PubMed] [Google Scholar]
- Moseley AE, Lieske SP, Wetzel RK, James PF, He S, Shelly DA, Paul RJ, Boivin GP, Witte DP, Ramirez JM, Sweadner KJ, Lingrel JB. The Na,K-ATPase alpha 2 isoform is expressed in neurons, and its absence disrupts neuronal activity in newborn mice. J Biol Chem. 2003;278:5317–5324. doi: 10.1074/jbc.M211315200. [DOI] [PubMed] [Google Scholar]
- Munhoz CD, Kawamoto EM, de Sa LL, Lepsch LB, Glezer I, Marcourakis T, Scavone C. Glutamate modulates sodium-potassium-ATPase through cyclic GMP and cyclic GMP-dependent protein kinase in rat striatum. Cell Biochem Funct. 2005;23:115–123. doi: 10.1002/cbf.1217. [DOI] [PubMed] [Google Scholar]
- Orlowski J, Lingrel JB. Tissue-specific and developmental regulation of rat Na,K-ATPase catalytic alpha isoform and beta subunit mRNAs. J Biol Chem. 1988;263:10436–10442. [PubMed] [Google Scholar]
- Paxinos G, Franklin KBJ. Amsterdam: Elsevier; 2004. The mouse brain in stereotaxic coordinates (second compact edition) [Google Scholar]
- Pellerin L, Magistretti PJ. Glutamate uptake into astrocytes stimulates aerobic glycolysis: a mechanism coupling neuronal activity to glucose utilization. Proc Natl Acad Sci USA. 1994;91:10625–10629. doi: 10.1073/pnas.91.22.10625. [DOI] [PMC free article] [PubMed] [Google Scholar]
- Pressley TA. Phylogenetic conservation of isoform-specific regions within alpha-subunit of Na(+)-K(+)-ATPase. Am J Physiol. 1992;262:C743–C751. doi: 10.1152/ajpcell.1992.262.3.C743. [DOI] [PubMed] [Google Scholar]
- Reed TM, Repaske DR, Snyder GL, Greengard P, Vorhees CV. Phosphodiesterase 1B knock-out mice exhibit exaggerated locomotor hyperactivity and DARPP-32 phosphorylation in response to dopamine agonists and display impaired spatial learning. J Neurosci. 2002;22:5188–5197. doi: 10.1523/JNEUROSCI.22-12-05188.2002. [DOI] [PMC free article] [PubMed] [Google Scholar]
- Sato T, Tanaka K, Ohnishi Y, Teramoto T, Irifune M, Nishikawa T. Effects of steroid hormones on (Na+, K+)-ATPase activity inhibition-induced amnesia on the step-through passive avoidance task in gonadectomized mice. Pharmacol Res. 2004;49:151–159. doi: 10.1016/j.phrs.2003.09.006. [DOI] [PubMed] [Google Scholar]
- Segall L, Daly SE, Blostein R. Mechanistic basis for kinetic differences between the rat alpha 1, alpha 2, and alpha 3 isoforms of the Na,K-ATPase. J Biol Chem. 2001;276:31535–31541. doi: 10.1074/jbc.M103720200. [DOI] [PubMed] [Google Scholar]
- Shamraj OI, Lingrel JB. A putative fourth Na+, K+-ATPase alpha-subunit gene is expressed in testis. Proc Natl Acad Sci USA. 1994;91:12952–12956. doi: 10.1073/pnas.91.26.12952. [DOI] [PMC free article] [PubMed] [Google Scholar]
- Shepherd JK, Grewal SS, Fletcher A, Bill DJ, Dourish CT. Behavioural and pharmacological characterization of the elevated “zero-maze” as an animal model of anxiety. Psychopharmacology. 1994;116:56–64. doi: 10.1007/BF02244871. [DOI] [PubMed] [Google Scholar]
- Shull GE, Greeb J, Lingrel JB. Molecular cloning of three distinct forms of the Na+,K+-ATPase alpha-subunit from rat brain. Biochemistry. 1986;25:8125–8132. doi: 10.1021/bi00373a001. [DOI] [PubMed] [Google Scholar]
- Steffens M, Feuerstein TJ. Receptor-independent depression of DA and 5-HT uptake by cannabinoids in rat neocortex: involvement of Na+/K+-ATPase. Neurochem Int. 2004;44:529–538. doi: 10.1016/j.neuint.2003.08.009. [DOI] [PubMed] [Google Scholar]
- Vaillend C, Mason SE, Cuttle MF, Alger BE. Mechanisms of neuronal hyperexcitability caused by partial inhibition of Na+-K+-ATPases in the rat CA1 hippocampal region. J Neurophysiol. 2002;88:2963–2978. doi: 10.1152/jn.00244.2002. [DOI] [PubMed] [Google Scholar]
- Vatta M, Pena C, Fernandez BE, Rodriguez de Lores AG. Endobain E, a brain Na+, K+-ATPase inhibitor, decreases norepinephrine uptake in rat hypothalamus. Life Sci. 2004;76:359–365. doi: 10.1016/j.lfs.2004.09.004. [DOI] [PubMed] [Google Scholar]
- Vorhees CV, Williams MT. Morris water maze: procedures for assessing spatial and related forms of learning and memory. Nat Protocols. 2006;1:848–858. doi: 10.1038/nprot.2006.116. [DOI] [PMC free article] [PubMed] [Google Scholar]
- Weisstaub NV, Zhou M, Lira A, Lambe E, Gonzalez-Maeso J, Hornung JP, Sibille E, Underwood M, Itohara S, Dauer WT, Ansorge MS, Morelli E, Mann JJ, Toth M, Aghajanian G, Sealfon SC, Hen R, Gingrich JA. Cortical 5-HT2A receptor signaling modulates anxiety-like behaviors in mice. Science. 2006;313:536–540. doi: 10.1126/science.1123432. [DOI] [PubMed] [Google Scholar]
- Williams MT, Blankenmeyer TL, Schaefer TL, Brown CA, Gudelsky GA, Vorhees CV. Long-term effects of neonatal methamphetamine exposure in rats on spatial learning in the Barnes maze and on cliff avoidance, corticosterone release, and neurotoxicity in adulthood. Dev Brain Res. 2003a;147:163–175. doi: 10.1016/j.devbrainres.2003.11.001. [DOI] [PubMed] [Google Scholar]
- Williams MT, Moran MS, Vorhees CV. Refining the critical period for methamphetamine-induced spatial deficits in the Morris water maze. Psychopharmacology. 2003b;168:329–338. doi: 10.1007/s00213-003-1433-y. [DOI] [PubMed] [Google Scholar]
- Zhan H, Tada T, Nakazato F, Tanaka Y, Hongo K. Spatial learning transiently disturbed by intraventricular administration of ouabain. Neurol Res. 2004;26:35–40. doi: 10.1179/016164104773026507. [DOI] [PubMed] [Google Scholar]