

Abstract
Loss-of-function mutations of NaV1.1 channels cause severe myoclonic epilepsy in infancy (SMEI), which is accompanied by severe ataxia that contributes substantially to functional impairment and premature deaths. Mutant mice lacking NaV1.1 channels provide a genetic model for SMEI, exhibiting severe seizures and premature death on postnatal day 15. Behavioral assessment indicated severe motor deficits in mutant mice, including irregularity of stride length during locomotion, impaired motor reflexes in grasping, and mild tremor in limbs when immobile, consistent with cerebellar dysfunction. Immunohistochemical studies showed that NaV1.1 and NaV1.6 channels are the primary sodium channel isoforms expressed in cerebellar Purkinje neurons. The amplitudes of whole-cell peak, persistent, and resurgent sodium currents in Purkinje neurons were reduced by 58–69%, without detectable changes in the kinetics or voltage dependence of channel activation or inactivation. Nonlinear loss of sodium current in Purkinje neurons from heterozygous and homozygous mutant animals suggested partial compensatory upregulation of NaV1.6 channel activity. Current-clamp recordings revealed that the firing rates of Purkinje neurons from mutant mice were substantially reduced, with no effect on threshold for action potential generation. Our results show that NaV1.1 channels play a crucial role in the excitability of cerebellar Purkinje neurons, with major contributions to peak, persistent, and resurgent forms of sodium current and to sustained action potential firing. Loss of these channels in Purkinje neurons of mutant mice and SMEI patients may be sufficient to cause their ataxia and related functional deficits.
Keywords: ataxia, sodium channels, Purkinje, excitability, epilepsy, mouse model
Introduction
Voltage-gated sodium channels initiate action potentials in neurons. NaV1.1, NaV1.2, and NaV1.6 channels are abundant in adult brain (Catterall, 2000; Goldin et al., 2000; Goldin, 2001; Trimmer and Rhodes, 2004). NaV1.1 channels are primarily localized in cell bodies (Westenbroek et al., 1989, 1992), NaV1.2 channels in unmyelinated axons and dendrites (Westenbroek et al., 1989, 1992; Gong et al., 1999), and NaV1.6 channels in myelinated axons and in dendrites (Caldwell et al., 2000; Krzemien et al., 2000; Jenkins and Bennett, 2001). These channels participate in generation of both somatodendritic and axonal action potentials (Stuart and Sakmann, 1994; Johnston et al., 1996; Callaway and Ross, 1997; Raman and Bean, 1999b; Khaliq and Raman, 2006).
Mutations that affect the function or expression of sodium channel subtypes are responsible for inherited cardiac arrhythmias and neurological disorders (Waxman, 2001; Ptácek and Fu, 2004; George, 2005; Meisler and Kearney, 2005). Missense mutations in NaV1.1 channels cause GEFS+ (generalized epilepsy with febrile seizures plus), a dominantly inherited seizure disorder (Escayg et al., 2001; Wallace et al., 2001), and loss-of-function mutations in NaV1.1 channels cause severe myoclonic epilepsy in infancy (SMEI; Dravet's syndrome), which is genetically dominant (Sugawara et al., 2002; Claes et al., 2003; Fukuma et al., 2004). Like SMEI patients, knock-out (KO) mice lacking NaV1.1 channels suffer severe epilepsy and premature death (Yu et al., 2006). Sodium currents are reduced in hippocampal GABAergic interneurons but not in excitatory pyramidal neurons (Yu et al., 2006). Loss of excitability of inhibitory interneurons would allow hyperexcitability of dentate granule and pyramidal neurons, and this gain-of-function effect may cause epilepsy that is genetically dominant.
Ataxia, spasticity, and failure of motor coordination contribute substantially to the developmental delay and functional impairments of SMEI patients and are major determinants of their poor quality of life, burden of care, and premature deaths (www.ilae-epilepsy.org/ctf/dravet.html) (Dravet et al., 2005). However, reduced sodium current in hippocampal interneurons would be unlikely to cause these deficits. How might loss of NaV1.1 channels cause ataxia, spasticity, and failure of motor coordination? We used our mouse genetic model of SMEI to investigate the relationship between loss of NaV1.1 channels and ataxia, based on the hypothesis that deletion of the NaV1.1 channel reduces the excitability of GABAergic Purkinje neurons, which are the output pathway for information on movement, coordination, and balance from the cerebellar cortex. Degeneration of Purkinje neurons and abnormal expression of voltage-gated ion channels in them are associated with ataxia (Fletcher et al., 1996; Raman and Bean, 1997; Grusser-Cornehls and Baurle, 2001; Sausbier et al., 2004). Here, we report that both NaV1.1 KO and heterozygous (HET) mice are ataxic and that the sodium currents and electrical excitability of their Purkinje neurons are sharply reduced, consistent with the conclusion that loss of Purkinje neuron excitability may be sufficient to cause ataxia in these mice and potentially in SMEI patients. These results support the hypothesis that loss of sodium currents in different classes of GABAergic neurons may underlie the distinct functional impairments in SMEI.
Materials and Methods
All experiments with animals were performed in accordance with animal protocols approved by the Institutional Animal Care and Use Committee of the University of Washington.
Generation of NaV1.1 mutant mice.
The mutant mice used in this study were generated by targeted deletion of the last exon encoding domain IV from the S3 to S6 segment and the entire C-terminal tail of NaV1.1 channel as described previously (Yu et al., 2006). The animals used in this study were generated by breeding NaV1.1 heterozygous pairs of mixed C57BL/6 and 129Sv background and used at postnatal day 13 (P13) to P21. In all the experiments described here, NaV1.1(+/+), NaV1.1(+/−), and NaV1.1(−/−) mice were genotyped using a four-oligonucleotide multiplex PCR of genomic DNA samples isolated from mouse tails (Wu et al., 1995). The wild-type (WT) band (291 bp) was amplified by FHY209 (5′-CGAATCCAGATGGAAGAGCGGTTCATGGCT-3′) and FHY210 (5′-ACAAGCTGCTATGGACATTGTCAGGTCAGT-3′), and the mutant band (493 bp) was amplified by Neo5 (5′-AGGATCTCCTGTCATCTCACCTTGCTCCTG-3′) and Neo3 (5′-AAGAACTCGTCAAGAAGGCGATAGAAGGCG-3′). The two primer sets were mixed in a single PCR using the protocol: 2 min denaturation at 94°C followed by 30 cycles of 20 s at 95°C, 20 s at 66°C, and 30 s at 71°C. PCR products were analyzed by agarose gel electrophoresis.
Immunohistochemistry.
Protocols previously described by Westenbroek et al. (1995, 1998) were used to examine the distribution of voltage-gated sodium channels in cerebellar Purkinje neurons of P13–P14 mice. This age range was chosen for all our experiments because the homozygous NaV1.1 KO mice die at P15. Mice were deeply anesthetized with halothane and perfused with ice-cold 4.0% paraformaldehyde in 0.1 m PBS, pH 7.4. Brains were immediately removed, postfixed, and cryoprotected in 30% sucrose. Fifty micrometer sagittal cerebellar sections were cut on a sliding frozen microtome and placed in PBS. Free-floating tissue sections were rinsed in TB for 30 min, in TBS for 30 min, in 2% avidin-based blocking solution for 30 min, in TBS for 30 min, in 2% biotin blocking solution for 30 min, and finally rinsed in TBS. The sections were then incubated in the following peptide affinity-purified primary antibodies: anti-NaV1.1, anti-NaV1.3 (15 μg/ml; Chemicon, Temecula, CA), anti-NaV1.6 (15 μg/ml; Alomone, Jerusalem, Israel) antibodies for 36 h at 4°C. After primary antibody incubation, the sections were washed in TBS for 1 h and immersed in the biotinylated secondary antibody for 1 h at 37°C, rinsed, incubated in avidin D fluorescein for 1 h at 37°C, rinsed, mounted onto gelatin-coated slides, coverslipped with Vectashield, and imaged using a Leica SL (Leica, Nussloch, Germany) confocal microscope located in the W. M. Keck Imaging Facility at the University of Washington. In control experiments, the primary antiserum was either omitted or replaced with normal rabbit serum during the staining protocol.
Measurement of ataxia.
Cerebellar ataxia is characterized by instability of posture and gait, incoordination, atactic reaching and grasp, tremor, dysmetria, muscular hypotonia, and impairment of fine control of movements (Grusser-Cornehls and Baurle, 2001). To evaluate these impairments, WT mice and their mutant littermates (P13–P21) were subjected to a set of behavioral tests. To assess the motor coordination and gaiting, we used a modified foot-printing test. We constructed a cardboard tunnel (40 cm long) on a Plexiglas platform and elevated the platform ∼40 cm above the bench. Video records of the mouse walking in the tunnel were collected from underneath the Plexiglas using a digital camcorder. Still-frame pictures of the mouse during footsteps on the Plexiglas were extracted from the digital videos and analyzed for stride length, width, and distance between ipsilateral forepaw and hindpaw placements. To evaluate motor reflexes, gross body coordination, and reaching motion, tail suspension tests were performed. Mice were suspended by their tails for 8 s ∼1 cm above the wire cagetop, allowing them to attempt to reach for the wire bars. The time during which the animal was intentionally reaching for the bar was measured, and the general body posture was examined.
Cell dissociation.
Cerebellar Purkinje neurons were acutely dissociated from P13–P14 mice using procedures modified from those of Cantrell et al. (1996) and Raman and Bean (1997). Animals were deeply anesthetized with halothane before decapitation. The brain was quickly removed from the skull and submerged in an ice-cold dissection solution composed of 82 mm Na2SO4, 30 mm K2SO4, 5 mm MgCl2·6H2O, 10 mm HEPES, 10 mm d-glucose, 0.001% phenol red, at pH 7.4 and bubbled with 95% O2/5% CO2. The cerebellum was separated from the rest of the brain, and its vermis was trimmed off and mounted on the chilled stage of the slicing chamber. The chamber was subsequently filled with an ice-cold slush of dissection solution bubbled with O2/CO2. Four hundred-micrometer-thick sagittal slices of the cerebellar vermis were prepared on a Leica VT 1000S vibrating microtome and stored at room temperature for at least 1 h in a holding chamber containing a solution composed of the following (in mm): 126 NaCl, 2.5 KCl, 2 MgCl2·6H20, 2 CaCl2, 1.25 NaH2PO4, 26 NaHCO3, 10 glucose, 1 pyruvic acid, and saturated with O2/CO2. Typically, three to five slices were obtained from each brain. As needed, one or two slices were transferred from the holding to the enzyme chamber, treated with 1.5 mg/ml protease type XIV (Sigma, St. Louis, MO), and rinsed in dissection solution containing trypsin inhibitor (1 mg/ml) and bovine serum albumin (1 mg/ml). The digested slice was then stored in Tyrode's solution composed of the following (in mm): 150 NaCl, 4 KCl, 2 CaCl2, 2 MgCl2, 10 HEPES, 10 glucose, at pH 7.4. To isolate the neurons, the slices were cut into small chunks, transferred to a 15 ml conical tube and triturated with a fire-polished pipette. Dissociated cells were plated on a poly-d-lysine-coated coverslip on the bottom of a 35 mm dish and allowed to settle for at least 15 min.
Electrophysiology.
Isolated cerebellar Purkinje cells were visually identified based on their large, pear-shaped soma. Whole-cell voltage- and current-clamp recordings were obtained using an Axopatch 200B amplifier (Molecular Devices, Union City, CA) and Pulse software (HEKA Electronics, Lambrecht/Pfalz, Germany). Recording glass pipettes had resistances of 2–4 MΩ. In voltage-clamp experiments, before compensation of whole-cell capacitance, cells were held at −70 mV and a 10 mV voltage hyperpolarizing step was applied. Cell capacitance (C m) was calculated using the equation C m = Q/V, where Q is the charge measured by integrating the capacitative current evoked with the pulse. Whole-cell capacitance was then compensated and series resistance was compensated by >90%. To remove additional linear capacity and leakage currents when measuring persistent and resurgent currents, a subthreshold depolarization of a single magnitude (e.g., −90 to −85 mV for current–voltage relationships) was scaled appropriately and subtracted from the current trace to each test potential. Whole-cell sodium currents were recorded with an intracellular solution composed of the following (in mm): 112 CsCl, 5 NaCl, 9 EGTA, 9 HEPES, 1.8 MgCl2, 14 Tris-creatine PO4, 4 Mg-ATP, 0.3 Tris-GTP, at pH 7.4. The extracellular solution contained the following: 20 mm NaCl, 10 mm HEPES, 2 mm BaCl2, 300 μm CdCl2, 140 mm tetraethylammonium-Cl, at pH 7.4. This low (20 mm) sodium concentration was used to improve control of the cell membrane voltage during voltage-clamp experiments on Purkinje neurons, which produce large sodium currents (Afshari et al., 2004). For recording resurgent currents, sodium concentration in the extracellular solution was raised to 50 mm to produce larger currents that could be analyzed more accurately and tetraethylammonium-Cl was reduced to 110 mm. Conductance–voltage (g–V) relationships were calculated from the current–voltage (I–V) relationships according to g = I Na/(V − E Na), where I Na represents the peak sodium current measured at potential V, and E Na represents the calculated equilibrium potential. Normalized activation and inactivation curves were fitted to Boltzmann relationships of the form: y = 1/(1 + exp [(V − V 1/2)/k]) + A, where y is normalized g Na or I Na, A is the baseline, V is the membrane potential, V 1/2 is the voltage of half-maximal activation, V a, or inactivation, V h, and k is a slope factor. In fitting activation curves, A was fixed at 0. Analyses were performed using Igor Pro 5.0 (Wavemetrics, Lake Oswego, OR). Statistical results are reported as mean ± SEM. Statistical significance for comparisons of the three genotypes were performed using one-way ANOVA followed by Tukey's post test. Comparisons of effects of two genotypes were performed with unpaired Student's t test. For the experiments of Figure 8 in which the effects of tetrodotoxin (TTX) were tested, a paired Student's t test was used. The threshold p value for statistical significance was 0.05.
Figure 8.

Spontaneous firing after partial blockade of sodium current with TTX. A, Representative examples of spontaneous action potential trains before, during, and after application of 10 nm TTX to a Purkinje neuron from a WT mouse. B, Top, Expanded and superimposed individual action potentials from recordings in A. Bottom, Mean action potential threshold in control and in the presence of TTX. Threshold was increased from −52.8 ± 0.4 to −48.5 ± 0.3 mV. The spontaneous firing rate was reduced from 65.5 ± 2.4 to 48.3 ± 5.0 Hz (p = 0.013) and peak voltage 26.6 ± 0.2 to 11.4 ± 0.2 mV (p = 0.02). Action potential minimum voltage did not change significantly in these experiments (−72.0 ± 0.7 mV in control solution vs −71.1 ± 0.4 mV in TTX; p = 0.083). Error bars indicate SEM. *p < 0.05.
In current-clamp experiments, spontaneous activity and firing patterns during series of depolarizations and hyperpolarizations (800 ms duration; 10 pA increments) were recorded from cells. The internal solution contained the following (in mm): 117 K-methanesulfonate, 9 EGTA, 9 HEPES, 1.8 MgCl2·6H2O, 15 sucrose, 14 Tris-creatine PO4, 4 MgATP, 0.3 Tris-GTP, 5 KCl. The external solution was composed of the following (in mm): 150 NaCl, 4 KCl, 2 CaCl2, 2 MgCl2·6H2O, 10 HEPES, 10 glucose. Action potential threshold, peak voltage, minimum voltage, and the input–output relationship were determined from current-clamp recordings. The action potential threshold was identified as the voltage corresponding to the peak of the third derivative of the action potential waveform. The input–output relationship was defined as the relationship between the amplitude of current injected and the number of action potentials generated. In these experiments, cells were allowed to fire spontaneously from their resting membrane potential before applying a family of 500 ms current injections of increasing amplitude, as described in the figure legends. Increasing depolarizing current was injected until failure of action potential firing because of depolarization block. Increasing hyperpolarizing current was injected until action potential firing failed because of hyperpolarization block.
Results
Expression of sodium channels in cerebellar Purkinje neurons
Mutant mice were generated by targeted disruption of Scn1a gene encoding NaV1.1 channels as described in Materials and Methods (Yu et al., 2006). We used immunohistochemistry to compare the expression of the major brain sodium channels (NaV1.1, NaV1.2, NaV1.3, and NaV1.6) in cerebellar Purkinje neurons of WT and NaV1.1-deficient mice on P13–P14, a day before death of the KO mice. Anti-NaV1.1 antibodies showed strong immunolabeling of the cell bodies of Purkinje neurons of WT mice (Fig. 1 A1), similar to previous studies (Westenbroek et al., 1989; Gong et al., 1999). Labeling of the initial segment of the axons of Purkinje neurons with anti-NaV1.1 antibodies is also visible in these images projecting below the cell body and continuing until the axons leave the plane of focus (Fig. 1 A1). In a similar study published after submission of this paper (Ogiwara et al., 2007), stronger staining of axons and less intense staining of cell bodies was observed for Purkinje neurons, in contrast to our work and previous studies (Westenbroek et al., 1989; Gong et al., 1999). Antibodies directed to different epitopes were used in these studies, so it is conceivable that the different relative intensity of staining of cell bodies versus axons may relate to different accessibility of these epitopes in cell bodies versus axons.
Figure 1.
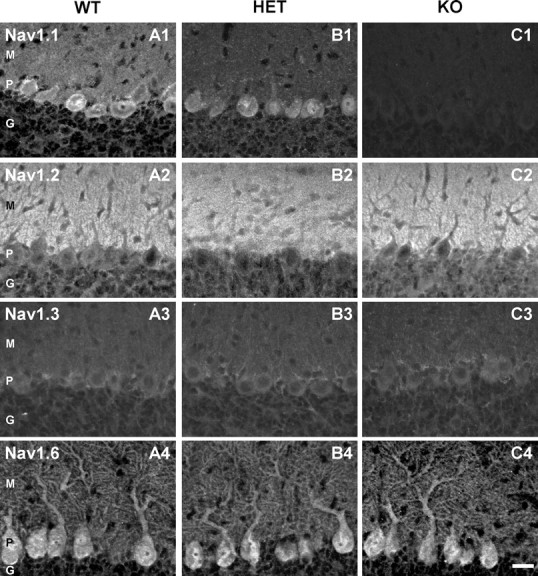
Distribution of NaV1.1, NaV1.2, NaV1.3, and NaV1.6 in cerebellar slices of P14 NaV1.1 WT, HET, and KO mice. A1–A4, Antibody staining indicated that NaV1.1 is found in the cell bodies and NaV1.6 in cells bodies and dendrites of Purkinje neurons. NaV1.2 and NaV1.3 were not detected in Purkinje neuron cell bodies or dendrites. However, the marked staining of the molecular layer by the anti-NaV1.2 indicates the presence of NaV1.2 in the parallel fibers traversing this part of the cerebellum. B1–B4, Antibody staining illustrating the decrease of NaV1.1 channel expression in Purkinje neurons of HET mice. C1–C4, Antibody staining illustrating complete loss of NaV1.1 expression in cerebellar Purkinje neurons of NaV1.1 KO mice without detectable upregulation of NaV1.2 or NaV1.3 channels. Control sections with no primary antibody or with nonimmune primary antibody did not show detectable staining. For examples of control sections using the same antibodies and methods, see Yu et al. (2006), their supplemental information. Scale bar, 50 μm. M, Molecular layer; P, Purkinje cell layer; G, granule cell layer.
Anti-NaV1.6 labeled both the cell body and dendrites (Fig. 1 A4). In contrast, anti-NaV1.2 antibodies stained the axons of granule cells in the molecular layer (Fig. 1 A2), and anti-NaV1.3 staining was barely detectable in the Purkinje cell body layer, but not in Purkinje cells themselves (Fig. 1 A3). These results indicate that NaV1.1 and NaV1.6 are the predominant sodium channels in the cell bodies and dendrites of Purkinje neurons, in agreement with previous work (Westenbroek et al., 1989; Gong et al., 1999; Caldwell et al., 2000; Jenkins and Bennett, 2001; Schaller and Caldwell, 2003). The observed distribution of NaV channels in P13–P14 cerebellar neurons in our experiments indicates that NaV1.1 and NaV1.6 channels conduct nearly all sodium current in Purkinje neurons in this age range.
Purkinje neuron somata in NaV1.1(+/−) (HET) mice stained less intensely by anti-NaV1.1, and there was no detectable staining of cell bodies or dendrites in NaV1.1 KO mice (Fig. 1 B1,C1). Anti-NaV1.6 antibody gave strong staining of the somata and the proximal and distal dendrites of cerebellar Purkinje neurons of all genotypes (Fig. 1 A4,B4,C4). Quantitative analysis of fluorescent intensity of Purkinje cell bodies did not reveal detectable upregulation of the number of NaV1.6 channels. Antibodies against NaV1.2 (Fig. 1 A2,B2,C2) and NaV1.3 (Fig. 1 A3,B3,C3) channels showed no staining in Purkinje neurons of any genotype. Thus, the loss of NaV1.1 channels is complete in KO mice, and there is no detectable upregulation of NaV1.2, NaV1.3, or NaV1.6 channels in Purkinje cell bodies.
Evaluation of ataxic phenotype
NaV1.1 KO mice can be distinguished from WT and HET littermates starting at P9–P10, as they begin to exhibit signs of ataxia and seizure phenotypes. These symptoms gradually become more pronounced in the following days and the NaV1.1 KO animals die on P15 (Yu et al., 2006). To quantify the ataxic phenotype in NaV1.1 HET and KO mice, we performed behavioral tests to evaluate their gait, coordination, and motor reflexes. General examination of the animals indicated that 100% of NaV1.1 KO mice exhibited mild limb tremors during standing and loss of body balance while walking. Assessment of gait and coordination (see Materials and Methods) revealed uncoordinated movements of the NaV1.1 KO mice that are apparent when comparing video frames illustrating consecutive footsteps of NaV1.1 WT and HET mice (Fig. 2 A). The tight control of stride length for the WT (2.5–4.0 cm range) and HET (2–3.5 cm range) mice contrasts sharply with highly irregular stride lengths in KO mice (0–4.0 cm), clearly illustrating their ataxic gait. The mean stride length was shorter in KO animals: 2.1 ± 0.4 cm (n = 8) versus 3.5 ± 0.5 cm (n = 20) in WT (p < 0.0001) and 3.2 ± 0.4 cm (n = 17) in HET mice (Fig. 2 B). To assess stride length variability among genotypes, we compared the coefficients of variation for mice within each group: 0.5 for KO mice (n = 8), 0.06 for HET mice (n = 20), and 0.06 (n = 17) for WT. These results demonstrate that stride length is ninefold more irregular in KO animals than in HET or WT mice.
Figure 2.
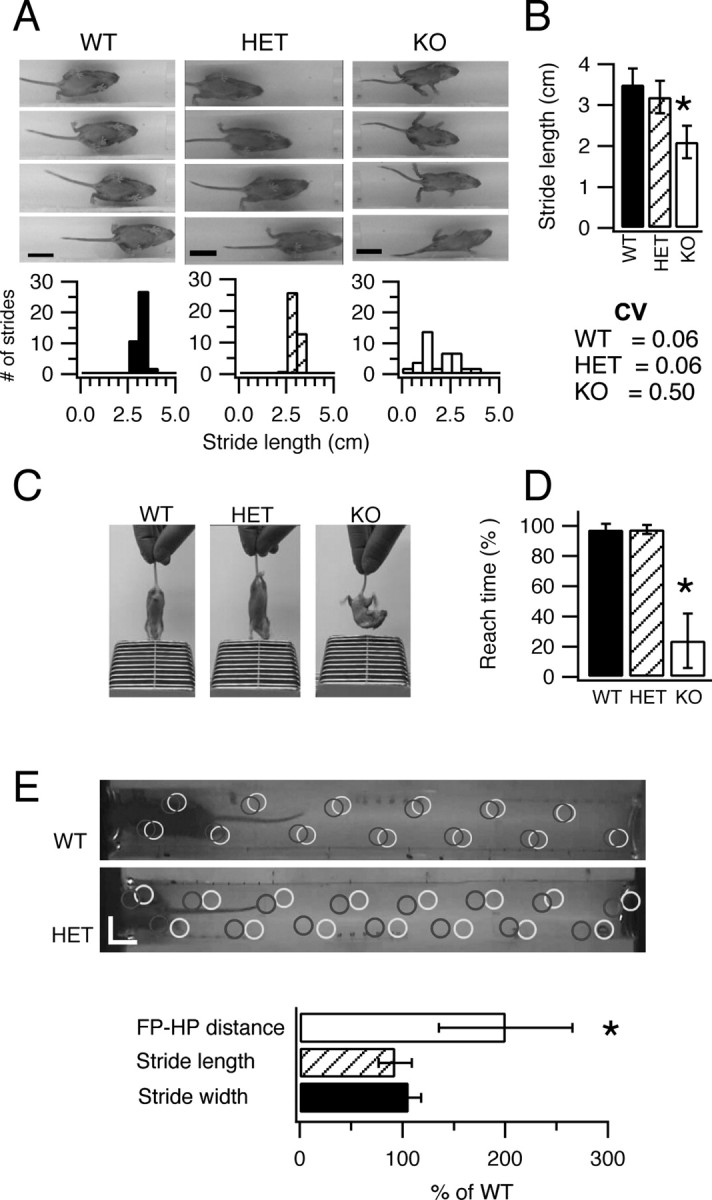
Motor performance of WT, HET, and KO mice. A, B, Evaluation of motor coordination for P14 mice using a modified footprint test (see Materials and Methods). A, Top, Digital pictures illustrating consecutive footsteps of representative NaV1.1 WT, HET, and KO mice. Bottom, Histograms showing the variability in stride length for each of these exemplar mice. B, Summary stride length and stride length variability of NaV1.1 WT, HET, and KO mice (CV, coefficient of variation). C, D, Evaluation of motor reflex using the tail suspension test. C, Example pictures of mice performing the reaching test. D, Summary data showing the time spent reaching for the cage bars for NaV1.1 WT, HET, and KO mice. E, Evaluation of motor coordination for P21 mice in a modified footprint test. Top, Representative digital pictures with marks showing placements of paws (gray circles for hindpaws; black for forepaws) as mice walked through the tunnel. Scale bars, 2 cm. Bottom, Summary of distance between ipsilateral forepaw and hindpaw position (FP–HP), stride length, and stride width for HET mice normalized versus WT mice. Error bars indicate SEM. *p < 0.02.
We also determined the motor reflexes of the mice using tail suspension above the wire lid of a cage (see Materials and Methods). When raised by their tails above a cage lid for 8 s, HET and WT mice exhibited a reflex response in which they reach downward for the cage lid with outstretched forelimbs (Fig. 2 C). In contrast, KO mice exhibited a curved body posture for most of the time and did not reach for the lid. KO mice showed the reflex response only 23.8 ± 0.3% (n = 8) of the 8 s test time, whereas the WT and HET mice exhibited the reflex reaching response during 97.4 ± 0.4% (n = 9) and 97.6 ± 0.2% (n = 7) of the test time, respectively (Fig. 2 D).
SMEI patients are heterozygous for loss-of-function mutations in NaV1.1 channels, and this haploinsufficiency of NaV1.1 channels leads to ataxia. Because our initial tests of ataxia did not reveal deficits in HET mice at P14, we analyzed older mice after weaning at P21, which is more comparable in developmental time frame to infants at 1–2 years when ataxia first appears in human SMEI. In these experiments, we analyzed the pattern of walking of WT and HET mice to detect subtle differences that may be caused by haploinsufficiency of NaV1.1 channels (Fig. 2 E). Neither stride length nor stride width was affected in HETs (Fig. 2 E, bottom). In contrast, the accuracy of placement of the hindpaws in the same positions on the surface as the forepaws in walking was significantly impaired, with approximately twofold larger deviation in paw placement in HETs (19.0 ± 6 mm; n = 8) versus WT (9.2 ± 3 mm; n = 7) (Fig. 2 E, bottom) (p = 0.01). Moreover, the variation in paw placement was significantly greater for HETs compared with WT, as measured by the coefficient of variation of the distance between the position of placement of the hindpaws and forepaws [CV = 0.64 for HETs (n = 8) vs CV = 0.31 for WTs (n = 7); p < 0.02]. These results show that NaV1.1 HETs have significant ataxia at P21, similar to the developmental stage at which ataxia becomes noticeable in SMEI patients.
Reduced whole-cell sodium current in Purkinje neurons from HET and KO mice
NaV1.1 channels are primarily located in the cell bodies of Purkinje neurons (Westenbroek et al., 1989) (Fig. 1). Therefore, it is likely that deletion of NaV1.1 channels will have important effects on the excitability of the Purkinje cell somata. To measure the sodium current in the somata of cerebellar Purkinje neurons of NaV1.1 WT and mutant mice, we compared the whole-cell currents from acutely dissociated neurons from each genotype (Fig. 3 A). Cerebellar Purkinje neurons were visually identified based on their large, pear-shaped cell bodies (Fig. 3 B). We began each recording by measuring cell capacitance using a −10 mV hyperpolarizing step from the holding potential. Cells from WT, HET, and KO mice were similar in capacitance: 25.8 ± 3 pF (n = 11), 25.6 ± 4 pF (n = 23), and 24.1 ± 5 pF (n = 10), respectively (Fig. 3 B). Sodium currents were recorded during pulses to a series of test potentials from a holding potential of −90 mV (Fig. 3 A). The current–voltage relationships showed similar values for the voltage at peak current and the reversal potential (Fig. 3 C). However, sodium currents recorded from cells of HET and KO mice were smaller than those from WT mice. Peak current densities were 571.5 ± 7.0 pA/pF (n = 9) for WT, but 329.5 ± 3.0 pA/pF (n = 20) and 238.0 ± 1.0 (n = 10) pA/pF for HET and KO mice, respectively (Fig. 3 C) (p < 0.0001 for all pairwise differences).
Figure 3.

Sodium currents in cerebellar Purkinje neurons of WT, HET, and KO mice. A, Current traces from representative cells evoked with a series of 50 ms depolarizations from a holding potential of −90 mV to potentials ranging from −80 to +30 mV in 5 mV increments. Inset, Diagram of stimulus protocol. Calibration: 1 ms, 2 nA. B, Left, Digital photograph of dissociated cerebellar Purkinje neurons. Scale bar, 50 μm. Right, Mean capacitance for cells of each genotype. C, Left, Current–voltage relationships for WT (filled circles), HET (filled squares), and KO (open triangles) mice. Right, Mean peak current densities. Error bars indicate SEM. *p < 0.001.
We determined the voltage dependence of activation and inactivation of sodium currents from Purkinje neurons of each genotype (Fig. 4). The voltage dependence of activation did not vary with genotype. The half-activation voltage for sodium current in cells of WT animals was −40.0 ± 0.2 mV (k = 5.0 ± 0.2; n = 9) compared with −40.8 ± 0.4 mV (k = 5.5 ± 0.3; n = 20) and −42.1 ± 0.5 mV (k = 4.7 ± 0.5; n = 10) in cells of HET and KO animals, respectively (Fig. 4 A,B). The voltage dependence of inactivation was determined using a 100 ms prepulse to a variable potential followed by a 20 ms test pulse to 0 mV. Sodium currents from Purkinje neurons of all three genotypes exhibited a similar voltage dependence of inactivation (Fig. 4 C,D). The V 1/2 values were −64.0 ± 0.2 mV (k = 5.9 ± 0.2; n = 9), −66.0 ± 0.2 mV (k = 5.7 ± 0.2; n = 20), and −63.0 ± 0.3 mV (k = 5.4 ± 0.3; n = 10) for cells of WT, HET, and KO mice, respectively. Thus, deletion of NaV1.1 channels in these mice reduced the amplitude of the sodium current but had little effect on the overall properties of the sodium current of Purkinje neurons.
Figure 4.

Voltage dependence of activation and inactivation of whole-cell sodium current of Purkinje neurons from NaV1.1 WT, HET, and KO mice. A, Representative current traces evoked in an isolated Purkinje neuron obtained using a family of 50 ms step depolarizations from −90 to 0 mV in 5 mV increments. For clarity, only the first 5 ms of the traces is illustrated. Inset, Stimulus protocol. Calibration: 0.5 ms, 2 nA. B, Mean conductance–voltage relationships for peak sodium current. C, Sodium channel inactivation. A 100 ms prepulse to a variable potential (5 mV increments) was followed by a 20 ms test pulse to 0 mV. Examples of complete current traces are illustrated above with the currents recorded during the test pulse expanded below. Calibration: top, 20 ms, 2 nA; bottom, 0.5 ms, 2 nA. D, Mean normalized inactivation curves. Peak normalized test pulse current is plotted as a function of prepulse potential. Error bars indicate SEM.
Reduced persistent current in Purkinje neurons from HET and KO mice
Persistent sodium current participates in the generation of spontaneous firing in several types of central neurons including cerebellar Purkinje neurons (Llinas and Sugimori, 1980; Raman and Bean, 1997; Levin et al., 2006). This noninactivating current may facilitate repetitive firing by promoting rapid depolarization to threshold during interspike intervals. Persistent sodium currents in NaV1.1 mutant mice were measured 50 ms after depolarization (Fig. 5 A), and the average current amplitudes for cells of each genotype were plotted as function of voltage (Fig. 5 B). Persistent sodium current was substantially reduced in cells from HET and KO mice. The peak persistent-current density was −7.8 ± 0.5 pA/pF (n = 9) in WT, −3.5 ± 0.4 pA/pF (n = 10; p < 0.0001 vs WT) in HET, and −3.2 ± 0.6 pA/pF (n = 8; p < 0.0001 vs WT) in KO. In contrast, the current–voltage relationships of the persistent sodium currents were very similar for all three types of cells (Fig. 5 C). These findings indicate that reduced expression of NaV1.1 channels leads to reduced persistent sodium current in Purkinje neurons and suggests that NaV1.1 contributes substantially to the persistent current observed in WT neurons.
Figure 5.

Persistent sodium current in neurons of NaV1.1 WT, HET, and KO mice. A, Top, representative current traces from a WT neuron evoked with a series of 50 ms depolarizations from a holding potential of −90 to −20 mV in 5 mV increments. For clarity, only the first five steps of the depolarization protocol are illustrated. Calibration: 10 ms, 1 nA. Bottom, Expanded view of the boxed region above illustrating the persistent sodium current. Calibration: 2 ms, 0.1 nA. B, Mean persistent sodium current versus voltage relationships for WT, HET, and KO neurons. C, Normalized persistent sodium current versus voltage relationships for WT, HET, and KO neurons. Error bars indicate SEM.
Reduced resurgent sodium current in Purkinje neurons of HET and KO mice
Resurgent sodium current, a component of sodium current that flows transiently on repolarization of the cell, has been identified in cerebellar Purkinje neurons and other central neurons (Raman and Bean, 1997; Afshari et al., 2004; Do and Bean, 2004). Like the persistent sodium current, resurgent current has been implicated in promoting fast repetitive neuronal firing in these neurons (Raman and Bean, 1997, 1999a; Raman et al., 1997) by accelerating depolarization toward threshold between action potentials (Raman and Bean, 1999a). We investigated whether NaV1.1 channels contribute to resurgent current by analysis of WT, HET, and KO mice. Resurgent current was generated using a protocol similar to that of Raman et al. (1997) (Fig. 6 A). Sodium current was activated with a 20 ms prepulse to +30 mV from a holding potential of −90 mV. The cell was then repolarized for 100 ms to potentials ranging from −60 to +20 mV in 10 mV increments to observe the resurgent current. Peak resurgent current was plotted as a function of repolarization potential for neurons of each genotype (Fig. 6 B). The peak resurgent-current densities were reduced in cells of HET (−24.5 ± 2.2 pA/pF; n = 12) and KO (−15.4 ± 2.0 pA/pF; n = 17) mice compared with cells of WT mice (−49.4 ± 5.7 pA/pF; n = 9) (Fig. 6 B) (p < 0.0001), without major change in the voltage dependence of the resurgent current (Fig. 6 B). Thus, reducing NaV1.1 expression strikingly reduces the amount of resurgent current in Purkinje neurons.
Figure 6.

Resurgent sodium current in Purkinje neurons of NaV1.1 WT, HET, and KO mice. A, Representative resurgent sodium currents evoked using a prepulse to +30 mV for 10 ms, followed by 100 ms repolarizations to potentials ranging from −60 to +20 mV. The holding potential was −90 mV. Calibration: 20 ms, 1 nA. B, Top, Mean peak resurgent sodium current density versus voltage curves for WT, HET, and KO neurons. Bottom, Normalized resurgent sodium current versus voltage curves for WT, HET, and KO neurons. Error bars indicate SEM.
Reduced rate of spontaneous firing in Purkinje neurons of mutant mice
Voltage-gated sodium currents underlie repetitive firing of cerebellar Purkinje neurons (Raman and Bean, 1999a; Raman et al., 2000). To evaluate whether the reduction of sodium current caused by deletion of NaV1.1 alters spontaneous firing, we recorded spontaneous activity of acutely isolated Purkinje neurons without applying any extrinsic holding or depolarizing current, and compared firing rate, threshold, peak, and minimum voltages of the action potential. Dissociated Purkinje neurons from mice of each genotype were able to fire spontaneously at a regular frequency without pause (Fig. 7 A), as reported previously (Raman and Bean, 1997, 1999b). However, the firing rate was significantly reduced in the cells of mutant mice (Fig. 7 B). The mean firing rate of Purkinje neurons from WT mice (68.9 ± 4.0 Hz; n = 12) was greater than that of neurons from HET (53.3 ± 6 Hz; n = 14; p < 0.01 vs WT) or KO (44.9 ± 5 Hz; n = 11; p < 0.0001 vs WT; p < 0.01 vs HET) mice. This change in rate was not accompanied by a significant change in the threshold for action potential generation, the peak of the action potential, or the minimum potential reached between action potentials (Fig. 7 B) (p > 0.5 for all comparisons) for Purkinje neurons from animals of different NaV1.1 genotype. These findings suggest that NaV1.1 current is a critical component that promotes rapid, sustained firing of Purkinje neurons, but is not essential for determining the generation or overall form of single action potentials.
Figure 7.
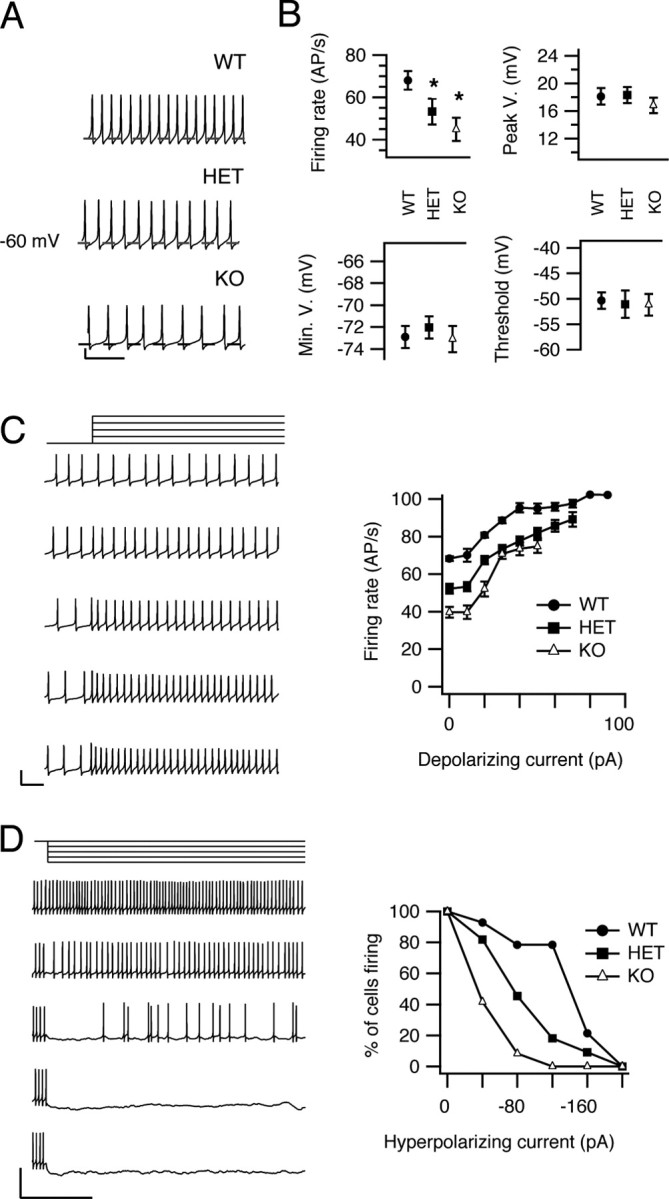
Spontaneous firing of neurons from WT, HET, and KO mice. A, Examples of spontaneous firing recorded in current clamp. The dashed line in each trace represents −60 mV. Calibration: 20 mV, 50 ms. B, Mean action potential parameters. Firing rate, voltage at action potential peak, minimum voltage reached between action potentials, and mean threshold for action potential initiation (see Materials and Methods) are plotted for cells of each genotype. C, Effects of depolarization on spontaneous firing. Left, Examples of changes in firing activity in response to a series of 6 s current pulses that increased in 20 pA increments (top to bottom) applied to a spontaneously firing WT cell. Only a segment of the traces is shown to allow individual action potentials to be distinguished. Calibration: 50 mV, 50 ms. Right, Mean firing rate is plotted vs the amount of depolarizing current applied. D, Effects of long hyperpolarizations on spontaneous firing. Left, Firing activity of a representative WT neuron during application of 6 s hyperpolarizing currents. Calibration: 50 ms, 50 mV. Right, Mean percentage of Purkinje neurons remaining firing after injection of the indicated levels of hyperpolarizing current for WT, HET, and KO mice. Error bars indicate SEM. *p < 0.01.
Altered firing during current injection
We also recorded spontaneous firing of Purkinje neurons during injection of hyperpolarizing or depolarizing current. The input resistances of the cells were similar for all three genotypes: 750 ± 90 MΩ (n = 9) for WT, 701 ± 100 MΩ (n = 9) for HET mice, and 760 ± 60 MΩ (n = 12) for KO mice. During incremental injections of depolarizing current, the firing activity of each cell was continuous and increased progressively in frequency until approaching a plateau at >40 pA injected current (Fig. 7 C). The firing rate was lower for each level of injected depolarizing current in cells of HET and KO mice compared with WT (Fig. 7 C). Similarly, during hyperpolarizations, cells from HET and KO mice ceased firing at lower levels of injected hyperpolarizing current compared with WT (Fig. 7 D). These results show that Purkinje neurons from KO and HET mice require stronger depolarizing current than neurons from WT to achieve and sustain the same rate of firing over a broad range of injected current levels.
Altered firing during partial blockade of sodium channels
The results of our voltage- and current-clamp experiments described above indicate that whole-cell sodium current is decreased in Purkinje neurons without detectable change in current properties. This decreased sodium current leads to a reduced frequency of spontaneous action potentials in isolated neurons from HET and KO mice. To further define the contribution of NaV1.1 current to neuronal excitability, we reduced sodium current by use of a concentration (10 nm) of the sodium channel blocker TTX, which inhibits ∼62% of sodium current conducted by both NaV1.1 and NaV1.6 channels (Clare et al., 2000; Catterall et al., 2002) (see Materials and Methods). In this experimental paradigm, application of TTX will reduce the whole-cell sodium current to ∼38% of normal by reducing NaV1.1 and NaV1.6 currents approximately equivalently. In contrast, deletion of one or both alleles of Scn1A reduces whole-cell sodium current to 57% of normal for HETs and 42% of normal for KOs, but all of the reduction is in NaV1.1 current. Comparing the effects of general reduction of sodium current by TTX to selective removal of NaV1.1 current by gene deletion should reveal any specific functional roles of these two sodium channel subtypes in action potential firing. Application of 10 nm TTX reduced the firing rate of neurons from WT mice (Fig. 8 A). The reduction in firing rate was accompanied by a reduction in the amplitude of the action potential (Fig. 8 A,B) and a depolarizing shift (∼4.3 mV) in threshold (Fig. 8 B), whereas the minimal voltage after repolarization from action potentials did not change (Fig. 8). Comparison of recordings from cells lacking NaV1.1 channels (Fig. 7) with those from cells with both NaV1.1 and NaV1.6 channels partially blocked with 10 nm TTX (Fig. 8) revealed a striking difference in the effects of these two methods of reducing sodium current. Partial blockade of NaV1.1 and NaV1.6 affects the amplitude of the action potential and the threshold for action potential generation, but selective deletion of NaV1.1 channel did not affect these electrophysiological parameters. This finding suggests that NaV1.6 current determines the threshold voltage for action potential generation and the amplitude of the action potential in these neurons, consistent with previous data indicating that Purkinje cells from mutant mice lacking NaV1.6 channels were not capable of sustaining a constant rate of firing (Khaliq et al., 2003).
Discussion
Deletion of NaV1.1 channels induces an ataxic phenotype
In tests of the motor function in our mouse model of SMEI, complete deletion of NaV1.1 channels in KOs led to mild limb tremors, body imbalance, highly irregular stride lengths during locomotion, and inability to execute a motor reflex task beginning at P13–P14. NaV1.1 HETs did not display similar symptoms of ataxia at P13–P14, but HET mice at P21 have impaired coordination of hindlimbs and forelimbs. The more subtle ataxia in NaV1.1 HET mice at P21 suggests that graded loss of sodium current in HET and KO mice leads to progressively more severe ataxia.
Deletion of NaV1.1 channels profoundly reduces whole-cell sodium currents
Antibody labeling of NaV channel subtypes in cerebellar Purkinje neurons suggests that the sodium current in the cell bodies of cerebellar Purkinje neurons is mediated by NaV1.1 and NaV1.6 channels. The reduced sodium current observed in voltage-clamp recordings of acutely dissociated cerebellar Purkinje neurons from mutant mice lacking NaV1.1 channels indicates that NaV1.1 channels contribute at least 58% of the total whole-cell NaV current in these cells. This finding is consistent with previous results indicating that NaV1.6 channels contribute ∼30% of the whole-cell sodium current in these neurons (Raman and Bean, 1997).
The decrease in resurgent sodium current in Purkinje neurons from KO mice (69%) indicates that NaV1.1 channels contribute to this current approximately equivalently to NaV1.6 channels per unit of peak sodium current. Based on the nearly complete elimination of resurgent currents in Purkinje neurons of Scn8a-null mice (Raman and Bean, 1999a,b), it had been thought that NaV1.6 is unique in conducting resurgent sodium current, but recent studies of subthalamic neurons of Scn8a-null mice revealed that other sodium channels are also involved (Do and Bean, 2004). The reduction of resurgent sodium current in Purkinje neurons of NaV1.1 HET and KO mice provides the first evidence for a role of a specific sodium channel subtype other than NaV1.6 in generation of resurgent sodium currents in vivo.
Persistent sodium currents are also reduced proportionately to peak current (59%) in NaV1.1 KO mice. In previous studies, we found that NaV1.1 channels expressed in mammalian cell lines generate persistent sodium currents that are 2–13% of peak sodium currents, depending on the cell line in which the channels are expressed (Mantegazza et al., 2005). Persistent sodium current conducted by NaV1.1 channels in Purkinje neurons is 1.4% of peak sodium current, similar to the lower end of the range of persistent sodium current recorded in transfected non-neuronal cells.
Persistent and resurgent sodium currents are known to support the generation of rapid action potential firing in neurons (Raman and Bean, 1999a; Khaliq et al., 2003). Our finding that these two forms of sodium current are substantially reduced in Purkinje neurons of NaV1.1 mutant mice provides a biophysical basis for the reduced capacity for repetitive action potential firing of these neurons.
Reduced excitability of Purkinje neurons in NaV1.1 mutant mice
Results from our current-clamp experiments revealed a striking loss of firing capacity in cerebellar Purkinje neurons of NaV1.1 mutant mice. The rate of spontaneous and depolarization-induced firing activity is lower in isolated cell bodies of cerebellar Purkinje neurons lacking NaV1.1 channels, and the spontaneous firing activity of cells from HETs and KOs was more easily suppressed by application of small hyperpolarizing pulses. However, these data did not show any change in threshold for action potential generation. These results suggest that NaV1.1 channels play an important role in establishing the rate of spontaneous firing activity of Purkinje neurons, but not in setting the threshold level for individual action potential generation. It appears from these results that the NaV1.6 channels have a special role in action potential initiation in Purkinje neurons, although they account for only ∼30–40% of total sodium current. The biophysical basis for the different functional roles of these two channel types is not clear from their properties studied to date. However, NaV1.1 channels are localized primarily in the cell bodies of Purkinje neurons (Westenbroek et al., 1989; Gong et al., 1999) (Fig. 1) (but see also Ogiwara et al., 2007), whereas NaV1.6 channels are localized in cell bodies, dendrites, and axon initial segments (Caldwell et al., 2000; Jenkins and Bennett, 2001; Schaller and Caldwell, 2003) (Fig. 1). It is possible that the different subcellular distribution of these channels is an important determinant of their different roles in cellular excitability.
Compensatory upregulation of NaV1.6 channel activity
Our immunohistochemical results show that loss of NaV1.1 channels does not cause compensatory upregulation of expression of NaV1.2, NaV1.3, or NaV1.6 channels. However, the nonlinear reduction in sodium current in HETs and KOs suggests compensatory upregulation of the activity of NaV1.6 channels. Deletion of one allele of Scn1a reduced peak sodium current from 572 to 330 pA/pF, so deletion of the second allele should have reduced sodium current to 88 pA/pF if the loss was linear. In contrast to this expectation, sodium currents in neurons from KO mice were 238 pA/pF, suggesting substantial upregulation of the activity of NaV1.6 channels in the Purkinje neurons from KO mice. Similar nonlinearity was observed for reduction of persistent and resurgent sodium currents, suggesting that they are similarly upregulated in the KO mice. In our recent study, we observed compensatory upregulation of NaV1.3 channel expression in hippocampal interneurons in NaV1.1 KO mice (Yu et al., 2006). The results in these two cell types indicate that neurons have a feedback control mechanism to upregulate sodium channel expression and/or function when excitability is reduced, but this mechanism is insufficient to compensate for the loss of NaV1.1 channels completely.
NaV1.1 channels, ataxia, and epilepsy
Ataxia, spasticity, and failure of motor coordination are important impairments for children with SMEI (Dravet et al., 2005), which may arise independently of their epilepsy. They lead to reduced quality of life, increased burden of care, and even serious injury and death because of unexpected falls and accidents (Dravet et al., 2005). Our results relate the ataxic phenotype in SMEI to decreased excitability of cerebellar Purkinje neurons, which are GABAergic inhibitory neurons that transmit information from the cerebellar cortex to the deep cerebellar nuclei. We propose that ataxia in these mice results at least in part from the decreased excitability of cerebellar Purkinje neurons, which makes them unable to provide adequate inhibitory control of their target neurons in the deep cerebellar nuclei. Changes in the pattern and frequency of firing of Purkinje neurons have profound effects on the output from the deep cerebellar nuclei (McKay et al., 2005). Moreover, previous studies have linked alterations of ion channel expression or function in Purkinje neurons with ataxia (Raman and Bean, 1997; Sausbier et al., 2004; Nahm et al., 2005). Although NaV1.1 channels are reduced throughout the brain by our gene deletion, it is likely that reduction in Purkinje neurons alone is sufficient to cause ataxia because ataxic symptoms have been previously observed in mutant mice with specific degeneration of cerebellar Purkinje neurons (Grusser-Cornehls and Baurle, 2001) and with cerebellar Purkinje neuron-specific deletion of NaV1.6 (Levin et al., 2006). Thus, our results suggest that ataxia in NaV1.1 mutant mice and SMEI patients may be caused by loss of excitability of Purkinje neurons.
Although the profound loss of electrical excitability of Purkinje neurons we have observed here is likely to be sufficient to cause ataxia, reduced excitability of other neurons in the cerebellum could also influence this phenotype. The granule cells are the most abundant neurons in the cerebellum, but they express primarily NaV1.2 and NaV1.6 channels with only a low level of NaV1.1 channels (Schaller and Caldwell, 2003; Lein et al., 2007) (Fig. 1). Therefore, it is likely that deletion of NaV1.1 channels has a much greater effect on the inhibitory Purkinje neurons than on the excitatory granule neurons in the cerebellum.
It is interesting to note that the epileptic phenotype in these mice may also be caused by a selective reduction in sodium currents, but in GABAergic inhibitory interneurons in the hippocampus (Yu et al., 2006). Sodium currents are reduced 73% in inhibitory interneurons in the hippocampus but are unchanged (or reduced <10%) in the excitatory pyramidal neurons. This would lead to increased firing and output from the hippocampus, potentially causing epilepsy. Our results presented here show that sodium currents and excitability in the Purkinje neurons are impaired leading to reduced output to the deep cerebellar nuclei and ataxia. Thus, selective failure of excitability of different classes of GABAergic neurons can potentially account for two of the major symptoms of SMEI, intractable epilepsy and severe ataxia. These results suggest the hypothesis that the multiple functional impairments of NaV1.1 HET and KO mice and of SMEI patients may arise from loss of excitability in multiple specific classes of GABAergic neurons.
Footnotes
This work was supported by National Institutes of Health Research Grant R01 NS25704 and a research grant from the McKnight Foundation (W.A.C.).
References
- Afshari FS, Ptak K, Khaliq ZM, Grieco TM, Slater NT, McCrimmon DR, Raman IM. Resurgent Na currents in four classes of neurons of the cerebellum. J Neurophysiol. 2004;92:2831–2843. doi: 10.1152/jn.00261.2004. [DOI] [PubMed] [Google Scholar]
- Caldwell JH, Schaller KL, Lasher RS, Peles E, Levinson SR. Sodium channel NaV1.6 is localized at nodes of Ranvier, dendrites, and synapses. Proc Natl Acad Sci USA. 2000;97:5616–5620. doi: 10.1073/pnas.090034797. [DOI] [PMC free article] [PubMed] [Google Scholar]
- Callaway JC, Ross WN. Spatial distribution of synaptically activated sodium concentration changes in cerebellar Purkinje neurons. J Neurophysiol. 1997;77:145–152. doi: 10.1152/jn.1997.77.1.145. [DOI] [PubMed] [Google Scholar]
- Cantrell AR, Ma JY, Scheuer T, Catterall WA. Muscarinic modulation of sodium current by activation of protein kinase C in rat hippocampal neurons. Neuron. 1996;16:1019–1025. doi: 10.1016/s0896-6273(00)80125-7. [DOI] [PubMed] [Google Scholar]
- Catterall WA. From ionic currents to molecular mechanisms: the structure and function of voltage-gated sodium channels. Neuron. 2000;26:13–25. doi: 10.1016/s0896-6273(00)81133-2. [DOI] [PubMed] [Google Scholar]
- Catterall WA, Chandy KG, Gutman GA. IUPHAR ion channel compendium. Leeds, UK: IUPHAR Media; 2002. [Google Scholar]
- Claes L, Ceulemans B, Audenaert D, Smets K, Lofgren A, Del-Favero J, Ala-Mello S, Basel-Vanagaite L, Plecko B, Raskin S, Thiry P, Wolf NI, Van Broeckhoven C, De Jonghe P. De novo SCN1A mutations are a major cause of severe myoclonic epilepsy of infancy. Hum Mutat. 2003;21:615–621. doi: 10.1002/humu.10217. [DOI] [PubMed] [Google Scholar]
- Clare JJ, Tate SN, Nobbs M, Romanos MA. Voltage-gated sodium channels as therapeutic targets. Drug Discov Today. 2000;5:506–520. doi: 10.1016/s1359-6446(00)01570-1. [DOI] [PubMed] [Google Scholar]
- Do MT, Bean BP. Sodium currents in subthalamic nucleus neurons from Nav1.6-null mice. J Neurophysiol. 2004;92:726–733. doi: 10.1152/jn.00186.2004. [DOI] [PubMed] [Google Scholar]
- Dravet C, Bureau M, Oguni H, Fukuyama Y, Cokar O. Severe myoclonic epilepsy in infancy: Dravet syndrome. Adv Neurol. 2005;95:71–102. [PubMed] [Google Scholar]
- Escayg A, Heils A, MacDonald BT, Haug K, Sander T, Meisler MH. A novel SCN1A mutation associated with generalized epilepsy with febrile seizures plus—and prevalence of variants in patients with epilepsy. Am J Hum Genet. 2001;68:866–873. doi: 10.1086/319524. [DOI] [PMC free article] [PubMed] [Google Scholar]
- Fletcher CF, Lutz CM, O'Sullivan TN, Shaughnessy JD, Jr, Hawkes R, Frankel WN, Copeland NG, Jenkins NA. Absence epilepsy in tottering mutant mice is associated with calcium channel defects. Cell. 1996;87:607–617. doi: 10.1016/s0092-8674(00)81381-1. [DOI] [PubMed] [Google Scholar]
- Fukuma G, Oguni H, Shirasaka Y, Watanabe K, Miyajima T, Yasumoto S, Ohfu M, Inoue T, Watanachai A, Kira R, Matsuo M, Muranaka H, Sofue F, Zhang B, Kaneko S, Mitsudome A, Hirose S. Mutations of neuronal voltage-gated Na+ channel α1 subunit gene SCN1A in core severe myoclonic epilepsy in infancy (SMEI) and in borderline SMEI (SMEB) Epilepsia. 2004;45:140–148. doi: 10.1111/j.0013-9580.2004.15103.x. [DOI] [PubMed] [Google Scholar]
- George AL., Jr Inherited disorders of voltage-gated sodium channels. J Clin Invest. 2005;115:1990–1999. doi: 10.1172/JCI25505. [DOI] [PMC free article] [PubMed] [Google Scholar]
- Goldin AL. Resurgence of sodium channel research. Annu Rev Physiol. 2001;63:871–894. doi: 10.1146/annurev.physiol.63.1.871. [DOI] [PubMed] [Google Scholar]
- Goldin AL, Barchi RL, Caldwell JH, Hofmann F, Howe JR, Hunter JC, Kallen RG, Mandel G, Meisler MH, Berwald Netter Y, Noda M, Tamkun MM, Waxman SG, Wood JN, Catterall WA. Nomenclature of voltage-gated sodium channels. Neuron. 2000;28:365–368. doi: 10.1016/s0896-6273(00)00116-1. [DOI] [PubMed] [Google Scholar]
- Gong B, Rhodes KJ, Bekele-Arcuri Z, Trimmer JS. Type I and type II Na+ channel α-subunit polypeptides exhibit distinct spatial and temporal patterning, and association with auxiliary subunits in rat brain. J Comp Neurol. 1999;412:342–352. [PubMed] [Google Scholar]
- Grusser-Cornehls U, Baurle J. Mutant mice as a model for cerebellar ataxia. Prog Neurobiol. 2001;63:489–540. doi: 10.1016/s0301-0082(00)00024-1. [DOI] [PubMed] [Google Scholar]
- Jenkins SM, Bennett V. Ankyrin-G coordinates assembly of the spectrin-based membrane skeleton, voltage-gated sodium channels, and L1 CAMs at Purkinje neuron initial segments. J Cell Biol. 2001;155:739–746. doi: 10.1083/jcb.200109026. [DOI] [PMC free article] [PubMed] [Google Scholar]
- Johnston D, Magee JC, Colbert CM, Christie BR. Active properties of neuronal dendrites. Annu Rev Neurosci. 1996;19:165–186. doi: 10.1146/annurev.ne.19.030196.001121. [DOI] [PubMed] [Google Scholar]
- Khaliq ZM, Raman IM. Relative contributions of axonal and somatic Na channels to action potential initiation in cerebellar Purkinje neurons. J Neurosci. 2006;26:1935–1944. doi: 10.1523/JNEUROSCI.4664-05.2006. [DOI] [PMC free article] [PubMed] [Google Scholar]
- Khaliq ZM, Gouwens NW, Raman IM. The contribution of resurgent sodium current to high-frequency firing in Purkinje neurons: an experimental and modeling study. J Neurosci. 2003;23:4899–4912. doi: 10.1523/JNEUROSCI.23-12-04899.2003. [DOI] [PMC free article] [PubMed] [Google Scholar]
- Krzemien DM, Schaller KL, Levinson SR, Caldwell JH. Immunolocalization of sodium channel isoform NaCh6 in the nervous system. J Comp Neurol. 2000;420:70–83. [PubMed] [Google Scholar]
- Lein ES, Hawrylycz MJ, Ao N, Ayres M, Bensinger A, Bernard A, Boe AF, Boguski MS, Brockway KS, Byrnes EJ, Chen L, Chen L, Chen TM, Chin MC, Chong J, Crook BE, Czaplinska A, Dang CN, Datta S, Dee NR, et al. Genome-wide atlas of gene expression in the adult mouse brain. Nature. 2007;445:168–176. doi: 10.1038/nature05453. [DOI] [PubMed] [Google Scholar]
- Levin SI, Khaliq ZM, Aman TK, Grieco TM, Kearney JA, Raman IM, Meisler MH. Impaired motor function in mice with cell-specific knockout of sodium channel Scn8a (NaV1.6) in cerebellar Purkinje neurons and granule cells. J Neurophysiol. 2006;96:785–793. doi: 10.1152/jn.01193.2005. [DOI] [PubMed] [Google Scholar]
- Llinas R, Sugimori M. Electrophysiological properties of in vitro Purkinje cell somata in mammalian cerebellar slices. J Physiol (Lond) 1980;305:171–195. doi: 10.1113/jphysiol.1980.sp013357. [DOI] [PMC free article] [PubMed] [Google Scholar]
- Mantegazza M, Yu FH, Powell AJ, Clare JJ, Catterall WA, Scheuer T. Molecular determinants for modulation of persistent sodium current by G-protein βγ subunits. J Neurosci. 2005;25:3341–3349. doi: 10.1523/JNEUROSCI.0104-05.2005. [DOI] [PMC free article] [PubMed] [Google Scholar]
- McKay BE, Molineux ML, Mehaffey WH, Turner RW. Kv1 K+ channels control Purkinje cell output to facilitate postsynaptic rebound discharge in deep cerebellar neurons. J Neurosci. 2005;25:1481–1492. doi: 10.1523/JNEUROSCI.3523-04.2005. [DOI] [PMC free article] [PubMed] [Google Scholar]
- Meisler MH, Kearney JA. Sodium channel mutations in epilepsy and other neurological disorders. J Clin Invest. 2005;115:2010–2017. doi: 10.1172/JCI25466. [DOI] [PMC free article] [PubMed] [Google Scholar]
- Nahm SS, Jung KY, Enger MK, Griffith WH, Abbott LC. Differential expression of T-type calcium channels in P/Q-type calcium channel mutant mice with ataxia and absence epilepsy. J Neurobiol. 2005;62:352–360. doi: 10.1002/neu.20107. [DOI] [PubMed] [Google Scholar]
- Ogiwara I, Miyamoto H, Morita N, Atapour N, Mazaki E, Inoue I, Takeuchi T, Itohara S, Yanagawa Y, Obata K, Furuichi T, Hensch TK, Yamakawa K. NaV1.1 localizes to axons of parvalbumin-positive inhibitory interneurons: a circuit basis for epileptic seizures in mice carrying an Scn1a gene mutation. J Neurosci. 2007;27:5903–5914. doi: 10.1523/JNEUROSCI.5270-06.2007. [DOI] [PMC free article] [PubMed] [Google Scholar]
- Ptácek LJ, Fu YH. Channels and disease: past, present, and future. Arch Neurol. 2004;61:1665–1668. doi: 10.1001/archneur.61.11.1665. [DOI] [PubMed] [Google Scholar]
- Raman IM, Bean BP. Resurgent sodium current and action potential formation in dissociated cerebellar Purkinje neurons. J Neurosci. 1997;17:4517–4526. doi: 10.1523/JNEUROSCI.17-12-04517.1997. [DOI] [PMC free article] [PubMed] [Google Scholar]
- Raman IM, Bean BP. Ionic currents underlying spontaneous action potentials in isolated cerebellar Purkinje neurons. J Neurosci. 1999a;19:1664–1674. doi: 10.1523/JNEUROSCI.19-05-01663.1999. [DOI] [PMC free article] [PubMed] [Google Scholar]
- Raman IM, Bean BP. Properties of sodium currents and action potential firing in isolated cerebellar Purkinje neurons. Ann NY Acad Sci. 1999b;868:93–96. doi: 10.1111/j.1749-6632.1999.tb11279.x. [DOI] [PubMed] [Google Scholar]
- Raman IM, Sprunger LK, Meisler MH, Bean BP. Altered subthreshold sodium currents and disrupted firing patterns in Purkinje neurons of Scn8a mutant mice. Neuron. 1997;19:881–891. doi: 10.1016/s0896-6273(00)80969-1. [DOI] [PubMed] [Google Scholar]
- Raman IM, Gustafson AE, Padgett D. Ionic currents and spontaneous firing in neurons isolated from the cerebellar nuclei. J Neurosci. 2000;20:9004–9016. doi: 10.1523/JNEUROSCI.20-24-09004.2000. [DOI] [PMC free article] [PubMed] [Google Scholar]
- Sausbier M, Hu H, Arntz C, Feil S, Kamm S, Adelsberger H, Sausbier U, Sailer CA, Feil R, Hofmann F, Korth M, Shipston MJ, Knaus HG, Wolfer DP, Pedroarena CM, Storm JF, Ruth P. Cerebellar ataxia and Purkinje cell dysfunction caused by Ca2+-activated K+ channel deficiency. Proc Natl Acad Sci USA. 2004;101:9474–9478. doi: 10.1073/pnas.0401702101. [DOI] [PMC free article] [PubMed] [Google Scholar]
- Schaller KL, Caldwell JH. Expression and distribution of voltage-gated sodium channels in the cerebellum. Cerebellum. 2003;2:2–9. doi: 10.1080/14734220309424. [DOI] [PubMed] [Google Scholar]
- Stuart GJ, Sakmann B. Active propagation of somatic action potentials into neocortical pyramidal cell dendrites. Nature. 1994;367:69–72. doi: 10.1038/367069a0. [DOI] [PubMed] [Google Scholar]
- Sugawara T, Mazaki-Miyazaki E, Fukushima K, Shimomura J, Fujiwara T, Hamano S, Inoue Y, Yamakawa K. Frequent mutations of SCN1A in severe myoclonic epilepsy in infancy. Neurology. 2002;58:1122–1124. doi: 10.1212/wnl.58.7.1122. [DOI] [PubMed] [Google Scholar]
- Trimmer JS, Rhodes KJ. Localization of voltage-gated ion channels in mammalian brain. Annu Rev Physiol. 2004;66:477–519. doi: 10.1146/annurev.physiol.66.032102.113328. [DOI] [PubMed] [Google Scholar]
- Wallace RH, Scheffer IE, Barnett S, Richards M, Dibbens L, Desai RR, Lerman-Sagie T, Lev D, Mazarib A, Brand N, Ben-Zeev B, Goikhman I, Singh R, Kremmidiotis G, Gardner A, Sutherland GR, George AL, Jr, Mulley JC, Berkovic SF. Neuronal sodium-channel α1-subunit mutations in generalized epilepsy with febrile seizures plus. Am J Hum Genet. 2001;68:859–865. doi: 10.1086/319516. [DOI] [PMC free article] [PubMed] [Google Scholar]
- Waxman SG. Transcriptional channelopathies: an emerging class of disorders. Nat Rev Neurosci. 2001;2:652–659. doi: 10.1038/35090026. [DOI] [PubMed] [Google Scholar]
- Westenbroek RE, Merrick DK, Catterall WA. Differential subcellular localization of the RI and RII Na+ channel subtypes in central neurons. Neuron. 1989;3:695–704. doi: 10.1016/0896-6273(89)90238-9. [DOI] [PubMed] [Google Scholar]
- Westenbroek RE, Noebels JL, Catterall WA. Elevated expression of type II Na+ channels in hypomyelinated axons of shiverer mouse brain. J Neurosci. 1992;12:2259–2267. doi: 10.1523/JNEUROSCI.12-06-02259.1992. [DOI] [PMC free article] [PubMed] [Google Scholar]
- Westenbroek RE, Sakurai T, Elliott EM, Hell JW, Starr TVB, Snutch TP, Catterall WA. Immunochemical identification and subcellular distribution of the α1A subunits of brain calcium channels. J Neurosci. 1995;15:6403–6418. doi: 10.1523/JNEUROSCI.15-10-06403.1995. [DOI] [PMC free article] [PubMed] [Google Scholar]
- Westenbroek RE, Hoskins L, Catterall WA. Localization of Ca2+ channel subtypes on rat spinal motor neurons, interneurons, and nerve terminals. J Neurosci. 1998;18:6319–6330. doi: 10.1523/JNEUROSCI.18-16-06319.1998. [DOI] [PMC free article] [PubMed] [Google Scholar]
- Wu Q, Chen M, Buchwald M, Phillips RA. A simple, rapid method for isolation of high quality genomic DNA from animal tissues. Nucleic Acids Res. 1995;23:5087–5088. doi: 10.1093/nar/23.24.5087. [DOI] [PMC free article] [PubMed] [Google Scholar]
- Yu FH, Mantegazza M, Westenbroek RE, Robbins CA, Kalume F, Burton KA, Spain WJ, McKnight GS, Scheuer T, Catterall WA. Reduced sodium current in GABAergic interneurons in a mouse model of severe myoclonic epilepsy in infancy. Nat Neurosci. 2006;9:1142–1149. doi: 10.1038/nn1754. [DOI] [PubMed] [Google Scholar]