

Abstract
What are the precise brain regions supporting the short-term retention of verbal information? A previous functional magnetic resonance imaging (fMRI) study suggested that they may be topographically variable across individuals, occurring, in most, in regions posterior to prefrontal cortex (PFC), and that detection of these regions may be best suited to a single-subject (SS) approach to fMRI analysis (Feredoes and Postle, 2007). In contrast, other studies using spatially normalized group-averaged (SNGA) analyses have localized storage-related activity to PFC. To evaluate the necessity of the regions identified by these two methods, we applied repetitive transcranial magnetic stimulation (rTMS) to SS- and SNGA-identified regions throughout the retention period of a delayed letter-recognition task. Results indicated that rTMS targeting SS analysis-identified regions of left perisylvian and sensorimotor cortex impaired performance, whereas rTMS targeting the SNGA-identified region of left caudal PFC had no effect on performance. Our results support the view that the short-term retention of verbal information can be supported by regions associated with acoustic, lexical, phonological, and speech-based representation of information. They also suggest that the brain bases of some cognitive functions may be better detected by SS than by SNGA approaches to fMRI data analysis.
Keywords: working memory, emergent property, prefrontal cortex, functional magnetic resonance imaging, group analyses, repetitive transcranial magnetic stimulation
Introduction
Working memory (WM) refers to the ability to retain information in an active, accessible state when it is not present in the environment, to guide behavior. A prominent goal for cognitive neuroscience is the localization of component processes of WM, including storage. One way to operationalize the construct of storage is to vary memory load. Some functional magnetic resonance imaging (fMRI) studies have reported delay-period load sensitivity for verbal WM in prefrontal cortex (PFC) [often in the dorsolateral portion comprising Brodmann areas 9 and 46 (Narayanan et al., 2005; Zarahn et al., 2005)], whereas others have reported that it is primarily regions outside of the PFC that show this property (Postle et al., 1999, 2006). These discrepant empirical results each provide support for one of two incompatible classes of WM models, “memory systems models” and “emergent property models,” respectively (for review, see Postle, 2006).
One explanation for this empirical discrepancy in the literature might be methodological. This was demonstrated when analysis of a single fMRI dataset with two different methods produced two different patterns of delay-period load-sensitive activity: Single-subject (SS) analyses revealed considerable intersubject topographic variability, with effects identified in sensorimotor and/or temporoparietal cortex in the majority of subjects, whereas a spatially normalized group-averaged (SNGA) analysis identified a region of left caudal PFC. The activity within the regions identified by these two methods also differed. The trial-averaged time series from the SS analysis-identified regions showed clear task-related structure and robust delay-period load effects that averaged >2% signal change. In contrast, the trial-averaged time series extracted from the SNGA analysis-identified PFC region did not reveal task-related activity in the majority of subjects, and the mean magnitude of the delay-period load effects extracted from this region was markedly smaller (0.29%) (Feredoes and Postle, 2007). We interpreted these results in the following way: the SS analysis revealed regions that, based on the patterns of task-related activity, were involved in the storage of verbal information. The topographic variability of these regions across subjects did not, however, meet the minimum anatomical overlap necessary for detection by a group-averaged approach. The SNGA analysis, in contrast, detected a topographically invariant region in left caudal PFC for which the load-sensitive effects were too small to be detected in SS analyses. At the root of the differences in results produced by these two approaches to fMRI data analysis is a difference in what each treats as noise. SNGA analyses can treat SS-identified effects as noise if they fail to replicate topographically across subjects. SS analyses can treat SNGA-identified effects as noise if they are too small in signal intensity to exceed statistical thresholding at the SS level.
In view of the differences in these two common approaches to the analysis of fMRI data, an important question is whether one or the other identifies regions that make a necessary contribution to the short-term storage of information. The present study was designed to address this question by systematically altering, with repetitive transcranial magnetic stimulation (rTMS), activity in brain regions identified as load sensitive by SS versus SNGA analyses. In each of a new group of subjects, we applied rTMS to a SS-derived region and to the SNGA-derived region identified in the previous study (Feredoes and Postle, 2007), hypothesizing that task performance would be disrupted by rTMS to the SS-derived region only. This prediction followed from our previous observation that SS analyses were more likely to identify regions with task-related activity. Alternatively, one could predict that rTMS applied to the PFC locus would have a greater effect on performance. This would follow from the reasoning that the SNGA analysis of the Feredoes and Postle (2007) data, by treating “subject” as a random effect, should provide the best prediction of where delay-period load sensitivity would be located in new subjects drawn from the same population (by applying the logic of generalizing to the population from which a sample was drawn) (Holmes and Friston, 1998).
Materials and Methods
Subjects.
To achieve a final n value of 24, 32 right-handed subjects (mean ± SD age, 23 ± 4.55 years; 18 males) were recruited from the University of Wisconsin-Madison community. For the eight subjects not included in the final n value, two were excluded because of excessive movement in the scanner, three were excluded because their delay-period load maps did not contain any suprathreshold voxels, and three were excluded because they could not tolerate rTMS. Two subjects of the final n value of 24 had been recruited and scanned as part of experiment 2 in our previous study (Feredoes and Postle, 2007). (Note that these subjects were not part of the n = 24 from experiment 1 of that study, in which the SNGA voxels were identified.) All subjects were paid for their participation, and the study was approved by the local institutional review board.
Behavioral task.
The task required delayed recognition of item position. Briefly, each trial began with the simultaneous presentation of two or five consonant letters in a single row (1 s), followed by a delay period (7 s for fMRI session, 3 s for rTMS session), followed by a memory probe (consisting of an item from the memory set and a digit, for 1 s), followed by an intertrial interval (13 s for fMRI session, 8 s for rTMS session). Subjects were to retain a memory of the two or five letters in the order in which they were presented and indicate with a YES/NO button press whether or not the probe digit represented the position in which the probed letter had appeared in the initial stimulus display (it did so with p = 0.5). Subjects responded YES with a right-thumb button press and NO with a left-thumb button press. Trial type was pseudorandomized, with the constraints that an equal number of each trial type appeared in each block (eight 12-trial blocks for fMRI session, two 24-trial blocks per targeted region for rTMS session), as did an equal number of matching (i.e., valid) and nonmatching (i.e., invalid) probes.
fMRI.
The procedures for data acquisition, preprocessing, and data analysis were the same as those for Feredoes and Postle (2007) (see also supplemental Materials and Methods, available at www.jneurosci.org as supplemental material). To enable fMRI-guided rTMS, whole-brain thresholded load-sensitive statistical maps from each subject were coregistered and merged with that subject's high-resolution T1-weighted scan (Fig. 1).
Figure 1.
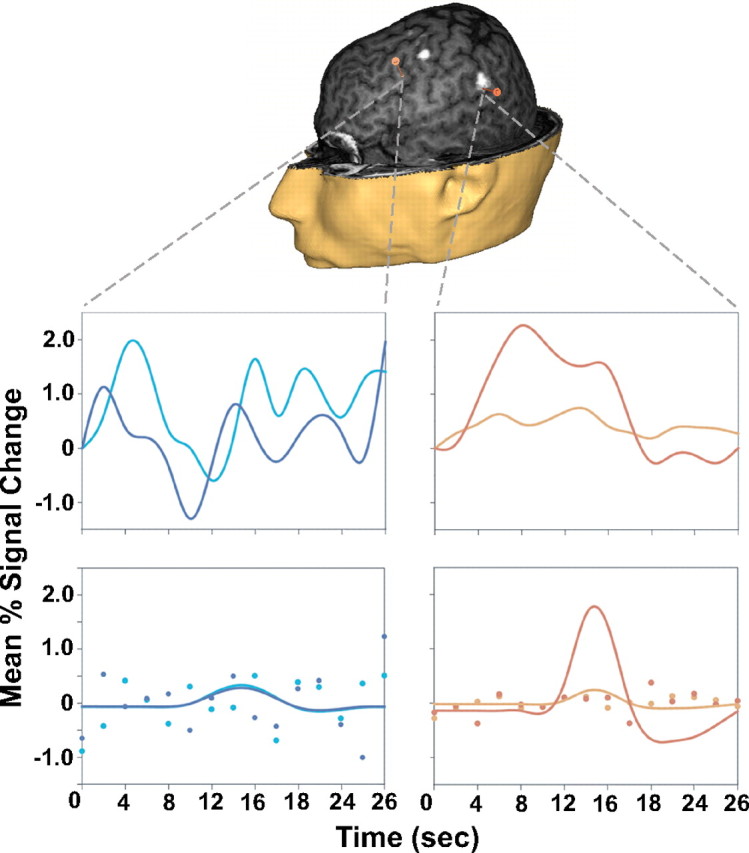
Example from subject 7 of SS and SNGA rTMS targets (orange markers; anterior, SNGA; posterior, SS). White blobs on the brain are load-sensitive regions identified by the SS analysis, which have been merged onto this subject's high-resolution T1-weighted anatomical scan, and are visible at this depth of scalp “peeling.” Plots of trial-averaged time series data extracted from each of the target regions and corresponding relevant information from the solution of the general linear model are shown below (SNGA, left column; SS, right column; red/blue lines, 5-letter trials; orange/green lines, 2-letter trials). Plots at the top show trial-averaged time series from each region; plots at the bottom show the delay-period covariates scaled by their parameter estimates, and the individual dots represent residual error at each time point.
rTMS.
rTMS was delivered with a Magstim Super Rapid magnetic stimulator fit with a 70 mm figure-eight air-cooled stimulating coil (Magstim, Whitland, UK). Localization of the stimulating coil was accomplished by infrared-based frameless stereotaxy (eXimia Navigated Brain Stimulation, Helsinki, Finland), which permitted real-time targeting of cortical structures via visualization of a three-dimensional reconstruction of the subject's high-resolution T1-weighted scan. Additional details are available in supplemental Materials and Methods (available at www.jneurosci.org as supplemental material).
Selection of rTMS targets.
In each subject, a single load-sensitive SS region was selected as the rTMS target based on a combination of the following criteria: it showed a task-related trial-averaged time series (supplemental Materials and Methods, available at www.jneurosci.org as supplemental material); it would be accessible to the stimulating coil and be within the range of rTMS; it had the largest (or among the largest) load effect size for that subject; if there were regions in both hemispheres, we would preferentially select left hemisphere. For each of the six subjects with load-sensitive voxels in middle frontal gyrus (MFG) (subjects 1, 7, 14, 15, 17, and 19), load sensitivity was also identified in left hemisphere perisylvian cortex, and we chose to target voxels in this latter region for two reasons. First, SS analyses of previous fMRI studies using this task had emphasized the importance for storage of load-sensitive activity in left perisylvian cortex (Postle et al., 1999; Feredoes and Postle, 2007), and so targeting this region in the present study was important for validating/invalidating the interpretation of these previous studies. Second, because load-sensitive delay-period activity was identified in one of two areas in each of the 24 subjects in our sample (left perisylvian cortex and left sensorimotor cortex), we reasoned that generalizing from our results would be more straightforward if we restricted SS rTMS targets to these two contiguous regions. [Note, however, that we do not believe that our results would have changed appreciably had we targeted the SS-identified regions in MFG in these six subjects, nor (to anticipate our results) would it weaken the argument for the SS approach were one to show that rTMS of SS-identified regions in PFC also disrupted performance on this task.]
For each subject, rTMS was also applied to the left hemisphere PFC region identified by the SNGA analysis in the Feredoes and Postle (2007) study. It was located on the posterior portion of the MFG, immediately anterior to the precentral sulcus and superior to the operculum of the inferior frontal gyrus (i.e., at the boundary of Brodmann areas 6 and 9; Montreal Neurological Institute coordinates −52.2, −5.4, 43) (Fig. 1).
rTMS experimental procedure.
For each stimulation site, subjects performed two blocks of the task, with the factors of probe validity (valid, invalid) and rTMS (present, absent) randomized and fully crossed in each 24-trial block. The order of stimulation sites was counterbalanced across subjects. rTMS [30 pulses, delivered at a rate of 10 Hz at 110% motor threshold, corrected for scalp–cortex distance (Stokes et al., 2005)] was time locked to coincide with delay-period onset.
Results
fMRI behavioral
Behavioral results for the task performed during fMRI scanning indicated that accuracy for retention of five letters was lower, and reaction times (RTs) longer, than for retention of two letters (mean ± SD accuracy for five-item trials, 83.90 ± 10.71% correct; mean ± SD RT for five-item trials, 1785.09 ± 516.20 ms; mean ± SD accuracy for two-item trials, 92.64 ± 11.05% correct; mean ± SD RT for two-item trials, 1333.30 ± 338.74 ms).
fMRI
The results of the SS analyses replicated the pattern observed in the previous experiment (Feredoes and Postle, 2007), in that there was considerable intersubject variability in the localization of load-sensitive voxels. Of the 24 subjects, the majority showed load-sensitive activity in the following regions: perisylvian cortex (comprising supramarginal, angular, and superior temporal gyri) in 15 subjects (13 of these were in the left hemisphere, two were bilateral); sensorimotor cortex (spanning from precentral to postcentral sulci) in 18 subjects (12 of these were in the left hemisphere and six were bilateral); in the area including the intraparietal sulcus and superior parietal lobule for nine subjects (eight of these were in left hemisphere and one was right); and superior frontal gyrus in 10 subjects (three were in left hemisphere and seven were bilateral) (Table 1). For six subjects, load-sensitive voxels were identified in MFG (one was in left hemisphere, two were in the right, and three were bilateral), and, of these, only one was in dorsolateral PFC (Brodmann area 9/46). In none of these six subjects was the MFG the only region showing load sensitivity.
Table 1.
Summary of load-sensitive regions identified by the SS analysis of each subject's data and the load effect size extracted from each region
| Subject | Hemisphere | Load-sensitive region | # voxels | Effect size (% signal change) | Approximate Brodmann area | Peak activation (Talairach coordinates) |
||
|---|---|---|---|---|---|---|---|---|
| x | y | z | ||||||
| 1 | Left | MFG | 4 | 0.701 | 6/8 | −24 | 39 | 41 |
| Left | Insula | 1 | 0.698 | −36 | 9 | 9 | ||
| Left | Posterior STG | 3 | 1.156 | 22 | −42 | −44 | 13 | |
| Left | IPS/SPL | 5 | 0.754 | 7 | −18 | −64 | 57 | |
| Right | MFG | 5 | 0.788 | 6 | 42 | 10 | 51 | |
| Right | Anterior IFG | 1 | 0.618 | 9 | 54 | 15 | 21 | |
| 2 | Left | Posterior STS | 1 | 0.621 | 22 | −61 | −37 | 10 |
| Left | PCC | 1 | 0.773 | 23 | −2 | −42 | 24 | |
| 3 | Left | SMG | 1 | 0.964 | 40 | −54 | −53 | 31 |
| Left | PreCG | 1 | 0.668 | 44/6 | −59 | 3 | 20 | |
| Left | PreCS | 2 | 0.689 | 4 | −44 | −15 | 49 | |
| Left | SFG | 4 | 1.361 | 6 | −2 | −10 | 63 | |
| Medial | Anterior SFG | 1 | 1.129 | 6 | 10 | 4 | 75 | |
| Right | SMG | 1 | 0.603 | 40 | 63 | −41 | 26 | |
| 4 | Left | SMG/STG | 1 | 0.365 | 40 | −57 | −55 | 25 |
| Left | mid-PreCG | 1 | 1.027 | 6 | −55 | −5 | 22 | |
| 5 | Left | STG/sylvian fissure | 2 | 0.532 | 40 | −46 | −40 | 26 |
| Left | Inferior PreCG | 5 | 1.003 | 4 | −46 | −9 | 52 | |
| Left | mid-CS/PreCG | 6 | 0.891 | 4/6 | −54 | −9 | 19 | |
| Left | Paracentral lobule | 1 | 0.458 | 6 | 0 | −8 | 70 | |
| 6 | Left | Inferior PreCG | 1 | 0.592 | 44 | −46 | −13 | 17 |
| Left | mid-PreCG/CS | 4 | 0.536 | 4/6 | −52 | −6 | 30 | |
| Left | Superior PreCS | 3 | 0.668 | 4 | −50 | −11 | 48 | |
| Left | STG/SMG | 1 | 0.870 | 40 | −52 | −47 | 35 | |
| 7 | Left | MFG | 5 | 1.216 | 6 | −31 | −1 | 58 |
| Left | SFG | 4 | 0.734 | 6 | −18 | 3 | 57 | |
| Left | mid-PreCG | 16 | 1.242 | 4/6 | −42 | −5 | 44 | |
| Left | SMG | 14 | 1.530 | 40 | −54 | −45 | 32 | |
| Left | Insula | 1 | 0.713 | 14 | −46 | 6 | 5 | |
| Left | Cerebellum | 10 | 1.073 | −22 | −61 | −10 | ||
| Right | MFG | 17 | 0.788 | 6/8 | 39 | 2 | 54 | |
| Right | SFG | 11 | 1.327 | 8 | 4 | 3 | 62 | |
| Right | mid-CS | 3 | 0.712 | 4 | 48 | −23 | 46 | |
| Right | Inferior PreCG | 3 | 0.972 | 4 | 48 | −7 | 56 | |
| Right | mid-STG | 7 | 1.226 | 22 | 57 | −18 | 0 | |
| Right | FG | 2 | 1.211 | 19/37 | 36 | −61 | −5 | |
| Right | Cerebellum | 10 | 1.073 | 43 | −61 | −14 | ||
| 8 | Left | mid-PreCG | 1 | 0.867 | 4 | 50 | −13 | 54 |
| 9 | Left | SMG | 1 | 0.677 | 40 | −55 | −43 | 30 |
| Left | mid-CS | 1 | 1.114 | 4 | −42 | −21 | 49 | |
| 10 | Left | Paracentral lobule | 1 | 0.758 | 6 | −2 | −1 | 71 |
| Left | mid-CS | 3 | 0.701 | 4 | −16 | −11 | 48 | |
| Left | Sylvian fissure | 5 | 1.063 | 6/44 | −48 | −1 | 19 | |
| Left | AG | 2 | 0.579 | 40 | −32 | −48 | 58 | |
| Right | mid-PreCG | 2 | 0.535 | 6/8 | 24 | 2 | 48 | |
| Right | SPL | 4 | 1.148 | 7 | 22 | −60 | 66 | |
| 11 | Left | PreCG | 2 | 0.719 | 4 | −40 | −12 | 57 |
| Right | mid-PreCG | 2 | 0.564 | 6 | 54 | −4 | 32 | |
| Right | Superior PreCG | 4 | 0.725 | 3/4 | 52 | −11 | 49 | |
| 12 | Left | IPS | 1 | 0.869 | 19 | −28 | −77 | 35 |
| 13 | Left | STG | 3 | 0.133 | 22 | −50 | −42 | 13 |
| 14 | Left | Anterior MFG | 4 | 0.820 | 9/46 | −34 | 34 | 28 |
| Left | Posterior MFG | 2 | 0.777 | 6 | −30 | −7 | 69 | |
| Medial | SFG | 22 | 0.872 | 6 | −1 | −3 | 65 | |
| Left | mid-PreCG | 24 | 1.108 | 4/6 | −55 | −4 | 46 | |
| Left | Posterior STG | 1 | 0.606 | 22 | −59 | −44 | 13 | |
| Left | Posterior STS | 1 | 0.735 | 40 | −50 | −36 | 26 | |
| Left | SMG | 1 | 0.650 | 40 | −61 | −41 | 39 | |
| Left | IPS | 2 | 2.421 | 7 | −24 | −69 | 63 | |
| Right | mid-PreCG | 5 | 0.644 | 4/6 | 54 | −6 | 42 | |
| Right | Cerebellum | 2 | 0.833 | 48 | −62 | −12 | ||
| 15 | Left | mid-PreCG | 10 | 0.910 | 4 | −54 | −13 | 49 |
| Left | mid-STG | 2 | 0.773 | 22 | −54 | −33 | 13 | |
| Left | Posterior STG | 2 | 0.836 | 22 | −54 | −43 | 11 | |
| Left | SMG | 3 | 0.666 | 40 | −34 | −41 | 48 | |
| Right | MFG | 2 | 0.550 | 9 | 42 | 31 | 36 | |
| Medial | SFG | 4 | 0.655 | 6 | 0 | −14 | 71 | |
| Right | SMG | 1 | 0.654 | 40 | 44 | −42 | 54 | |
| Right | Cerebellum | 1 | 0.483 | 30 | −71 | −12 | ||
| 16 | Left | mid-PreCG | 1 | 0.204 | 4 | −50 | −13 | 54 |
| 17 | Left | Superior PreCG | 3 | 0.415 | 4/6 | −48 | −3 | 57 |
| Left | mid-PreCG | 4 | 1.271 | 4 | −52 | 2 | 43 | |
| Left | SPL | 1 | 0.315 | 7 | −20 | −65 | 52 | |
| Left | Temporal pole | 1 | 1.225 | 28 | −16 | −15 | −20 | |
| Right | MFG | 1 | 0.380 | 9 | 50 | 25 | 34 | |
| 18 | Medial | SFG | 5 | 0.546 | 6 | 2 | 1 | 61 |
| Left | mid- PreCG/PreCS | 3 | 0.580 | 4 | −48 | −7 | 51 | |
| Left | SPL | 2 | 0.623 | 7 | −14 | −69 | 61 | |
| Right | Inferior PoCG | 1 | 0.486 | 4 | 54 | −5 | 50 | |
| 19 | Left | MFG/PreCG | 30 | 1.548 | 4/6 | −48 | −9 | 59 |
| Left | SFS | 1 | 0.974 | 6 | −18 | 11 | 64 | |
| Left | Superior PreCG | 3 | 1.654 | 6 | −40 | −20 | 71 | |
| Left | mid-PreCG | 3 | 1.120 | 4 | −54 | −17 | 41 | |
| Left | STS/STG | 6 | 0.880 | 22 | −60 | −41 | 4 | |
| Left | IPS | 6 | 1.135 | 7 | −36 | −77 | 52 | |
| Right | MFG | 1 | 1.207 | 6 | 30 | 1 | 59 | |
| Medial | SFG | 8 | 0.909 | 6 | 4 | 1 | 63 | |
| Medial | ACC | 3 | 0.950 | 6 | 4 | 12 | 49 | |
| 20 | Left | SMG | 1 | 0.261 | 40 | −46 | −49 | 36 |
| 21 | Left | mid-PreCG | 2 | 0.308 | 4/6 | −44 | −5 | 46 |
| Left | IPS/SPL | 1 | 0.450 | 7 | −25 | −65 | 58 | |
| Medial | SFG | 2 | 0.490 | 6 | −2 | 9 | 68 | |
| 22 | Left | mid-PreCG | 1 | 1.341 | 4 | −52 | −11 | 56 |
| Left | mid-PreCS | 2 | 1.005 | 4/6 | −48 | −3 | 57 | |
| Left | Medial SFG | 3 | 1.086 | 6 | 4 | 5 | 66 | |
| Left | Ventral IFG | 1 | 1.025 | 40 | −59 | −32 | 24 | |
| Left | STG | 1 | 0.847 | 21 | −55 | −62 | −4 | |
| Right | PreCG | 2 | 1.688 | 4 | 44 | −3 | 50 | |
| Right | MTG | 3 | 1.093 | 22 | 55 | −34 | 15 | |
| 23 | Left | PreCG | 2 | 0.496 | 4 | −54 | −13 | 47 |
| 24 | Left | SPL | 5 | 0.935 | 7 | −24 | −76 | 48 |
Bold text identifies the brain region selected as the rTMS SS target for the subject. ACC, Anterior cingulate cortex; AG, angular gyrus; CS, central sulcus; FG, fusiform gyrus; IFG, inferior frontal gyrus; IPS, intraparietal sulcus; MFG, middle frontal gyrus; PCC, posterior cingulate gyrus; PoCG, postcentral gyrus; PoCS, postcentral sulcus; PreCG, precentral gyrus; PreCS, precentral sulcus; SFG, superior frontal gyrus; SMG, supramarginal gyrus; SPL, superior parietal lobule; STG, superior temporal gyrus; STS, superior temporal sulcus.
rTMS
Table 1 identifies the SS voxels selected as the rTMS target in each subject. The data from two subjects (1 and 23) were removed from additional analyses because they contained outlying values for accuracy on some trials (>2.5 SDs from group means). ANOVA of the accuracy data (Fig. 2) with the factors region (SS, SNGA) and rTMS (present, absent) revealed no main effect of region (F(1,21) = 0.17; NS), a significant main effect of rTMS (F(1,21) = 7.40; p < 0.05), and a significant interaction (F(1,21) = 5.37; p < 0.05). This interaction was carried by the significant decrease in accuracy for rTMS-present versus rTMS-absent trials for the SS targets (t(21) = 3.03; p < 0.01). The same pairwise comparison for the PFC site yielded (t(21) = −0.14; NS). ANOVA of the RT data (Fig. 2) did not reveal any significant effects (F values <3.61).
Figure 2.

Aggregated results from the task for the rTMS session. A, Results for accuracy data (rTMS-absent, white bars; rTMS-present, gray bars). B, Results for RT data (rTMS-absent, white bars; rTMS-present, gray bars). Error bars depict within-subjects SEM.
Discussion
In the present study, we used rTMS to evaluate the necessity for the short-term storage of verbal information of brain areas identified by different types of fMRI data analysis. SS analyses detected load-sensitive brain regions whose localization was highly variable across subjects, a result that replicated our previous findings with this same task (Feredoes and Postle, 2007). Targeting these SS-identified regions with delay-period rTMS produced a significant disruption of performance, whereas rTMS of the PFC region identified with an SNGA analysis (of data from a different sample drawn from the same population) had no effect on performance. These results support several conclusions. First, the localization of neural systems that make a necessary contribution to the short-term storage of verbal information can be highly variable across individuals. Second, SS analyses can detect these same “necessary regions.” Third, SNGA analyses may not always detect these necessary regions. Fourth, regions detected by SNGA analyses may not turn out to make necessary contributions to task performance. At a practical level, these results illustrate the value of SS analysis methods for fMRI studies of behaviors that might be associated with a high level of intersubject variability at the neural level.
One important question raised by these findings is what factors might account for the intersubject variability of the topography of storage-related activity? One factor may be the multiplicity of mental codes (and, therefore, of neural systems) with which subjects could represent the visually presented stimuli. For example, the detection of delay-period load sensitivity in left hemisphere perisylvian regions in the majority of the subjects is consistent with the idea that the short-term retention of verbal information can be subserved by the very same systems that support, for example, the acoustic, lexical, phonological, and speech-based representation of this information in circumstances that do not require WM (for review, see Postle, 2006). Additionally, the prevalence of load-sensitive activity in left sensorimotor cortex is consistent with evidence that hand motor circuits are engaged in tasks requiring counting or putting items (including letters) in correspondence with elements of an ordered series (Andres et al., 2007). Another factor may be the existence of degeneracy within neural systems supporting this cognitive task. This refers to the principle that more than one set of brain systems can, independently, support the same cognitive function (Price and Friston, 2002). Finally, frank variability in structural and functional anatomy may account for some of this variability (Devlin and Poldrack, 2007).
Another set of questions raised by the results of the SS analyses relates to the interpretation of delay-period load sensitivity detected in the MFG of six subjects. At the empirical level, one might ask whether targeting these regions would have disrupted the performance of these subjects in a manner comparable with the effect produced by targeting posterior SS analysis-identified regions. At the functional level, one might ask whether the activity in these regions, in these subjects, supports storage in the same way that we believe storage is being supported by the posterior regions targeted in this study. The response to the empirical question might seem to be straightforward: Because the same procedures and criteria were used to identify these MFG regions as were used to identify the posterior regions, one should predict that targeting the MFG regions would have the same effect as what we obtained by targeting the posterior regions. This prediction would have to be tempered, however, by the evidence that patients with gross PFC lesions (D'Esposito and Postle, 1999) and with neurological disorders that compromise frontal lobe functioning [e.g., traumatic brain injury and Parkinson's disease (D'Esposito and Postle, 2000)] are unimpaired on span tasks that emphasize the short-term storage of information. The response to the functional question, given our current state of knowledge, must also be cautious. One possibility is that, in these six subjects, the short-term storage of verbal information is supported by the MFG activity identified by the SS analyses. (Note that this possibility would be difficult to reconcile with the idea of the existence of a PFC-based buffer that typifies the architecture of human verbal WM, because of the variability across these six subjects of where in the MFG the delay-period load-sensitive effects were identified.) A second is that this activity may represent any of a number of other functions that have been ascribed to the PFC and that might be sensitive to variations in load. These include, but are not limited to, deploying selective attention (Passingham and Sakai, 2004), exerting control to protect the contents of WM from internally (Thompson-Schill et al., 2002; Feredoes et al., 2006) or externally (Chao and Knight, 1998; Postle, 2005) generated interference, manipulating the contents of WM toward achieving behavioral goals (Owen et al., 1996; Postle et al., 2006), and maintaining a representation of task rules and/or other information critical for the flexible control of behavior (Miller and Cohen, 2001; Bunge et al., 2003; Hon et al., 2006). Regardless of which of these conceptualizations is to be preferred, an important question for future research will be whether individual differences in WM capacity or some other “trait” might predict which subjects do or do not recruit MFG during performance of delayed-recognition tasks (Rypma et al., 2002).
Methodologically, these results raise questions about the interpretability of SNGA analyses applied to data from cognitive tasks that, like this delayed-recognition task, may be characterized by considerable intersubject topographical variability. For example, one assumption underlying the SNGA approach is that, although it may not capture the “activation peak” in each subject in the sample, it will, by virtue of detecting the loci of overlap of many tails of individual activation peaks, identify a reasonable estimate of the central tendency from the data. This assumption was not supported, however, in the present dataset. The spatial resolution of rTMS (Walsh and Pascual-Leone, 2003) is such that it would certainly have affected an area large enough to affect not only the hypothetical “tails,” but also the hypothetical “peaks” of load-sensitive regions, had the SNGA analysis of our previous dataset (Feredoes and Postle, 2007) identified such an overlap of tails. Instead, the lack of an effect of rTMS applied to this region reinforces the observation that the activity extracted from the SNGA-derived region of interest did not appear to be task related in the data of most individual subjects. Thus, when the true range of intersubject topographical variability of a cognitive function exceeds the level of smoothness in the data, the SNGA approach to fMRI data analysis may be poorly suited to detect functionally important activity.
Footnotes
This work was supported by National Institutes of Health Grant MH064498 (B.R.P.) and National Alliance for Research on Schizophrenia and Depression (G.T.). We thank Emilee Castelli and Eric Steinbrueck for assistance with data collection.
References
- Andres M, Seron X, Olivier E. Contribution of hand motor circuits to counting. J Cogn Neurosci. 2007;19:563–576. doi: 10.1162/jocn.2007.19.4.563. [DOI] [PubMed] [Google Scholar]
- Bunge SA, Kahn IA, Wallis JD, Miller EK, Wagner AD. Neural circuits subserving the retrieval and maintenance of abstract rules. J Neurophysiol. 2003;90:3419–3428. doi: 10.1152/jn.00910.2002. [DOI] [PubMed] [Google Scholar]
- Chao L, Knight R. Contribution of human prefrontal cortex to delay performance. J Cogn Neurosci. 1998;10:167–177. doi: 10.1162/089892998562636. [DOI] [PubMed] [Google Scholar]
- D'Esposito M, Postle BR. The dependence of span and delayed-response performance on prefrontal cortex. Neuropsychologia. 1999;37:1303–1315. doi: 10.1016/s0028-3932(99)00021-4. [DOI] [PubMed] [Google Scholar]
- D'Esposito M, Postle BR. Neural correlates of processes contributing to working memory function: evidence from neuropsychological and pharmacological studies. In: Monsell S, Driver J, editors. Control of cognitive processes: attention and performance XVIII. Cambridge, MA: MIT; 2000. pp. 579–602. [Google Scholar]
- Devlin JT, Poldrack RA. In praise of tedious anatomy. NeuroImage. 2007;37:1033–1044. doi: 10.1016/j.neuroimage.2006.09.055. [DOI] [PMC free article] [PubMed] [Google Scholar]
- Feredoes E, Postle BR. Localization of load sensitivity of working memory storage: quantitatively and qualitatively discrepant results yielded by single-subject and group-averaged approaches to fMRI group analysis. NeuroImage. 2007;35:881–903. doi: 10.1016/j.neuroimage.2006.12.029. [DOI] [PMC free article] [PubMed] [Google Scholar]
- Feredoes E, Tononi G, Postle BR. Direct evidence for a prefrontal contribution to the control of proactive interference in verbal working memory. Proc Natl Acad Sci USA. 2006;103:19530–19534. doi: 10.1073/pnas.0604509103. [DOI] [PMC free article] [PubMed] [Google Scholar]
- Holmes AP, Friston KJ. Generalisability, random effects and population inference. NeuroImage. 1998;7:S754. [Google Scholar]
- Hon N, Epstein RA, Owen AM, Duncan J. Frontoparietal activity with minimal decision and control. J Neurosci. 2006;26:9805–9809. doi: 10.1523/JNEUROSCI.3165-06.2006. [DOI] [PMC free article] [PubMed] [Google Scholar]
- Miller EK, Cohen J. An integrative theory of prefrontal cortex function. Annu Rev Neurosci. 2001;24:167–202. doi: 10.1146/annurev.neuro.24.1.167. [DOI] [PubMed] [Google Scholar]
- Narayanan N, Prabhakaran V, Bunge SA, Christoff K, Fine EM, Gabrieli JD. The role of prefrontal cortex in the maintenance of verbal working memory information: an event-related fMRI analysis. Neuropsychology. 2005;19:223–232. doi: 10.1037/0894-4105.19.2.223. [DOI] [PubMed] [Google Scholar]
- Owen AM, Morris RG, Sahakian BJ, Polkey CE, Robbins TW. Double dissociations of memory and executive functions in working memory tasks following frontal lobe excisions, temporal lobe excisions or amygdalo-hippocampectomy in man. Brain. 1996;119:1597–1615. doi: 10.1093/brain/119.5.1597. [DOI] [PubMed] [Google Scholar]
- Passingham D, Sakai K. The prefrontal cortex and working memory: physiology and brain imaging. Curr Opin Neurobiol. 2004;14:163–168. doi: 10.1016/j.conb.2004.03.003. [DOI] [PubMed] [Google Scholar]
- Postle BR. Delay-period activity in prefrontal cortex: one function is sensory gating. J Cogn Neurosci. 2005;17:1679–1690. doi: 10.1162/089892905774589208. [DOI] [PMC free article] [PubMed] [Google Scholar]
- Postle BR. Working memory as an emergent property of the mind and brain. Neuroscience. 2006;139:23–38. doi: 10.1016/j.neuroscience.2005.06.005. [DOI] [PMC free article] [PubMed] [Google Scholar]
- Postle BR, Berger JS, D'Esposito M. Functional neuroanatomical double dissociation of mnemonic and executive control processes contributing to working memory performance. Proc Natl Acad Sci USA. 1999;96:12959–12964. doi: 10.1073/pnas.96.22.12959. [DOI] [PMC free article] [PubMed] [Google Scholar]
- Postle BR, Ferrarelli F, Hamidi M, Feredoes E, Massimini M, Peterson MJ, Alexander A, Tononi G. Repetitive transcranial magnetic stimulation dissociates working memory manipulation from retention functions in prefrontal, but not posterior parietal, cortex. J Cogn Neurosci. 2006;18:1712–1722. doi: 10.1162/jocn.2006.18.10.1712. [DOI] [PubMed] [Google Scholar]
- Price CJ, Friston KJ. Degeneracy and cognitive anatomy. Trends Cogn Sci. 2002;6:416–421. doi: 10.1016/s1364-6613(02)01976-9. [DOI] [PubMed] [Google Scholar]
- Rypma B, Berger JS, D'Esposito M. The influence of working memory demand and subject performance on prefrontal cortical activity. J Cogn Neurosci. 2002;14:721–731. doi: 10.1162/08989290260138627. [DOI] [PubMed] [Google Scholar]
- Stokes MG, Chambers CD, Gould IC, Henderson TR, Janko NE, Allen NB, Mattingley JB. Simple metric for scaling motor threshold based on scalp-cortex distance: application to studies using transcranial magnetic stimulation. J Neurophysiol. 2005;94:4520–4527. doi: 10.1152/jn.00067.2005. [DOI] [PubMed] [Google Scholar]
- Thompson-Schill S, Jonides J, Marshuetz C, Smith EE, D'Esposito M, Kan IP, Knight RT, Swick D. Effects of frontal lobe damage on interference effects in working memory. Cogn Affect Behav Neurosci. 2002;2:109–120. doi: 10.3758/cabn.2.2.109. [DOI] [PubMed] [Google Scholar]
- Walsh V, Pascual-Leone A. Transcranial magnetic stimulation: a neurochronometrics of mind. Cambridge, MA: MIT; 2003. [Google Scholar]
- Zarahn E, Rakitin B, Abela D, Flynn J, Stern Y. Positive evidence against human hippocampal involvement in working memory maintenance of familiar stimuli. Cereb Cortex. 2005;15:303–316. doi: 10.1093/cercor/bhh132. [DOI] [PubMed] [Google Scholar]