

Abstract
We provide the first evidence for the capability of a high-resolution positron emission tomographic (PET) imaging system in quantitatively mapping amyloid accumulation in living amyloid precursor protein transgenic (Tg) mice. After the intravenous administration of N-[11C]methyl-2-(4′-methylaminophenyl)-6-hydroxybenzothiazole (or [11C]PIB for “Pittsburgh Compound-B”) with high-specific radioactivity, the Tg mice exhibited high-level retention of radioactivity in amyloid-rich regions. PET investigation for Tg mice over an extended range of ages, including longitudinal assessments, demonstrated age-dependent increase in radioligand binding consistent with progressive amyloid accumulation. Reduction in amyloid levels in the hippocampus of Tg mice was also successfully monitored by multiple PET scans along the time course of anti-amyloid treatment using an antibody against amyloid β peptide (Aβ). Moreover, PET scans with [18F]fluoroethyl-DAA1106, a radiotracer for activated glia, were conducted for these individuals parallel to amyloid imaging, revealing treatment-induced neuroinflammatory responses, the magnitude of which intimately correlated with the levels of pre-existing amyloid estimated by [11C]PIB. It is also noteworthy that the localization and abundance of [11C]PIB autoradiographic signals were closely associated with those of N-terminally truncated and modified Aβ, AβN3-pyroglutamate, in Alzheimer's disease (AD) and Tg mouse brains, implying that the detectability of amyloid by [11C]PIB positron emission tomography is dependent on the accumulation of specific Aβ subtypes. Our results support the usefulness of the small animal-dedicated PET system in conjunction with high-specific radioactivity probes and appropriate Tg models not only for clarifying the mechanistic properties of amyloidogenesis in mouse models but also for preclinical tests of emerging diagnostic and therapeutic approaches to AD.
Keywords: Alzheimer's disease, amyloid, positron emission tomography, transgenic, immunotherapy, neuroinflammation
Introduction
The diagnosis of Alzheimer's disease (AD) does not become definite unless neuropathologists examine the autopsied brain and score AD-characteristic amyloid lesions, which are known as senile plaques and neurofibrillary tangles that are mechanistically implicated in neurodegenerative processes. Meanwhile, attempts to noninvasively visualize amyloid deposition in human brains using positron emission tomography have been made by developing imaging agents capable of reacting with amyloid fibrils (Sair et al., 2004; Nichols et al., 2006), among which N-[11C]methyl-2-(4′-methylaminophenyl)-6-hydroxybenzothiazole (or [11C]PIB for “Pittsburgh Compound-B”) is the most intensively evaluated in human positron emission tomographic (PET) studies (Klunk et al., 2004; Price et al., 2005; Engler et al., 2006; Mintun et al., 2006). The ability of [11C]PIB to detect amyloid in patients with mild cognitive impairment (MCI) (Price et al., 2005) and in a nondemented population (Mintun et al., 2006) has suggested the potential of this probe for identifying the AD pathology antecedent to the clinical onset. Meanwhile, notable accumulation of this and other amyloid tracers in some amyloid-unrelated regions of human brains (Shoghi-Jadid et al., 2002; Klunk et al., 2004; Verhoeff et al., 2004) might arouse controversy over the specificity of this imaging technique for neurodegenerative pathologies. To efficiently exploit radioligands suitable for the purpose of establishing an early and sensitive marker of brain amyloidosis, or an objective measure of neuropathological severity in the progression of AD, preclinical screening of the candidate compounds by using in vivo systems is highly requisite. Such systems could also promote a proof-of-concept study on novel treatments (Scarpini et al., 2003) capable of suppressing neurotoxic amyloid aggregates.
There have been numerous lines of transgenic (Tg) mice that overexpress human mutant amyloid precursor protein (APP) causative of familial AD and recapitulate plaque pathology in AD brains (Hsiao et al., 1996; Sturchler-Pierrat et al., 1997). As shown by several investigations (Bacskai et al., 2003; Higuchi et al., 2005; Hintersteiner et al., 2005), use of fluorescent and magnetic resonance imaging (MRI) probes offers methodologies to capture brain amyloid in these animals. However, optical and MRI tracers need to be administered to achieve ∼1 μm levels, which is much higher than that required for PET tracers (∼1 nm levels) and thus might influence the course of amyloid pathogenesis particularly in longitudinal multiscan experiments. Although improvements of both detection instruments and imaging agents to increase sensitivity of these modalities are ongoing, visualization of mouse amyloid by positron emission tomography would open a new avenue for monitoring the dynamic status of amyloid deposition in living brains with minimal interference. Additional major benefits of PET imaging are also offered by the flexibility in designing imaging probes for specific purposes, allowing us to target different molecules of interest in the same individuals. This is of pivotal importance in the mechanistic evaluation of amyloid β peptide (Aβ) immunization and other related anti-amyloid treatments (Dodel et al., 2003), because a PET ligand for peripheral benzodiazepine receptor (PBR), termed [18F]fluoroethyl(FE)-DAA1106, which we have recently developed for capturing glial activation (Zhang et al., 2004), can be used in combination with amyloid probes to longitudinally assess the contribution of neuroinflammation to therapeutic and adverse effects.
The aim of this study was to prove the power of animal PET technology in pursuit of amyloidogenesis and evaluation of emerging anti-amyloid treatments. Two independent groups demonstrated that [11C]PIB PET data in brains of mice developing abundant plaque lesions were virtually indistinguishable from those in wild-type (WT) mouse brains (Klunk et al., 2005; Toyama et al., 2005). A possible reason for the insensitivity of PET imaging in capturing mouse amyloid may lie in the paucity of high-affinity binding sites for the radioligand in APP Tg mouse brains compared with AD brains (Klunk et al., 2005). Thus, we have overcome this problem by administering [11C]PIB synthesized with high specific radioactivity and consequently less nonradioactive competitors, which facilitates binding of the radioactive compound to the target molecule. Furthermore, advantages of in vivo PET measurement of amyloid have been reinforced by paralleling assays using [11C]PIB and [18F]FE-DAA1106 to follow the course of Aβ immunization.
Materials and Methods
Animals.
The animals were maintained and handled in accordance with the recommendations of the National Institutes of Health and institutional guidelines of the National Institute of Radiological Sciences. All animal experiments conducted here were approved by the Animal Ethics Committee of the National Institute of Radiological Sciences.
Tg mice termed APP23 mice, which overexpress the Swedish doubly mutant APP751 under the control of a neuron-specific Thy-1 promoter element, were generated as described in detail previously (Sturchler-Pierrat et al., 1997). The strain was maintained on a C57BL/6J background, and female mice were used for the experiments. Female non-Tg littermates were also used as WT controls.
Generation of MRI template.
A 12-month-old C57BL/6J mouse was lethally anesthetized by pentobarbital. The mouse head was embedded in 3% aqueous agarose and scanned by a 9.4 tesla AVANCE 400WB imaging spectrometer (Bruker BioSpin, Ettlingen, Germany), as described previously (Higuchi et al., 2005). Coronal T2-weighted MR images were acquired by using a three-dimensional (3D) fast spin-echo sequence with the following imaging parameters: echo time, 5.5 ms; repetition time, 3000 ms; RARE (rapid acquisition with relaxation enhancement) factor, 32; field of view (FOV), 20 × 20 × 25 mm3; matrix dimensions, 256 × 512 × 60; nominal resolution, 78 × 39 × 417 μm. The MRI data were used as an anatomical template for the subsequent PET studies.
Ex vivo autoradiography and histochemical examinations.
Ex vivo assessment of regional brain radioactivity concentration was conducted in Tg and WT mice. The animals were given injections of [11C]PIB (18.5–37 MBq) in the tail vein under anesthesia with 1–1.5% (v/v) isoflurane in air (2 ml/min flow rate). After the tracer injection, the mice were killed by decapitation, and brains were immediately removed and frozen in powdered dry ice. Frozen brain tissue was coronally cut into 20-μm-thick sections by HM560 cryotome (Carl Zeiss, Jena, Germany). The slices were subsequently dried under warm blowing air and contacted to an imaging plate (FujiFilm, Tokyo, Japan) for 2 h. The imaging plate data were scanned by a BAS5000 system (FujiFilm). The intensity of radioactive signals was measured by Multi Gauge software (FujiFilm). The radiotracer uptake was calculated as percentage of injected dose (%ID) per tissue volume (ml) uncorrected (%ID/ml) and corrected (%ID · kg/ml) for body weight.
After the radioactivity was allowed to decay, brain sections used for the autographic assay were fixed with 4% paraformaldehyde in PBS and stained with either 0.01% (E,E)-1-fluoro-2,5-bis(3-hydroxycarbonyl-4-hydroxy)styrylbenzene (FSB; Dojindo Laboratories, Kumamoto, Japan) (Sato et al., 2004; Higuchi et al., 2005), a fluorinated analog of the well characterized amyloid-binding compound termed X-34 (Styren et al., 2000; Ikonomovic et al., 2006), or 0.01% BTA-1 (Sigma-Aldrich, St. Louis, MO) in 50% ethanol, as described previously (Sato et al., 2004; Higuchi et al., 2005). The FSB-stained samples were also immunostained with a mouse monoclonal anti-Aβ antibody (6E10; Signet Laboratories, Dedham, MA).
Radiochemical synthesis.
The radiosynthesis of [11C]PIB was instituted by using protected precursor and high-specific radioactivity [11C]methyl triflate. Briefly, [11C]methyl iodide was synthesized with high specific radioactivity by single-pass reaction of [11C]methane with I2 (Noguchi and Suzuki, 2003; Zhang and Suzuki, 2005). Subsequently, [11C]methyl triflate was synthesized for radiochemical reaction and was transferred into 300 μl of anhydrous acetone containing 1 mg of 2-(4-aminophenyl)-6-methoxymethoxybenzothiazole. After the trapping was finished, a solution of methanol/HCl (500 μl, 2:1 methanol/concentrated HCl) was used to remove the protective group, and the reaction was heated at 100°C for 2 min. HPLC purification was performed on a YMC-Pack ODS-AQ-324 column (10 mm ID × 300 mm) (YMC, Kyoto, Japan) using a mobile phase of 50:50 acetonitrile/H2O at a flow rate of 6.0 ml/min. The radioactive fraction corresponding to [11C]PIB was collected in a sterile flask containing 75 μl of polysorbate 80 and 300 μl of ethanol, evaporated to dryness under vacuum, redissolved in 10 ml of sterile normal saline, and passed through a 0.22 μm Millipore (Billerica, MA) FG filter for quality analysis and animal experiments. The radiochemical purity of the resultant compound was 97.6 ± 0.18%, and the specific radioactivity was 291 ± 10.3 GBq/μmol at the end of synthesis. Nonradioactive PIB and the precursor used for the radiosynthesis were custom made by KNC Laboratories (Kobe, Japan).
[18F]FE-DAA1106, a PET ligand for PBR, was radiosynthesized using its desmethyl precursor, DAA1123 (generously provided by Taisho Pharmaceutical, Tokyo, Japan), as described previously in detail (Zhang et al., 2004). The radiochemical purity of the end product exceeded 95%, and the specific radioactivity was 120 ± 20.5 GBq/μmol at the end of synthesis.
Small-animal PET imaging.
All PET scans were performed using a micro-PET Focus 220 animal scanner (Siemens Medical Solutions USA, Knoxville, TN) designed for rodents and small monkeys, which provides 95 transaxial slices 0.815 mm (center-to-center) apart, a 19.0 cm transaxial FOV, and a 7.6 cm axial FOV (Tai et al., 2005). Before the scans, the mice were anesthetized with 1.5% (v/v) isoflurane. After transmission scans for attenuation correction using a 68Ge-68Ga point source, emission scans were acquired for 60 min in a 3D list mode with an energy window of 350–750 keV, immediately after the intravenous injection of [11C]PIB (30.0 ± 6.8 MBq) or [18F]FE-DAA1106 (15.3 ± 4.6 MBq). All list-mode data were sorted into 3D sinograms, which were then Fourier rebinned into two-dimensional sinograms (frames: 10 × 1, 8 × 5, and 1 × 10 min). Summation images from 0 to 30 min and from 30 to 60 min after [11C]PIB injection were reconstructed with maximum a posteriori (MAP) reconstruction, and dynamic images were reconstructed with filtered backprojection using a 0.5 mm Hanning's filter. Volumes of interest were placed on multiple brain areas using PMOD image analysis software (PMOD Group, Zurich, Switzerland) with reference to the MRI template.
To assess the capability of the present imaging system in monitoring the effects of anti-amyloid treatment, we scanned WT and Tg mice at multiple time points during the time course of passive Aβ immunization. Intrahippocampal injection of anti-Aβ antibody was performed based on established procedures (Wilcock et al., 2003). Three Tg mice aged 20, 21, and 24 months and two WT mice aged 5 and 8 months were anesthetized with 1.5% (v/v) isoflurane and placed in a stereotactic frame (Narishige, Tokyo, Japan). Using a 30 gauge needle connected to a 10 μl Hamilton (Reno, NV) syringe, 1 μl of mouse monoclonal antibody against the N-terminal portion of Aβ (6E10, 1 mg/ml; Signet Laboratories) and vehicle alone were injected into the right and left hippocampi, respectively (stereotactic coordinates: anteroposterior, −2.8 mm; mediolateral, 2.0 mm; dorsoventral, 3.0 mm from the bregma), over 2 min. The needle was thereafter raised by 1 mm, and injection of 1 μl of the solution was repeated. A total of six PET scans using [11C]PIB and [18F]FE-DAA1106 (two tracers 1–2 d apart) were performed for each mouse at 1 or 2 weeks before and 1 and 2 weeks after the antibody injection. Mouse brains were thereafter dissected and histochemically examined with FSB and rabbit polyclonal antibody against ionized calcium-binding adapter molecule 1 (Iba-1; Wako Pure Chemicals, Osaka, Japan) recognizing microglia.
The effects of the ID and specific radioactivity of [11C]PIB on the sensitivity of amyloid detection were also studied. Three Tg mice (age, 19.7 ± 1.5 months) underwent two PET scans 1–2 weeks apart, each conducted with either high-dose (31.2 ± 5.1 MBq), high-specific radioactivity (∼200 GBq/μmol) or low-dose (3.4 ± 1.1 MBq), middle-specific radioactivity (∼20 GBq/μmol) tracers. In the middle-specific radioactivity experiment, two mice received [11C]PIB, which was kept at room temperature until its specific radioactivity had dropped to the assigned value, and one mouse was given an injection of the radiotracer (200 μl) mixed with 0.5 μg of cold PIB dissolved in 20 μl of dimethylsulfoxide (DMSO). Moreover, the influence of varying the specific radioactivity alone was examined by scanning one 18-month-old Tg mouse administered with high (∼200 GBq/μmol) and middle (∼20 GBq/μmol) specific radioactivities and another 20-month-old Tg mouse with high, middle, and low (∼0.2 GBq/μmol) specific radioactivities. The middle- and low-specific radioactivity tracers were prepared by adding 0.5 and 50 μg of cold PIB, respectively, in 20 μl of DMSO to the radiotracer solution (200 μl).
In vitro binding of [11C]PIB to amyloid plaques and immunohistochemistry for N- and C-terminal heterogeneity of Aβ.
APP23 Tg mice at 23–31 months of age (n = 5; age, 28.6 ± 1.47 months) were killed by decapitation, and the brains were frozen and cut into 20-μm-thick coronal sections by HM560 cryotome (Carl Zeiss). The sections were mounted on slide glass (Matsunami Glass, Osaka, Japan) and stored at −80°C pending analyses. Similarly, brain sections were obtained from a 23-month-old mouse expressing Swedish mutant APP under the control of hamster prion protein promoter, termed Tg2576 (Hsiao et al., 1996), and an 8-month-old double-Tg mouse generated by crossbreeding Tg2576 mice with mice expressing A260V mutant presenilin-1 (PS-1) (Kametani et al., 2004) under the control of prion protein promoter. In addition, cortical brain sections were generated from the brain of a patient with definite AD (generously provided by Drs. J. Q. Trojanowski and V. M.-Y. Lee, University of Pennsylvania, Philadelphia, PA). Brain sections were incubated in 50 mm Tris-HCl buffer, pH 7.4, containing 5% ethanol and [11C]PIB (37 MBq/L, ∼200 pm) at room temperature for 60 min. Nonspecific binding was determined in the presence of 10 μm nonradioactive PIB. After the reaction, the samples were rinsed with ice-cold Tris-HCl buffer twice for 2 min and dipped into ice-cold water for 10 s. Autoradiograms were obtained as in the above-mentioned ex vivo autoradiography procedure.
After the radioactivity was allowed to decay, brain sections used for the autographic assay were fixed with 4% paraformaldehyde in PBS and either immunostained with a rabbit polyclonal antibody against AβN3-pyroglutamate, N3(pE) (Saido et al., 1995), or doubly immunolabeled with a rabbit polyclonal antibody against Aβ40, Ter40, and a mouse monoclonal antibody against Aβ42, 11C. Immunohistochemistry for subadjacent sections was also performed using a rabbit polyclonal antibody against the unmodified N terminus of Aβ, N1D (Saido et al., 1995); a mouse monoclonal antibody against Aβ40, 6A; and a rabbit polyclonal antibody against Aβ42, Ter42.
Statistical analyses.
All statistical examinations in the present study were performed by SPSS (Chicago, IL) software. For comparisons of radiotracer uptake among regions and between WT and Tg mice, we performed two-way, repeated-measures ANOVA. Correlations of two parameters were tested by the t statistic.
Results
Plaque labeling with intravenously injected [11C]PIB
As a consequence of our continuous efforts to reduce nonradioactive byproducts in automated radiosynthesis and to efficiently use the single-pass I2 method for generation of the reactive 11C-labeled precursor (Suzuki et al., 1985; Noguchi and Suzuki, 2003; Zhang and Suzuki, 2005), we were able to synthesize [11C]PIB with a specific radioactivity of 291 ± 10.3 GBq/μmol at the end of synthesis, which much exceeded those of previous small-animal PET studies (37–118 GBq/μmol) (Klunk et al., 2005; Toyama et al., 2005), and administered it to mice immediately after the radiosynthesis (>200 GBq/μmol at the time of injection). We first assessed the pharmacokinetic profile of intravenously injected [11C]PIB in the WT mouse brains by ex vivo autoradiography (supplemental Fig. 1A,B, available at www.jneurosci.org as supplemental material). Although the radiotracer accumulated rapidly in all brain areas, the intensity at 5 and 30 min after injection was relatively high in the subcortical white matter, basal ganglia, thalamus, and pons, similar to the findings in human PET studies for normal controls (Klunk et al., 2004; Price et al., 2005; Mintun et al., 2006). These amyloid-unrelated signals were attenuated thereafter, and no apparent regional differences in radioactivity were noted at 60 min after the tracer injection (supplemental Fig. 1A,B, available at www.jneurosci.org as supplemental material). In addition, no overt effects of age on the radiotracer level at 30 min were observed (supplemental Fig. 1C, available at www.jneurosci.org as supplemental material).
Ex vivo autoradiography of the brains of APP Tg mice at 30 min after the administration of [11C]PIB yielded high-contrast maps of putative plaques that were progressively increased with age (Fig. 1A). Although faint signals were detected in the white matter of both WT and Tg mice, clusters of punctate labeling were found exclusively in the Tg neocortex and hippocampus. Indices of the radiotracer accumulation, both uncorrected (%ID/ml) and corrected (%ID · kg/ml) for body weight, were particularly increased in these regions of the 21-month-old Tg mice compared with the age-matched WT mice (Fig. 1B,C). The levels of tracer binding in the hippocampus and neocortex were also quantified by calculating the ratio of the regional radioactivity against the cerebellum, and a significant difference in the ratio between the two genotypes was observed (Fig. 1D).
Figure 1.
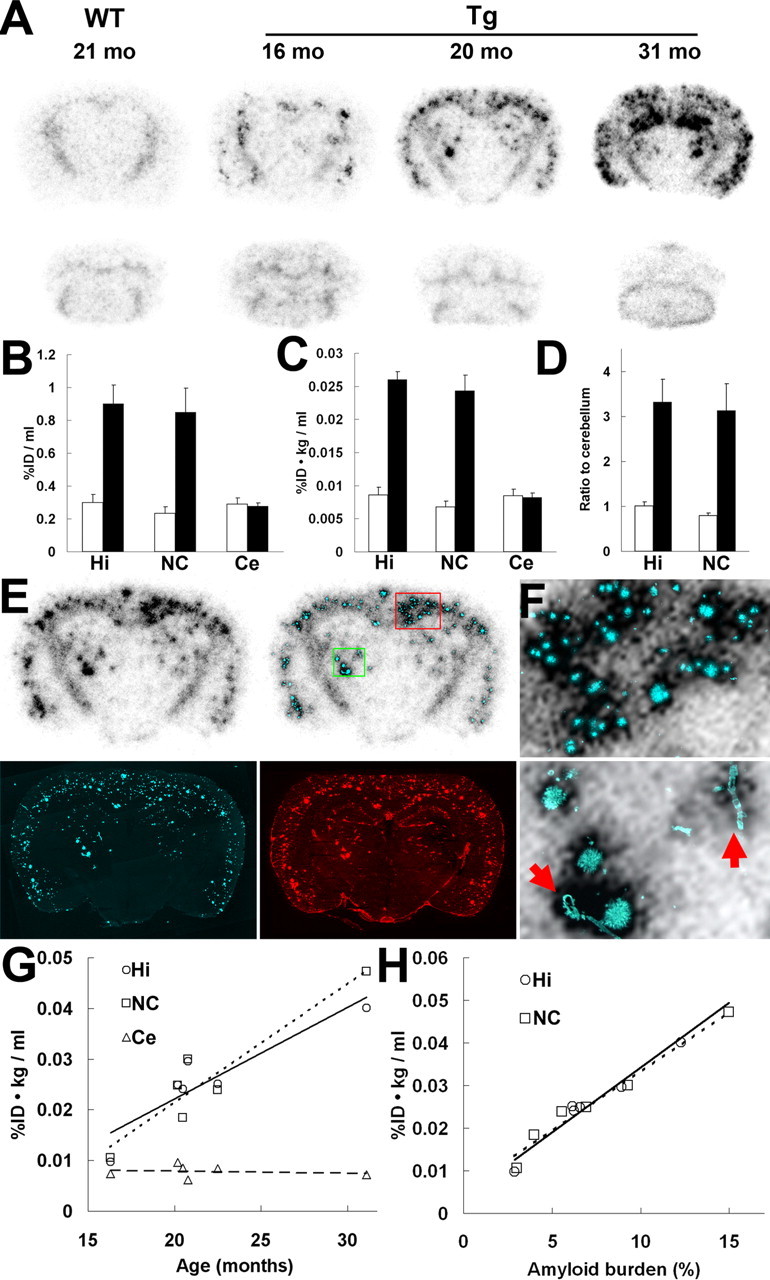
Amyloidosis-associated accumulation of [11C]PIB in ex vivo autoradiographic analysis of APP Tg mouse brains. A, Binding of the radiotracer to putative amyloid plaques primarily located in the neocortex and hippocampus of Tg mice. Images were obtained 30 min after tracer administration. Top and bottom panels represent coronal images at 2 and 7 mm posterior to the bregma, respectively. mo, Month. B, C, Levels of radiotracer at 30 min after injection in the hippocampus, neocortex, and cerebellum of APP Tg (filled bars; n = 4; age, 21.0 ± 0.51 months) and age-matched WT (open bars; n = 5; age, 19.0 ± 1.0 months) mice, indicated as %ID/ml (B) and %ID · kg/ml (C). There were significant main effects of brain regions and genotypes on both %ID/ml (region, F(2,12) = 16.6, p < 0.01; genotype, F(1,6) = 14.7, p < 0.01; 2-way, repeated-measures ANOVA) and %ID · kg/ml (region, F(2,12) = 33.9, p < 0.001; genotype, F(1,6) = 54.3, p < 0.001; 2-way, repeated-measures ANOVA). D, Target-to-cerebellum ratio of radiotracer levels in the hippocampus and neocortex. The ratio was significantly increased in Tg mice (filled bars) relative to WT mice (open bars) (significant main effect of genotype; F(1,6) = 17.0; p < 0.01; 2-way, repeated-measures ANOVA). E, Coronal brain section (at 2 mm posterior to the bregma) obtained from a 20.2-month-old Tg mouse. An ex vivo autoradiographic image (top left) depicts radiotracer distribution at 30 min after intravenous administration. The same sections were subsequently stained with a fluorescent amyloid dye, FSB (bottom left). Merged images (top right) explicitly demonstrate intense accumulation of radiotracer in close association with amyloid plaques. The sections were finally immunostained with anti-Aβ antibody 6E10, and spatial concordance between intense radioactive signals and Aβ-immunoreactive plaques were confirmed (bottom right). F, High-power view of the autoradiographic image overlaid on FSB fluorescence in the neocortical (top panel) and thalamic (bottom panel) regions of the mouse brain shown in E (indicated by red and green squares, respectively). Arrows indicate vascular amyloid. G, Age-associated increase in radiotracer binding in the hippocampus and neocortex of Tg mice (n = 6; age, 21.9 ± 2.0 months; range, 16.3–31.1 months). The correlation between age and radiotracer binding was significant in these plaque-bearing regions (hippocampus, R2 = 0.76 and p < 0.01 by t test; neocortex, R2 = 0.77 and p < 0.01 by t test), in contrast to the cerebellar levels of the tracer unrelated to age (R2 = 0.08; p > 0.05, t test). H, Scatterplot of radiotracer uptake versus amyloid burden (indicated as percentage of target brain area) in the hippocampus and neocortex of Tg mice (n = 6; age, 21.9 ± 2.0 months; range, 16.3–31.1 months), with the correlation of the two parameters being statistically significant in both regions (R2 = 0.96 and 0.97 for hippocampus and neocortex, respectively; p < 0.01, t test). Solid, dotted, and dashed lines in the graphs represent regressions for the hippocampus, neocortex, and cerebellum, respectively. Error bars represent SE. Hi, Hippocampus; NC, neocortex; Ce, cerebellum.
Fluorescence staining of the brain sections used for ex vivo autoradiography demonstrated excellent colocalization of radiotracer labeling with FSB-positive and Aβ-immunoreactive amyloid plaques developed in the Tg mice (Fig. 1E). Detailed examination revealed that not only mature dense-core plaques but also small compact amyloid deposits produced increased radiotracer signals (Fig. 1F, top). It is also noteworthy that the intravenously injected radiotracer accumulated at a high level in the cerebrovascular amyloid (Fig. 1F, bottom). In the Tg mice aged 16–31 months, tracer uptakes in the hippocampus and neocortex were elevated in tight association with age, in clear contrast with the poor correlation between age and cerebellar radiotracer level (Fig. 1G). We also found a significantly close correlation between the load of FSB-stained amyloid and the level of [11C]PIB uptake in the hippocampus and neocortex of these Tg mice (Fig. 1H), suggesting the ability of [11C]PIB to quantitatively measure the amyloid burden in the living brain.
Visualization of amyloid deposition in living APP Tg mice by micro-positron emission tomography
We subsequently applied small-animal-dedicated PET and MRI systems to precise mapping of radioligand in living mouse brains. MAP reconstruction of the data obtained by the micro-PET Focus 220 animal scanner (Siemens Medical Solutions USA) offered high-resolution images illustrating the distribution of [11C]PIB in the WT mouse brain (supplemental Fig. 2A, available at www.jneurosci.org as supplemental material). PET images coregistered with MRI space generated by a 9.4 tesla AVANCE 400WB imaging spectrometer (Bruker BioSpin) indicated high-level uptake of the tracer in the thalamus, pons, and cerebellar white matter, followed by a lower level in the basal ganglia, early in the emission scan. Such regional differences were gradually reduced and had almost disappeared at 60 min after the tracer injection (supplemental Fig. 2A–C, available at www.jneurosci.org as supplemental material).
Consistent with our ex vivo findings, radioactive signals in the PET images at 30–60 min after the administration of [11C]PIB were notably intensified in the hippocampus and neocortex of Tg mice (Fig. 2). The contrast between the WT and Tg mice was recognizable at 17 months of age and became more pronounced with increasing age. Unlike amyloid-rich regions, the cerebellum and pons consistently exhibited low-level signals in both genotypes. The cerebellar time-radioactivity curves corrected for body weight (%ID · kg/ml) in 21-month-old Tg and age-matched WT mice resembled each other (Fig. 3A), whereas those in the hippocampus (Fig. 3B) and neocortex (Fig. 3C) of Tg mice were clearly distinguishable from those of WT mice. It is notable that Tg mice exhibited increased levels of radiotracer retention determined as %ID · kg/ml compared with WT mice, notwithstanding the fact that the average body weight of Tg mice was significantly smaller than that of WT mice (25.7 g vs 31.7 g; p < 0.05, t test). The difference in radiotracer binding between Tg and WT mice was more explicitly displayed by plotting target-to-cerebellum ratios of the radioactivity over the scan time (Fig. 3D,E). We also examined the radioligand binding by calculating the binding potential (combined measure of density of target molecules and affinity of the tracer) using the cerebellar time-radioactivity curve as a reference (Fig. 3F). The binding potential values estimated by the simplified reference tissue model (Lammertsma et al., 1996) were prominently increased in the hippocampus and neocortex of Tg mice compared with those in WT controls. A similar result was obtained by determining the binding potential based on the multilinear reference tissue model (Ichise et al., 2003) (data not shown).
Figure 2.

In vivo detection of amyloid plaques in APP Tg mice at different ages. PET images were generated by averaging dynamic scan data at 30–60 min after administration of [11C]PIB and were overlaid on the MRI template. From left to right, panels represent coronal images at 0, 2, 3, and 7 mm posterior to the bregma. mo, Month.
Figure 3.

Association of regional radiotracer kinetics with brain amyloidosis in APP Tg mice. A–C, Time-radioactivity curves for the cerebellum (A), hippocampus (B), and neocortex (C) acquired from dynamic PET scans for 20- to 22-month-old APP Tg (filled circles; n = 11; age = 21.4 ± 0.30 months) and age-matched WT (open circles; n = 6; age = 21.7 ± 0.76 months) mice given injections of [11C]PIB. D, E, Target-to-cerebellum ratio of radioactivity in the hippocampus (D) and neocortex (E) at different time points. The ratio in Tg mice (filled circles) was progressively elevated toward 60 min after tracer administration, clearly contrasting with the near-steady state in WT mice (open circles) achieved from ∼15 min (significant main effects of time, region and genotype; time, F(17,255) = 55.2, p < 0.001; region, F(1,15) = 22.4, p < 0.001; genotype, F(1,15) = 13.5, p < 0.01; 2-way, repeated-measures ANOVA). F, Binding potential of the radioligand estimated by simplified reference tissue model. The tracer binding was pronouncedly increased in the hippocampus and neocortex of Tg mice (filled columns) compared with WT mice (open columns) (significant main effect of genotype; F(1,10) = 32.8; p < 0.001; 2-way, repeated-measures ANOVA). Error bars represent SE.
The relationship between binding potential and amyloid accumulation was more extensively analyzed by collecting PET data from Tg mice aged 17–29 months (Fig. 4A,B). Radiotracer binding in the hippocampus and neocortex was significantly correlated with age, in line with the progression of amyloidogenesis in these areas. It is of particular significance that the time course of plaque formation in five Tg mice could be pursued by longitudinal PET experiments (Fig. 4A,B, red lines and symbols; representative image data are shown in Fig. 4C,D).
Figure 4.

Ability of mouse PET system to capture progressive amyloidosis during aging. A, B, Scatterplots of binding potential versus age in the hippocampus (A) and neocortex (B) of the Tg mice (total, 25 scans; age, 21.9 ± 0.62 months; range, 16.8–29.0 months), with the correlation of the two parameters being statistically significant in both regions (hippocampus, R2 = 0.79; neocortex, R2 = 0.79; p < 0.001, t test). Black lines represent regression, and red elements indicate longitudinal analysis of the same individuals (n = 5). C, D, Progression amyloid accumulation revealed by the substantial increase in tracer binding in the hippocampal formations of the same animal. PET images were generated by averaging dynamic scan data at 30–60 min after tracer injection and were merged onto the MRI template. mo, Month.
We also compared binding potential values determined by the simplified reference tissue model with distribution volume ratios calculated by Logan's graphical analysis with substitution of cerebellar data in place of arterial input function (Logan et al., 1996) to validate the use of reference tissue models for estimation of radiotracer binding in the mouse brains. The data obtained from all mice undergoing [11C]PIB PET scans demonstrated that the [binding potential + 1] values were highly consistent with the distribution volume ratios for a reasonably broad range of radiotracer accumulation levels (supplemental Fig. 3, available at www.jneurosci.org as supplemental material), and thus both compartmental and graphical methods are considered to be applicable to the kinetic analysis for 60 min dynamic [11C]PIB PET data in mice.
The potential utility of the present imaging system in assessing amyloid levels along the time course of anti-amyloid treatment was also supported by our multiscan, multitracer PET analysis of Tg mice before and 1 and 2 weeks after intrahippocampal injection of anti-Aβ antibody for the purpose of passive Aβ immunization (Wilcock et al., 2003). PET scans of the same individual with [11C]PIB clearly indicated progressive decline of hippocampal amyloid triggered by the local administration of anti-Aβ antibody (Fig. 5A), in clear contrast to the prominent neuroinflammation induced by injected antibody, as monitored by positron emission tomography with [18F]FE-DAA1106 (Fig. 5B). In vivo radiolabeling of amyloid in the antibody-injected hippocampus, estimated as the binding potential for [11C]PIB, was consistently reduced over the time course in all three treated mice (Fig. 5C). Similarly, a notable decrease in the ratio between [11C]PIB radioactivities in the antibody- and vehicle-injected hippocampi was observed (mean ± SE; 1.05 ± 0.02, 0.96 ± 0.01, and 0.88 ± 0.01 before and 1 and 2 weeks after treatment, respectively; F(2,4) = 121.47 and p < 0.001 for the main effect of time by repeated-measures ANOVA). In contrast, the right/left ratio of the PBR level indicated marked activation of glial cells in the antibody-treated hippocampus (Fig. 5D, left). Significantly, the magnitude of neuroinflammatory responses to antibody injection was well correlated with the amount of amyloid (Fig. 5D, right). The therapeutic efficacy of Aβ immunization was confirmed by direct microscopic examination of dissected brains, because marked reduction in amyloid load (Fig. 5E,F,I) and increase in hypertrophic microglia (Fig. 5G,H) were demonstrated. The difference in mean values of amyloid burden between the antibody-injected and untreated hippocampi was 28.1%, which was in good agreement with the mean decline (34.4%) of binding potential in the PET analysis with [11C]PIB over the period of 2 weeks. In contrast to Tg mice, passive Aβ immunization did not increase the levels of [18F]FE-DAA1106 accumulation in WT mouse brains (supplemental Fig. 4A,B, available at www.jneurosci.org as supplemental material), supporting the association between initial Aβ burden and antibody-induced neuroinflammation. Finally, the preincubation of Tg brain sections with anti-Aβ antibody (experimental procedure is described in supplemental Methods, available at www.jneurosci.org as supplemental material) did not markedly attenuate the in vitro radiolabeling of amyloid plaques with [11C]PIB (supplemental Fig. 4C,D, available at www.jneurosci.org as supplemental material), and therefore intracranially injected antibody is unlikely to interfere with the binding of radiotracer to amyloid lesions. This observation is consistent with our in vivo PET data showing decline of [11C]PIB binding between 1 and 2 weeks after antibody injection despite probable washout of antibody from the brain during this period.
Figure 5.
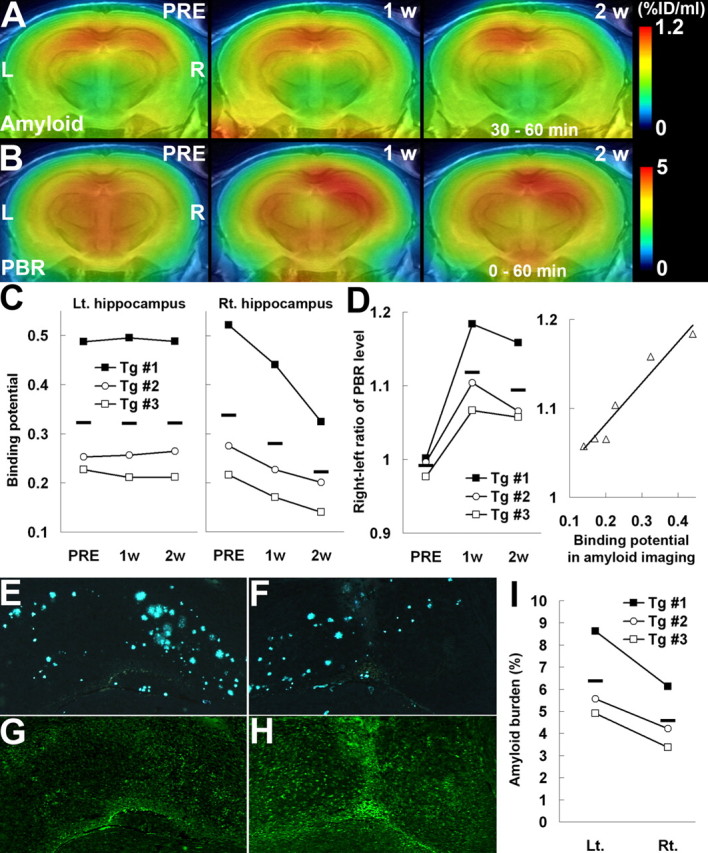
Amyloid elimination and glial activation during the course of anti-amyloid treatment as visualized by longitudinal PET scans. A, B, PET maps of [11C]PIB (A) and [18F]FE-DAA1106 (B) in a 20-month-old APP Tg mouse (Tg #3), generated by averaging dynamic data at 30–60 min (A) and 0–60 min (B), respectively, and superimposed on an MRI template. Images were obtained before (PRE; left), 1 week (1 w; middle), and 2 weeks (2 w; right) after passive Aβ immunization. Vehicle alone and anti-Aβ antibody were injected into the left and right hippocampi, respectively. L, Left; R, right. C, Time course of amyloid elimination quantified by multiple [11C]PIB PET scans during the course of anti-amyloid treatment. Binding potential in the vehicle-injected hippocampus remained unaltered (left; F(2,4) = 0.02 and p > 0.05 for main effect of time by repeated-measures ANOVA), whereas it was significantly reduced in the anti-Aβ antibody-injected hippocampus (right; F(2,4) = 7.56 and p < 0.05 for main effect of time by repeated-measures ANOVA). D, Ratio between [18F]FE-DAA1106 radioactivities (at 0–60 min after the radiotracer administration) in antibody- and vehicle-injected hippocampi, showing a markedly elevated neuroinflammatory response triggered by antibody injection (left; F(2,4) = 16.7 and p < 0.05 for main effect of time by repeated-measures ANOVA) and a close correlation between levels of neuroinflammation and amyloid at 1 and 2 weeks after treatment (right; R2 = 0.942; p < 0.01, t test). The solid line represents regression. E–H, Double fluorescence labeling of amyloid (FSB; E, F) and microglia (Iba-1; G, H) in the left (E, G) and right (F, H) hippocampi of a Tg mouse (Tg #1) at 2 weeks after immunization. I, Load of FSB-positive amyloid in the hippocampus, indicating a significant left–right difference (p < 0.05, t test). Horizontal bars in graphs represent mean values. Lt., Left; Rt., right.
Effects of specific radioactivity of [11C]PIB on amyloid detection
Because the present dose and specific radioactivity of [11C]PIB administered to mice were higher than those in previous studies (Klunk et al., 2005; Toyama et al., 2005), we postulated that these parameters likely affected the sensitivity of plaque detection in Tg mouse brains. Accordingly, PET scans were performed for the same animal by varying the ID and specific radioactivity, as exemplified in the case given two PET scans 1 week apart (Fig. 6A–D). Lowering the ID of the radiotracer and reducing its specific radioactivity by the addition of cold ligand resulted in profound loss of signal-to-noise ratio and reduction in binding potential in the hippocampus and neocortex (Fig. 6E), along with insensitivity for detecting moderately intense clustered amyloid plaques, as was confirmed by ex vivo autoradiography and histochemical assay performed 1 week after the second PET measurement (Fig. 6C,D). Similarly, two other cases also exhibited a significant decline in binding potential when injected with tracer, the radioactivity concentration of which was diminished in advance by radioactive decay over ∼1.5 h. In addition, another series of Tg mice undergoing multiple PET scans 1–2 weeks apart demonstrated that attenuation of binding potential also occurred by decreasing the specific radioactivity of the tracer from ∼200 to ∼20 GBq/μmol while the ID was fixed at ∼30 MBq (Fig. 6E), although additional decline of specific radioactivity to ∼0.2 GBq/μmol did not induce further dramatic reduction in binding potential (Fig. 6E). Taking these observations together, it is likely that detection of relatively immature amyloid lesions, which are diffusely distributed in the mouse forebrain, is highly sensitive to the specific radioactivity of [11C]PIB in a range from 20 to 200 GBq/μmol, and a subset of mouse plaques, which are large in size and/or form dense clusters, can be captured by micro-positron emission tomography regardless of the specific radioactivity if it ranges from 0.2 to 200 GBq/μmol.
Figure 6.
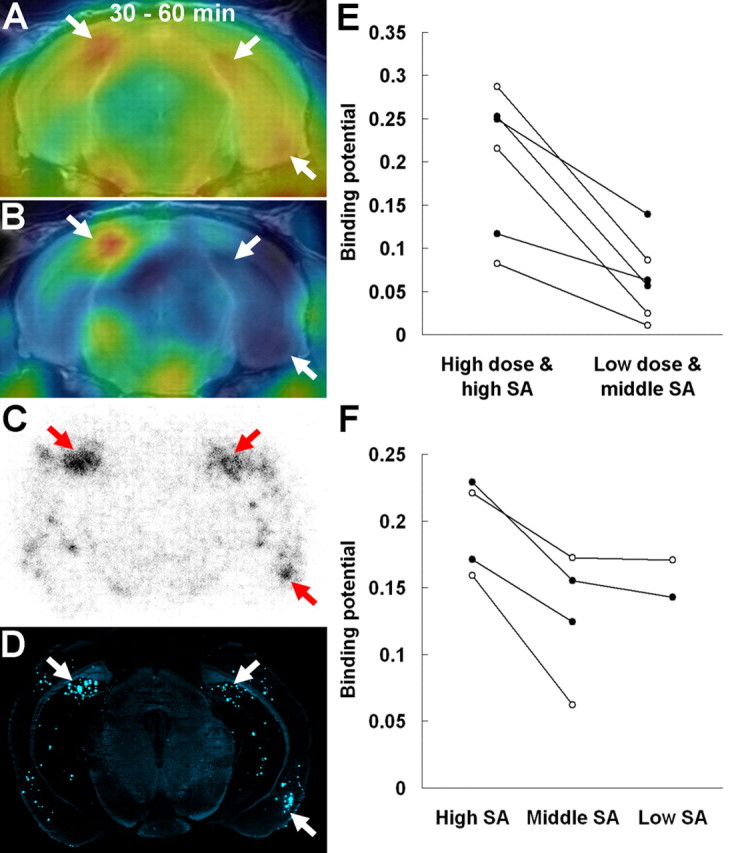
Contribution of specific radioactivity (SA) and ID of the radioligand to sensitive in vivo detection of amyloid plaques in APP Tg mice. A, PET image of a 20-month-old Tg mouse at 30–60 min after administration of [11C]PIB with high SA (∼200 GBq/μmol) and high dose (∼37 MBq). The image was overlaid on the MRI template. Intense spots were found in the bilateral medial hippocampi and right entorhinal cortex (arrows). B, Merged PET and MR image of the same mouse acquired after administration of the tracer with middle SA (∼20 GBq/μmol) and low dose (∼3.7 MBq). C, D, Ex vivo autoradiography using the same mouse showing tracer localization at 30 min after administration (C) and subsequent fluorescence staining of the autoradiographic sample using nonradioactive BTA-1 (D). Arrows indicate clusters of amyloid lesions corresponding to intense spots in A. E, Comparison of binding potential in the hippocampus (filled circles) and neocortex (open circles) of three Tg mice determined by PET scans with high-SA (∼200 GBq/μmol), high-dose (∼30 MBq) and middle-SA (∼20 GBq/μmol), low-dose (∼3 MBq) tracers. F, Comparison of binding potential in the hippocampus (filled circles) and neocortex (open circles) of two Tg mice obtained from PET data with high-SA (∼200 GBq/μmol), middle-SA (∼20 GBq/μmol), and low-SA (∼0.2 GBq/μmol) tracers. The injected dose of the tracer was ∼30 MBq in all measurements. Data from the same individuals in the graphs are connected by solid lines.
Association between [11C]PIB binding to amyloid and N- and C-terminal heterogeneity of Aβ
To assess differences in the binding of [11C]PIB between AD patients and APP Tg mice, we conducted a comparative in vitro autoradiographic analysis of postmortem AD brain and several different strains of Tg mice, including APP23, Tg2576, and PS-1/APP double-Tg mice (Figs. 7, 8, first and second columns from the left). Although the brains of APP23 and Tg2576 mice at 23 months of age exhibited intense radiolabeled spots, the abundance of [11C]PIB-labeled plaques in these animals was much lower than that in the AD brain. Moreover, amyloid plaques in the brain of an 8-month-old PS-1/APP Tg mouse were not intensely radiolabeled with [11C]PIB compared with other brain samples. We then measured the amounts of soluble and insoluble Aβ species in these mouse brain tissues by sandwich ELISA (experimental procedure is described in supplemental Methods, available at www.jneurosci.org as supplemental material). The highest levels of detergent- and formic acid-extractable Aβ were observed in the APP23 mouse, and the amounts of such insoluble Aβ in Tg2576 and PS-1/APP Tg mice were comparable to each other (supplemental table, available at www.jneurosci.org as supplemental material). Thus, the intensity of [11C]PIB radiolabeling was not simply correlated with the levels of insoluble Aβ.
Figure 7.
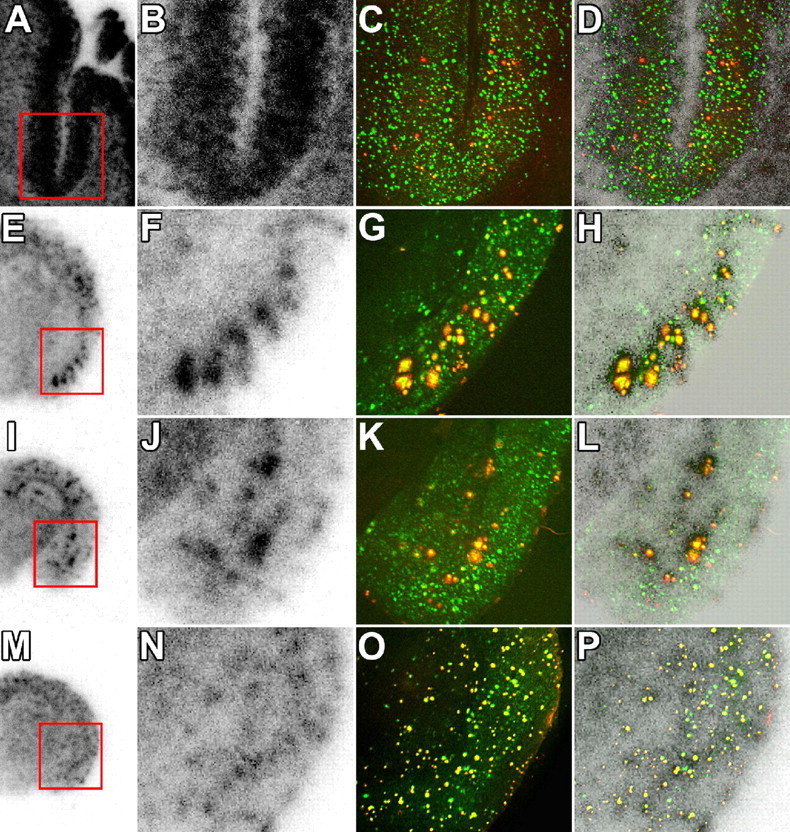
Association between in vitro radiolabeling of amyloid with [11C]PIB and abundance of Aβ40 and Aβ42. Brain sections from the AD patient (A–D), 23-month-old APP23 mouse (E–H), 23-month-old Tg2576 mouse (I–L), and 8-month-old PS-1/APP double-Tg mouse (M–P) were used for autoradiography with [11C]PIB (low-power and high-power autoradiograms are shown in the first and second columns from the left, respectively), and thereafter doubly immunostained for Aβ40 (red in the third column) and Aβ42 (green in the third column) with polyclonal anti-Aβ40 and monoclonal anti-Aβ42 antibodies. Colocalization of radiolabeling with Aβ40 and Aβ42 was assessed by merging autoradiograms with immunohistochemical data (shown in the fourth column). Similar double-immunofluorescence staining was obtained by using monoclonal anti-Aβ40 and polyclonal anti-Aβ42 antibodies (data not shown). Red squares indicate areas shown in magnified images.
Figure 8.
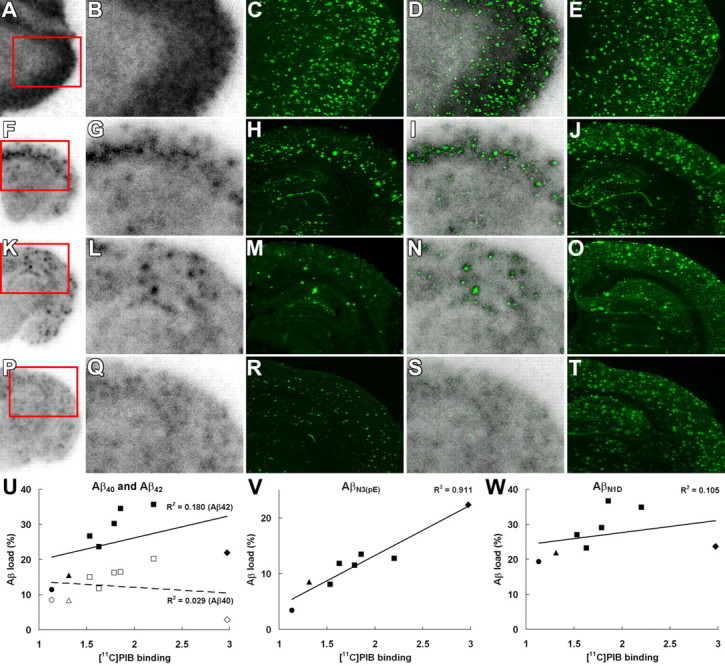
Search for Aβ subtypes accumulating in close relation to [11C]PIB binding sites. A–T, Association between in vitro radiolabeling of amyloid with [11C]PIB and N-terminal truncation/modification of Aβ. Brain sections from the AD patient (A–E), 23-month-old APP23 mouse (F–J), 23-month-old Tg2576 mouse (K–O), and 8-month-old PS-1/APP double-Tg mouse (P–T) were used for autoradiography with [11C]PIB (low-power and high-power autoradiograms are shown in the first and second columns from the left, respectively), and thereafter immunostained with polyclonal anti-AβN3(pE) antibody (third column). Colocalization of radiolabeling with AβN3(pE) deposition was assessed by merging autoradiograms with immunohistochemical data (fourth column). Subadjacent sections were also immunolabeled with anti-AβN1D antibody (fifth column). Red squares indicate areas shown in magnified images. U–W, Association of in vitro [11C]PIB radiolabeling (normalized by intensity of nonspecific labeling) with areas occupied by Aβ40 (U, open symbols), Aβ42 (U, filled symbols), AβN1(pE) (V), and AβN1D (W) immunolabeling in the cortex of the AD patient (diamonds) and APP23 (squares), Tg2576 (triangles), and PS-1/APP double-Tg (circles) mice. The intensity of [11C]PIB signals was significantly correlated with AβN3(pE) labeling (p < 0.001, t test), but not with the loads of other Aβ species (p > 0.05, t test). Solid lines represent regression for Aβ42 (U), AβN1(pE) (V), and AβN1D (W), and the dashed line in U represents regression for Aβ40.
In search of specific Aβ subtypes intimately related to the accumulation of [11C]PIB, the brain sections used for in vitro autoradiography were immunostained with antibodies against Aβ40 and Aβ42. In the mouse brains, radioactive signals were colocalized with amyloid plaques that were doubly positive for Aβ40 and Aβ42, whereas the vast majority of plaque lesions in the AD brain were Aβ40 negative and Aβ42 positive (Fig. 7). These findings led to the supposition that C-terminal heterogeneity of Aβ may not be critically responsible for the formation of [11C]PIB binding sites. We also immunohistochemically examined N-terminal modification of Aβ using autoradiography sections (Fig. 8A–T). Notably, the localization and abundance of AβN3-pyroglutamate-immunoreactive plaques were in good agreement with those of [11C]PIB signals. Unlike AβN3-pyroglutamate, unmodified AβN1D was abundantly present in all brain sections examined here and did not show overt association with [11C]PIB radiolabeling. Quantitative analysis of the Aβ burden and in vitro [11C]PIB signal intensity also demonstrated that the radiotracer binding significantly correlated with the load of AβN3-pyroglutamate but not with the depositions of Aβ40, Aβ42, and AβN1D (Fig. 8U,W).
To assess whether AβN3-pyroglutamate provides primary binding components for [11C]PIB, we assayed in vitro binding of [11C]PIB to fibrils of AβN3-pyroglutamate and AβN1D assembled in the same condition (experimental procedure is given in supplemental Methods, available at www.jneurosci.org as supplemental material). High-level binding of ligands to AβN3-pyroglutamate compared with AβN1D was observed using [11C]PIB at subnanomolar to nanomolar concentrations, which are equivalent to those in PET studies (supplemental Fig. 5A, available at www.jneurosci.org as supplemental material), and a two-site model applied to Scatchard plot demonstrates that Bmax and Bmax/KD for the high-affinity component formed in AβN3-pyroglutamate are five and four times larger than those in AβN1D, respectively (supplemental Fig. 5B, available at www.jneurosci.org as supplemental material).
Discussion
The present work provides the first explicit evidence that an imaging probe, which has been applied in humans, is capable of noninvasively visualizing amyloid accumulation in living animal models. This permits a comparative evaluation of amyloidogenic processes in humans and mice using the same quantitative indices and thus assists the mechanistic understanding of amyloid pathogenesis in both species. In addition, the utility of a longitudinal PET study in quantitatively assessing alterations of amyloid levels as a function of age and in response to treatment is demonstrated for the first time, suggesting that amyloid imaging technology can successfully serve as an objective diagnostic and outcome measure for preclinical and clinical research. It is also noteworthy that the high-affinity binding sites in mouse amyloid that are much less abundant than those in human senile plaques could be captured by radiotracer with high specific radioactivity. Because the high-affinity component is the putative major source of radioactive signals in human PET studies, our strategies to increase specific radioactivity may contribute to the establishment of an animal system for predicting radiotracer binding in AD brains.
Because PET measurements require a very small amount of imaging agent compared with nonradioactive approaches, our current methodology offers a safe tool for monitoring brain amyloid in mice without overt toxicity. This advantage is also of particular significance, because prominent pharmacological effects of injected amyloid-binding tracers on the formation of amyloid (Lee, 2002; Masuda et al., 2006) are unlikely in PET studies. In fact, the regression slope in the scatterplot for measured amyloid levels against age (Fig. 4A,B) did not differ between mice undergoing single- and two-scan protocols (e.g., 0.060 and 0.061 per month, respectively, in the hippocampus). Thus, the present observations suggest that PET imaging of amyloid permits robust preclinical evaluation of therapeutic strategies for modifying the pathological course of AD and potentially provides a quantitative outcome measure of such treatments in clinical trials.
As confirmed here, the benefits of a multiscan, multitracer PET study in the same individual include a high statistical power, and the analysis of three Tg mice was indeed sufficient to statistically examine the effects of Aβ immunization on amyloid load and inflammatory response (Fig. 5C,D). Moreover, the near-simultaneous use of two different radiotracers, [11C]PIB and [18F]FE-DAA1106, has revealed that the magnitude of glial activation after immunization is closely associated with the amount of Aβ amyloid. Excessive neuroinflammation may induce neurotoxic insults, as exemplified by the occurrence of meningoencephalitis in those who received Aβ vaccination (Nicoll et al., 2003; Orgogozo et al., 2003). Additionally, our recent investigation in a mouse model of neurofibrillary tangles using tritiated DAA1106 has indicated that microglial overactivation in AD and other tauopathy brains could lead to accelerated tau pathogenesis and neuronal loss (Yoshiyama et al., 2007). Hence, the present result implies that therapeutic intervention should be initiated at an unadvanced stage of amyloid pathology to minimize adverse effects and supports the utility of [18F]FE-DAA1106 in conjunction with [11C]PIB in optimizing treatment protocols.
The present data also indicate that the specific radioactivity of the radioligand significantly contributes to the detectability of amyloid lesions developed in mouse brains by increasing amyloid-specific signals relative to the background associated with free and nonspecifically bound tracers. Our in vitro autoradiographic assay demonstrated a substantial difference in the intensity of [11C]PIB radiolabeling between the brains of AD patient and APP Tg mouse strains, in line with the indication by a previous study (Klunk et al., 2005) that the concentration of specific binding sites available (Bmax) in mice doubly transgenic for PS-1 and APP at 6–15 months of age is much lower than that in AD brains. From the present work, we can assume that amyloid-related-specific signals are detectable if they exceed 10–20% of the background, and given that the Bmax value in PS-1/APP double-Tg mice is 1000-fold lower than that in AD patients, as estimated previously (Klunk et al., 2005), the threshold of the specific radioactivity for sensitive detection of amyloid in these mice (producing a bound-to-free ratio >0.2) exists at ∼74 GBq/μmol, according to calculation using the following parameters: Bmax in AD brains, ∼1 μm; dissociation constant (KD) for PIB, ∼1 nm; ID of [11C]PIB for obtaining quality micro-PET images, ∼37 MBq; levels of [11C]PIB in the brain at 60 min after tracer injection, ∼1%ID/ml. In our autoradiographic experiment, APP23 mice exhibited intense radiolabeling of amyloid compared with PS-1/APP double-Tg mice, indicating diversity of Bmax for [11C]PIB among different Tg strains. Although the PS-1 Tg mice used for crossbreeding with Tg2576 mice in our study differ from the pre-established line (Duff et al., 1996; Klunk et al., 2005), it is conceivable that the detection threshold for amyloid in APP23 mice at 17–30 months of age is somewhat lower than 74 GBq/μmol. Notwithstanding this consideration, the present in vivo data (Fig. 6) provide evidence that the detectability of APP23 mouse amyloid is highly sensitive to the specific radioactivity (20–200 GBq/μmol) of the tracer (except for a subset of Aβ deposits such as large-sized, dense-cored plaques). Likewise, detection of amyloid aggregates in Tg2576 mice may also be facilitated by using [11C]PIB with high specific radioactivity. Toyama et al. (2005) documented that levels of radiotracer accumulation in Tg2576 and WT mice at 22 months of age were comparable, whereas the same research group has more recently reported increased retention of radiotracer (specific radioactivity, ∼20 GBq/μmol) in the neocortex of older (>28 months) Tg mice (Cai et al., 2006). This finding is in agreement with the indication from our data that the intensity of in vitro radiolabeling of amyloid deposits in 23-month-old Tg2576 mice does not greatly differ from that in age-matched APP23 mice (Figs. 7, 8), suggesting that the threshold of specific radioactivity for sensitive detection of amyloid in Tg2576 mice at this age exists at 20–50 GBq/μmol.
Our comparative analysis of human and mouse brain tissues supports the notion that the total amounts of insoluble Aβ in the brain do not necessarily correlate with the accumulation of [11C]PIB measured by positron emission tomography (Klunk et al., 2005), whereas molecular elements responsible for the formation of PIB binding sites, possibly including certain Aβ subtypes, non-Aβ components of amyloid, and secondary structures of Aβ fibrils, are yet to be identified. AβN3-pyroglutamate, however, is one of the strong candidates for a primary constituent of high-affinity PIB binding sites, based on our present combined autoradiographic and immunohistochemical investigations (Fig. 8). In contrast to the fact that AβN3-pyroglutamate is a major component of human Aβ amyloid (Saido et al., 1995), it was biochemically demonstrated that this Aβ subtype is not abundant in Tg2576 mice despite high-level deposition of insoluble, N-terminally unmodified Aβ and is detectable only when these animals became older than 23 months (Kawarabayashi et al., 2001), in general accord with our histological results. Because similar findings were also obtained by other research groups (Güntert et al., 2006), the levels of AβN3-pyroglutamate are likely to provide a plausible explanation for the difference in [11C]PIB binding between humans and mice. AβN3-pyroglutamate is thought to be generated via an auxiliary enzymatic pathway involving monopeptidyl and dipeptidyl aminopeptidases and thus is a slow process closely dependent on aging unless the major pathway of Aβ degradation mediated by endopeptidases is fundamentally disturbed. We therefore postulate that acceleration of Aβ production as exemplified by PS-1/APP double-Tg mice may not promote development of “AD-like” plaques enriched with AβN3-pyroglutamate and PIB binding sites and that it is still required for these mice to age to be useful animal models of amyloidosis suitable for in vivo PET imaging. Moreover, in vitro experiments revealed that AβN3-pyroglutamate has a greater propensity to form amyloid aggregates compared with unmodified Aβ species, acting as a seed in the formation of Aβ fibrils (He and Barrow, 1999; Schilling et al., 2006), which implies that intensification of Aβ amyloid toward mature aggregates containing highly concentrated PIB binding sites is accelerated in the presence of AβN3-pyroglutamate. Our pilot in vitro binding assay using synthetic filaments assembled from AβN3-pyroglutamate and AβN1D has demonstrated that specific binding of [11C]PIB at subnanomolar to nanomolar concentrations to AβN3-pyroglutamate fibrils exceeded that to Aβ1–42 by fourfold to fivefold (supplemental Fig. 5, available at www.jneurosci.org as supplemental material), providing additional evidence for the contribution of AβN3-pyroglutamate to the primary PIB binding sites. It is noteworthy that AβN3-pyroglutamate fibrils contain more high-affinity binding sites than do AβN1D fibrils assembled in the same condition, suggesting the significance of AβN3-pyroglutamate as a major source of target structures for [11C]PIB positron emission tomography. The roles played by AβN3-pyroglutamate in the formation of AD-like plaques should be further examined, such as by in vitro estimation of Bmax and KD for [11C]PIB using AβN3-pyroglutamate and AβN1D aggregates at different stages of fibrillogenesis and comparison of in vivo [11C]PIB binding and levels of AβN3-pyroglutamate among various APP Tg mouse strains.
[11C]PIB synthesized with high specific radioactivity is also potentially useful for human PET imaging. The threshold of specific radioactivity for the detection of AD amyloid is estimated to be ∼0.1 GBq/μmol, based on calculation with the following parameters: Bmax in AD brains, ∼1 μm; KD for PIB, ∼1 nm; ID of [11C]PIB, ∼370 MBq; levels of [11C]PIB in the brain at 60 min, ∼0.002%ID/ml. Accordingly, specific radioactivity in the common range for clinical PET studies (∼37 GBq/μmol) is unlikely to significantly affect the contrast between specific and background signals in AD patients. However, detectability of Aβ aggregates at earlier stages of AD pathogenesis may critically depend on the specific radioactivity of the tracer, provided that the concentration of PIB binding sites in this state between normal aging and prodromal dementia is markedly low compared with that in MCI and AD brains. This presumption could also be related to the previous finding that AβN3-pyroglutamate in cored plaques is less abundant in brains showing earlier Braak stages (Güntert et al., 2006). Our present work thus suggests that pathological amyloidosis in nondemented subjects would be imaged by [11C]PIB with high specific radioactivity and be more sensitively captured by a radioligand optimized using the animal PET imaging system proposed here.
Although several technical aspects need to be further improved, such as the spatial resolution of the scanner (∼1.5 mm) (Tai et al., 2005), our results rationalize the use of micro-positron emission tomography for elucidating molecular regulators of amyloid deposition and for proving concepts regarding the mechanisms of emerging approaches for therapeutic interventions (Dodel et al., 2003; Scarpini et al., 2003). This in vivo system also offers an efficient strategy to preclinically compare pharmacokinetic properties of multiple candidate amyloid probes in the same individual. In such a study, the distinct nature of amyloid aggregates in humans and mice is likely overcome by sensitively capturing the high-affinity components in mouse plaque using high-specific radioactivity ligands, allowing the findings in mice to be extrapolated to humans.
Footnotes
This work was supported in part by Grants-in-Aid for the Molecular Imaging Program and Scientific Research on Priority Areas, Research on Pathomechanisms of Brain Disorders 18023033 (H.M.), 182307 (N.I.), and 18023040 (M.H.) from the Ministry of Education, Culture, Sports, Science, and Technology, Japan. We thank Taisho Pharmaceutical (Tokyo, Japan) for providing DAA1123; Y. Matsuba, M. Sekiguchi, and K. Watanabe (RIKEN Brain Science Institute) for technical assistance; Dr. K. Yanai (Tohoku University, Sendai, Japan) and Dr. H. Toyama (Fujita Health University, Toyoake, Japan) for helpful advice; Drs. R. Innis and L. Cai (National Institutes of Health, Bethesda, MD) for critical discussions; Drs. J. Q. Trojanowski and V. M.-Y. Lee (University of Pennsylvania, Philadelphia, PA) for providing postmortem human brain tissues; and Dr. K. H. Ashe (University of Minnesota, Minneapolis, MN) for providing Tg2576 mice.
The authors declare no competing financial interests.
References
- Bacskai BJ, Hickey GA, Skoch J, Kajdasz ST, Wang Y, Huang GF, Mathis CA, Klunk WE, Hyman BT. Four-dimensional multiphoton imaging of brain entry, amyloid binding, and clearance of an amyloid-beta ligand in transgenic mice. Proc Natl Acad Sci USA. 2003;100:12462–12467. doi: 10.1073/pnas.2034101100. [DOI] [PMC free article] [PubMed] [Google Scholar]
- Cai L, Ye D, Liow JS, Hong J, Cohen RM, Pike VW, Innis RB. PET imaging of transgenic mice TG2576 using the beta-amyloid radioligand, [C-11]PIB. NeuroImage. 2006;31:T141–T142. [Google Scholar]
- Dodel RC, Hampel H, Du Y. Immunotherapy for Alzheimer's disease. Lancet Neurol. 2003;2:215–220. doi: 10.1016/s1474-4422(03)00349-1. [DOI] [PubMed] [Google Scholar]
- Duff K, Eckman C, Zehr C, Yu X, Prada CM, Perez-tur J, Hutton M, Buee L, Harigaya Y, Yager D, Morgan D, Gordon MN, Holcomb L, Refolo L, Zenk B, Hardy J, Younkin S. Increased amyloid-β42(43) in brains of mice expressing mutant presenilin 1. Nature. 1996;383:710–713. doi: 10.1038/383710a0. [DOI] [PubMed] [Google Scholar]
- Engler H, Forsberg A, Almkvist O, Blomquist G, Larsson E, Savitcheva I, Wall A, Ringheim A, Langstrom B, Nordberg A. Two-year follow-up of amyloid deposition in patients with Alzheimer's disease. Brain. 2006;129:2856–2866. doi: 10.1093/brain/awl178. [DOI] [PubMed] [Google Scholar]
- Güntert A, Döbeli H, Bohrmann B. High sensitivity analysis of amyloid-beta peptide composition in amyloid deposits from human and PS2APP mouse brain. Neuroscience. 2006;143:461–475. doi: 10.1016/j.neuroscience.2006.08.027. [DOI] [PubMed] [Google Scholar]
- He W, Barrow CJ. The Aβ 3-pyroglutamyl and 11-pyroglutamyl peptides found in senile plaque have greater β-sheet forming and aggregation propensities in vitro than full-length Aβ. Biochemistry. 1999;38:10871–10877. doi: 10.1021/bi990563r. [DOI] [PubMed] [Google Scholar]
- Higuchi M, Iwata N, Matsuba Y, Sato K, Sasamoto K, Saido TC. 19F and 1H MRI detection of amyloid b plaques in vivo. Nat Neurosci. 2005;8:527–533. doi: 10.1038/nn1422. [DOI] [PubMed] [Google Scholar]
- Hintersteiner M, Enz A, Frey P, Jaton AL, Kinzy W, Kneuer R, Neumann U, Rudin M, Staufenbiel M, Stoeckli M, Wiederhold KH, Gremlich HU. In vivo detection of amyloid-beta deposits by near-infrared imaging using an oxazine-derivative probe. Nat Biotechnol. 2005;23:577–583. doi: 10.1038/nbt1085. [DOI] [PubMed] [Google Scholar]
- Hsiao K, Chapman P, Nilsen S, Eckman C, Harigaya Y, Younkin S, Yang F, Cole G. Correlative memory deficits, Aβ elevation, and amyloid plaques in transgenic mice. Science. 1996;274:99–102. doi: 10.1126/science.274.5284.99. [DOI] [PubMed] [Google Scholar]
- Ichise M, Liow JS, Lu JQ, Takano A, Model K, Toyama H, Suhara T, Suzuki K, Innis RB, Carson RE. Linearized reference tissue parametric imaging methods: application to [11C]DASB positron emission tomography studies of the serotonin transporter in human brain. J Cereb Blood Flow Metab. 2003;23:1096–1112. doi: 10.1097/01.WCB.0000085441.37552.CA. [DOI] [PubMed] [Google Scholar]
- Ikonomovic MD, Abrahamson EE, Isanski BA, Debnath ML, Mathis CA, Dekosky ST, Klunk WE. X-34 labeling of abnormal protein aggregates during the progression of Alzheimer's disease. Methods Enzymol. 2006;412:123–144. doi: 10.1016/S0076-6879(06)12009-1. [DOI] [PubMed] [Google Scholar]
- Kametani F, Usami M, Tanaka K, Kume H, Mori H. Mutant presenilin (A260V) affects Rab8 in PC12D cell. Neurochem Int. 2004;44:313–320. doi: 10.1016/s0197-0186(03)00176-1. [DOI] [PubMed] [Google Scholar]
- Kawarabayashi T, Younkin LH, Saido TC, Shoji M, Ashe KH, Younkin SG. Age-dependent changes in brain, CSF, and plasma amyloid β protein in the Tg2576 transgenic mouse model of Alzheimer's disease. J Neurosci. 2001;21:372–381. doi: 10.1523/JNEUROSCI.21-02-00372.2001. [DOI] [PMC free article] [PubMed] [Google Scholar]
- Klunk WE, Engler H, Nordberg A, Wang Y, Blomqvist G, Holt DP, Bergstrom M, Savitcheva I, Huang GF, Estrada S, Ausen B, Debnath ML, Barletta J, Price JC, Sandell J, Lopresti BJ, Wall A, Koivisto P, Antoni G, Mathis CA, et al. Imaging brain amyloid in Alzheimer's disease with Pittsburgh compound-B. Ann Neurol. 2004;55:306–319. doi: 10.1002/ana.20009. [DOI] [PubMed] [Google Scholar]
- Klunk WE, Lopresti BJ, Ikonomovic MD, Lefterov IM, Koldamova RP, Abrahamson EE, Debnath ML, Holt DP, Huang GF, Shao L, DeKosky ST, Price JC, Mathis CA. Binding of the positron emission tomography tracer Pittsburgh compound-B reflects the amount of amyloid-β in Alzheimer's disease brain but not in transgenic mouse brain. J Neurosci. 2005;25:10598–10606. doi: 10.1523/JNEUROSCI.2990-05.2005. [DOI] [PMC free article] [PubMed] [Google Scholar]
- Lammertsma AA, Bench CJ, Hume SP, Osman S, Gunn K, Brooks DJ, Frackowiak RS. Comparison of methods for analysis of clinical [11C]raclopride studies. J Cereb Blood Flow Metab. 1996;16:42–52. doi: 10.1097/00004647-199601000-00005. [DOI] [PubMed] [Google Scholar]
- Lee VM. Amyloid binding ligands as Alzheimer's disease therapies. Neurobiol Aging. 2002;23:1039–1042. doi: 10.1016/s0197-4580(02)00121-5. [DOI] [PubMed] [Google Scholar]
- Logan J, Fowler JS, Volkow ND, Wang GJ, Ding YS, Alexoff DL. Distribution volume ratios without blood sampling from graphical analysis of PET data. J Cereb Blood Flow Metab. 1996;16:834–840. doi: 10.1097/00004647-199609000-00008. [DOI] [PubMed] [Google Scholar]
- Masuda M, Suzuki N, Taniguchi S, Oikawa T, Nonaka T, Iwatsubo T, Hisanaga S, Goedert M, Hasegawa M. Small molecule inhibitors of α-synuclein filament assembly. Biochemistry. 2006;45:6085–6094. doi: 10.1021/bi0600749. [DOI] [PubMed] [Google Scholar]
- Mintun MA, Larossa GN, Sheline YI, Dence CS, Lee SY, Mach RH, Klunk WE, Mathis CA, DeKosky ST, Morris JC. [11C]PIB in a nondemented population: potential antecedent marker of Alzheimer disease. Neurology. 2006;67:446–452. doi: 10.1212/01.wnl.0000228230.26044.a4. [DOI] [PubMed] [Google Scholar]
- Nichols L, Pike VW, Cai L, Innis RB. Imaging and in vivo quantitation of beta-amyloid: an exemplary biomarker for Alzheimer's disease? Biol Psychiatry. 2006;59:940–947. doi: 10.1016/j.biopsych.2005.12.004. [DOI] [PubMed] [Google Scholar]
- Nicoll JA, Wilkinson D, Holmes C, Steart P, Markham H, Weller RO. Neuropathology of human Alzheimer disease after immunization with amyloid-β peptide: a case report. Nat Med. 2003;9:448–452. doi: 10.1038/nm840. [DOI] [PubMed] [Google Scholar]
- Noguchi J, Suzuki K. Automated synthesis of the ultra high specific activity of [11C]Ro15-4513 and its application in an extremely low concentration region to an ARG study. Nucl Med Biol. 2003;30:335–343. doi: 10.1016/s0969-8051(02)00422-5. [DOI] [PubMed] [Google Scholar]
- Orgogozo JM, Gilman S, Dartigues JF, Laurent B, Puel M, Kirby LC, Jouanny P, Dubois B, Eisner L, Flitman S, Michel BF, Boada M, Frank A, Hock C. Subacute meningoencephalitis in a subset of patients with AD after Aβ42 immunization. Neurology. 2003;61:46–54. doi: 10.1212/01.wnl.0000073623.84147.a8. [DOI] [PubMed] [Google Scholar]
- Price JC, Klunk WE, Lopresti BJ, Lu X, Hoge JA, Ziolko SK, Holt DP, Meltzer CC, DeKosky ST, Mathis CA. Kinetic modeling of amyloid binding in humans using PET imaging and Pittsburgh compound-B. J Cereb Blood Flow Metab. 2005;25:1528–1547. doi: 10.1038/sj.jcbfm.9600146. [DOI] [PubMed] [Google Scholar]
- Saido TC, Iwatsubo T, Mann DM, Shimada H, Ihara Y, Kawashima S. Dominant and differential deposition of distinct β-amyloid peptide species, AβN3(pE), in senile plaques. Neuron. 1995;14:457–466. doi: 10.1016/0896-6273(95)90301-1. [DOI] [PubMed] [Google Scholar]
- Sair HI, Doraiswamy PM, Petrella JR. In vivo amyloid imaging in Alzheimer's disease. Neuroradiology. 2004;46:93–104. doi: 10.1007/s00234-003-1034-9. [DOI] [PubMed] [Google Scholar]
- Sato K, Higuchi M, Iwata N, Saido TC, Sasamoto K. Fluoro-substituted and 13C-labeled styrylbenzene derivatives for detecting brain amyloid plaques. Eur J Med Chem. 2004;39:573–578. doi: 10.1016/j.ejmech.2004.02.013. [DOI] [PubMed] [Google Scholar]
- Scarpini E, Scheltens P, Feldman H. Treatment of Alzheimer's disease: current status and new perspectives. Lancet Neurol. 2003;2:539–547. doi: 10.1016/s1474-4422(03)00502-7. [DOI] [PubMed] [Google Scholar]
- Schilling S, Lauber T, Schaupp M, Manhart S, Scheel E, Böhm G, Demuth HU. On the seeding and oligomerization of pGlu-amyloid peptides (in vitro) Biochemistry. 2006;45:12393–12399. doi: 10.1021/bi0612667. [DOI] [PubMed] [Google Scholar]
- Shoghi-Jadid K, Small GW, Agdeppa ED, Kepe V, Ercoli LM, Siddarth P, Read S, Satyamurthy N, Petric A, Huang SC, Barrio JR. Localization of neurofibrillary tangles and beta-amyloid plaques in the brains of living patients with Alzheimer disease. Am J Geriatr Psychiatry. 2002;10:24–35. [PubMed] [Google Scholar]
- Sturchler-Pierrat C, Abramowski D, Duke M, Wiederhold KH, Mistl C, Rothacher S, Ledermann B, Bürki K, Frey P, Paganetti PA, Waridel C, Calhoun ME, Jucker M, Probst A, Staufenbiel M, Sommer B. Two amyloid precursor protein transgenic mouse models with Alzheimer disease-like pathology. Proc Natl Acad Sci USA. 1997;94:13287–13292. doi: 10.1073/pnas.94.24.13287. [DOI] [PMC free article] [PubMed] [Google Scholar]
- Styren SD, Hamilton RL, Styren GC, Klunk WE. X-34, a fluorescent derivative of Congo red: a novel histochemical stain for Alzheimer's disease pathology. J Histochem Cytochem. 2000;48:1223–1232. doi: 10.1177/002215540004800906. [DOI] [PubMed] [Google Scholar]
- Suzuki K, Inoue O, Hashimoto K, Yamasaki T, Kuchiki M, Tamate K. Computer-controlled large scale production of high specific activity [11C]RO 15-1788 for PET studies of benzodiazepine receptors. Int J Appl Radiat Isot. 1985;36:971–976. doi: 10.1016/0020-708x(85)90258-3. [DOI] [PubMed] [Google Scholar]
- Tai YC, Ruangma A, Rowland D, Siegel S, Newport DF, Chow PL, Laforest R. Performance evaluation of the microPET focus: a third-generation microPET scanner dedicated to animal imaging. J Nucl Med. 2005;46:455–463. [PubMed] [Google Scholar]
- Toyama H, Ye D, Ichise M, Liow JS, Cai L, Jacobowitz D, Musachio JL, Hong J, Crescenzo M, Tipre D, Lu JQ, Zoghbi S, Vines DC, Seidel J, Katada K, Green MV, Pike VW, Cohen RM, Innis RB. PET imaging of brain with the β-amyloid probe, [11C]6-OH-BTA-1, in a transgenic mouse model of Alzheimer's disease. Eur J Nucl Med Mol Imaging. 2005;32:593–600. doi: 10.1007/s00259-005-1780-5. [DOI] [PubMed] [Google Scholar]
- Verhoeff NP, Wilson AA, Takeshita S, Trop L, Hussey D, Singh K, Kung HF, Kung MP, Houle S. In-vivo imaging of Alzheimer disease β-amyloid with [11C]SB-13 PET. Am J Geriatr Psychiatry. 2004;12:584–595. doi: 10.1176/appi.ajgp.12.6.584. [DOI] [PubMed] [Google Scholar]
- Wilcock DM, DiCarlo G, Henderson D, Jackson J, Clarke K, Ugen KE, Gordon MN, Morgan D. Intracranially administered anti-Aβ antibodies reduce β-amyloid deposition by mechanisms both independent of and associated with microglial activation. J Neurosci. 2003;23:3745–3751. doi: 10.1523/JNEUROSCI.23-09-03745.2003. [DOI] [PMC free article] [PubMed] [Google Scholar]
- Yoshiyama Y, Higuchi M, Zhang B, Huang SM, Iwata N, Saido TC, Maeda J, Suhara T, Trojanowski JQ, Lee VM. Synapse loss and microglial activation precede tangles in a P301S tauopathy mouse model. Neuron. 2007;53:337–351. doi: 10.1016/j.neuron.2007.01.010. [DOI] [PubMed] [Google Scholar]
- Zhang MR, Suzuki K. Sources of carbon which decrease the specific activity of [11C]CH3I synthesized by the single pass I2 method. Appl Radiat Isot. 2005;62:447–450. doi: 10.1016/j.apradiso.2004.07.003. [DOI] [PubMed] [Google Scholar]
- Zhang MR, Maeda J, Ogawa M, Noguchi J, Ito T, Yoshida Y, Okauchi T, Obayashi S, Suhara T, Suzuki K. Development of a new radioligand, FN-(5-fluoro-2-phenoxyphenyl)-N-(2-[18F]fluoroethyl-5-methoxybenzyl)acetamide, for pet imaging of peripheral benzodiazepine receptor in primate brain. J Med Chem. 2004;47:2228–2235. doi: 10.1021/jm0304919. [DOI] [PubMed] [Google Scholar]