

Abstract
A neurodegenerative tauopathy endemic to the Caribbean island of Guadeloupe has been associated with the consumption of anonaceous plants that contain acetogenins, potent lipophilic inhibitors of complex I of the mitochondrial respiratory chain. To test the hypothesis that annonacin, a prototypical acetogenin, contributes to the etiology of the disease, we investigated whether annonacin affects the cellular distribution of the protein tau. In primary cultures of rat striatal neurons treated for 48 h with annonacin, there was a concentration-dependent decrease in ATP levels, a redistribution of tau from the axons to the cell body, and cell death. Annonacin induced the retrograde transport of mitochondria, some of which had tau attached to their outer membrane. Taxol, a drug that displaces tau from microtubules, prevented the somatic redistribution of both mitochondria and tau but not cell death. Antioxidants, which scavenged the reactive oxygen species produced by complex I inhibition, did not affect either the redistribution of tau or cell death. Both were prevented, however, by forced expression of the NDI1 nicotinamide adenine dinucleotide (NADH)-quinone-oxidoreductase of Saccharomyces cerevisiae, which can restore NADH oxidation in complex I-deficient mammalian cells and stimulation of energy production via anaerobic glycolysis. Consistently, other ATP-depleting neurotoxins (1-methyl-4-phenylpyridinium, 3-nitropropionic, and carbonyl cyanide m-chlorophenylhydrazone) reproduced the somatic redistribution of tau, whereas toxins that did not decrease ATP levels did not cause the redistribution of tau. Therefore, the annonacin-induced ATP depletion causes the retrograde transport of mitochondria to the cell soma and induces changes in the intracellular distribution of tau in a way that shares characteristics with some neurodegenerative diseases.
Keywords: annonacin, microtubule-associated protein tau, parkinsonism, mitochondrial complex I, NDI1, axonal transport
Introduction
Annonacin, a lipophilic inhibitor of complex I of the mitochondrial respiratory chain [nicotinamide adenine dinucleotide (NADH)-quinone-oxidoreductase], has been implicated in the etiology of a levodopa-unresponsive form of atypical parkinsonism endemic to the Caribbean island of Guadeloupe (Caparros-Lefebvre and Elbaz, 1999). Approximately half of the affected patients have clinical manifestations that are strikingly similar to those found in progressive supranuclear palsy (PSP) (Caparros-Lefebvre et al., 2002; Lannuzel et al., 2007). Three of the PSP-like patients that came to autopsy also had neuropathological features resembling those of PSP, characterized in particular by an abnormal accumulation of the axonal microtubule-associated protein (MAP) tau in the cell bodies of neurons (Caparros-Lefebvre et al., 2002). Clinical and epidemiological studies (Caparros-Lefebvre and Elbaz, 1999; Angibaud et al., 2004; Lannuzel et al., 2007) have found a significant association between atypical parkinsonism, in Guadeloupe and in New Caledonia, and the regular consumption of tropical anonaceous plant products, suggesting that they contain substances that trigger the disease. Anonaceous acetogenins, a large and unique family of lipophilic complex I inhibitors that are produced exclusively by annonaceous plants, appear to be prime candidates (Degli Esposti, 1998; Höglinger et al., 2005b).
In support of this hypothesis, we demonstrated previously that annonacin, the major acetogenin in Annona muricata, is ∼1000 times more toxic to cultured mesencephalic neurons than 1-methyl-4-phenylpyridinium (MPP+) (Lannuzel et al., 2003), another complex I inhibitor known to induce neurodegeneration and parkinsonism in humans (Langston et al., 1983) and experimental animals (Przedborski and Vila, 2003). After chronic systemic infusion in rats, annonacin penetrated into the brain parenchyma reduced brain ATP levels and caused neuronal cell loss and gliosis in the brainstem and basal ganglia with a PSP-like pattern of distribution (Champy et al., 2004). The quantities of annonacin in the fruit and traditionally prepared infusions of leaves of Annona muricata are such that a cumulative dose sufficient to cause neurodegeneration in rats can be attained in humans by regular consumption within 1 year (Champy et al., 2005). It appears plausible, therefore, that annonacin might be implicated in the etiology of atypical Guadeloupean parkinsonism (Höglinger et al., 2005b).
To obtain additional evidence in support of this hypothesis, we investigated whether annonacin can induce changes in the intracellular distribution of tau, as observed in the brains of patients (Caparros-Lefebvre et al., 2002). These studies were performed in primary cultures of striatal neurons, because the striatum was the major site of lesions in annonacin-treated rats (Champy et al., 2004) and in autopsied patients from Guadeloupe (Caparros-Lefebvre et al., 2002).
Materials and Methods
Cell cultures of striatal neurons.
Animals were treated in accordance with the Guide for the Care and Use of Laboratory Animals (National Research Council 1996) and the European Communities Council Directive 86/609/EEC. The embryos were removed at embryonic day 16.5 (E16.5) from pregnant Wistar rats (Janvier Breeding Centre, Le Genest St. Isle, France) after decapitation under deep anesthesia. The striatum was dissected as described previously (Hartikka and Hefti, 1988). Cell suspensions prepared by mechanical trituration without proteolytic enzymes were plated in culture wells precoated overnight with 1 mg/ml polyethyleneimine (Sigma, St. Quentin Fallavier, France). The cells were maintained at 37°C in a humidified incubator in an atmosphere of 5% CO2 in 500 μl of N5 medium (Höglinger et al., 2003) supplemented with 2.5% fetal calf serum and 5% horse serum to favor cell attachment. After 24 h in vitro, 2 μm 1-β-d-arabinofuranosylcytosine was added to eliminate proliferating non-neuronal cells, particularly astrocytes. Secondary excitotoxic stress resulting from the elimination of astrocytes was prevented by 2 μm of the NMDA receptor antagonist MK-801 [(+)-5-methyl-10,11-dihydro-5H-dibenzo [a,d] cyclohepten-5,10-imine maleate dizocilpine maleate] (Sigma). To limit possible interference by serum components, the concentration of fetal calf serum was reduced to 0.5% after 3 d in vitro, and, on the day of intoxication, the concentration of horse serum was reduced to 1% and fetal calf serum to 0.1%.
Chemicals.
Annonacin was purified as described previously (Champy et al., 2005), dissolved in dimethylsulfoxide (DMSO) at a concentration of 1 mm, and stored at −20°C. Serial dilutions used for treatments were made in N5 medium. Annonacin was added to the culture medium at day 5–6 in vitro. The final concentration of DMSO in the medium never exceeded 0.01%. All other chemicals used to treat the cultures [N-acetylcysteine (NAC), trolox, 3-nitropropionic (3-NP) acid, MPP+, iodide, carbonyl cyanide m-chlorophenylhydrazone (CCCP), taxol (paclitaxel), kainic acid, and 6-hydroxydopamine] were obtained from Sigma.
NDI1 transfection.
Cultured striatal neurons were transfected with a recombinant adeno-associated virus vector carrying the yeast NDI1 gene (rAAV–NDI1) that is able to replace the NADH-quinone-oxidoreductase function of complex I in mammalian cells, rendering them resistant to classical complex I inhibitors (Seo et al., 2002). On day 2 in vitro, 1.5 × 10⁸ rAAV–NDI1 virions were added to 0.2 × 10⁶ cultured neurons in 200 μl of medium. After 24 h incubation, 100 μl of the culture medium was added, and the cells were incubated 2 more days with the virions. Thereafter, the entire medium was replaced by medium without virions. Control cultures were treated in the same way but without addition of virions. Annonacin was added to the culture medium at day 5–6 in vitro.
Cell viability.
Neuronal survival was quantified by staining the living cells with calcein-acetomethylester (excitation at 495 nm, emission at 515 nm) that becomes fluorescent after cleavage of the ester by nonspecific esterases. Dead cells were monitored with ethidium homodimer (excitation at 495 nm, emission at 635 nm) that penetrates permeable cell membranes and intercalates into nucleic acids (Invitrogen, Carlsbad, CA).
Immunocytochemistry.
Cultures were immunostained as described previously (Höglinger et al., 2003) with the following primary antibodies: mouse monoclonal anti-phosphorylated tau AD2 (1:1000; Bio-Rad, Hercules, CA); AT8 (1:200), AT100 (1:250), AT180 (1:1000), and AT270 (1:300) (Innogenetics, Gent, The Netherlands); rabbit affinity purified anti-α-synuclein (1:500; Chemicon, Temecula, CA); rabbit anti-β-amyloid (H-43, 1:100; Santa Cruz Biotechnology, Santa Cruz, CA); rabbit anti-MAP2 (1:500) and rabbit anti β-III-tubulin (1:300; Sigma); and rabbit anti-NDI1 (1:1000; Takao Yagi, The Scripps Research Institute, La Jolla, CA). The antibodies were visualized with diaminobenzidine using the peroxidase–streptavidin/biotin method (Vectastain; Vector Laboratories, Burlingame, CA) or with affinity-purified fluorescent secondary antibodies (Jackson ImmunoResearch, West Grove, PA; Invitrogen, Carlsbad, CA). Nuclei were visualized with the fluorescent DNA stain Hoechst 33342. Immunolabeled cells were visualized under an epifluorescence microscope (DM IRB; Leica, Wetzlar, Germany) equipped with an ORCA-ER digital camera (C4742-95; Hamamatsu, Hersching, Germany) and a computer-based image analysis system (Simple-PCI 6.1; Cimaging Systems, Hersching, Germany). All cells in five randomly distributed visual fields were analyzed and quantified with a 40× objective.
Western blot.
Total cell extracts were prepared by 30 min lysis in 20 mm HEPES, pH 8.0, 150 mm KCl, 1.5 mm MgCl2, 0.5% Triton X-100, 0.1% SDS, and 2% Complete Mini Protease Inhibitor Cocktail (Roche, Basel, Switzerland). To prepare extracts in which tau dephosphorylation was inhibited or stimulated, the lysis buffer contained the Halt Phosphatase Inhibitor Complex (Pierce, Rockford, IL) or shrimp alkaline phosphatase (10 IU, 2 h, 37°C; Roche), respectively. After centrifugation at 31,000 × g for 30 min at 4°C, the supernatants were recovered, and the proteins were separated by SDS-PAGE on 7% acrylamide gels, blotted onto nitrocellulose membranes, and incubated with the primary antibodies [Tau5, 1:1000; AD2, 1:3000; AT8, 1:500; AT100, 1:250; AT270, 1:1000; polyclonal anti-actin, 1:2000 (Sigma)]. Immunoreactivity was revealed with the Normal or Super Signal Chemiluminescence Detection kit (Pierce).
Quantitative PCR.
Total RNA was extracted from primary cultures of striatal neurons of E16.5 rats using the RNeasy mini kit (Qiagen, Courtaboeuf, France), according to the instructions of the manufacturer. Two wells, 16 mm in diameter, were pooled for each sample. The experiments were performed in triplicate. First-strand cDNA was synthesized from 200 ng of total RNA using the ThermoScrip Reverse Transcription-PCR System (Invitrogen, Cergy Pontoise, France) with random hexamer primers, as recommended. The corresponding cDNAs were amplified by quantitative PCR, as prescribed, using the SyberGreen PCR Universal Master Mix (Applied Biosystems, Courteboeuf, France). Equal concentrations (400 nm) of the primers were used to amplify the internal control [neuron specific enolase (NSE) and tau]. The tau primers (forward, TGGCTCCACTGAGAACCTGAA; reverse, CCGGGACGTGTTTGATATTGT) were designed using Primer Express 1.5 software (Applied Biosystems). They amplified a 200 bp sequence that included the splice junction between exons 10 and 11 to avoid amplifying possible contaminating genomic DNA and were validated before use. Validated NSE primers (forward, GTGCGATGGTGCTGTTGATG; reverse, CAGCGTTACTTAGGCAAAGGTGT) were obtained commercially (Invitrogen, Cergy Pontoise, France). Each sample was run in duplicate on a ABI PRISM 7700 Detection system (Applied Biosystems). The increase in tau mRNA expression relative to the internal control in annonacin-treated cells was calculated with respect to tau mRNA in untreated cells using the formula r = 2−ΔΔCt with ΔΔCt (cycle threshold) = (CtMAPT2 − CtNSE)annonacin nm − (CtMAPT2 − CtNSE)annonacin 0 nm (Livak and Schmittgen, 2001).
Electron microscopy.
For standard electron microscopy, the cells were fixed with 2.5% glutaraldehyde in PBS (120 min, room temperature). For immunoelectron microscopy, the cells were fixed with 2% paraformaldehyde and 0.1% glutaraldehyde, incubated successively with the AD2 antibody (1:1000, 24 h, 4°C), with 0.5% bovine serum albumin supplemented with fish gelatin (0.1%, 1 h, room temperature; Aurion, Wageningen, The Netherlands), with anti-mouse IgG conjugated to 0.8 nm gold particles (24 h, room temperature; Aurion), and washed in 2% sodium acetate. Gold particles were silver enhanced (35 min, room temperature; Aurion). Cells were then immersed in gold chloride (0.05%, 10 min, 4°C) and in sodium thiosulfate (0.3%, twice for 10 min, 4°C). All samples were postfixed in osmium tetroxide (1%, 20 min, 4°C), dehydrated, and embedded in Epon. Ultrathin sections were cut, contrasted with uranyl acetate and lead citrate, and observed with a Jeol (Peabody, MA) 1200 EX electron microscope at 80 kV.
Thioflavin S staining.
To visualize the presence of amyloid-like structures, fixed cultures were incubated for 8 min in 0.05% thioflavin S (Sigma), washed in PBS, and differentiated in 70% ethanol for 5 min, as described previously (Höglinger et al., 2005a).
Quantification of reactive oxygen species.
Intracellular reactive oxygen species (ROS) were quantified with the Simple-PCI image analysis system using the fluorescent probe dihydrorhodamine-123 (DHR-123; Invitrogen, Carlsbad, CA), as described previously (Höglinger et al., 2003).
Quantification of ATP levels.
Control and annonacin-treated cultures were lysed with H2O. ATP levels were quantified on the total extract with a tube luminometer using the Vialight HS kit (BioWhittaker, Verviers, Belgium), which uses luciferase to catalyze the formation of light from ATP and luciferin, as described previously (Höglinger et al., 2003). The results obtained in arbitrary units were normalized with respect to the protein content of the extracts and are represented as the percentage of values obtained in control cultures.
Time-lapse imaging.
Cells were plated at low density (9 × 10⁵ cells/16 mm diameter well) to allow the observation of individual cells and their neurites. On day 5, mitochondria in live cells were labeled by addition of 200 nm MitoTracker Green-FM (excitation at 490 nm, emission at 516 nm; Invitrogen, Carlsbad, CA) for 30 min at 37°C. After medium exchange, the cells were exposed to the experimental treatments and imaged at 10 min intervals in a temperature- and CO2-controlled chamber on a Leica (Nussloch, Germany) DMI 6000 Fluorescence Microscope equipped with Leica LAS software package.
Data acquisition and analysis.
All data result from the analysis of at least two wells per experimental condition in at least three independent experiments. Data are expressed as the mean ± SEM of at least three different experiments. p values for comparison of normal parametric variables were calculated by two-sided t test and one- or two-way ANOVA followed by a post hoc Dunnett's or Bonferroni's t test, as appropriate.
Results
Annonacin causes neuronal cell death and somatic accumulation of tau
Treatment of cultured striatal neurons with annonacin for 48 h induced concentration-dependent neuronal cell loss, starting at a concentration of 50 nm (Fig. 1A,B). In control cultures, the antibody AD2, raised against the human tau protein phosphorylated on serine residues 396 and 404, labeled neurites but not neuronal cell bodies (Fig. 1A). After a 48 h treatment with annonacin at concentrations higher than 25 nm, a significant proportion of neurons had intense and diffuse AD2 immunoreactivity in the cell body (Fig. 1A,B). Identical results were obtained with other antibodies raised against human tau phosphorylated on other serine or threonine residues (AT8, serine 202/threonine 205; AT100, threonine 212/serine 214; AT270, threonine 181) (Fig. 1C).
Figure 1.
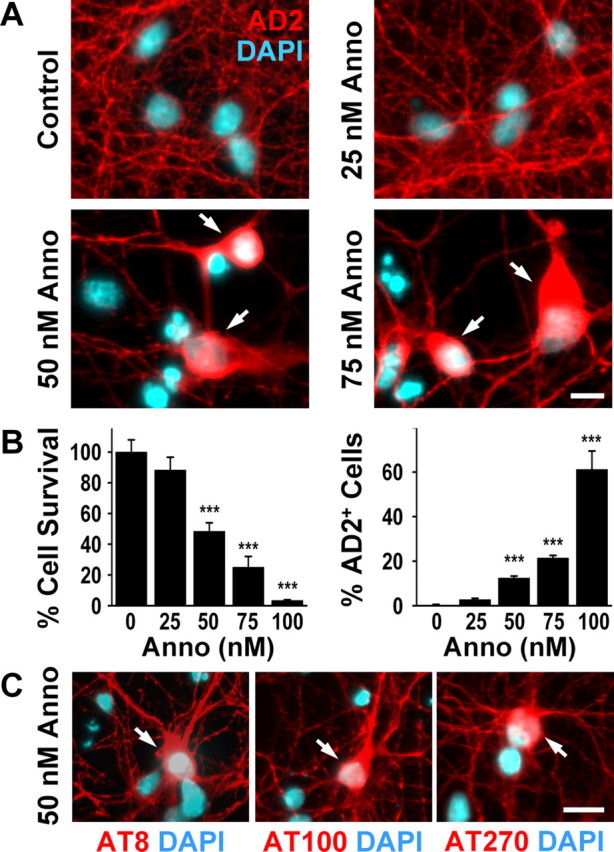
Annonacin causes a concentration-dependent cell death and redistribution of tau from the neurites to the cell body of neurons from embryonic rat striatum in culture. A, Representative photomicrographs of cultured neurons treated for 48 h with increasing concentrations of annonacin (Anno) and labeled with the antibody AD2 raised against pS396/pS404-tau (red). Nuclei are stained with 4′,6′-diamidino-2-phenylindole (DAPI; blue). Arrows show neurons with intact nuclear morphology and perinuclear AD2 immunoreactivity. B, Quantification of neuronal survival (percentage of untreated control cultures) and of neurons with AD2 immunoreactivity in the cell body (percentage of all neurons per culture well) after 48 h of annonacin treatment. ***p < 0.001 versus control. C, The redistribution of tau (arrows) in cultured neurons treated with 50 nm annonacin for 48 h is also detected by other antibodies against phosphorylated epitopes of tau: anti-AT8 raised against pS202/pT205-tau, anti-AT100 raised against pT212/pS214-tau, and anti-AT270 raised against pT181-tau (red). Nuclei are stained with DAPI (blue). Scale bars: A, C, 20 μm.
In contrast to tau, α-synuclein and β-amyloid did not accumulate in the cell bodies of annonacin-treated striatal neurons under our experimental conditions, although the antibodies used recognized the proteins on Western blots of rat brain extracts and identified Lewy bodies and amyloid plaques in the brains of patients with Parkinson's and Alzheimer's disease, respectively, used as positive controls (data not shown).
Annonacin increases tau protein levels
On Western blots of lysates of striatal neurons, the AD2 antibody labeled a single band at ∼55 kDa, compatible with the fetal isoform of tau. Treatment of the neurons for 48 h with 75 nm annonacin increased the intensity of the AD2 signal (Fig. 2A), indicating that tau expression increased during treatment. Interestingly, neither inhibition of phosphatases to preserve the phosphorylation state of tau nor incubation with alkaline phosphatase to dephosphorylate tau affected the mobility and intensity of the labeled band in the acrylamide gel (Fig. 2A). Identical results were obtained with the AT8 and AT270 antibodies (data not shown). Interestingly, Western blot analysis using the Tau5 antibody that recognizes tau independently of its phosphorylation state showed an identical increase in the signal intensity as the AD2 antibody (Fig. 2B). The increase in signal intensity seen with both the Tau5 and AD2 antibodies was concentration dependent and was only observed at annonacin concentrations higher than 50 nm (Fig. 2B). We could not, therefore, determine under our experimental conditions whether the relocation of tau in annonacin-treated embryonic neurons is regulated or not by phosphorylation.
Figure 2.
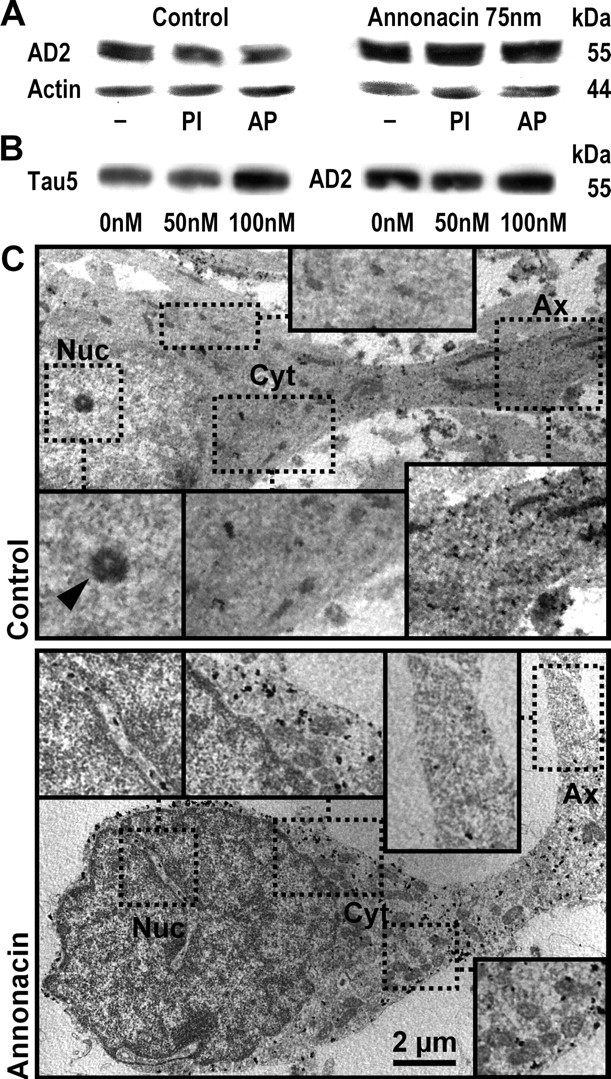
Biochemical and ultrastructural evidence that annonacin increases tau protein levels and induces the somatic redistribution of tau. A, Western blot analysis of cultured striatal neurons, grown under control conditions or treated for 48 h with 75 nm annonacin. The AD2 antibody labeled a single band at ∼55 kDa on 7% acrylamide gels, compatible with the fetal isoform of tau. Annonacin treatment increased the levels of AD2+ tau relative to actin. Protein extracts were prepared in standard lysis buffer (−), buffer containing phosphatase inhibitors (PI) to prevent tau dephosphorylation, or incubated with alkaline phosphatase (AP) to dephosphorylate tau. Under our experimental conditions, changes in the phosphorylation of tau could not be detected with the AD2 antibody. B, Western blot analysis of cultured striatal neurons, grown under control conditions or treated for 48 h with 50 or 100 nm annonacin. Protein extracts were prepared in lysis buffer containing phosphatase inhibitors. Both the Tau5 antibody, recognizing tau protein independently of its phosphorylation state, and the AD2 antibody labeled a single band at ∼55 kDa, which was increased compared with control conditions after treatment with 100 nm but not 50 nm annonacin. C, In a neuron under control conditions, immunogold labeling of tau by the AD2 antibody observed by electron microscopy shows abundant AD2 immunoreactivity (electron-dense black spots) in the axon (Ax) but not in the perinuclear cytoplasm (Cyt) or nucleus (Nuc; arrowhead, nucleolus). In a neuron treated with 50 nm annonacin for 48 h, AD2 immunoreactivity was sparse in the distal axon but very abundant in the perinuclear cytoplasm. As in controls, no AD2 immunoreactivity was observed in the nucleus (only in cytoplasmic invaginations into the nucleus). Immunolabeled fibrillary aggregates were not observed. Scale bar, 2 μm.
Annonacin does not increase tau mRNA levels
To determine whether tau expression was affected at the transcriptional level, tau mRNA levels were measured by quantitative PCR in striatal cultures treated with increasing concentrations of annonacin. Tau mRNA levels were calculated relative to NSE mRNA as internal control. The ratios were as follows: 0 nm annonacin, 1.003 ± 0.051; 25 nm, 1.118 ± 0.087; 50 nm, 1.134 ± 0.0126; and 75 nm, 0.549 ± 0.0550. Only the decrease in relative tau expression with 75 μm annonacin was statistically significant (p < 0.01, one-way ANOVA followed by Bonferroni's t test for multiple comparisons). The apparent increase in tau protein level observed by Western blot at the same annonacin concentration was therefore regulated at a posttranscriptional level.
Annonacin did not induce the aggregation of tau
In human tauopathies, tau is either distributed diffusely in the cytoplasm or is aggregated in fibrillary amyloid-like structures, which can be identified by electron microscopy or with thioflavin S, a marker of amyloid-like proteins with β-sheet structures (Bancher et al., 1989; Braak et al., 1994; Komori, 1999).
In striatal neurons treated for 48 h with 50 nm annonacin, electron microscopy confirmed the redistribution of AD2-positive (AD2+) tau. Whereas AD2 immunoreactivity was abundant in axons and sparse in the soma of control neurons, AD2 immunoreactivity was rare in axons and abundant in the soma of annonacin-treated neurons (Fig. 2C). Despite abundant somatic AD2 immunoreactivity in annonacin-treated neurons, no AD2+ aggregates were detected. Consistently, the AD2+ cell bodies of neurons in annonacin-treated cultures did not stain with thioflavin S (data not shown).
Annonacin causes somatic accumulation of tau and tau-tagged mitochondria
Interestingly, ultrastructural examination showed a significantly greater number of mitochondria in neuronal soma after a 48 h exposure to 50 nm annonacin compared with controls (control, 18.6 ± 1.7; annonacin, 28.5 ± 3.1; p < 0.01) (Figs. 2, 3A). A high percentage of these mitochondria appeared to have AD2+ tau attached to their outer membranes (Fig. 3A). Annonacin did not affect the percentage of mitochondria tagged with tau (control, 27.1 ± 2.8%; annonacin, 26.6 ± 1.9%) (Fig. 3A). This may indicate that at least part of the tau found in cell bodies after annonacin treatment might have resulted from the migration of mitochondria from neurites to the cell body.
Figure 3.
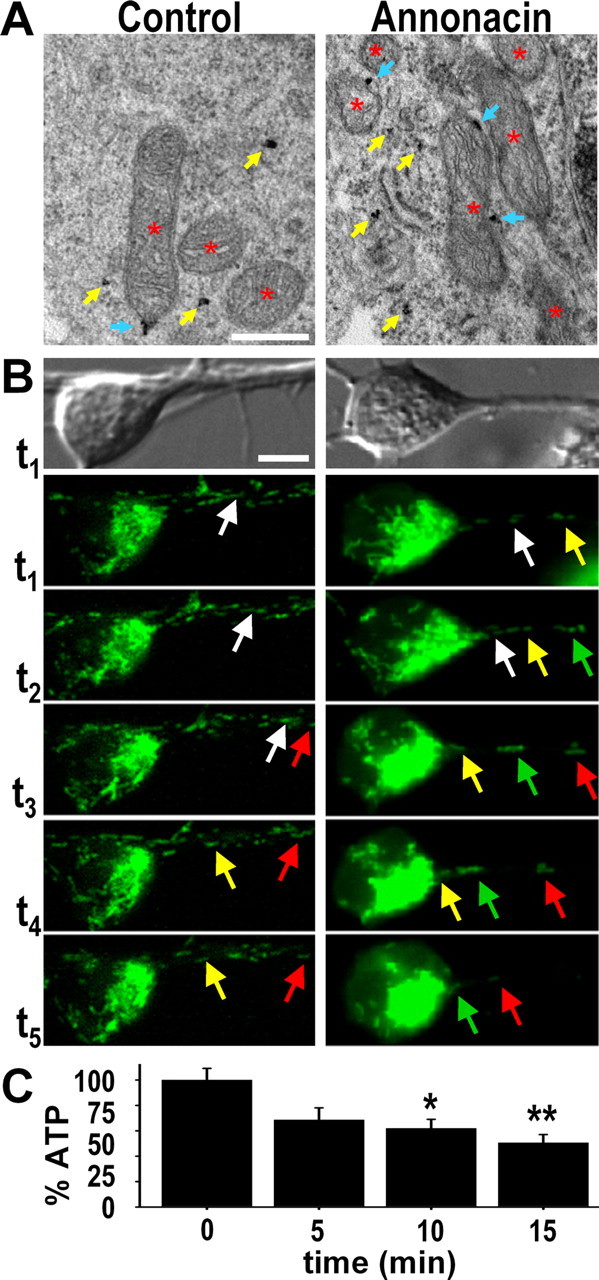
Annonacin causes somatic accumulation of mitochondria tagged with tau. A, Immunogold labeling of AD2+ tau visualized by electron microscopy shows an increased number of mitochondria (red stars) in the soma of a representative neuron from a culture treated for 48 h with 50 nm annonacin compared with a neuron from a control culture. Some of the mitochondria have AD2+ tau attached to their outer membranes (blue arrows). Yellow arrows indicate free AD2+ tau. Scale bar, 500 nm. B, Bright-field images of a representative control neuron and a neuron treated with 50 nm annonacin, followed by time-lapse video microscopy to show movements of mitotracker-stained mitochondria (green) in these neurons. In the control neuron, both anterograde and retrograde movements were seen. In contrast, only the retrograde movement of mitochondria from neurites to the soma was seen in the annonacin-treated neuron. Individual mitochondria are indicated in successive images with arrows of the same color. The images shown in this figure were taken at the following time points after addition of annonacin to the culture medium: t1, 1 min; t2, 10 min; t3, 50 min; t4, 80 min; t5, 140 min. The full movies are shown as supplemental data (available at www.jneurosci.org as supplemental material). Scale bar, 10 μm. C, ATP levels per milligram of protein in cultures exposed for 0, 5, 10, or 15 min to 50 nm annonacin, expressed as percentage of untreated control cultures. *p < 0.05, **p < 0.01 versus untreated controls.
To explore this possibility, we used time-lapse video microscopy to analyze how annonacin affected the intracellular movement of mitochondria. In neurites of control neurons, mitochondria moved in an apparently random manner without preference for the anterograde or retrograde direction (Fig. 3B) (supplemental movie 1, available at www.jneurosci.org as supplemental material). In striking contrast, after addition of 50 nm annonacin to the culture medium, all mitochondria in neurites started to move in a strictly retrograde manner toward the soma (Fig. 3B) (supplemental movie 2, available at www.jneurosci.org as supplemental material). Interestingly, the onset of retrograde mitochondrial movements coincided with a significant drop in ATP levels (61.9 ± 7.1% of controls) 10 min after addition of annonacin (Fig. 3C). As a consequence, there was a rapid depletion of mitochondria of the neurites and an accumulation of mitochondria in the soma (Fig. 3B) (supplemental movie 2, available at www.jneurosci.org as supplemental material).
Taxol blocks the somatic accumulation of both mitochondria and tau
Because taxol, an alkaloid of Taxus brevifolia, has been described to stabilize microtubules, to displace tau from microtubules (Samsonov et al., 2004) and to block some forms of retrograde transport in neurites (Komiya and Tashiro, 1988; Nennesmo and Reinholt, 1988; Nakata and Yorifuji, 1999), we examined whether it could prevent the changes in transport induced by annonacin. Treatment of cultured neurons with subtoxic concentrations of taxol (5 nm) fully blocked both the random movement of mitochondria under control conditions and their strictly retrograde movement in annonacin-treated cultures (Fig. 4A). In parallel, taxol prevented the annonacin-induced somatic accumulation of tau (Fig. 4B,C). However, taxol did not alter the rate of annonacin-induced cell death (Fig. 4D).
Figure 4.
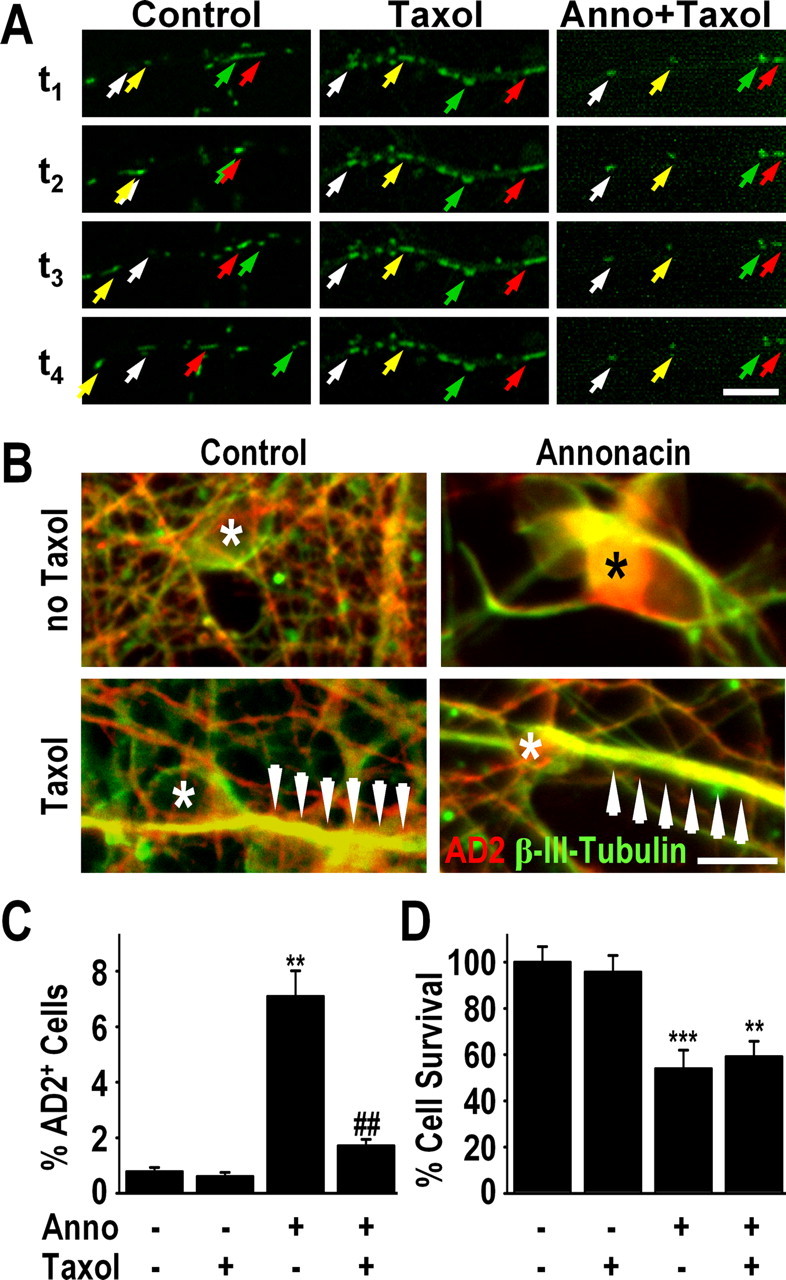
Taxol blocks the somatic accumulation of both mitochondria and tau. A, Time-lapse video microscopy showing the movement of mitotracker-stained mitochondria (green) in neurites of a representative neuron in a control culture, a control culture treated with taxol (5 nm), and a culture treated with 50 nm annonacin (Anno) and taxol. Addition of taxol to the culture medium blocked all movement of mitochondria in both control and annonacin-treated cells. Images were taken at 10 min intervals. The first image (t1) was taken 10 min after addition of annonacin to the culture medium. Individual mitochondria are indicated in successive images with arrows of the same color. Scale bar, 10 μm. B, Immunofluorescence images showing that 50 nm annonacin, in the absence of taxol, induced the redistribution of AD2+ tau (red) from the β-III-tubulin+ axons (green) to the neuronal cell body (*). The presence of taxol (5 nm) in the culture medium prevented the annonacin-induced accumulation of AD2+ tau in the cell body. Arrows indicate neuritic hypertrophy caused by taxol-induced polymerization of β-III-tubulin. Scale bar, 20 μm. C, D, Quantification of AD2+ cell bodies (C) and neuronal survival (D) in cultures exposed for 48 h exposure to 50 nm annonacin in the absence or presence of 5 nm taxol. **p < 0.01 versus control. ##p < 0.01 annonacin plus taxol versus annonacin alone.
Together, these data suggest that both mitochondria and tau accumulate in the soma of annonacin-treated neurons by active retrograde transport from the neurites, but inhibition of their transport did not appear to prevent or to aggravate cell death.
Annonacin causes fragmentation of microtubules
Coimmunostaining of cultured neurons with the axonal marker β-III-tubulin and the dendritic marker MAP2 demonstrated that, under control conditions, AD2+ tau was located almost exclusively in the axon (Fig. 5A). In neurons treated for 48 h with 50 nm annonacin, long stretches of the axons were devoid of AD2+ tau, which clustered in distinct patches in the axons (Fig. 5A). It is noteworthy that this effect preceded the axon retraction characteristic of neuronal death.
Figure 5.
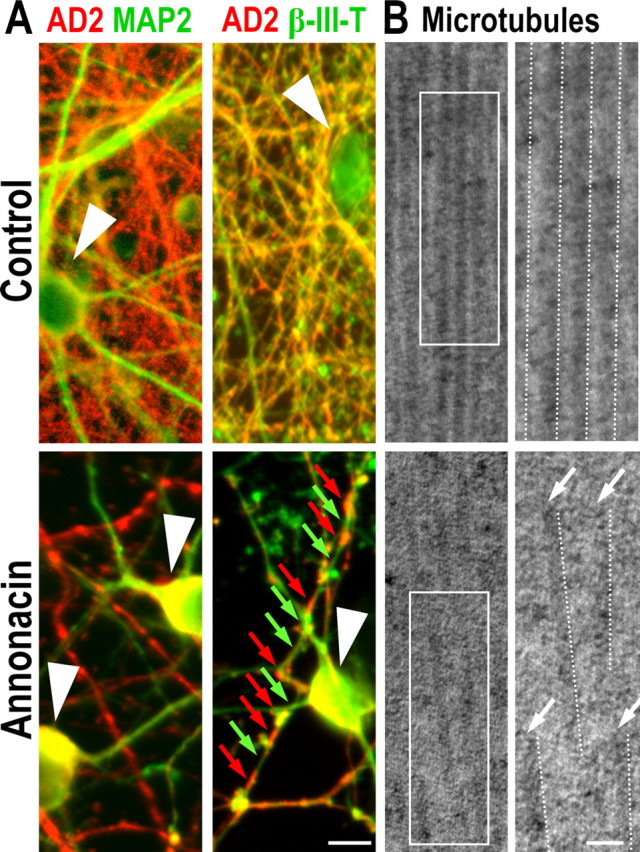
Annonacin causes fragmentation of microtubules. A, Control cultures and cultures exposed for 48 h to 50 nm annonacin, immunolabeled with antibodies against tau (AD2, red) and the dendritic marker MAP2 (green) or the axonal marker β-III-tubulin (β-III-T, green). Under control conditions, AD2+ tau is localized predominantly in axons, and its distribution is homogenous. In contrast, in annonacin-treated cultures, AD2+ tau has accumulated in the neuronal soma (white arrowheads), and the distribution of tau remaining in β-III-T+ axons is discontinuous (red arrows), leaving long stretches of the axons devoid of tau (green arrows). B, Ultrastructure of microtubules in neurons in control cultures and cultures exposed for 48 h to 50 nm annonacin. Overviews (left) and enlargements of the boxed areas (right) show that microtubules (highlighted by dotted lines) in neurites of a representative control neuron form parallel arrays and are continuous over long distances, whereas in annonacin-treated cultures, they are fragmented and disordered. Scale bar, 50 nm.
Electron microscopy showed that microtubules were aligned in parallel arrays in neurites of control cells, whereas in annonacin-treated cells (50 nm, 48 h), they were no longer aligned (Fig. 5B) and significantly shorter segments were seen (control, 373.7 ± 25.8 nm; annonacin, 193.5 ± 15.8 nm; p < 0.001). These data suggest that annonacin impairs the integrity of microtubules, perhaps as a result of the abnormal distribution of tau.
Complex I inhibition is responsible for the redistribution of tau
Next, we tried to understand the mechanism of how annonacin causes the redistribution of tau. We confirmed previously that annonacin inhibits complex I of the mitochondrial respiratory chain (Lannuzel et al., 2003; Champy et al., 2005). To test whether inhibition of the NADH-quinone-oxidoreductase activity of complex I, rather than another unidentified molecular mechanism, causes the redistribution of tau, we transfected cultured neurons with the NADH-quinone-oxidoreductase (NDI1) of Saccharomyces cerevisiae, which can restore NADH oxidation in complex I-deficient mammalian cells (Seo et al., 2000, 2002).
At the time of intoxication, the percentage of NDI1-transfected neurons clearly expressing the NDI1 protein, as determined by immunostaining, was 52.6 ± 3.8%. As expected, no immunoreactivity for the yeast protein was detected in untransfected control cells (Fig. 6A). NDI1-transfected cultures had significantly lower baseline ATP levels (62.9 ± 8.3%) compared with untransfected cultures (Fig. 6B), which is consistent with previous work demonstrating that the ratio of produced ATP per molecule oxygen drops from three to two after NDI1 overexpression in mammalian cells (Seo et al., 1999; Bai et al., 2001). After exposure to annonacin (100 nm, 6 h), however, NDI1-transfected cultures were significantly protected against annonacin-induced ATP-depletion (Fig. 3B), indicating that the enzyme is not inhibited by annonacin. NDI1-transfected cultures were protected against annonacin-induced neuronal death (100 nm, 48 h) (Fig. 6C,E) and redistribution of tau (100 nm, 48 h) (Fig. 6D,E). These observations indicate that annonacin-induced cell death and tau redistribution were indeed caused by inhibition of complex I-mediated NADH oxidation.
Figure 6.
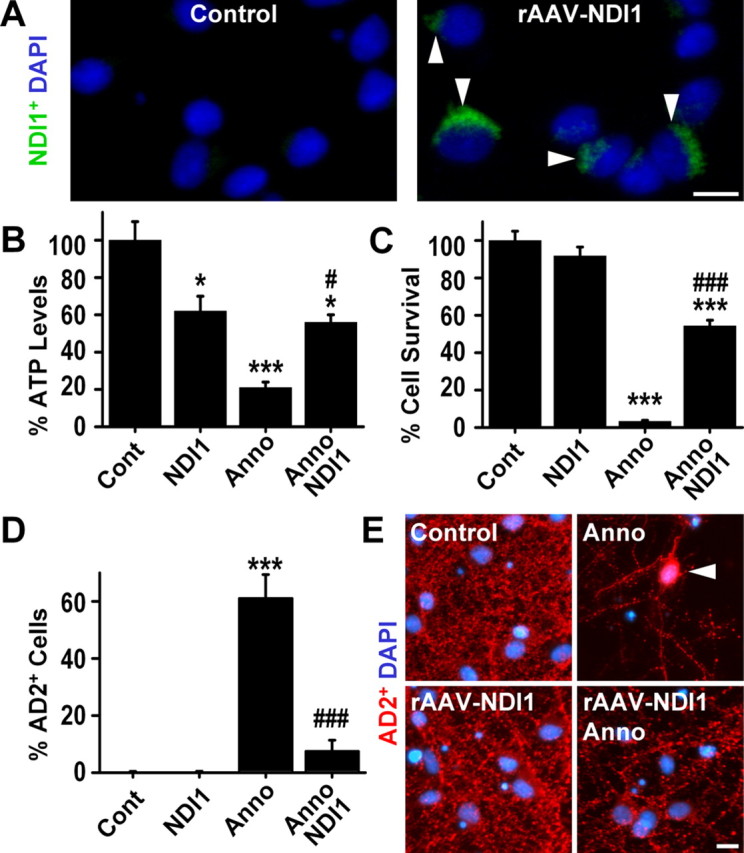
Annonacin-induced complex I inhibition is responsible for the somatic redistribution of tau. A, Immunohistochemistry with an antibody against yeast NDI1 shows the efficient rAAV-mediated expression of this protein (green, arrows) in transfected cells. As expected, no immunoreactivity for the yeast protein was detected in untransfected control cells. NDI1 is able to replace the NADH-oxidizing function of complex I in mammalian cells (Seo et al., 2002). DAPI (blue) stains nuclei. B–D, ATP levels (B), cell death (C), and somatic redistribution of AD2+ tau (D) in control (Cont) cultures of striatal neurons and in cultures exposed to 100 nm annonacin (Anno; 6 h for ATP, 48 h for survival and AD2), in the absence or the presence of NDI1 expression. *p < 0.05, ***p < 0.001 versus control; #p < 0.05, ###p < 0.001 versus annonacin alone. E, Photomicrographs showing that NDI1 expression prevents the annonacin-induced cell death and somatic redistribution of AD2+ tau (red, arrow) in cultured striatal neurons. DAPI (blue) stains nuclei. Scale bars: A, E, 10 μm.
Thus, we next examined whether an increase in the production of ROS or a decrease in ATP production, the major secondary effects downstream of complex I inhibition (Höglinger et al., 2003), were responsible for the annonacin-induced redistribution of tau.
ROS are not responsible for the redistribution of tau
The annonacin-induced increase in ROS production was visualized with the fluorescent ROS sensor DHR-123 and quantified on individual neuronal profiles (Fig. 7A). Pretreatment with the antioxidants NAC or trolox reduced ROS in neurons exposed to annonacin (50 nm, 6 h) to control levels (Fig. 7A). This did not, however, prevent cell death (Fig. 7B) or the redistribution of tau (Fig. 7C) induced by annonacin (50 nm, 48 h). These observations indicate that annonacin-induced ROS are not the prime cause of these phenomena.
Figure 7.

The annonacin-induced production of ROS is not responsible for the somatic redistribution of tau. A, ROS were visualized in the cytoplasm of cultured neurons with the ROS-sensitive rhodamine derivative DHR-123, quantified by measuring the intensity of DHR-123 fluorescence in individual neurons and expressed as percentage of baseline levels in control conditions (Cont). Treatment with annonacin (Anno; 50 nm, 6 h) resulted in a significant increase in ROS production. The increase in ROS levels was completely blocked by pretreatment with the radical scavengers trolox (10 μm) and NAC (5 mm) added to the culture medium 30 min before annonacin. *p < 0.05 versus control; #p < 0.05 versus annonacin alone. Scale bar, 20 μm. B, C, Treatment with 10 μm trolox or 5 mm NAC did not prevent the loss of neurons (B) or the appearance of AD2+ tau in neuronal cell bodies (C) induced by exposure to 50 nm annonacin for 48 h. **p < 0.01, ***p < 0.001 versus controls.
Stimulating anaerobic glycolysis prevents tau redistribution
Increasing the concentration of glucose in the culture medium from the standard 250 μm to 50 mm significantly elevated cellular ATP levels in cultures exposed to annonacin (50 nm, 6 h) (Fig. 8A) by stimulating anaerobic glycolysis, as we reported previously (Lannuzel et al., 2003). High-glucose medium completely prevented the cell death and the redistribution of tau induced by annonacin (50 nm, 48 h) (Fig. 8A). These observations suggest that ATP depletion might be responsible for the annonacin-induced redistribution of tau, because even partial restoration of ATP levels appears to be protective.
Figure 8.
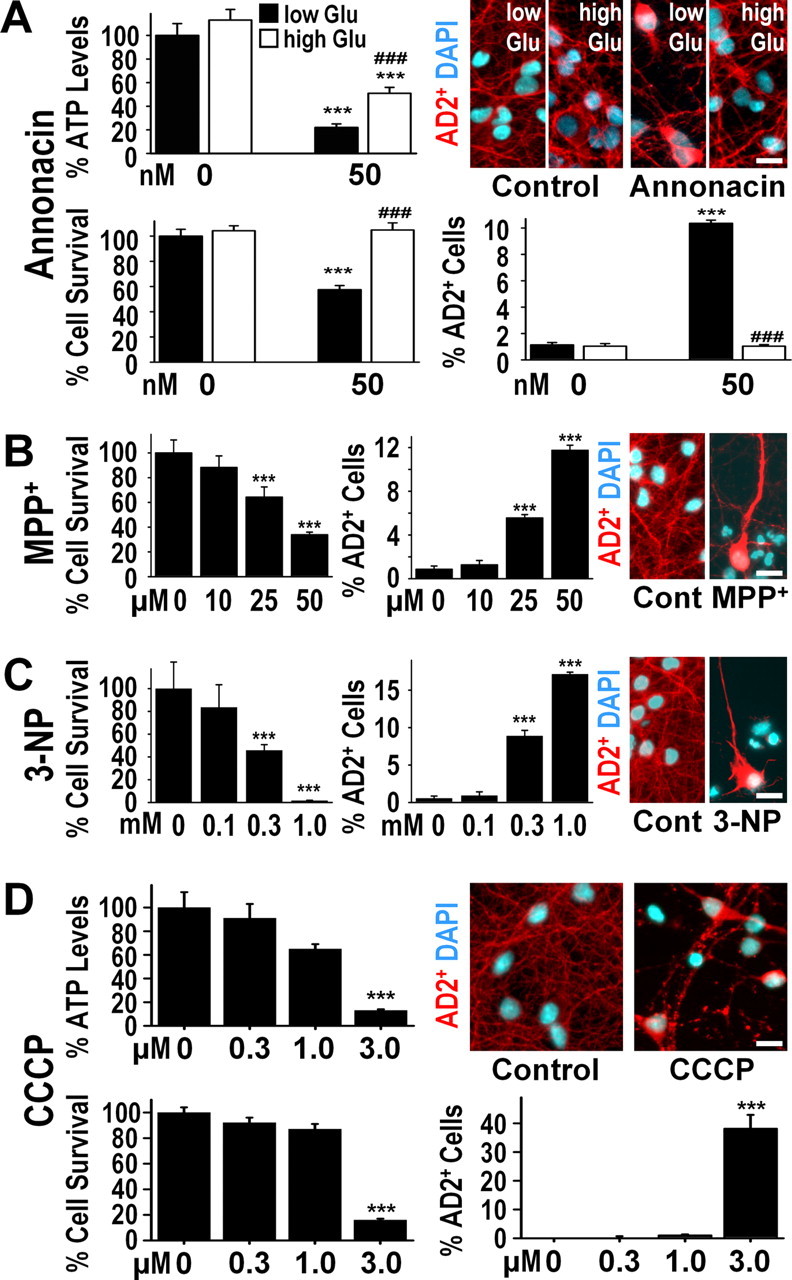
The annonacin-induced decrease in cellular ATP levels is responsible for the somatic redistribution of tau. A, ATP levels per milligram of protein (percentage of control levels), neuronal survival (percentage of control levels), and AD2+ cell bodies (percentage of all neurons) in cultures after exposure (6 h for ATP, 48 h for survival and AD2) to 50 nm annonacin in the presence of standard low glucose (Glu) concentration (250 μm) or a high concentration of glucose (50 mm) in the culture medium. ***p < 0.001 versus controls; ###p < 0.001 annonacin high glucose versus annonacin low glucose. The photomicrographs show representative cells with AD2+ tau (red) and DAPI+ chromatin (blue) in the different experimental conditions. B, Neuronal survival and AD2+ cell bodies in culture after a 48 h exposure to different concentrations of MPP+, an inhibitor of mitochondrial complex I. C, Neuronal survival and AD2+ cell bodies in culture after a 48 h exposure to different concentrations of 3-NP, an inhibitor of mitochondrial complex II. D, ATP levels per milligram of protein, neuronal survival, and AD2+ cell bodies in cultures after exposure (6 h for ATP, 48 h for survival and AD2) to different concentrations of CCCP, an uncoupler of oxidative phosphorylation. Scale bars, 20 μm.
Other ATP-depleting toxins mimic tau redistribution
If ATP depletion was the prime mechanism responsible for the redistribution of tau in annonacin-treated cultures, depletion of ATP by other means should have the same effect.
The complex I inhibitor MPP+, which differs markedly from annonacin with regard to its molecular structure and its complex I binding site (Degli Esposti, 1998), also depleted cellular ATP (control, 100.0 ± 0.4%; 50 μm MPP+ for 6 h, 27.4 ± 0.6%) and induced neuronal death and the somatic redistribution of tau after 48 h (Fig. 8B), but at concentrations 500 times higher than annonacin.
3-NP is an inhibitor of mitochondrial complex II, which, like complex I provides reducing equivalents to the respiratory chain for oxidative phosphorylation. Inhibition of complex II with 3-NP decreased ATP levels (control, 100.0 ± 7.8%; 1.0 mm 3-NP for 6 h, 13.5 ± 3.4%) and induced neuronal death and the redistribution of tau after 48 h (Fig. 8C), but at a concentration 6000 times higher than annonacin.
To deplete ATP without acting directly on the electron transport chain, we used the classic uncoupler of oxidative phosphorylation, CCCP. As predicted, CCCP also caused a concentration-dependent depletion of ATP, neuronal death, and the somatic redistribution of tau (Fig. 8D), but at a concentration 60 times higher than annonacin.
Together, these data suggest that neurotoxins leading to ATP depletion share the potential to induce the redistribution of tau from neurites to the cell bodies of intoxicated neurons.
Not all neurotoxins cause the redistribution of tau
To exclude the possibility that the somatic redistribution of tau is associated unspecifically with neuronal death regardless of the trigger, we exposed cultured neurons to 6-hydroxydopamine and kainic acid. These agents induce neuronal death by excessive ROS production and excitotoxicity, respectively, but not by ATP depletion (Höglinger et al., 2003). Cell death induced by 6-hydroxydopamine and kainic acid was not associated with the somatic redistribution of tau (data not shown).
Discussion
In this study, we have shown that low nanomolar concentrations of annonacin, the major acetogenin of Annona muricata, cause neuronal cell death and induce the redistribution of tau protein from the axon to the cell body of striatal neurons in vitro. The accumulation of tau in cell bodies is the neuropathological hallmark of a group of neurodegenerative disorders termed tauopathies, exemplified by PSP, frontotemporal dementia with parkinsonism linked to chromosome 17 (FTDP-17), the parkinsonism–dementia complex of Guam, and atypical parkinsonism in Guadeloupe (Braak et al., 1994; Delacourte and Buee, 2000; Goedert et al., 2000; Caparros-Lefebvre et al., 2002; Lee et al., 2005). The results presented here support the hypothesis that exposure to annonacin might be implicated in the etiology of the latter disease.
In tauopathies, somatic tau may be present unaggregated or in an aggregated amyloid-like form (Bancher et al., 1989; Braak et al., 1994; Komori, 1999). Electron microscopy and thioflavin S staining did not provide evidence in the present study of fibrillary tau aggregates in annonacin-treated neurons. Furthermore, no insoluble tau was detected on Western blots of annonacin-treated neurons. This might be a specific consequence of mitochondrial dysfunction or represent more generally an early stage of tau pathology, as seen in some neurons in patients from Guadeloupe (Caparros-Lefebvre et al., 2002). Alternatively, the fetal form of tau present in embryonic striatal neurons may not be prone to form fibrils and aggregate and cannot therefore reproduce the fibrillary pathology observed in patients (Caparros-Lefebvre et al., 2002).
At a concentration of 75 nm, annonacin induced an increase in tau protein levels, which appeared to result from reduced degradation rather than increased expression, because tau mRNA was reduced at the same annonacin concentration. These alterations appeared not to be relevant for the cell death and the intracellular redistribution of tau, however, because the latter phenomena were observed already at lower annonacin concentrations.
Our observation that the redistribution of tau induced by annonacin can be prevented by expression of the NDI1 NADH-quinone-oxidoreductase of S. cerevisiae, which can restore NADH oxidation in complex I-deficient mammalian cells (Seo et al., 2000, 2002), demonstrates that this effect is indeed mediated by complex I inhibition and not by another unidentified effect of annonacin. The major cellular consequences of complex I inhibition are increased ROS production and reduced ATP production (Höglinger et al., 2003). Because stabilization of cellular ATP levels by anaerobic glycolysis stimulated by excess of glucose or by NDI1 expression, but not treatment with the antioxidants trolox or NAC, fully prevented annonacin-induced somatic redistribution of tau, this phenomenon appears to be a consequence of cellular energy depletion. This conclusion is supported by the observation that somatic redistribution of tau also occurred after inhibition of complex I with MPP+, inhibition of complex II with 3-NP, and also uncoupling of the mitochondrial proton gradient with CCCP, all of which result in reduced ATP levels. In contrast, the ROS-generating neurotoxin 6-hydroxydopamine or the excitotoxic neurotoxin kainic acid had no effect.
Consistent with these observations, upregulation and phosphorylation of tau have been detected previously in vivo in the substantia nigra of mice treated with 1-methyl-4-phenyl-1,2,3,6-tetrahydropyridine, the precursor of MPP+ (Smith et al., 2003; Miller et al., 2004). Furthermore, in rats in which cerebral ATP levels were profoundly reduced after treatment with the complex I inhibitor rotenone, accumulations of tau were seen in neural cells, some of which were stained by thioflavin S and Gallyas silver impregnation and were fibrillary in nature as shown by electron microscopy (Höglinger et al., 2005a). The concept that ATP depletion can lead to the somatic accumulation of tau is particularly intriguing, because deficits in cerebral energy metabolism have been described in sporadic human tauopathies (Foster et al., 1988; Martinelli et al., 2000; Swerdlow et al., 2000; Albers et al., 2001).
Our study showed that annonacin caused an immediate retrograde movement of mitochondria from neurites to the soma in which they accumulate. This observation is consistent with previous studies showing that drugs that reduce the mitochondrial membrane potential or inhibit ATP production increase the retrograde transport of mitochondria (Miller and Sheetz, 2004), their clustering in the perinuclear region (De Vos et al., 1998; Desagher and Martinou, 2000), and their elimination by autophagy (Lemasters et al., 1998; Xue et al., 2001). Microtubules serve as tracks for the movement of mitochondria (Morris and Hollenbeck, 1995). Microtubule-associated proteins such as tau stabilize the microtubule tracks, and tau phosphorylation regulates the transport of mitochondria along microtubules (Mandelkow et al., 2004; Tatebayashi et al., 2004). There is also evidence that tau plays a role in the retrograde transport of damaged mitochondria. (1) Overexpression of tau is sufficient to induce a retrograde transport of mitochondria from neurites to clusters near the nucleus (Ebneth et al., 1998; Trinczek et al., 1999; Stamer et al., 2002). (2) A high percentage of the mitochondria clustered in the soma in annonacin-treated cultures appeared to have tau attached to their outer membranes. (3) Treatment with taxol, a drug that stabilizes microtubules but displaces tau (Samsonov et al., 2004), blocked both retrograde transport of mitochondria and somatic accumulation of tau. These arguments suggest that the annonacin-induced displacement of tau to neuronal cell bodies and the retrograde transport of mitochondria are functionally linked. Axonal ATP depletion attributable to a lack of mitochondria and axonal tau depletion may together be the cause of the breakdown of the axonal microtubules we observed in annonacin-treated neurons.
Cellular tau pathology has been related to the dysfunction or degeneration of neurons. The number of neurons containing abnormal accumulations of tau in the cell body has been closely correlated with behavioral deficits in Alzheimer's disease (Arriagada et al., 1992) and in a transgenic mouse model expressing human tau with the P301L mutation that causes FTDP-17 (Santacruz et al., 2005), and mutations in the tau gene are sufficient to cause neurodegeneration in some genetic disorders (Goedert et al., 2000; Lee et al., 2005). Intriguingly, in a transgenic mouse model of a tauopathy based on overexpression of the shortest human brain tau isoform, the microtubule-stabilizing drug taxol has been shown to reverse fast axonal transport deficits by functionally substituting for tau, which is sequestered in inclusions (Zhang et al., 2005). In our annonacin-treated cell cultures, which might be considered to be an acute model of a sporadic tauopathy, a concentration of taxol that was not toxic in itself prevented the redistribution of tau and mitochondria but not the cell death induced by annonacin, suggesting that, in this model, the redistribution of nonfilamentous tau to the cell body is not necessary for cell death. Somatic accumulations of tau might therefore be taken as stigma characterizing neuronal death induced by energy failure but not by ROS. The events involved in annonacin-induced tau pathology analyzed in this study are represented schematically in Figure 9.
Figure 9.
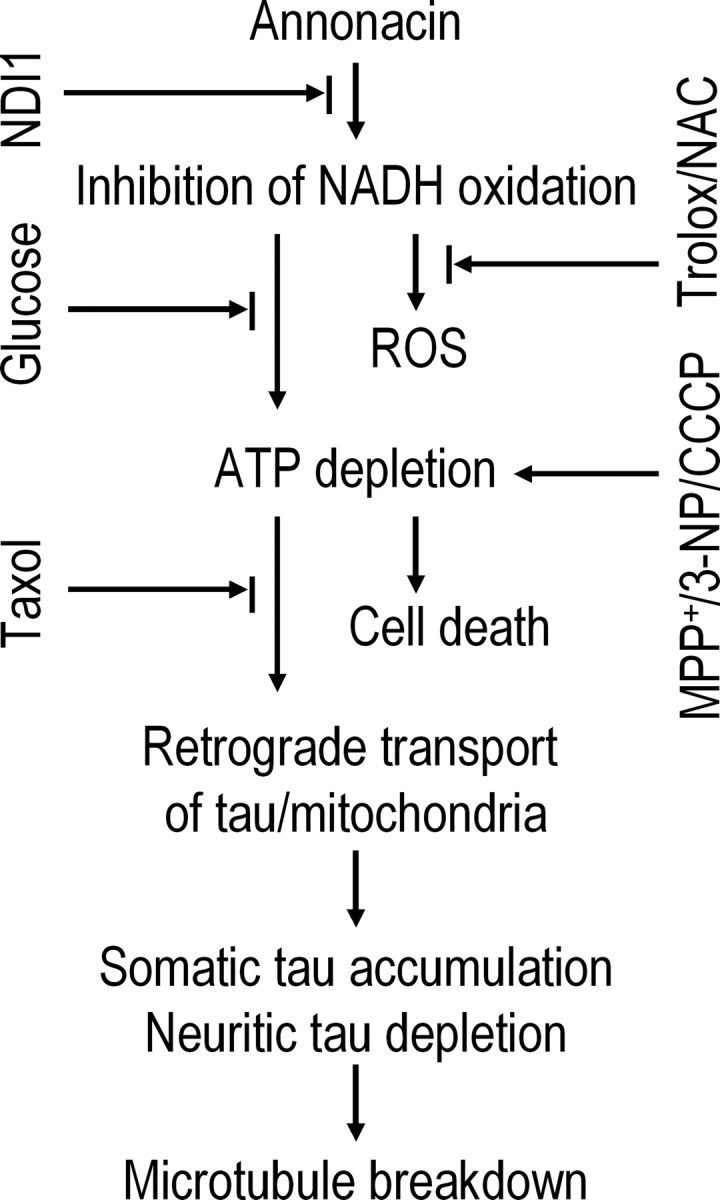
The sequence of pathological events induced by annonacin in primary cultures of striatal neurons. Annonacin inhibited the NADH-quinone-oxidoreductase activity of mitochondrial complex I, leading to increased ROS and decreased ATP production. The latter appears to be responsible for the retrograde transport of tau from neurites to the cell soma and, consequently, microtubule breakdown, because the antioxidants trolox and NAC had no effect on cell death or the distribution of tau, whereas increasing ATP levels by the expression of the yeast NADH oxidase NDI1 or the stimulation of anaerobic glycolysis with high glucose concentrations prevented both cell death and the redistribution of tau. ATP depletion induced by the respiratory chain inhibitors MPP+ and 3-NP or by the mitochondrial uncoupler CCCP mimicked annonacin-induced cell death and redistribution of tau. Taxol prevented the redistribution of tau and mitochondria but not the cell death induced by annonacin, suggesting that, in this experimental model, the redistribution of tau to the cell body is not involved in either neuroprotective or neurodegenerative pathways. It may rather be considered to be a stigma characteristic of neuronal death induced by energy failure.
In summary, the work presented here shows that very low concentrations of annonacin, two and three orders of magnitude lower than MPP+ and 3-NP, respectively, can induce a tau pathology with some similarity to what is seen in the postmortem brains of patients with atypical parkinsonism in Guadeloupe. We showed that annonacin-induced ATP reduction but not ROS increase is associated with cell toxicity, tau redistribution, and abnormal mitochondrial transport. Conversely, taxol prevents annonacin-induced tau redistribution to the cell body but does not prevent cell death, suggesting that the nonfilamentous phosphorylated tau is not necessary for cell death in this model. Thus, the present study suggests that environmental factors leading to cerebral energy depletion might be important etiological factors in sporadic tauopathies.
Footnotes
This work was supported by INSERM, the Förderverein Neurologie Marburg, the Society for Progressive Supranuclear Palsy (Baltimore, MD), the European Union (Grant LSHM-CT-2003-503330; Marie Curie Incoming Fellowship Tau-Annonacin), and National Institutes of Health Grants NS048441 and DK053244. We thank Gülsha Gabriel and Cécile Saint-Martin for excellent technical assistance.
References
- Albers DS, Swerdlow RH, Manfredi G, Gajewski C, Yang L, Parker WD, Jr, Beal MF. Further evidence for mitochondrial dysfunction in progressive supranuclear palsy. Exp Neurol. 2001;168:196–198. doi: 10.1006/exnr.2000.7607. [DOI] [PubMed] [Google Scholar]
- Angibaud G, Gaultier C, Rascol O. Atypical parkinsonism and Annonaceae consumption in New Caledonia. Mov Disord. 2004;19:603–604. doi: 10.1002/mds.20104. [DOI] [PubMed] [Google Scholar]
- Arriagada PV, Growdon JH, Hedley-White ET, Hyman BT. Neurofibrillary tangles but not senile plaques parallel duration and severity of Alzheimer's disease. Neurology. 1992;82:239–259. doi: 10.1212/wnl.42.3.631. [DOI] [PubMed] [Google Scholar]
- Bai Y, Hajek P, Chomyn A, Chan E, Seo BB, Matsuno-Yagi A, Yagi T, Attardi G. Lack of complex I activity in human cells carrying a mutation in MtDNA-encoded ND4 subunit is corrected by the Saccharomyces cerevisiae NADH-quinone oxidoreductase (NDI1) gene. J Biol Chem. 2001;276:38808–38813. doi: 10.1074/jbc.M106363200. [DOI] [PubMed] [Google Scholar]
- Bancher C, Brunner C, Lassmann H, Budka H, Jellinger K, Wiche G, Seitelberger F, Grundke-Iqbal I, Iqbal K, Wisniewski HM. Accumulation of abnormally phosphorylated tau precedes the formation of neurofibrillary tangles in Alzheimer's disease. Brain Res. 1989;477:90–99. doi: 10.1016/0006-8993(89)91396-6. [DOI] [PubMed] [Google Scholar]
- Braak E, Braak H, Mandelkow EM. A sequence of cytoskeleton changes related to the formation of neurofibrillary tangles and neuropil threads. Acta Neuropathol. 1994;87:554–567. doi: 10.1007/BF00293315. [DOI] [PubMed] [Google Scholar]
- Caparros-Lefebvre D, Elbaz A. Possible relation of atypical parkinsonism in the French West Indies with consumption of tropical plants: a case-control study. Caribbean Parkinsonism Study Group. Lancet. 1999;354:281–286. doi: 10.1016/s0140-6736(98)10166-6. [DOI] [PubMed] [Google Scholar]
- Caparros-Lefebvre D, Sergeant N, Lees A, Camuzat A, Daniel S, Lannuzel A, Brice A, Tolosa E, Delacourte A, Duyckaerts C. Guadeloupean parkinsonism: a cluster of progressive supranuclear palsy-like tauopathy. Brain. 2002;125:801–811. doi: 10.1093/brain/awf086. [DOI] [PubMed] [Google Scholar]
- Champy P, Höglinger GU, Feger J, Gleye C, Hocquemiller R, Laurens A, Guerineau V, Laprevote O, Medja F, Lombes A, Michel PP, Lannuzel A, Hirsch EC, Ruberg M. Annonacin, a lipophilic inhibitor of mitochondrial complex I, induces nigral and striatal neurodegeneration in rats: possible relevance for atypical parkinsonism in Guadeloupe. J Neurochem. 2004;88:63–69. doi: 10.1046/j.1471-4159.2003.02138.x. [DOI] [PubMed] [Google Scholar]
- Champy P, Melot A, Guerineau EV, Gleye C, Fall D, Höglinger GU, Ruberg M, Lannuzel A, Laprevote O, Laurens A, Hocquemiller R. Quantification of acetogenins in Annona muricata linked to atypical parkinsonism in Guadeloupe. Mov Disord. 2005;20:1629–1633. doi: 10.1002/mds.20632. [DOI] [PubMed] [Google Scholar]
- De Vos K, Goossens V, Boone E, Vercammen D, Vancompernolle K, Vandenabeele P, Haegeman G, Fiers W, Grooten J. The 55-kDa tumor necrosis factor receptor induces clustering of mitochondria through its membrane-proximal region. J Biol Chem. 1998;273:9673–9680. doi: 10.1074/jbc.273.16.9673. [DOI] [PubMed] [Google Scholar]
- Degli Esposti M. Inhibitors of NADH-ubiquinone reductase: an overview. Biochim Biophys Acta. 1998;1364:222–235. doi: 10.1016/s0005-2728(98)00029-2. [DOI] [PubMed] [Google Scholar]
- Delacourte A, Buee L. Tau pathology: a marker of neurodegenerative disorders. Curr Opin Neurol. 2000;13:371–376. doi: 10.1097/00019052-200008000-00002. [DOI] [PubMed] [Google Scholar]
- Desagher S, Martinou JC. Mitochondria as the central control point of apoptosis. Trends Cell Biol. 2000;10:369–377. doi: 10.1016/s0962-8924(00)01803-1. [DOI] [PubMed] [Google Scholar]
- Ebneth A, Godemann R, Stamer K, Illenberger S, Trinczek B, Mandelkow E. Overexpression of tau protein inhibits kinesin-dependent trafficking of vesicles, mitochondria, and endoplasmic reticulum: implications for Alzheimer's disease. J Cell Biol. 1998;143:777–794. doi: 10.1083/jcb.143.3.777. [DOI] [PMC free article] [PubMed] [Google Scholar]
- Foster NL, Gilman S, Berent S, Morin EM, Brown MB, Koeppe RA. Cerebral hypometabolism in progressive supranuclear palsy studied with positron emission tomography. Ann Neurol. 1988;24:399–406. doi: 10.1002/ana.410240308. [DOI] [PubMed] [Google Scholar]
- Goedert M, Ghetti B, Spillantini MG. Tau gene mutations in frontotemporal dementia and parkinsonism linked to chromosome 17 (FTDP-17). Their relevance for understanding the neurogenerative process. Ann NY Acad Sci. 2000;920:74–83. doi: 10.1111/j.1749-6632.2000.tb06907.x. [DOI] [PubMed] [Google Scholar]
- Hartikka J, Hefti F. Comparison of nerve growth factor's effects on development of septum, striatum, and nucleus basalis cholinergic neurons in vitro. J Neurosci Res. 1988;21:352–364. doi: 10.1002/jnr.490210227. [DOI] [PubMed] [Google Scholar]
- Höglinger GU, Carrard G, Michel PP, Medja F, Lombes A, Ruberg M, Friguet B, Hirsch EC. Dysfunction of mitochondrial complex I and the proteasome: interactions between two biochemical deficits in a cellular model of Parkinson's disease. J Neurochem. 2003;86:1297–1307. doi: 10.1046/j.1471-4159.2003.01952.x. [DOI] [PubMed] [Google Scholar]
- Höglinger GU, Lannuzel A, Khondiker ME, Michel PP, Duyckaerts C, Feger J, Champy P, Prigent A, Medja F, Lombes A, Oertel WH, Ruberg M, Hirsch EC. The mitochondrial complex I inhibitor rotenone triggers a cerebral tauopathy. J Neurochem. 2005a;95:930–939. doi: 10.1111/j.1471-4159.2005.03493.x. [DOI] [PubMed] [Google Scholar]
- Höglinger GU, Michel PP, Champy P, Feger J, Hirsch EC, Ruberg M, Lannuzel A. Experimental evidence for a toxic etiology of tropical parkinsonism. Mov Disord. 2005b;20:118–119. doi: 10.1002/mds.20300. [DOI] [PubMed] [Google Scholar]
- Komiya Y, Tashiro T. Effects of taxol on slow and fast axonal transport. Cell Motil Cytoskeleton. 1988;11:151–156. doi: 10.1002/cm.970110302. [DOI] [PubMed] [Google Scholar]
- Komori T. Tau-positive glial inclusions in progressive supranuclear palsy, corticobasal degeneration and Pick's disease. Brain Pathol. 1999;9:663–679. doi: 10.1111/j.1750-3639.1999.tb00549.x. [DOI] [PMC free article] [PubMed] [Google Scholar]
- Langston JW, Ballard P, Tetrud JW, Irwin I. Chronic parkinsonism in humans due to a product of meperidine-analog synthesis. Science. 1983;219:979–980. doi: 10.1126/science.6823561. [DOI] [PubMed] [Google Scholar]
- Lannuzel A, Michel PP, Höglinger GU, Champy P, Jousset A, Medja F, Lombes A, Darios F, Gleye C, Laurens A, Hocquemiller R, Hirsch EC, Ruberg M. The mitochondrial complex I inhibitor annonacin is toxic to mesencephalic dopaminergic neurons by impairment of energy metabolism. Neuroscience. 2003;121:287–296. doi: 10.1016/s0306-4522(03)00441-x. [DOI] [PubMed] [Google Scholar]
- Lannuzel A, Höglinger GU, Verhaeghe S, Gire L, Belson S, Escobar-Khondiker M, Poullain P, Oertel WH, Hirsch EC, Dubois B, Ruberg M. Atypical parkinsonism in Guadeloupe: a common risk factor for two closely related phenotypes? Brain. 2007;130:816–827. doi: 10.1093/brain/awl347. [DOI] [PubMed] [Google Scholar]
- Lee VM, Kenyon TK, Trojanowski JQ. Transgenic animal models of tauopathies. Biochim Biophys Acta. 2005;1739:251–259. doi: 10.1016/j.bbadis.2004.06.014. [DOI] [PubMed] [Google Scholar]
- Lemasters JJ, Nieminen AL, Qian T, Trost LC, Elmore SP, Nishimura Y, Crowe RA, Cascio WE, Bradham CA, Brenner DA, Herman B. The mitochondrial permeability transition in cell death: a common mechanism in necrosis, apoptosis and autophagy. Biochim Biophys Acta. 1998;1366:177–196. doi: 10.1016/s0005-2728(98)00112-1. [DOI] [PubMed] [Google Scholar]
- Livak KJ, Schmittgen TD. Analysis of relative gene expression data using real-time quantitative PCR and the 2(-Delta Delta C(T)) method. Methods. 2001;25:402–408. doi: 10.1006/meth.2001.1262. [DOI] [PubMed] [Google Scholar]
- Mandelkow EM, Thies E, Trinczek B, Biernat J, Mandelkow E. MARK/PAR1 kinase is a regulator of microtubule-dependent transport in axons. J Cell Biol. 2004;167:99–110. doi: 10.1083/jcb.200401085. [DOI] [PMC free article] [PubMed] [Google Scholar]
- Martinelli P, Scaglione C, Lodi R, Iotti S, Barbiroli B. Deficit of brain and skeletal muscle bioenergetics in progressive supranuclear palsy shown in vivo by phosphorus magnetic resonance spectroscopy. Mov Disord. 2000;15:889–893. doi: 10.1002/1531-8257(200009)15:5<889::aid-mds1020>3.0.co;2-t. [DOI] [PubMed] [Google Scholar]
- Miller KE, Sheetz MP. Axonal mitochondrial transport and potential are correlated. J Cell Sci. 2004;117:2791–2804. doi: 10.1242/jcs.01130. [DOI] [PubMed] [Google Scholar]
- Miller RM, Callahan LM, Casaceli C, Chen L, Kiser GL, Chui B, Kaysser-Kranich TM, Sendera TJ, Palaniappan C, Federoff HJ. Dysregulation of gene expression in the 1-methyl-4-phenyl-1,2,3,6-tetrahydropyridine-lesioned mouse substantia nigra. J Neurosci. 2004;24:7445–7454. doi: 10.1523/JNEUROSCI.4204-03.2004. [DOI] [PMC free article] [PubMed] [Google Scholar]
- Morris RL, Hollenbeck PJ. Axonal transport of mitochondria along microtubules and F-actin in living vertebrate neurons. J Cell Biol. 1995;131:1315–1326. doi: 10.1083/jcb.131.5.1315. [DOI] [PMC free article] [PubMed] [Google Scholar]
- Nakata T, Yorifuji H. Morphological evidence of the inhibitory effect of taxol on the fast axonal transport. Neurosci Res. 1999;35:113–122. doi: 10.1016/s0168-0102(99)00074-7. [DOI] [PubMed] [Google Scholar]
- Nennesmo I, Reinholt FP. Effects of intraneural injection of taxol on retrograde axonal transport and morphology of corresponding nerve cell bodies. Virchows Arch B Cell Pathol Incl Mol Pathol. 1988;55:241–246. doi: 10.1007/BF02896582. [DOI] [PubMed] [Google Scholar]
- Przedborski S, Vila M. The 1-methyl-4-phenyl-1,2,3,6-tetrahydropyridine mouse model: a tool to explore the pathogenesis of Parkinson's disease. Ann NY Acad Sci. 2003;991:189–198. [PubMed] [Google Scholar]
- Samsonov A, Yu JZ, Rasenick M, Popov SV. Tau interaction with microtubules in vivo. J Cell Sci. 2004;117:6129–6141. doi: 10.1242/jcs.01531. [DOI] [PubMed] [Google Scholar]
- Santacruz K, Lewis J, Spires T, Paulson J, Kotilinek L, Ingelsson M, Guimaraes A, DeTure M, Ramsden M, McGowan E, Forster C, Yue M, Orne J, Janus C, Mariash A, Kuskowski M, Hyman B, Hutton M, Ashe KH. Tau suppression in a neurodegenerative mouse model improves memory function. Science. 2005;309:476–481. doi: 10.1126/science.1113694. [DOI] [PMC free article] [PubMed] [Google Scholar]
- Seo BB, Matsuno-Yagi A, Yagi T. Modulation of oxidative phosphorylation of human kidney 293 cells by transfection with the internal rotenone-insensitive NADH-quinone oxidoreductase (NDI1) gene of Saccharomyces cerevisiae. Biochim Biophys Acta. 1999;1412:56–65. doi: 10.1016/s0005-2728(99)00051-1. [DOI] [PubMed] [Google Scholar]
- Seo BB, Wang J, Flotte TR, Yagi T, Matsuno-Yagi A. Use of the NADH-quinone oxidoreductase (NDI1) gene of Saccharomyces cerevisiae as a possible cure for complex I defects in human cells. J Biol Chem. 2000;275:37774–37778. doi: 10.1074/jbc.M007033200. [DOI] [PubMed] [Google Scholar]
- Seo BB, Nakamaru-Ogiso E, Flotte TR, Yagi T, Matsuno-Yagi A. A single-subunit NADH-quinone oxidoreductase renders resistance to mammalian nerve cells against complex I inhibition. Mol Ther. 2002;6:336–341. doi: 10.1006/mthe.2002.0674. [DOI] [PubMed] [Google Scholar]
- Smith PD, Crocker SJ, Jackson-Lewis V, Jordan-Sciutto KL, Hayley S, Mount MP, O'Hare MJ, Callaghan S, Slack RS, Przedborski S, Anisman H, Park DS. Cyclin-dependent kinase 5 is a mediator of dopaminergic neuron loss in a mouse model of Parkinson's disease. Proc Natl Acad Sci USA. 2003;100:13650–13655. doi: 10.1073/pnas.2232515100. [DOI] [PMC free article] [PubMed] [Google Scholar]
- Stamer K, Vogel R, Thies E, Mandelkow E, Mandelkow EM. Tau blocks traffic of organelles, neurofilaments, and APP vesicles in neurons and enhances oxidative stress. J Cell Biol. 2002;156:1051–1063. doi: 10.1083/jcb.200108057. [DOI] [PMC free article] [PubMed] [Google Scholar]
- Swerdlow RH, Golbe LI, Parks JK, Cassarino DS, Binder DR, Grawey AE, Litvan I, Bennett JP, Jr, Wooten GF, Parker WD. Mitochondrial dysfunction in cybrid lines expressing mitochondrial genes from patients with progressive supranuclear palsy. J Neurochem. 2000;75:1681–1684. doi: 10.1046/j.1471-4159.2000.0751681.x. [DOI] [PubMed] [Google Scholar]
- Tatebayashi Y, Haque N, Tung YC, Iqbal K, Grundke-Iqbal I. Role of tau phosphorylation by glycogen synthase kinase-3beta in the regulation of organelle transport. J Cell Sci. 2004;117:1653–1663. doi: 10.1242/jcs.01018. [DOI] [PubMed] [Google Scholar]
- Trinczek B, Ebneth A, Mandelkow EM, Mandelkow E. Tau regulates the attachment/detachment but not the speed of motors in microtubule-dependent transport of single vesicles and organelles. Cell Sci. 1999:2355–2367. doi: 10.1242/jcs.112.14.2355. [DOI] [PubMed] [Google Scholar]
- Xue L, Fletcher GC, Tolkovsky AM. Mitochondria are selectively eliminated from eukaryotic cells after blockade of caspases during apoptosis. Curr Biol. 2001;11:361–365. doi: 10.1016/s0960-9822(01)00100-2. [DOI] [PubMed] [Google Scholar]
- Zhang B, Maiti A, Shively S, Lakhani F, McDonald-Jones G, Bruce J, Lee EB, Xie SX, Joyce S, Li C, Toleikis PM, Lee VM, Trojanowski JQ. Microtubule-binding drugs offset tau sequestration by stabilizing microtubules and reversing fast axonal transport deficits in a tauopathy model. Proc Natl Acad Sci USA. 2005;102:227–231. doi: 10.1073/pnas.0406361102. [DOI] [PMC free article] [PubMed] [Google Scholar]