

Abstract
There are conflicting data on the timescale for the representation of adult zebra finch song. Acoustic structure and perturbation studies suggest that song is divided into discrete vocal elements, or syllables, lasting 50–200 ms. However, recordings in premotor telencephalic nucleus HVC (used as proper name) and RA (robust nucleus of arcopallium) suggest that song is represented by sparse, fine-grained bursting on the 5–10 ms timescale. We previously found patterns of timing variability that distinguish individual syllables and repeat across multiple 500- to 1000-ms-long motifs (Glaze and Troyer, 2006). Here, we extend our methods to analyze whether this is attributable to a syllable-based code or representations on a finer timescale. We find evidence for the latter. First, identity-dependent timing is dominated by independent variability in notes, finer song segments that compose a syllable; for example, the length of a note is no more correlated with other notes in the same syllable than it is with notes in other syllables. For a subset of notes, clear modulation in spectral structure allowed for accurate timing measurements on the 5–10 ms timescale. Temporal independence holds at this scale as well: the length of an individual 5–10 ms song slice is correlated with the same slice repeated 500–1000 ms later, yet is independent of neighboring slices. We propose that such fine-grained, persistent changes in song tempo result from an interaction between slow modulatory factors and precisely timed, sparse bursting in HVC and RA.
Keywords: birdsong, temporal, timing, motor control, central pattern generator, vocalization
Introduction
How brains learn and produce complex sequences is one of the touchstone questions in neuroscience (Lashley, 1951; Hikosaka et al., 2002; Keele et al., 2003; Rhodes et al., 2004). Although many natural skills contain a hierarchy of subtasks (Miller et al., 1960), the units of behavior are not always clear. Zebra finch courtship song has several characteristics that make it an ideal model system for understanding sequence learning and production. Songs are learned, highly stereotyped, and have a hierarchical temporal structure spanning multiple timescales: songs consist of several repeats of 500- to 1000-ms-long “motifs”; motifs consist of a stereotyped sequence of three to seven “syllables,” 50- to 250-ms-long vocalizations separated by silence; many syllables can be further divided into 30- to 70-ms-long “notes.”
Many studies have proposed that the syllable is a basic unit of song production (Yu and Margoliash, 1996; Zann, 1996; Williams, 2004; Solis and Perkel, 2005). This view is supported by evidence that respiratory expirations accompany syllables and inhalations accompany silent gaps, whereas song interruption caused by strobe flashes or electrical stimulation tends to occur during gaps (Cynx, 1990; Vu et al., 1994; Wild et al., 1998; Franz and Goller, 2002). However, the syllable-based view is challenged by temporally sparse bursting in the premotor telencephalic nucleus HVC (telencephalic song nucleus). During each motif, HVC projection neurons produce a single burst of spikes time-locked to the song with millisecond precision (Hahnloser et al., 2002). Fee et al. (2004) have proposed that HVC acts like a clock, continuously pacing song behavior. Under this proposal, the 5- to 10-ms-long burst is the fundamental unit of the song motor code, and slower acoustic changes result from convergent connections downstream of HVC (Fee et al., 2004; Leonardo and Fee, 2005).
In a previous study, we explored song temporal structure by closely examining natural variability in the lengths of syllables and the gaps of silence between them (Glaze and Troyer, 2006). At a slow timescale, length changes are dominated by modulatory factors that influence syllables and gaps throughout the song. At the syllable timescale, syllables are less “elastic” than gaps (i.e., they stretch and compress proportionally less with tempo changes), and syllable–syllable and gap–gap length correlations are stronger than syllable–gap correlations. Such syllable/gap differences contradict the hypothesis that song timing is driven by a uniform clock that continuously paces motor output. Importantly, syllable pairs consisting of the same syllable repeated across motifs were especially related, having strong length correlations and similar elasticity. This “identity dependence” of temporal variability suggested that syllables may form a basic unit in the motor code for song.
Here, we extend our methods to examine the structure of song timing at timescales finer than the syllable. We find that the identity-dependent temporal structure of syllables is dominated by independent variability among constituent notes. Furthermore, for a subset of notes, we were able to reliably measure temporal variability within short 10 ms slices of the song. Here, we find that identity-dependent temporal structure is dominated by independent variability among constituent 10 ms slices. Overall, we find timing variability on two widely divergent timescales: (1) slow modulations that result in song-to-song changes in tempo, and (2) deviations at short timescales (as fast as 5–10 ms) that are reliably repeated across motifs (every 500–1000 ms). These patterns provide the first behavioral evidence for a fine-grained motor code on a timescale comparable to that found in forebrain premotor nuclei.
Materials and Methods
Analysis was based on the songs from nine adult males >400 d after hatch. Birds were recorded while serving as tutors for juvenile birds as part of other developmental studies. All care and housing was approved by the Institutional Animal Care and Use Committee at the University of Maryland, College Park. All analyses were performed in Matlab (Mathworks, Natick, MA), and all template matching and dynamic time-warping (DTW) algorithms were written as C-MEX routines.
Song collection.
During recordings, birds were housed individually in cages (∼18 × 36 × 31 cm). Recordings were made from sound-isolation chambers (Industrial Acoustics, Bronx, NY), which contained two cages separated by 18 cm and two directional microphones (Pro 45; Audio-Technica, Stow, OH). Signals were digitized at 24,414.1 Hz, and ongoing data were selected using a circular buffer and a sliding-window amplitude algorithm. “Sound clips” separated by <200 ms were included in the same “recording,” and clip onset times were indicated by filling the gaps between clips with zeros.
For each bird, we gathered an initial random sample of 1000 recordings that were >2 s long and had maximum power from the side on which the target bird was stationed. Recordings were analyzed using the log-amplitude of the fast Fourier transform (FFT) with a 256-point (10.49 ms) window moved forward in 128-point steps. Frequency bins outside the 1.7–7.3 kHz range were excluded from all subsequent analyses because song structure is less reliable at the highest and lowest frequencies. We then used an automated template-matching algorithm (detailed below) to select out recordings that contained repeated sequences of the most commonly produced motif and were relatively free of extraneous sound such as interfering vocalization from the other bird in the sound chamber.
A median of 633 (range, 411–896) recordings per bird had a template sequence. If a sequence contained an interval between adjacent syllable onsets that deviated from the mean by more than ∼30 ms, the entire song was discarded under the assumption that the match was erroneous (median, 22; range, 6–97 songs per bird omitted for this reason). The vast majority of these deviations occurred when an introductory note was incorrectly identified as the first syllable in the song.
Template matching.
Each recording was composed of a series of clips, periods of sound separated by at least 10 ms of silence. The sound in these clips was matched to syllables in the bird's song (clips could also result from cage noise, production of non-song vocalizations or calls, and sounds produced by the juvenile bird in the same recording chamber). To do this, syllable templates were formed by aligning and averaging four to five manually chosen clips corresponding to each syllable; exemplars were aligned using the lag times corresponding to peaks in a standard cross-correlation.
These templates were then matched against each clip with a novel sliding algorithm: for each template and each time point (t) in the clip, a match score (c) was computed as the reciprocal of the mean-squared difference between template and song log-amplitudes at each time-frequency point:
 |
where s is the song spectrogram, s′ is the template spectrogram, n is the number of time bins in the template, m is the number of frequency bins, i indexes time, and j indexes frequency.
Candidate syllable matches were computed as peaks in the score vector c over a fixed threshold of 0.3 (manually chosen based on visual inspection). Based on the alignment giving the peak match, a clip was determined to potentially constitute a syllable if the onset and offset for the clip and template were matched to within 20 ms. If a clip had multiple syllable matches, the match with the highest peak value was chosen.
For each bird, the template song was based on the most common syllable sequence falling within the first ∼2 s of that bird's song (this reflects a drop-off in available song recordings that are longer than 2 s). If the syllable-matching algorithm found a sequence of syllables matched to this template song, each clip corresponding to a syllable match was selected out for further analysis.
Song-timing calculations.
Timing variability was then analyzed with a more fine-grained algorithm; each syllable in the song sequence was independently analyzed in this part of the analysis. Analysis can be divided into the following steps. First, all identified clips from song sequences were reprocessed using the log-amplitude FFT with a 128-point window slid forward in 4-point steps, yielding 0.16 ms time bins. Second, the resulting spectrograms were smoothed in time with a 64-point Gaussian window that had a 25.6 (∼5 ms) SD. Third, time-derivative spectrograms (TDSs; calculated as differences in log-amplitude in time-adjacent bins) were computed and used in the rest of the analysis; the TDS has proved to yield more reliable data on timing than the amplitude spectrogram. Fourth, syllable templates were recomputed by averaging syllable TDSs across songs, aligning each TDS to this mean, re-averaging aligned TDSs, and repeating this process twice. Fifth, each TDS was then mapped to its template using a DTW algorithm (Anderson et al., 1996; Glaze and Troyer, 2006) (see Appendix). If the algorithm failed to map a syllable onset or offset, the entire song was omitted (median, 2; range, 0–176 songs per bird). One bird had a large number (176) of songs omitted because the first syllable of each motif had variable and noisy onsets. A final sample of 411–877 sequences per bird resulted from the process described above.
Note boundaries were manually determined based on large and sudden changes in spectral properties within syllable templates (see Fig. 1A,B). Note lengths were then determined as the interval between points mapped via DTW to corresponding boundary times in the template.
Figure 1.

Song hierarchy and timing models. A, Template spectrogram from bird 16 (smoothed and averaged; see Materials and Methods) (first 2 motifs only), restricted to 1.7–7.4 kHz where spectral cues are most reliable. Songs are segmented at three levels of organization: songs are divided into motifs; motifs are divided into syllables (lowercase labels); and syllables are divided into notes (numeric labels; vertical lines indicate segmentation). B, Template spectrogram (left) and TDS (right) of the last syllable in the motif. C, D, Schematic covariance matrices. Gray squares represent notes. Covariances are represented as either strong covariance (black square) or no/weak covariance (white square). Pairwise covariance between two syllables (syl) is equal to the sum of all pairwise covariances among constituent notes. In C, note timing variability is grouped by syllables, so that notes from the same syllable are strongly correlated. In D, there is no grouping by syllable, and syllable length deviations stem from the accumulated deviations of individual notes that are correlated across motifs.
Timing analysis.
The first part of our analysis concerned the measurement of two latent factors we hypothesized to explain song-to-song variability in note lengths: a “note-specific” factor that makes the same note especially related to itself across motifs and a “syllable-specific” factor that makes different notes in the same syllable especially related. A linear regression of each note length with total sequence length was used to extract two significant components of song-to-song variability: (1) the normalized regression coefficient, “elasticity,” which represents the ability to stretch and compress with global tempo changes; and (2) the residuals from the regression, which represent length components independent of global tempo (Glaze and Troyer, 2006).
We looked for note-specific and syllable-specific factors by examining pairwise differences among elasticity coefficients and pairwise Pearson's correlation coefficients among residuals. Here we describe calculations for correlation coefficients; calculations for elasticity coefficients were analogous. We compared distributions of correlation coefficients between renditions of the same note produced in different motifs (“same-id”), between different notes in the same syllable across motifs (“same-syl”), and between different notes in different syllables across motifs (“diff-syl”). Because the residual lengths of a given syllable are related across all motifs in a song (Glaze and Troyer, 2006), pairwise measurements from different motif pairings were not independent (e.g., same-id measurements between the same note in motifs 1 and 2 and in motifs 3 and 4). This means that distributions containing all pairwise correlations have repeated measures that invalidate statistical tests. Therefore, we calculated three measures for each unique note from the first motif: mean correlation with the same note in all subsequent motifs, mean correlation with different notes in the same syllable in subsequent motifs, and mean correlation with notes in different syllables across subsequent motifs. We then tested whether the distribution of pairwise differences per note were different from zero. We excluded syllables with only one note to have a same-syl measurement for each note. Across birds, the sample included 122 notes (11–19 per bird), and of these, 109 (10–17 per bird) were in syllables that included more than one note.
The second part of our analysis involved an analogous set of questions on a finer timescale. Specifically, we examined whether two ∼10 ms “slices” of a note were any more related to each other than they were to other 10 ms slices in other notes and syllables. Here, we focused the analysis on “amplitude-modulated” (AM) notes that have an even distribution of power across frequencies at any given time point but fast changes in power across time (see Fig. 3C). This type of note lends itself well to an analysis of temporal stretching and compressing on the 5–10 ms timescale. Three birds had at least one unique AM note, and one bird had two in the same motif, yielding a total of four unique AM notes across birds.
Figure 3.

Timing on a fine scale. A, B, Schematic covariance matrices for two notes in the same syllable produced in two different motifs. As in Figure 1, covariances are represented as either strong covariance (black square) or no/weak covariance (white square). In A, notes are encoded as cohesive units, so the covariance between the same note across motifs is shared by all portions within the note. In B, notes are not encoded cohesively, and the covariance between same-id notes reflects the accumulation of independent covariances on a finer timescale. C, Top, The mean spectrograms for two AM notes produced by bird 10. Bottom, Corresponding spectral time derivatives used to divide notes into ∼10 ms slices of song.
We divided each AM note into slices defined as peak-to-peak intervals in the spectral time derivative (see Fig. 3C). This yielded a total of 15 unique AM slices, 3–4 slices per note. We then performed the same linear regression and pairwise statistics for each AM slice as we did for notes. Most of this analysis compared “same-slice” and “same-note” relationships because only one bird had multiple AM notes in the same motif.
Results
We analyzed subsyllabic temporal structure in zebra finch song from nine adult males that were tutoring juveniles in a larger development study. Adult song acoustics are organized hierarchically (Fig. 1A): a bout of song generally consists of several motifs, defined as stereotyped sequences of syllables. Syllables, distinct vocalizations separated by gaps of silence, can in turn be divided into notes, segments with distinct acoustic structure. Adults tend to produce a variable number of motifs within a single song bout. For the purposes of this study, we gathered from each song recording a manually defined syllable “sequence,” a fixed number of back-to-back motifs (range of two to four per bird). Across birds, the sample included 41 distinct syllables and 122 distinct notes within motifs. The final sample included 411–877 sequences per bird, for a total of 5745 sequences; 69,434 syllables; and 205,146 notes across motifs and recordings.
We had previously found tempo changes that are shared by all song segments across the sequence and two measures of syllable length from a linear regression with sequence length that distinguished syllables from each other (Glaze and Troyer, 2006): residual length correlations that remain after factoring out tempo and elasticity coefficients, the normalized regression coefficient that measures the ability to stretch and compress proportionally with sequence length. That analysis indicated that syllables could be distinguished from each other in each of these measures: the residual length of a given syllable is more correlated with the same syllable in other motifs, and elasticity coefficients among the same syllables produced across a sequence are significantly more similar to each other than they are to the coefficients of other syllables. For simplicity, we refer to these two patterns together as “identity dependence.”
Here, we extend our methods to probe the timescale of identity dependence by analyzing temporal variations within syllables. There are two basic types of subsyllabic organization that one may expect to explain identity-dependent patterns. First, if the syllable is a cohesive unit of behavior, subsyllabic segments within that syllable should share the properties of the syllable. In this “grouped” scenario, two subsyllabic intervals in the same syllable will have similar elasticity coefficients and a stronger correlation than two intervals coming from different syllables (Fig. 1C). Alternatively, the syllable might simply be the concatenation of independent components of the motor code, the efferents of which converge on a continuous representation of the syllable at the periphery. In this “independent” scenario, the elasticity coefficients and the length deviations for two intervals in the same syllable will be no more related than for two intervals coming from different syllables (Fig. 1D).
All statistics were based on notes from the first motif, whereas correlations and elasticity comparisons were made with notes in subsequent motifs (see Materials and Methods). Unless indicated otherwise, all values reported below include SEs (mean ± SE). However, because many of the distributions showed significant skew, statistical significance was assessed using the Wilcoxon signed-rank (WSR) test for pairwise comparisons.
Note-based analysis
To distinguish the grouped and independent scenarios, we first segmented syllables into notes based on sudden changes in spectral profile (Fig. 1A,B). Across birds, 70% of the syllables in our sample had more than one note (range of one to nine). Across all notes, the mean note length was 36.40 ± 18.62 ms, whereas the mean SD was 1.70 ± 0.70 ms [coefficient of variation (SD/mean), 5.58 ± 3.88%]; after factoring out sequence length in the regression, residual SD was 1.61 ± 0.88 ms (all ranges ± SD).
For each note of the first motif, we made three measurements with notes in subsequent motifs: average correlation with (1) notes of the same identity (same-id notes); (2) different notes in the same syllable (same-syl notes); and (3) notes in different syllables (diff-syl notes). To test the grouped and independent scenarios, we then asked whether a given note was more correlated with same-id notes than it was with same-syl and diff-syl notes and whether average correlation with same-syl notes was stronger than average correlation with diff-syl notes. We based all statistics on pairwise comparisons of measures for each note (109 notes in multinote syllables).
A representative correlation matrix from a single bird is shown in Figure 2G; the prominent off-diagonal structure shows that correlations across motifs are dominated by notes of the same identity. Across all notes, the mean same-id correlation was 0.18 ± 0.01 (range [0.11,0.31] averaged by bird); the mean diff-id, same-syl correlation was −0.02 ± 0.01 (range [−0.05,0.01] by bird); and the mean diff-syl correlation was 0.01 ± 0.003 (range [−0.01,0.03] by bird). Same-id correlations were significantly stronger than same-syl and diff-syl correlations (p < 0.0001, WSR) (Fig. 2A,C,E). Unexpectedly, same-syl correlations were actually slightly more negative than diff-syl (p < 0.0001, WSR).
Figure 2.
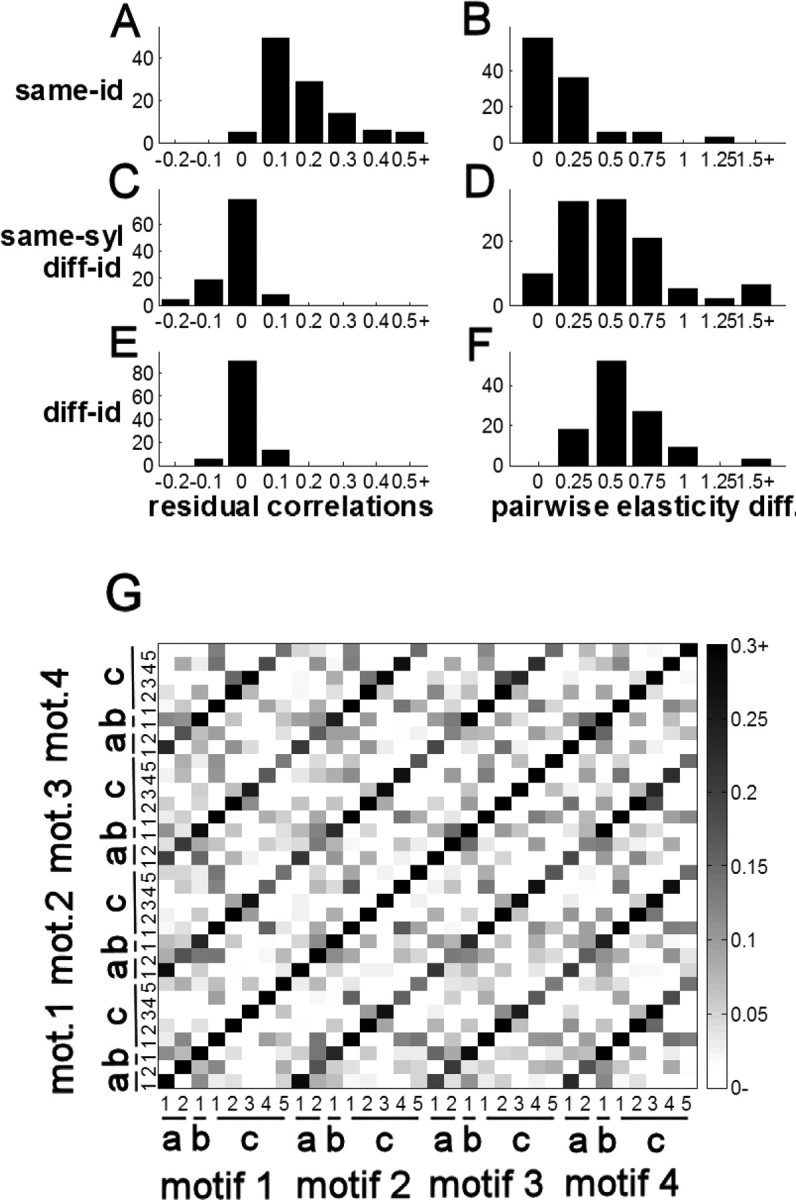
Timing is note based. A, C, E, Correlation coefficients among notes after factoring out sequence length, between notes of the same identity across motifs (A), notes of different identity in the same syllable (C), and notes from different syllables (E). B, D, F, Pairwise absolute elasticity differences (see Materials and Methods for definition) organized as in A, C, and E. G, Correlation matrix from bird 16. mot., Motif.
We then asked why notes are significantly more anticorrelated with those in the same syllable than with those in other syllables. Although our analysis excluded directly adjacent note pairs, the same-syl group did include notes with adjacent motif positions (e.g., the correlation between note a1 in the first motif and note a2 in the second motif). Qualitative analysis suggested that these “motif-adjacent” pairs accounted for the difference, which the statistical tests supported: focusing on syllables with more than two notes (n = 80 unique notes, 5–13 per bird), nonadjacent notes in the same syllable were just as correlated as notes from different syllables (p = 0.96, WSR; nonadjacent correlation, 0.01 ± 0.01), whereas notes were significantly more anticorrelated with motif-adjacent notes than they were with nonadjacent notes in the same syllable (p < 0.0001, WSR; motif-adjacent correlation, −0.06 ± 0.01). In these data, it is impossible to discern whether the motif-adjacent anticorrelations reflect a real tradeoff in variability or correlated measurement error (see Discussion).
We also measured absolute differences among elasticity coefficients and found patterns that were qualitatively similar to the correlation structure (Fig. 2B,D,F). Overall, the mean same-id difference was 0.20 ± 0.02, the mean same-syl difference was 0.60 ± 0.06, and the mean diff-syl difference was 0.64 ± 0.05. Same-id coefficients were significantly closer than same-syl and diff-syl coefficients (p < 0.0001). Elasticity coefficients were also slightly closer among different notes in the same syllable than they were among notes from different syllables (WSR, p = 0.012). However, the effect was inconsistent, with mean difference showing the opposite trend in four of nine birds (i.e., mean same-syl differences greater than diff-syl differences).
In the aggregate, the timing data indicate that the temporal relationship among syllables of the same identity is dominated by note lengths. Although syllables of the same identity undergo unique, correlated changes in length across motifs, this reflects an accumulation of independent deviations in note lengths. Furthermore, although syllables of the same identity have similar elasticity coefficients, this similarity is also dominated by similarities on the note level.
Spectral type does not explain note-based data
Previous studies have classified notes on the basis of more abstract acoustic properties, or spectral “type.” It is possible that note type may explain some (or all) of the identity dependence as well if these correlated timing deviations are tied to mechanisms that directly represent song acoustics. We focused our analysis on the subset of notes that allow for clear classification, using previously defined categories (Williams et al., 1989; Williams and Staples, 1992; Sturdy et al., 1999): “harmonic stacks,” which have a clear fundamental frequency in the 500–1000 Hz range that remains fairly constant throughout the note; “high notes,” which exhibit peak power in the 3–7 kHz range; “sweeps,” which show a continuously decreasing fundamental frequency; “short noisy sweeps,” which typically constitute introductory-like notes; “noisy, low-amplitude” notes; and AM notes, which show fast, regular changes in amplitude across frequency bins. We found that the length distribution for harmonic stacks is bimodal with a relatively clean break at 60 ms. Using this threshold, we divided this category into “short stacks” and “long stacks.” In total, 64% of notes were classified as one of these types, with 4–31 unique notes in each category. Of these, 47 notes from seven birds (3–14 per bird) had at least one other note of the same type in that song.
There were differences among the overall distributions of elasticity and residual variability for different note types (see supplemental material, available at www.jneurosci.org). However, when we examined relationships between note pairs, the same-type relationships closely resembled the same-syl and diff-syl data and not the same-id data: correlations were not significantly different between same-type and diff-type pairs (p = 0.16, WSR; means, 0.01 ± 0.01 vs −0.01 ± 0.01), nor were elasticity similarities (p = 0.63, WSR; means, 0.83 ± 0.15 vs 0.68 ± 0.11). These data suggest that the identity-dependent temporal structure is unrelated to acoustic type.
Fine timescale for identity dependence
We have used a note-based analysis to argue that identity dependence among syllables is dominated by independent patterns at subsyllabic timescales. In fact, identity dependence among notes could stem from patterns on an even finer scale, such as the accumulation of variability in the 5–10 ms bursting patterns found in premotor nucleus HVC (Hahnloser et al., 2002; Fee et al., 2004). In this case, we should find independent timing variability in any given 5–10 ms slice of song. If notes are not distinguished as cohesive units in the motor code, then two different slices from the same note should, in fact, be as unrelated to each other as they are to slices from different notes (Fig. 3B). On the other hand, if the motor code does distinguish notes, length variations in different slices from the same note should be especially related to each other as well (Fig. 3A).
However, there is a limit to testing these patterns using our methods. To measure song-to-song timing variability, the DTW algorithm depends on regular changes in the spectral profile of a syllable (see Materials and Methods and Appendix). The precise tracking of timing in 5–10 ms slices is thus impossible within notes that are temporally homogeneous (e.g., harmonic stacks) and unreliable within notes that have a strong spectral component of song-to-song variability. Instead, the current analysis depends on spectrotemporal features that can be reliably identified song by song on a fine timescale (cf. Chi and Margoliash, 2001).
Thus, we focused our analysis on AM notes (defined above), which allowed for the accurate measurement of ∼10 ms temporal slices corresponding to pulses in song amplitude (Fig. 3C). We divided these notes into intervals defined peak to peak in the spectral time derivative (mean length, 9.37 ± 0.38 ms). Across the sample, the analysis included four unique notes from three birds, with 3–4 slices per note and a total of 15 slices.
Variance on the 10 ms scale
We found that a 10 ms slice was indeed more correlated with itself across motifs than it was with other slices of the same note (Fig. 4A,C) (p < 0.001, WSR; mean same-id correlation, 0.10 ± 0.01; mean same-note correlation, 0.004 ± 0.01). The mean difference held for all four notes individually. We did not find significant anticorrelation among motif-adjacent slices as we had among notes (p = 0.626, WSR; mean motif-adjacent and nonadjacent correlations were −0.001 ± 0.01 and 0.01 ± 0.01, respectively).
Figure 4.

Temporally precise deviations in AM notes. A, C, Correlation coefficients among 10 ms AM slices after factoring out sequence length, either between slices at the same position across motifs (A) or between slices from different motif positions in the same note (C). B, D, Distributions of pairwise absolute elasticity differences (diff.), organized as in A and C. E, Correlation matrix for the same AM note produced by bird 10, repeated across three motifs. Each value in the matrix represents the correlation between two 5 ms stretches of song centered at the times corresponding to the vertical and horizontal coordinate of that location.
The elasticity coefficients showed the same pattern as correlations: slice elasticity was significantly closer to the same slice across motifs than it was to the elasticity of other slices in the same note (p < 0.005, WSR; mean same-id elasticity difference, 0.20 ± 0.04; mean same-note elasticity difference, 0.56 ± 0.06).
Are different 10 ms slices in the same AM note any more related than those from different AM notes? Two observations suggest not. First, bird 10 produced two different AM notes (Fig. 3C), and here we found no effect of note identity (p = 0.47, WSR, among both correlation and elasticity distributions). Second, the average relationship between two different slices in the same note is similar to the relationship between two different notes in different syllables (among correlation coefficients, 0.004 ± 0.01 vs 0.01 ± 0.003; in elasticity similarity, 0.56 ± 0.06 vs 0.64 ± 0.05).
Although peaks in the time derivative provided a convenient, systematic way to segment AM notes, there is no reason that this segmentation should necessarily correspond to a temporal segmentation in the underlying motor code. To look for structure in the underlying representation, we performed a continuous correlation analysis, calculating length correlations between 5 ms intervals centered on any two points within each AM note. Across notes, we found that the correlation depended most strongly on the distance between the two intervals rather than any particular alignment with the discrete pulses of acoustic output (Fig. 4E). These qualitative results confirm a 5–10 ms timescale for the representation of song but do not indicate that the amplitude pulses directly correspond to elements of the underlying motor representation.
Effect sizes
Correlation coefficients yield a normalized measure of the strength of identity dependence across motifs. We also estimated this strength in units of real time. Because this analysis did not require pairwise statistical tests, we include all 122 notes in these estimates.
To isolate identity dependence, we first regressed each note with (1) sequence length, (2) the sum of all notes (except same-id notes), and, to factor out jitter that is correlated across motifs, (3) adjacent intervals on either side of that note (previous and subsequent gaps included for the first and last notes of syllables). Among the residuals from this multiple regression, we estimate mean pairwise covariance among notes of the same identity at 0.18 ± 0.07 ms2 (range [0.006,0.59] ms2 by bird). Taking the square root of positive covariances (111 of 122), this comes out to an estimated 0.36 ± 0.03 ms of note length deviation that is correlated across motifs and independent of global factors and jitter.
We performed the same analysis with ∼10 ms AM slices, except we did not factor out adjacent intervals because we had found no significant anticorrelation as we had among notes. Here, we find a mean 0.04 ± 0.02 ms2 of variance that is shared between the same slice of song across motifs. Again, taking the square root of covariances (all 15 >0), we derive an average 0.18 ± 0.03 ms of deviation in the length of a 10 ms AM slice that is repeated across motifs.
Under the hypothesis that identity dependence is simply the accumulation of similarity between fine timescale components, the covariance between intervals should be proportional to interval length. For all notes excluding AM notes, the average covariance per millisecond was 0.005 ± 0.001 ms2/ms (for positive covariances, SD/ms = 1.24 ± 0.07%). Among AM notes and slices, where we know that covariance accumulated independently on the 10 ms timescale, the average covariance per millisecond was 0.004 ± 0.001 ms2/ms (SD/ms = 0.92 ± 0.11%). The average covariance per millisecond among AM notes is similar to what we find in other notes (0.004 ± 0.001 vs 0.005 ± 0.001); thus, the data as a whole are consistent with the proposal that identity dependence is dominated by an independent accumulation of covariance on a fine timescale.
Discussion
We have probed subsyllabic timing in zebra finch song to test the hypothesis that song syllables constitute cohesive units within the underlying motor representation for song. We examined two measures of song-to-song variability that we had previously found to be similar for syllables of the same identity repeated across motifs (Glaze and Troyer, 2006): the ability to proportionally stretch and compress with tempo change (elasticity) and length correlations that remain after factoring out global tempo. In each of these measures, we find that identity-dependent similarity is dominated by smaller segments: length deviations among notes in the same syllable are no more correlated with each other than they are with notes in other syllables, and note elasticity is poorly predicted by the particular syllable in which it is produced. We then applied the same analysis to a subset of notes that allow accurate timing measurements of 5–10 ms subnote slices. We found analogous patterns on this finer scale: timing deviations in a given slice are correlated with the same slice repeated in other motifs, yet are independent of other slices in the same note.
These results suggest that the song motor code has remarkably high fidelity; specifically, song segments as short as 5–10 ms are represented independently. The data also expose remarkably divergent timescales–temporal deviations in 5–10 ms segments correlated over seconds. We hypothesize that the slow timescales in our data stem from modulatory factors that are spread widely through the song system and vary from song to song, whereas the fast temporal deviations are a direct behavioral expression of sparse and precise bursting activity that has been recorded in the premotor nuclei HVC and RA (robust nucleus of arcopallium) (Yu and Margoliash, 1996; Hahnloser et al., 2002; Fee et al., 2004; Leonardo and Fee, 2005).
Fast and slow timescales
One of the most remarkable aspects of our data are the contrast of fast and slow timescales. This mixture follows naturally from the hypothesis that sparse, fine-grained bursting in HVC reflects the activity of a synfire chain, in which neurons that are active during consecutive 5–10 ms slices of the song motif are linked by strong synaptic connections (Fee et al., 2004; Abeles, 1991). Modulatory changes that increase the excitability of neurons along this chain will lead to faster propagation of activity and hence a faster song tempo (Arnoldi and Brauer, 1996). If different neural groups undergo somewhat different changes in excitability, tempo changes will be spread unequally over the different links in the chain. Because repeated motifs are generated by repeated propagation along the same chain, these link-specific temporal deviations will persist over the time course of the slow modulation.
This explanation applies most cleanly in HVC, where individual projection neurons burst exactly once during each song motif, ensuring the independence of different links in the chain. However, RA bursting patterns are also repeated across motifs (Yu and Margoliash, 1996; Chi and Margoliash, 2001), with essentially uncorrelated populations of neurons active during any two time points within the same motif (Leonardo and Fee, 2005). Therefore, slow modulation in RA could also contribute to temporally specific tempo changes that are repeated every 500–1000 ms.
Syllable-based representations
While our data provide evidence for a fine-grained motor code, other experiments suggest that song has a syllable-based representation. The respiratory pattern is highly stereotyped and involves expirations that accompany syllables and short inhalations that accompany gaps (Wild et al., 1998; Franz and Goller, 2002). Respiratory nuclei in the brainstem are part of coordinated recurrent circuits that run through HVC and RA and mediate interhemispheric coordination of HVC activity that is particularly pronounced at syllable onsets (Schmidt, 2003; Ashmore et al., 2005). Furthermore, birds interrupted by bright flashes of light or brief pulses of current tend to stop their songs at syllable (occasionally note) boundaries (Cynx, 1990; Vu et al., 1994; Franz and Goller, 2002), and in vitro data indicate that brief pulses delivered to HVC slices yield rhythmic bursting, the timing of which roughly matches the rate of syllable production (Solis and Perkel, 2005). Finally, syllables and gaps are distinguished from each other along two independent measures of timing: syllables are less elastic than gaps, and after factoring out tempo, syllable–syllable and gap–gap length correlations are significantly stronger than syllable–gap correlations (Glaze and Troyer, 2006).
In reconciling the fine-grained and syllable-based views of the motor code for song, it is important to separate the notion that syllables form cohesive units from a simple distinction between portions of the song with and without vocal output. This distinction may reflect systematic differences between the bursting neurons that subserve vocalization and those that are active during silent gaps. Such differences in network structure could include a number of different factors, such as patterns of connectivity, the strength of synaptic connections, or the number of neurons active at a given point on the song. However, such differences need not entail syllable-based (or note-based) units, because neurons bursting at different times in the same syllable may be no more related than neurons bursting within different syllables. To establish a true syllable-based hierarchy, any experimental manipulation must lead to measurable changes that are shared across neurons coding for the same syllable but are distinct from the changes in neurons coding for different syllables.
Peripheral versus central representations
Our leading hypothesis is that fine-grained deviations are driven by sparse, precise bursting in the forebrain nuclei HVC and RA. However, it is possible that these deviations, in fact, stem from physiological mechanisms peripheral to the central pattern generator, or from inaccuracies in measurements of song timing. Two results make this unlikely. First, if similar peripheral mechanisms generate similar acoustic features, one would expect song acoustics and temporal variability to be related. We detected no such relationship between timing variance and note type. Furthermore, different 10 ms pulses within AM notes have very similar acoustics, yet have independent length variation. Second, any timing deviation that originates downstream from the song pattern generator must be offset by compensating deviations, provided that the pattern generator continues to pace activity independently of the source of the deviation (Fig. 5). Thus, deviations that stem from either peripheral mechanisms or the measurement algorithm will induce patterns of negative correlation among neighboring song segments. Again, we detected no such correlation between slices within AM notes.
Figure 5.

Schematic representing two hypothetical sources of length deviations. The factors determining measured timing values can be conceptually separated into those that depend on the central pattern generator for song and those determined by influences downstream of the pattern generator. The timing of song is indicated by vertical dashes, according to the coding within the pattern generator (top) or as measured in the song output (bottom). Dashed arrows indicate temporal deviations. A, Deviations originating downstream of the pattern generator. Because centrally coded timing continues unaffected, the deviations are eventually offset by equal and opposite deviations. This leads to patterns of negative covariance in measured timing. B, Timing deviations caused by the pattern generator. Here, the relative timing of subsequent output activity remains unaffected, leading to variance that can be independent of other timing deviations. Overall, independent length deviations in the behavior must reflect timing variability in the song pattern generator.
We did find negative correlations between a given note and adjacent segments in subsequent motifs. This could result from spectral deviations that are correlated across motifs. Because the DTW algorithm warps time to achieve maximal spectral matching, these spectral deviations would be converted to correlated temporal distortions. However, the note length variance explained by this anticorrelation is nearly nine times smaller than the variance explained by the same-id correlations, again suggesting that the central pattern generator dominates timing variance on the note level. Indeed, the data suggest that linear warping techniques used to align spike timing with song acoustics (Leonardo, 2004) may be improved if performed note by note rather than syllable by syllable.
Implications for perception and learning
Our results demonstrate that the vocal production system of birds operates with sufficient fidelity to repeat submillisecond temporal deviations in specific portions of the song. Tests of auditory discrimination have shown that zebra finches can perceive temporal changes on the millisecond scale (Dooling et al., 2002; Lohr et al., 2006), whereas HVC neurons in anesthetized birds shows similar auditory sensitivity (Theunissen and Doupe, 1998). From our data, we estimate that 0.5 ms2 of identity-specific variance would accumulate during a 100 ms interval of song. This suggests that the temporal deviations specific to individual song syllables are near or above the detection threshold for zebra finches.
The timescales in these data may also have implications for song learning. Others have suggested that sparse representations may facilitate reinforcement-based learning strategies (Fiete et al., 2004). However, feedback delays are expected to be ∼40–100 ms, complicating the use of matching signals to adjust temporally precise motor programs (Troyer and Doupe, 2000). Because temporal deviations are repeated over multiple song motifs, evaluative signals from earlier motifs may be used to modulate neural plasticity triggered by premotor spike patterns that are repeated in later motifs. Such a strategy may be useful in wide array of sensorimotor learning tasks in which similar delay problems exist.
Conclusion
We have analyzed temporal variability in birdsong acoustics to reveal structure in the motor code on multiple timescales. The fine-scale data suggest a direct link between acoustics and premotor bursting patterns. The long timescale of correlations is suggestive of similar patterns found in behavioral studies on humans (Gilden, 2001). In general, timing variability provides a common language for synthesizing results from behavioral and electrophysiological studies, and also provides strong constraints for computational models that attempt to connect the two levels of analysis. Furthermore, the large samples of song acoustics that can be readily collected yield statistical power that is difficult to achieve in physiological investigations. This approach to song analysis may thus reveal subtle but important changes in song representation during different behavioral contexts and over the course of song development (Hessler and Doupe, 1999; Brainard and Doupe, 2001; Tchernichovski et al., 2001; Deregnaucourt et al., 2005; Ölveczky et al., 2005; Cooper and Goller, 2006; Kao and Brainard, 2006; Crandall et al., 2007).
Appendix
Following is the modified DTW we used to map syllable timepoints to mean spectrograms [for a general introduction to DTW and basic terminology, see Rabiner and Juang (1993)]. The algorithm was similar to Glaze and Troyer (2006), with several important modifications.
First, the similarity metric between each syllable and the mean was based on the time derivative of full spectrograms rather than summed amplitude envelopes. Let the matrix m denote the mean (template) TDS and the matrix s denote the TDS of a particular song syllable. (A TDS is computed by subtracting the frequency vectors obtained from adjacent time bins in the raw spectrogram.) The match d(i, j) between time bin i of a particular syllable and time bin j of the template was equal to the overlap of the corresponding time-derivative vectors, d(i, j) = Σk sikmjk, where frequency is indexed by k. With this modification, the algorithm allowed us to track changes in the spectral profile of a syllable that are not always evident in the amplitude envelope.
The local path constraints and weighting were also different from the previous algorithm. At each point in the algorithm, three possible paths were available: P1 → (2, 1), P2 → (1, 1), or P3 → (1, 2). The cumulative product matrix D was computed as follows:
 |
This differs from the previous version in several important ways. First, the scheme allows the slope of local length changes to fall between 1/2 and 2, whereas the older version had more restrictive limits of 2/3 and 3/2. Second, unlike the previous algorithm, d(i, j) was included in all three path calculations to determine D(i, j), and its value was divided equally with d(i − 1, j) in path P1 and d(i, j − 1) in path P3. This allows for the fact that, geometrically, the path joining (0, 0) and (2, 1) (i.e., P1) is actually equidistant from points (1, 0) and (1, 1); similarly, P3 is equidistant from (0, 1) and (1, 1). Finally, it can be shown that with this weighting scheme, if d(i, j) has the same match strength for all time bins i and j, then the algorithm accumulates the same amount between any two points for all choices of path, so there is no bias against any of the paths; in the previous version, there was a slight bias against a slope of 1.
Footnotes
This work was partially supported by National Institutes of Health Grant 5R21MH 066047-02, a Sloan Research Fellowship (T.W.T.), and a Center for the Comparative Biology and Evolution of Hearing fellowship (C.M.G.).
References
- Abeles M. Corticonics. Cambridge, UK: Cambridge UP; 1991. [Google Scholar]
- Anderson SE, Dave AS, Margoliash D. Template-based automatic recognition of birdsong syllables from continuous recordings. J Acoust Soc Am. 1996;100:1209–1219. doi: 10.1121/1.415968. [DOI] [PubMed] [Google Scholar]
- Arnoldi HM, Brauer W. Synchronization without oscillatory neurons. Biol Cybern. 1996;74:209–223. doi: 10.1007/BF00652222. [DOI] [PubMed] [Google Scholar]
- Ashmore RC, Wild JM, Schmidt MF. Brainstem and forebrain contributions to the generation of learned motor behaviors for song. J Neurosci. 2005;25:8543–8554. doi: 10.1523/JNEUROSCI.1668-05.2005. [DOI] [PMC free article] [PubMed] [Google Scholar]
- Brainard MS, Doupe AJ. Postlearning consolidation of birdsong: stabilizing effects of age and anterior forebrain lesions. J Neurosci. 2001;21:2501–2517. doi: 10.1523/JNEUROSCI.21-07-02501.2001. [DOI] [PMC free article] [PubMed] [Google Scholar]
- Chi Z, Margoliash D. Temporal precision and temporal drift in brain and behavior of zebra finch song. Neuron. 2001;32:899–910. doi: 10.1016/s0896-6273(01)00524-4. [DOI] [PubMed] [Google Scholar]
- Cooper BG, Goller F. Physiological insights into the social-context-dependent changes in the rhythm of the song motor program. J Neurophysiol. 2006;95:3798–3809. doi: 10.1152/jn.01123.2005. [DOI] [PubMed] [Google Scholar]
- Crandall SR, Aoki N, Nick TA. Developmental modulation of the temporal relationship between brain and behavior. J Neurophysiol. 2007;97:806–816. doi: 10.1152/jn.00907.2006. [DOI] [PMC free article] [PubMed] [Google Scholar]
- Cynx J. Experimental determination of a unit of song production in the zebra finch (Taeniopygia guttata) J Comp Psychol. 1990;104:3–10. doi: 10.1037/0735-7036.104.1.3. [DOI] [PubMed] [Google Scholar]
- Deregnaucourt S, Mitra PP, Feher O, Pytte C, Tchernichovski O. How sleep affects the developmental learning of bird song. Nature. 2005;433:710–716. doi: 10.1038/nature03275. [DOI] [PubMed] [Google Scholar]
- Dooling R, Leek M, Gleich O, Dent M. Auditory temporal resolution in birds: discrimination of harmonic complexes. J Acoust Soc Am. 2002;112:748–759. doi: 10.1121/1.1494447. [DOI] [PubMed] [Google Scholar]
- Fee MS, Kozhevnikov AA, Hahnloser RH. Neural mechanisms of vocal sequence generation in the songbird. Ann NY Acad Sci. 2004;1016:153–170. doi: 10.1196/annals.1298.022. [DOI] [PubMed] [Google Scholar]
- Fiete IR, Hahnloser RHR, Fee MS, Seung HS. Temporal sparseness of the premotor drive is important for rapid learning in a neural network model of birdsong. J Neurophysiol. 2004;92:2274–2282. doi: 10.1152/jn.01133.2003. [DOI] [PubMed] [Google Scholar]
- Franz M, Goller F. Respiratory units of motor production and song imitation in the zebra finch. J Neurobiol. 2002;51:129–141. doi: 10.1002/neu.10043. [DOI] [PubMed] [Google Scholar]
- Gilden D. Cognitive emissions of 1/f noise. Psychol Rev. 2001;108:33–56. doi: 10.1037/0033-295x.108.1.33. [DOI] [PubMed] [Google Scholar]
- Glaze CM, Troyer TW. Temporal structure in zebra finch song: implications for motor coding. J Neurosci. 2006;26:991–1005. doi: 10.1523/JNEUROSCI.3387-05.2006. [DOI] [PMC free article] [PubMed] [Google Scholar]
- Hahnloser RH, Kozhevnikov AA, Fee MS. An ultra-sparse code underlies the generation of neural sequences in a songbird. Nature. 2002;419:65–70. doi: 10.1038/nature00974. [DOI] [PubMed] [Google Scholar]
- Hessler NA, Doupe AJ. Social context modulates singing-related neural activity in the songbird forebrain. Nat Neurosci. 1999;2:209–211. doi: 10.1038/6306. [DOI] [PubMed] [Google Scholar]
- Hikosaka O, Nakamura K, Sakai K, Nakahara H. Central mechanisms of motor skill learning. Curr Opin Neurobiol. 2002;12:217–222. doi: 10.1016/s0959-4388(02)00307-0. [DOI] [PubMed] [Google Scholar]
- Kao MH, Brainard MS. Lesions of an avian basal ganglia circuit prevent context-dependent changes to song variability. J Neurophysiol. 2006;96:1441–1455. doi: 10.1152/jn.01138.2005. [DOI] [PubMed] [Google Scholar]
- Keele SW, Ivry R, Mayr U, Hazeltine E, Heuer H. The cognitive and neural architecture of sequence representation. Psychol Rev. 2003;110:316–339. doi: 10.1037/0033-295x.110.2.316. [DOI] [PubMed] [Google Scholar]
- Lashley K. The problem of serial order in behavior. In: Jeffress L, editor. Cerebral mechanisms in behavior. New York: Wiley; 1951. pp. 112–146. [Google Scholar]
- Leonardo A. Experimental test of the birdsong error-correction model. Proc Natl Acad Sci USA. 2004;101:16935–16940. doi: 10.1073/pnas.0407870101. [DOI] [PMC free article] [PubMed] [Google Scholar]
- Leonardo A, Fee MS. Ensemble coding of vocal control in birdsong. J Neurosci. 2005;25:652–661. doi: 10.1523/JNEUROSCI.3036-04.2005. [DOI] [PMC free article] [PubMed] [Google Scholar]
- Lohr B, Dooling R, Bartone S. The discrimination of temporal fine structure in call-like harmonic sounds by birds. J Comp Psychol. 2006;120:239–251. doi: 10.1037/0735-7036.120.3.239. [DOI] [PubMed] [Google Scholar]
- Miller GA, Galanter E, Pribram KH. Plans and the structure of behavior. New York: Holt and Company; 1960. The unit of analysis; pp. 21–39. [Google Scholar]
- Ölveczky BP, Andalman AS, Fee MS. Vocal experimentation in the juvenile songbird requires a basal ganglia circuit. PLoS Biol. 2005;3:902–909. doi: 10.1371/journal.pbio.0030153. [DOI] [PMC free article] [PubMed] [Google Scholar]
- Rabiner L, Juang B. Fundamentals of speech recognition, Prenctice Hall Signal Processing Series. Englewood Cliffs, NJ: Prentice-Hall; 1993. Time alignment and normalization; pp. 200–241. [Google Scholar]
- Rhodes BJ, Bullock D, Verwey WB, Averbeck BB, Page MP. Learning and production of movement sequences: behavioral, neurophysiological, and modeling perspectives. Hum Mov Sci. 2004;23:699–746. doi: 10.1016/j.humov.2004.10.008. [DOI] [PubMed] [Google Scholar]
- Schmidt MF. Pattern of interhemispheric synchronization in hvc during singing correlates with key transitions in the song pattern. J Neurophysiol. 2003;90:3931–3949. doi: 10.1152/jn.00003.2003. [DOI] [PubMed] [Google Scholar]
- Solis MM, Perkel DJ. Rhythmic activity in a forebrain vocal control nucleus in vitro. J Neurosci. 2005;25:2811–2822. doi: 10.1523/JNEUROSCI.5285-04.2005. [DOI] [PMC free article] [PubMed] [Google Scholar]
- Sturdy CB, Phillmore LS, Weisman RG. Note types, harmonic structure and note order in the songs of zebra finches (Taeniopygia guttata) song. J Comp Psychol. 1999;113:194–203. [Google Scholar]
- Tchernichovski O, Mitra PP, Lints T, Nottebohm F. Dynamics of the vocal imitation process: how a zebra finch learns its song. Science. 2001;291:2564–2569. doi: 10.1126/science.1058522. [DOI] [PubMed] [Google Scholar]
- Theunissen F, Doupe A. Temporal and spectral sensitivity of complex auditory neurons in the nucleus HVc of male zebra finches. J Neurosci. 1998;18:3786–3802. doi: 10.1523/JNEUROSCI.18-10-03786.1998. [DOI] [PMC free article] [PubMed] [Google Scholar]
- Troyer TW, Doupe AJ. An associational model of birdsong sensorimotor learning i. efference copy and the learning of song syllables. J Neurophysiol. 2000;84:1204–1223. doi: 10.1152/jn.2000.84.3.1204. [DOI] [PubMed] [Google Scholar]
- Vu ET, Mazurek ME, Kuo YC. Identification of a forebrain motor programming network for the learned song of zebra finches. J Neurosci. 1994;14:6924–6934. doi: 10.1523/JNEUROSCI.14-11-06924.1994. [DOI] [PMC free article] [PubMed] [Google Scholar]
- Wild JM, Goller F, Suthers RA. Inspiratory muscle activity during bird song. J Neurobiol. 1998;36:441–453. doi: 10.1002/(sici)1097-4695(19980905)36:3<441::aid-neu11>3.0.co;2-e. [DOI] [PubMed] [Google Scholar]
- Williams H. Birdsong and singing behavior. Ann NY Acad Sci. 2004;1016:1–30. doi: 10.1196/annals.1298.029. [DOI] [PubMed] [Google Scholar]
- Williams H, Staples K. Syllable chunking in zebra finch (Taeniopygia guttata) song. J Comp Psychol. 1992;106:278–286. doi: 10.1037/0735-7036.106.3.278. [DOI] [PubMed] [Google Scholar]
- Williams H, Cynx J, Nottebohm F. Timbre control in zebra finch (Taeniopygia guttata) song syllables. J Comp Psychol. 1989;103:366–380. doi: 10.1037/0735-7036.103.4.366. [DOI] [PubMed] [Google Scholar]
- Yu AC, Margoliash D. Temporal hierarchical control of singing in birds. Science. 1996;273:1871–1875. doi: 10.1126/science.273.5283.1871. [DOI] [PubMed] [Google Scholar]
- Zann R. The zebra finch: a synthesis of field and laboratory studies. New York: Oxford UP; 1996. [Google Scholar]