

Abstract
GABA, the main inhibitory neurotransmitter in the adult nervous system, evokes depolarizing membrane responses in immature neurons, which are crucial for the generation of early network activity. Although it is well accepted that depolarizing GABA actions are caused by an elevated intracellular Cl− concentration ([Cl−]i), the mechanisms of Cl− accumulation in immature neurons are still a matter of debate. Using patch-clamp, microfluorimetric, immunohistochemical, and molecular biological approaches, we studied the mechanism of Cl− uptake in Cajal-Retzius (CR) cells of immature [postnatal day 0 (P0) to P3] rat neocortex. Gramicidin-perforated patch-clamp and 6-methoxy-N-ethylquinolinium-microfluorimetric measurements revealed a steady-state [Cl−]i of ∼30 mm that was reduced to values close to passive distribution by bumetanide or Na+-free solutions, suggesting a participation of Na+-K+-2Cl− cotransport isoform 1 (NKCC1) in maintaining elevated [Cl−]i. Expression of NKCC1 was found in CR cells on the mRNA and protein levels. To determine the contribution of NKCC1 to [Cl−]i homeostasis in detail, Cl− uptake rates were analyzed after artificial [Cl−]i depletion. Active Cl− uptake was relatively slow (47.2 ± 5.0 μm/s) and was abolished by bumetanide or Na+-free solution. Accordingly, whole-cell patch-clamp recordings revealed a low Cl− conductance in CR cells. The low capacity of NKCC1-mediated Cl− uptake was sufficient to maintain excitatory GABAergic membrane responses, however, only at low stimulation frequencies. In summary, our results demonstrate that NKCC1 is abundant in CR cells of immature rat neocortex and that the slow Cl− uptake mediated by this transporter is sufficient to maintain high [Cl−]i required to render GABA responses excitatory.
Keywords: cortical development, GABA, Cajal–Retzius cell, NKCC1, chloride homeostasis, gramicidin-perforated patch clamp
Introduction
In contrast to the classical inhibitory action of GABA in adult nervous systems (for review, see Kaila, 1994), activation of GABAA receptors induces depolarizing membrane responses during early developmental stages (Ben-Ari et al., 1989; Luhmann and Prince, 1991; Owens et al., 1996; Mienville, 1998). Such depolarizing GABA actions are crucial for developmental processes like neurogenesis, neuronal migration, neuritic outgrowth, and maintenance of early network activity (Ben-Ari, 2002; Owens and Kriegstein, 2002; Represa and Ben Ari, 2005). Because depolarizing GABA actions are mainly caused by a Cl− efflux, the intracellular Cl− concentration ([Cl−]i) must be higher than established by passive distribution, implicating active Cl− uptake mechanisms in immature neurons (Kaila, 1994). Although it is well established that Cl− extrusion, which renders GABA responses hyperpolarizing, is mediated by the KCC2 isoform of the K+-Cl− cotransporter (Rivera et al., 1999; Hubner et al., 2001; Lee et al., 2005), the mechanisms underlying Cl− uptake in immature neurons are still a matter of debate. Na+-K+-2Cl− cotransporters (NKCC) (in the brain found in its isoform NKCC1) mediate active Cl− uptake and are thus appropriate candidates for neuronal Cl− accumulation (Delpire, 2000; Payne et al., 2003). Expression levels of NKCC1 have been reported to be high at birth and to decline subsequently (Plotkin et al., 1997; Yamada et al., 2004), whereas other studies reported NKCC1 upregulation or redistribution during early development of CNS (Clayton et al., 1998; Marty et al., 2002). Several studies found that Na+-depleted solutions and loop diuretics, which both reduce the activity of NKCC1 (Russell, 2000), decrease steady-state [Cl−]i in immature neurons, suggesting a role for NKCC1 in the maintenance of high [Cl−]i (Rohrbough and Spitzer, 1996; Kakazu et al., 1999; Ikeda et al., 2003; Yamada et al., 2004). However, other studies reported the absence of NKCC1 (Balakrishnan et al., 2003) and/or other effective Cl− uptake systems and suggested that high steady-state [Cl−]i is maintained by passive Cl− influx during depolarized phases (Titz et al., 2003).
Steady-state [Cl−]i depends on the equilibrium of outward and inward fluxes. Thus, an investigation of the steady-state [Cl−]i evaluates properties of several processes operating simultaneously but does not provide detailed insights into the contribution of single uptake mechanisms to [Cl−]i homeostasis. Therefore, we addressed the role of NKCC1 in [Cl−]i homeostasis by investigating the recovery after [Cl−]i depletion. We performed this study on Cajal-Retzius (CR) cells, transiently existing neurons located in the marginal zone of the developing cerebral cortex that play a central role in neuronal migration (Soriano and Del Rio, 2005). In contrast to other neurons, in which a developmental decline in [Cl−]i leads to a heterogeneous [Cl−]i distribution between cells (Shimizu-Okabe et al., 2002; Yamada et al., 2004), GABAergic membrane responses remain depolarizing in CR cells (Mienville, 1998), indicating that these neurons maintain a homogenous high [Cl−]i. Using gramicidin-perforated patch-clamp recordings, 6-methoxy-N-ethylquinolinium (MEQ)-microfluorimetry, immunohistochemical, and molecular biological approaches, we demonstrate that CR cells express NKCC1 and accomplish active Cl− accumulation by a bumetanide-sensitive, Na+-dependent Cl− uptake process capable to render GABAergic responses excitatory. If challenged, the Cl− uptake capacity is insufficient to maintain high [Cl−]i and excitatory GABA responses.
Materials and Methods
Electrophysiological recordings.
For electrophysiological experiments and immunohistochemistry, tangential slices of the neocortex were prepared from neonatal Wistar rats at postnatal day 0 (P0) to P3 as described previously (Kilb and Luhmann, 2000). Briefly, brains of postnatal rats anesthetized by deep hypothermia were isolated and immediately immersed in ice-cold (<4°C) artificial CSF (ACSF). The hemispheres were dissected, the pia was removed, and thin (<400 μm) tangential slices were prepared and incubated for at least 1 h in ACSF at 31°C before experiments. Animal handling was performed in accordance with European Union directive 86/609/EEC for the use of animals in research and approved by the local ethical committee. Electrophysiological setup and procedures were described in detail previously (Okabe et al., 2004). CR cells were identified by their morphological and electrophysiological properties (Luhmann et al., 2000). Only cells located next to the pial surface, displaying the characteristic morphological and electrophysiological properties, were included in the analysis. All experiments were performed at 30 ± 1°C. Whole-cell patch-clamp recordings were performed with a pipette solution containing the following (in mm): 1 CaCl2, 2 MgCl2, 11 EGTA, 10 HEPES, 2 Na2-ATP, 0.5 Na-GTP, and varying amounts of K-gluconate and KCl, depending on the required Cl− concentration (with [gluconate] + [Cl−] = 130 mm), pH adjusted to 7.4 with KOH and osmolarity to 306 mOsm with sucrose. Perforated-patch experiments were performed as described previously (Kyrozis and Reichling, 1995; Kilb et al., 2002) with a pipette solution containing the following (in mm): 1 CaCl2, 2 MgCl2, 11 EGTA, 10 HEPES, either 130 K-gluconate (low Cl−) or 130 KCl (high Cl−), pH adjusted to 7.4 with KOH and osmolarity to 306 mOsm with sucrose, and 10–15 μg/ml gramicidin was added from a stock solution (1–2 mg of gramicidin in 1 ml of DMSO) at the day of the experiment. Cell-attached recordings of NMDA currents were performed as described by Tyzio et al. (2003), with a pipette solution containing the following (in mm): 126 NaCl, 26 NaHCO3, 1.25 NaH2PO5, 2 CaCl2, 2.5 KCl, 5 HEPES, 5 EGTA, pH adjusted to 7.4 with NaOH. Directly before the experiment, 10 μm NMDA and 10 μm glycine were added to the pipette solution. For cell-attached recordings, an EPC-7 patch-clamp amplifier (List-Electronic, Darmstadt, Germany) was used, whereas whole-cell and perforated-patch recordings were performed with a discontinuous voltage-clamp/current-clamp amplifier (SEC05L; NPI Electronics, Tamm, Germany). The resting membrane potential (RMP) was measured directly after establishing the whole-cell configuration or before the start of the measurements in perforated-patch configuration. Potentials were corrected for liquid junction potentials (136 mm Cl−, 3 mV; 50 mm Cl−, 6 mV; 30 mm Cl−, 6 mV; 20 mm Cl−, 8 mV; 10 mm Cl−, 9 mV; 6 mm Cl−, 9 mV). Because of short circuit effects of the leak conductance between cell membrane and patch pipette, the RMP is underestimated (Fricker et al. 1999; Tyzio et al., 2003). Therefore, the measured potential was corrected for seal (Rs) and input resistance (Rin) according to the formula delivered by Tyzio et al. (2003) for each cell recorded under whole-cell conditions. Because Rs cannot be measured precisely during the perforation process, we measured Rs in some cells after 20–30 min under cell-attached conditions using low Cl− pipette solution without gramicidin, resembling the perforation process. After 20–30 min, Rs amounted to 8.7 ± 2.9 GΩ (n = 5), which was used for the estimation of the RMP in all perforated-patch experiments.
To estimate [Cl−]i, the GABA reversal potential (EGABA) was determined by performing gramicidin-perforated patch-clamp recordings. GABA currents were elicited at different holding potentials by focal application of 1 mm GABA via an application pipette (tip opening, 1–1.5 μm) placed ∼25 μm upstream of the recorded cell using a pressure application system (PDES 02T; NPI). An initial GABA pulse was delivered at −60 mV and omitted from analysis to reduce influence of receptor desensitization. This method gave very reproducible results of ±1.7 mV when EGABA was determined three to four times in whole-cell experiments (n = 39). [Cl−]i was calculated from EGABA using the Goldman equation considering a relative HCO3− conductance of 0.2 (Bormann et al., 1987) and a [HCO3−]i of 26 mm. Because [Cl−]i was determined by GABAergic currents carried by Cl− ions, which obviously may interfere with [Cl−]i, all efforts were made to minimize GABA currents by reducing the GABA application time to 1–3 ms, decreasing the number of voltage steps and increasing the interval between subsequent GABA application sequences (see Results for details).
Optical measurement of [Cl−]i.
Slices were loaded with the Cl−-sensitive fluorophore MEQ by incubating them for 60 min in 370 μm 6-methoxy-N-ethyl-1,2-dihydroquinoline (diH-MEQ). Preparation of diH-MEQ and loading procedure were described previously in detail (Fukuda et al., 1998). The slices were simultaneously loaded with the volume marker calcein (10 μg/ml in the presence of 0.01% pluronic F127). Subsequently, the slices were placed in a submerged recording chamber mounted on the fixed stage of a microscope (E-600FN; Nikon, Tokyo, Japan). MEQ fluorescence was excited at 349–361 nm and emitted at 415–475 nm, and calcein fluorescence was excited at 494–506 nm and emitted at 550–590 nm by means of a multiwavelength monochromator (Polychrome II; Till Photonics, Eugene, OR) and a custom-made dual-bandpass filter (Omega, Brattleboro, VT). Fluorescence images were obtained by a cooled CCD camera (C6790; Hamamatsu Photonics, Shizuoka, Japan) and were recorded and analyzed with the software package ARGUS-HisCa (Hamamatsu Photonics). For estimation of [Cl−]i, MEQ fluorescence was determined in ACSF and subsequently in the absence of the major quenching anion Cl− (Cl− substituted by equimolar potassium methylsulfuric acid). The Cl−-OH− antiporter tributyltin (20 mm) and the K+-H+ antiporter nigericin (14 mm) were added to Cl−-free/high K+ solution to accelerate intracellular Cl− depletion. MEQ fluorescence values were corrected for the following: (1) apparent bleaching and leakage of MEQ, as determined by a gradual and linear decline of the fluorescence signal; (2) background fluorescence, which was insensitive to quenching by 150 mm KSCN; and (3) volume changes determined by calcein fluorescence. Resting [Cl−]i was estimated from the fluorescence ratio (F0/Frest) of MEQ fluorescence measured in ACSF (Frest) and in Cl−-free solution (F0). The actual [Cl−]i was calculated from the Stern–Volmer equation [Cl−] = [(F0/Frest) − 1]/kd using an quenching coefficient (kd) of 30.6 mm−1. The possible pH changes induced by the use of the H+ and OH− antiporter most likely did not affect MEQ fluorescence, because MEQ shows a rather small pH sensitivity in the physiological range (Verkman et al., 1989). In addition, after tributyltin/nigericin application in high K+/Cl−-free conditions, MEQ fluorescence was estimated after obtaining steady-state conditions, leaving only minimal electromotive forces for H+/OH− transport and thus for pH differences between intracellular and extracellular compartments.
Single-cell reverse transcription-PCR and in situ hybridization histochemistry.
Single-cell RT-PCR investigations were performed according to protocols described in detail previously (Yamada et al., 2004). Reverse transcription (RT) reaction was performed at 50°C for 30 min, whereas first-round PCR was performed with a 15 min preincubation at 95°C followed by 40 cycles of 30 s at 94°C, 30 s at 55°C, and 1 min at 72°C in a thermal cycler (PC-801; ASTEC, Fukuoka, Japan). First-round PCR products were diluted 250-fold and reamplified for 40 cycles (94°C, 30 s; 60°C, 30 s; 72°C, 1 min) using internal primer pairs. PCR products were visualized after 10% PAGE with ethidium bromide. Sequences of nested primer pairs for β-actin, KCC2, and NKCC1 were given previously (Yamada et al., 2004). Outside and inside primer pairs for ClC2 were 5′-CATGGAATCAGCAGGCATTG-3′/5′-GGCACTTGTCATCACTATCA-3′ and 5′-GTGACAAACGCAAGCTGAAG-3′/5′-GTGACAATCCCAATGAGTCT-3′, respectively (GenBank accession number AF005720). In situ hybridization protocols and antisense mRNA probes for NKCC1 are described in detail previously (Kanaka et al., 2001). The sequence of reelin antisense probe was CACGACAACATGGGCTCAGGCACTTCTACAAC (GenBank accession number AB049473) (Kikkawa et al., 2003). Detection of hybridization probes was performed using emulsion microautoradiography on thionin-stained sections to allow morphological identification.
Immunohistochemistry.
Tangential brain slices were fixed for 18–24 h immediately after preparation. After washing in phosphate buffer (PB), slices were incubated in blocking solution (4% normal goat and 3% normal bovine serum, 0.5% Triton X-100, 0.05% azide in PBS) for 2 h at room temperature. Primary antibodies were incubated overnight at room temperature. For NKCC1 staining, the T4 antibody (1:800; Developmental Hybridoma Bank, Iowa City, IA) (Lytle et al., 1995) was used, and for reelin detection, the antibody SP142 (1:400; Chemicon, Hampshire, UK) (De Bergeyck et al., 1998) was used. After rinsing, the slices were incubated with secondary antibody [Alexa 568 coupled anti-mouse IG (Invitrogen, Karlsruhe, Germany), 1:400 for NKCC1 and Cy-2-conjugated anti-mouse antigen-binding fragments (FAB) (Dianova, Hamburg, Germany), 1:100 for reelin] for 2 h at room temperature. For simultaneous staining of NKCC1 and reelin immunoreactivity, slices were first exposed to SP142 antibody overnight. After rinsing, antibodies were marked with the Cy-2-conjugated anti-mouse FAB fragments. After rinsing, the slices were incubated for 48 h at 4°C with T4 antibody, which was subsequently marked with the secondary antibody. In whole-cell recordings, 0.5% biocytin was added to the pipette solutions. These slices were fixed overnight and, after washing biocytin-labeled cells, were stained with streptavidin-conjugated with Cy-3 (Dianova) or Alexa 488 (Invitrogen). Some of these slices were subsequently counterstained for reelin according to the protocol described above. The slices were embedded in fluoromount (Sigma, Taufkirchen, Germany). Immunofluorescence was investigated with a Nipkow spinning disk confocal system (Visitech, Sunderland, UK) attached to a conventional fluorescence microscope (Olympus BX51 WI; Olympus Optical, Tokyo, Japan) equipped with water immersion objectives and a cooled CCD camera (CoolSnap HQ; Roper Scientific, Ottobrunn, Germany) controlled by MetaMorph software (Universal Imaging, West Chester, PA). Green and red fluorescence was excited with the 488 and 568 nm lines of a Kr/Ar laser (Laser Physics, Malpas, UK).
Solutions and drugs.
ACSF used for slice preparation, and electrophysiological recordings consisted of the following (in mm): 126 NaCl, 26 NaHCO3, 1.25 NaH2PO5, 1 MgCl2, 2 CaCl2, 2.5 KCl, and 20 glucose and was equilibrated with 95% O2/5% CO2 (pH 7.4; osmolarity, 336 mOsm). Na+-free ACSF contained the following (in mm): 127.5 Tris-HCl, 1.25 KH2PO5, 1 MgCl2, 2 CaCl2, 1.25 KCl, 20 glucose, and 26 choline-HCO3. The following stock solutions were used: 50 mm bumetanide, 125 mm disodium 4,4′-diisothiocyanatostilbene-2,2′-disulfonate (DIDS), 1 mm 9-anthracenecarboxylic acid (9-AC), 30 mm strychnine and 10 mm gabazine (GBZ) in DMSO as well as 1 mm tetrodotoxin (TTX) in citrate buffer. The final DMSO concentration never exceeded 0.3%. All substances except TTX (Tocris Cookson, Ballwin, MO) were obtained from Sigma.
Statistics.
All values are expressed as mean ± SEM. For statistical analysis of independent data sets, the Kolmogorov–Smirnov test was used, and for paired data sets, the sign-test was used (Systat 11; Systat, Point Richmond, CA). Results were designated significant at a level of p < 0.05, and significance levels are indicated by *p > 0.05, **p < 0.01, and ***p > 0.001.
Results
Properties of investigated cells
A total of 145 CR cells identified by their morphological and electrophysiological properties were used for this investigation. To confirm the identification of CR cells by morphological appearance in videomicroscopic image (Fig. 1A), 16 visually identified CR cells were filled with biocytin and subsequently costained for biocytin and reelin, a marker for CR cells in the marginal zone (D'Arcangelo et al., 1997). All biocytin-labeled neurons showed the typical morphological properties of CR cells and were reelin positive (Fig. 1B), demonstrating that CR cells can be unequivocally identified by videomicroscopy.
Figure 1.
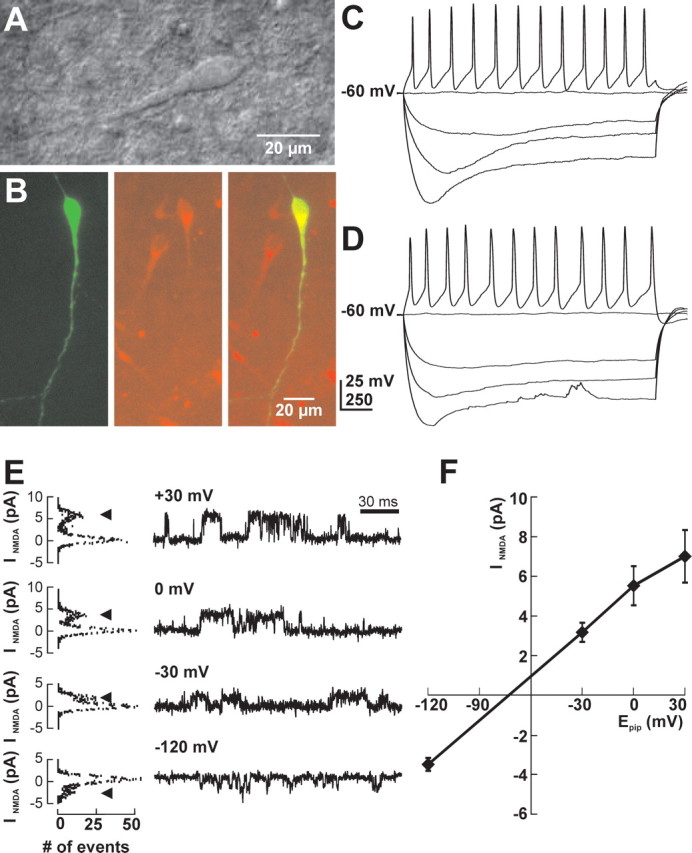
Characterization of CR cells. A, Videomicroscopic image of a CR cell in a tangential slice preparation of a P1 rat. B, Immunolabeling of a CR cell in a tangential cortical slice preparation of a P0 rat. Although only the recorded CR cell was stained against biocytin (green), many reelin-positive (red) cells are visible in the tangential slice. The biocytin-labeled cell was reelin positive (merged picture). C, Electrophysiological properties of a CR cell recorded under gramicidin-perforated patch-clamp conditions. Depolarizing current injection elicited broad and repetitive action potentials, whereas injection of hyperpolarizing currents induced a prominent voltage sag. D, Electrophysiological properties of the CR cell shown in B recorded in whole-cell configuration. No difference was detected between whole-cell and perforated-patch measurements. E, Determination of resting membrane potential by the reversal potential of NMDA receptor channels recorded in cell-attached mode. Original traces (right) and corresponding amplitude histograms (left) of currents through NMDA receptor channels at different holding potentials are shown. Arrowheads mark the current amplitude of open channels. F, Current–voltage relationship of NMDA currents recorded in seven experiments. NMDA currents were reversed at −68 mV.
The average RMP under gramicidin-perforated patch-clamp conditions [corrected according to the formula given by Tyzio et al. (2003); see Materials and Methods for details], was −80.3 ± 2.1 mV (n = 69), and Rinput was 1.6 ± 0.1 GΩ. In most CR cells (n = 55 of 69 CRc), injection of positive current elicited repetitive action potentials (APs) with an average amplitude of 35.1 ± 1.2 mV and a width of 8.0 ± 0.4 ms after reaching action potential threshold at −38.0 ± 0.5 mV (Fig. 1C). In 76 CR cells recorded in whole-cell configuration, the average RMP was −77.5 ± 2.3 mV, Rinput was 1.3 ± 0.1 GΩ, and repetitive action potentials with an average amplitude of 46.5 ± 1.0 mV and a width of 9.3 ± 0.4 ms were elicited in 73 of these 76 cells when depolarization exceeded −37.9 ± 0.4 mV (Fig. 1D). The action potential threshold did not change during the investigated stage of development (P0–P3) and did not depend on [Cl−]i ([Cl−]p: 10 mm, −36.5 ± 1.5 mV, n = 6; 20 mm, −38.7 ± 1.7 mV, n = 7; 30 mm, −36.5 ± 1.2 mV, n = 9). Injection of hyperpolarizing currents induced, under both conditions, a prominent voltage sag (Fig. 1C,D) because of the activation of H-currents (Kilb and Luhmann, 2000).
In addition, we estimated RMP of CR cells from the reversal potential of NMDA receptor-mediated currents in cell-attached configuration, which allows the determination of RMP without interfering with intracellular ion composition and under conditions where the relationship between Rseal and Rinput could be neglected (Tyzio et al., 2003). In this configuration, the NMDA receptor-mediated currents reverse when the pipette potential compensates the electromotive force given by the RMP and the reversal potential of the NMDA receptor. The NMDA receptor-mediated single-channel currents (Fig. 1E) reversed their direction at a pipette potential of −68.1 ± 5.5 mV (n = 7) (Fig. 1F). From this value, an RMP of approximately −73 mV was estimated, assuming an NMDA receptor reversal potential of approximately +5 mV (Tyzio et al., 2003).
Methodical considerations
Although unintended rupture of the gramicidin-perforated patch could be noticed immediately, because in these cases, EGABA was determined by the [Cl−] of the pipette solution, slow diffusion of Cl− ions through the patch might influence [Cl−]i. To investigate the possibility that Cl− ions leaking from the patch pipette into the cell could alter [Cl−]i, two different pipette solutions containing either 136 mm Cl− or 6 mm Cl− were used in the gramicidin-perforated patch-clamp experiments. No significant difference (p = 0.097) in EGABA was detected between high-Cl− (−36.0 ± 1.6 mV; n = 18) and low-Cl− pipette solution (−32.8 ± 1.3 mV; n = 43), indicating that an influence of the pipette solution on [Cl−]i can be neglected (Fig. 2A–C). Because the GABAergic currents used to determine [Cl−]i are carried by Cl− ions and can thus influence [Cl−]i, we optimized the application protocol to minimize a disturbance of [Cl−]i. Varying the interval between the GABA application protocols used to determine EGABA revealed that, at intervals of <2 min, EGABA was affected by the application protocols (Fig. 2D). Because the application of only two additional GABA pulses at a holding potential of −100 mV before the GABA application sequence shifted EGABA in negative direction (by 2.4 ± 0.3 mV; n = 6) (data not shown), we determined EGABA using holding potentials between −80 and −40 mV to minimize GABAergic currents and thus disturbances of [Cl−]i. The determination of EGABA with this application protocol was suitable to investigate EGABA over long observation periods (Fig. 2E).
Figure 2.
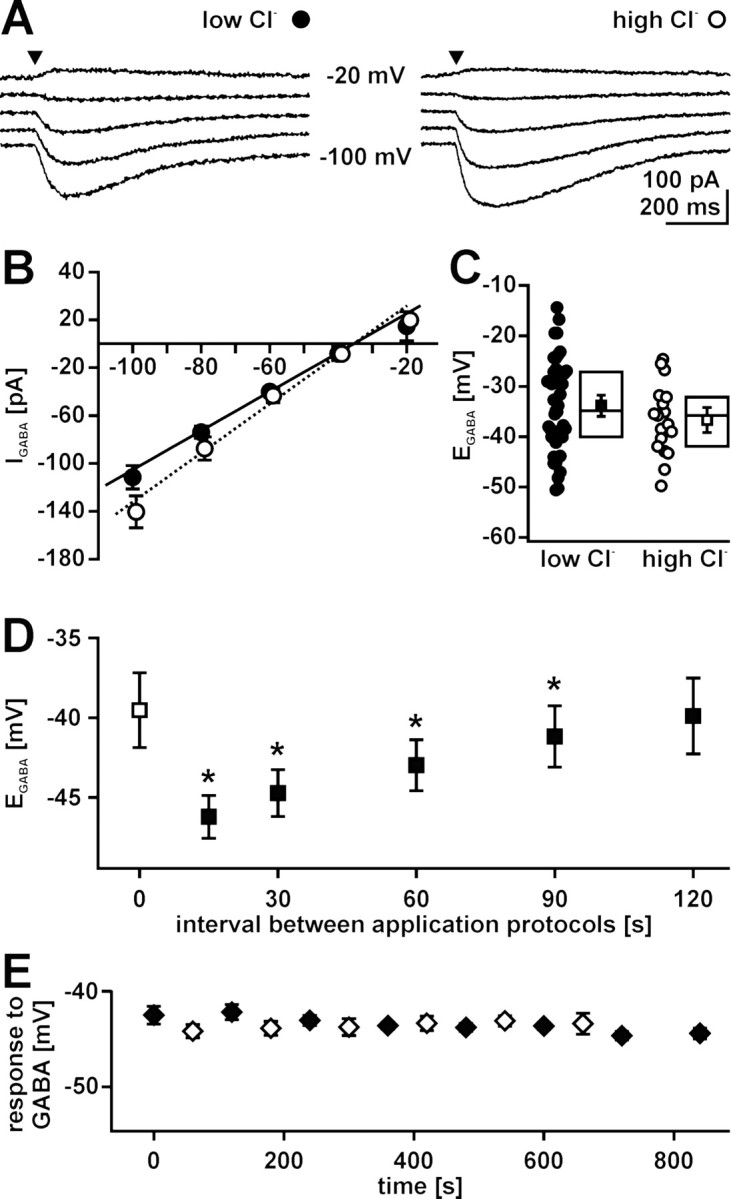
Methodical consideration for [Cl−]i determination in gramicidin-perforated patch-clamp experiments. A, Typical GABA-evoked currents of P1 CR cells recorded in gramicidin-perforated patch-clamp configuration using two different pipette solutions containing either 6 mm Cl− (low-Cl−; left) or 136 mm Cl− (high-Cl−; right). GABA was applied focally (arrowhead) while holding potential (Vh) was adjusted between −100 and −20 mV in 20 mV steps. B, Current–voltage relationship of GABAergic currents (IGABA) recorded with low-Cl− (closed circles) and high-Cl− (open circles) pipette solution under gramicidin-perforated patch-clamp conditions. Data points represent means ± SEM of at least 18 experiments. The intersection of the linear fit and the x-axis indicates EGABA. C, Plot of EGABA obtained in all experiments using low-Cl− (closed circles) and high-Cl− (open circles) pipette solution under gramicidin-perforated patch-clamp conditions. Statistical analysis revealed that EGABA was identical using low Cl− (closed square) or high Cl− (open square) pipette solution. Box plots displaying median, top, and bottom quartile suggest a normal distribution of the data. D, Relationship between intervals of GABA application sequences and EGABA. EGABA was determined by the protocol shown in A at intervals between 15 and 120 s. Closed squares represent mean ± SEM of five experiments; the open square represents EGABA determined by the first application sequence. Note that EGABA was significantly (*p < 0.05; Wilcoxon test) reduced if the interval between application protocols is <120 s. E, Determination of EGABA (closed diamonds; n = 6) and GABA-induced peak depolarization (open diamonds; n = 4) with an interval of 2 min between application sequences performed at holding potentials of −60 mV. Both GABA responses were stable over the whole observation period.
Resting [Cl−]i in CR cells
To evaluate the steady-state [Cl−]i in CR cells, EGABA was determined immediately after obtaining stable access conditions in gramicidin-perforated patch-clamp recordings. In all investigated CR cells, EGABA was positive to RMP (Fig. 3A). Average EGABA amounted to −33.5 ± 1.0 mV (n = 68), corresponding to [Cl−]i of ∼33 mm. EGABA was not significantly affected (p = 0.24) by a shift in the holding potential to −80 mV for >30 min (−32.6 ± 2.2 mV for −80 mV; n = 7). Because [Cl−]i at passive Cl− distribution is 13.4 mm (calculated using Nernst equation regarding ECl = RMP), this finding suggests that Cl− is actively accumulated in CR cells. One suitable candidate for such an active Cl− accumulation process is NKCC1 (Delpire, 2000; Payne et al., 2003), which can be blocked by bumetanide and by removal of extracellular Na+. In the continuous presence of 50 μm bumetanide (20–30 min), EGABA decreased significantly (p < 0.01) to −48.9 ± 2.0 mV (n = 8), corresponding to [Cl−]i of ∼16.2 mm (Fig. 3A). A similar reduction of EGABA was observed after removal of Na+ from the extracellular solution for 16–30 min. Under this condition, EGABA decreased significantly (p < 0.01) to −50.5 ± 1.3 mV (n = 9), corresponding to a [Cl−]i of ∼14.9 mm (data not shown).
Figure 3.
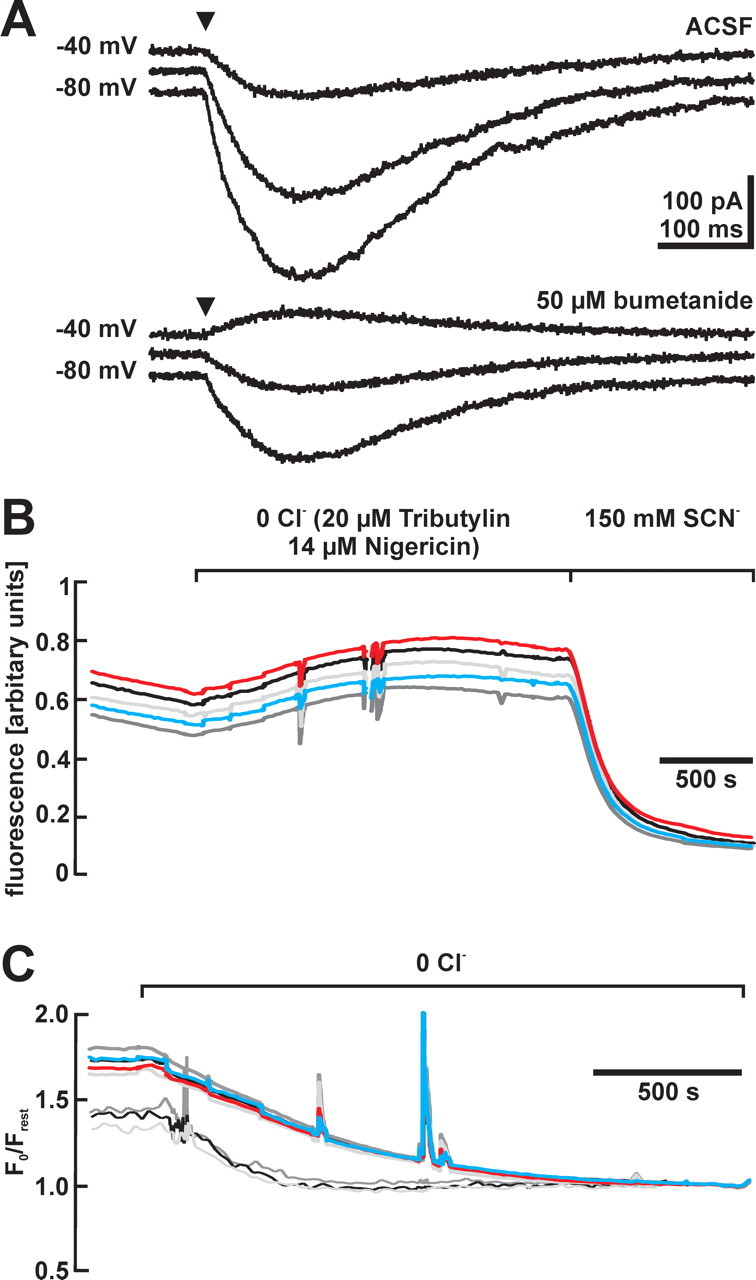
Bumetanide sensitivity of [Cl−]i in CR cells. A, GABAergic currents evoked at a holding potential of −80, −60, and −40 mV before and after the application of bumetanide. Note that EGABA was considerably shifted in a negative direction in the presence of 50 μm bumetanide. B, Representative traces of MEQ fluorescence of five CR cells identified by their morphological appearance in one tangential slice after removal of Cl− and after addition of SCN−. MEQ fluorescence was enhanced in Cl−-free solution and was nearly completely quenched in the presence of SCN−. C, Fluorescence ratio changes of CR cells after removal of Cl− recorded under control conditions (thick lines) and after incubation in 100 μm bumetanide (thin lines). The initial fluorescence ratios, which correspond to resting [Cl−]i, were lower in the bumetanide-incubated cells.
For additional analysis, we estimated [Cl−]i by noninvasive MEQ microfluorimetric experiments (Fig. 3B). The ratio of MEQ fluorescence between resting (Frest) and Cl−-free (F0) conditions was calculated for 74 cells from eight slices. Because Cl−-free solution led to a slight increase in cell volume, as estimated from an increase in the calcein fluorescence by 7.8 ± 1.0%, F0 was corrected for this cellular volume increase to compensate dilution effects. From the fluorescence ratio F0/Frest (Fig. 3C), a [Cl−]i of 29.2 ± 1.4 mm was calculated using the Stern–Volmer equation. Four slices were preincubated with 100 μm bumetanide for 1–3.5 h, because the absorption and emission spectra of bumetanide interfere directly with MEQ fluorescence (Fukuda et al., 1998). Subsequent experiments in bumetanide-free solutions revealed that in these slices, the ratio F0/Frest was reduced to 1.52 ± 0.03 (n = 36 cells from four slices) (Fig. 3C), corresponding to a [Cl−]i of 14.0 ± 0.9 mm, which was significantly (p < 0.001) smaller than under control conditions. In summary, the results of both independent sets of experiments revealed a high [Cl−]i in CR cells, which was actively maintained by bumetanide-sensitive and Na+-dependent Cl− uptake.
NKCC1 expression in CR cells
The previous results suggest that NKCC1 is a likely candidate mediating active Cl− uptake. Indeed, molecular experiments revealed the expression of NKCC1 mRNA in CR cells. In situ hybridization histochemistry showed that hybridization signals for NKCC1 were found close to the soma of large, reelin-positive cells in the marginal zone (Fig. 4A,B), which are presumably CR cells. Multiplex single-cell RT-PCR corroborated these findings. NKCC1 mRNA was detectable in four of 14 cells (Fig. 4C). Interestingly, KCC2 mRNA was present in six of 14 cells.
Figure 4.
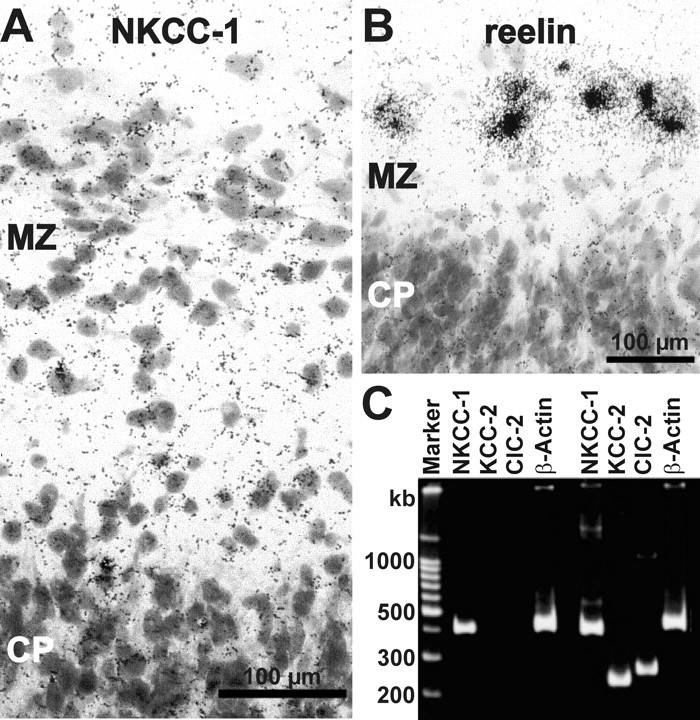
Expression of NKCC1 mRNA in CR cells. A, Bright-field microphotograph of a section from P0 cortex after in situ hybridization using antisense probes for NKCC1 showing the appearance of silver-grains close to the soma of large neurons in the marginal zone (MZ). CP, Cortical plate. B, Bright-field microphotograph of a section from P1 cortex after in situ hybridization using antisense probes for reelin. The intense signals close to the soma of large neurons in the MZ suggest that these neurons are CR cells. C, Ethidiumbromide-stained agarose gel with single-cell multiplex RT-PCR products of cytoplasm harvested from two CR cells. Primers for NKCC1, KCC2, ClC2, and β-actin were used. Note that signals for NKCC1, but also for KCC2 and ClC2, were found in CR cells.
To investigate whether NKCC1 is also expressed at a protein level in CR cells, immunohistochemical staining was performed in tangential slices of the neocortex. NKCC1 immunofluorescence was detected in cells throughout the marginal zone (Fig. 5A). One population of these NKCC1-immunopositive cells displayed the typical appearance of CR cells, as demonstrated by reelin staining (Fig. 5B). To prove that CR cells were indeed NKCC1 immunopositive, costaining using antibodies against NKCC1 and reelin were performed. Confocal microscopy revealed that all reelin-immunopositive cells also displayed NKCC1 signals (Fig. 5C–E). In summary, these results demonstrate that NKCC1 is expressed in CR cells.
Figure 5.

Immunohistochemical identification of NKCC1 proteins in CR cells. A, Confocal image of NKCC1 immunoreactivity observed with T4 antibody in a tangential slice preparation. Note that large cells with CR cell-like morphology are NKCC1 immunopositive. B, Confocal image of reelin immunoreactivity observed with SP142 antibody in a tangential slice preparation. C–E, Confocal images of tangential slices immunostained simultaneously for NKCC1 (C) and reelin (D). The superimposed image (E) revealed that NKCC1 is expressed in all reelin-immunopositive neurons.
Kinetics of the Cl− accumulation process
Although the high [Cl−]i and its dependence on bumetanide and Na+ as well as the abundance of the NKCC1 protein in CR cells suggest a role for NKCC1 in [Cl−]i homeostasis, the investigation of steady-state [Cl−]i cannot reveal details about the contribution of NKCC1 to [Cl−]i homeostasis. Thus, we directly addressed the Cl− uptake process by investigating the recovery of [Cl−]i after Cl− depletion. Cl− was depleted in CR cells by applying 100 GABA pulses at a holding potential of −100 mV and a frequency of 2 Hz (Fig. 6A). This depletion protocol was sufficient to induce a switch from depolarizing GABA responses with an amplitude of +12.8 ± 2.3 mV (n = 8) at −60 mV membrane potential to hyperpolarizing (−4.2 ± 0.9) responses (Fig. 6A). In all investigated cells, the GABA responses recovered toward depolarization. In voltage-clamp experiments, the depletion protocol significantly (p < 0.001) reduced EGABA from −38.5 ± 1.3 mV (n = 26) to −64.3 ± −1.2 mV (Fig. 6B,C), corresponding to a [Cl−]i reduction to ∼6.6 mm. Subsequently, EGABA recovered to −43.0 ± 1.0 mV, corresponding to a [Cl−]i of ∼21.5 mm. The recovery of [Cl−]i was a rather slow process, taking 10–15 min, which could be fitted with a monoexponential function using a time constant of 158 ± 7 s (Fig. 6D). The rate of active Cl− uptake was determined at a [Cl−]i of 13.4 mm, because at this [Cl−]i (which represents the passive Cl− distribution at −60 mV), no driving forces for passive Cl− fluxes exist, and Cl− accumulation depends exclusively on active uptake processes. At this [Cl−]i, the rate of Cl− uptake was 47.2 ± 5.0 μm/s (n = 26).
Figure 6.

Cl− accumulation in CR cells recorded under gramicidin-perforated patch-clamp conditions. A, Depletion protocol recorded in slow voltage-clamp mode. Arrowheads mark the focal application of a single GABA pulse. GABA pulses identified by numbers are displayed below the trace. Application of 100 GABA pulses at −100 mV reversed the direction of GABA responses recorded at −60 mV. The complete recovery process of GABAergic responses takes 18–20 min. The negative potential shifts after a GABA pulse were artifacts resulting from the slow voltage-clamp system. B, Voltage-clamp recordings of the typical protocol used to determine EGABA before (t = −240 s), directly after depletion (t = 0 s), and after recovery of [Cl−]i (t = 720 s). C, Recovery process of EGABA after depletion protocol. Data points represent mean ± SEM of 26 experiments. The recovery process was slow, taking 10–15 min. The dashed line indicates EGABA of −52.4 mV, which corresponds to passive Cl− distribution at −60 mV, considering a HCO3−/Cl− conductance of 0.2. D, Recovery of [Cl−]i as calculated from the values shown in C. The dashed line indicates passive Cl− distribution. The slope of the tangent (solid line) in this point is used to estimate the velocity of Cl− accumulation (see Results for details).
To identify the contribution of NKCC1 to Cl− uptake, we analyzed the effect of the inhibitor bumetanide on [Cl−]i recovery after depletion. In the presence of 50 μm bumetanide, only a partial recovery of EGABA could be observed (Fig. 7A, triangles), independent of whether the incubation time was 4 or 20 min. Neither the EGABA values reached after recovery nor the time constant of Cl− uptake depends on the incubation time in bumetanide; therefore, data were pooled. EGABA was significantly (p < 0.001) smaller after recovery in bumetanide than after recovery in ACSF in all investigated cells (Fig. 7B,C). In the presence of 50 μm bumetanide, EGABA reached −52.5 ± 1.2 mV (n = 16), corresponding to a [Cl−]i of ∼13.4 mm (Fig. 7E). This value equals EGABA at a passive [Cl−]i distribution, suggesting a complete lack of active Cl− uptake in the presence of bumetanide. Bumetanide effects were not reversible within 20 min. To corroborate this finding, Na+ was removed from the recording solution in an additional set of experiments. In the absence of extracellular Na+, the recovery of EGABA after Cl− depletion was also incomplete (Fig. 7A, filled circles). In all investigated cells, EGABA was significantly (p < 0.001) smaller after recovery in the absence of extracellular Na+ than after recovery in ACSF (Fig. 7B,D). EGABA obtained after a recovery in Na+-free solution amounted to −58.9 ± 1.2 mV (n = 12). The [Cl−]i calculated from EGABA after recovery in Na+-free solution was ∼9.4 mm and thus was lower than the passive distribution (Fig. 7E). The effect of Na+-free solution was completely reversible; EGABA recovered to −43.2 ± 2.5 mV (n = 10) after readmission of Na+.
Figure 7.

Pharmacology of Cl− accumulation. A, Recovery process of EGABA after depletion protocol under control conditions (open squares; n = 26), in Na+-free ACSF (filled circles; n = 7) and in the presence of 50 μm bumetanide (gray triangles; n = 10). The recovery process and final EGABA were altered by bumetanide and Na+-free ACSF. B, Typical responses to GABA application protocols used to determine EGABA after recovery in ACSF, 50 μm bumetanide (Bum), and Na+-free ACSF (0 Na+). C, Plot of EGABA determined after recovery in ACSF and subsequent recovery in 50 μm bumetanide. Individual experiments are shown as open circles connected by lines (mean ± SEM was calculated from 16 experiments). D, Plot of EGABA after recovery in ACSF and Na+-free ASCF. Mean ± SEM was calculated from 12 experiments. EGABA after recovery was significantly reduced (p < 0.001) by bumetanide and Na+-free ASCF. E, Effect of bumetanide and Na+-free conditions on [Cl−]i. Error bars represent mean ± SEM of [Cl−]i as calculated from EGABA shown in C and D. The number of experiments is shown in the bars, and the dashed line indicates passive Cl− distribution. F, Recovery of [Cl−]i calculated from the values depicted in A. Recovery curves are aligned to a [Cl−]i of 6.6 mm (for details, see Results).
The value of EGABA estimated after recovery was significantly lower (p < 0.01) in Na+-free solutions than in the presence of bumetanide. Removal of extracellular Na+ does not only block Cl− transport but may rather reverse the transport process (Kakazu et al., 2000). To study the question of whether the negative shift of EGABA in Na+-free solution was caused by a reversal of NKCC1, the recovery process in Na+-free conditions was examined in the presence of 50 μm bumetanide. Under this condition, EGABA reached −60.7 ± 2.5 mV (n = 5) and did not differ significantly (p = 0.89) from EGABA measured in Na+-free conditions alone (data not shown). Readmission of Na+ to bumetanide-containing solution led to a positive shift in EGABA to −53.6 ± 1.8 mV, which is close to passive distribution. These findings indicate that reversal of NKCC1 did not contribute to the more negative EGABA determined in Na+-free ACSF.
A comparison of transport rates between different experimental conditions is only justified for identical [Cl−]i, because both active and passive Cl− transport depend directly on [Cl−]i. Therefore, the [Cl−]i recovery curves were aligned to identical [Cl−]i of 6.6 mm (Fig. 7F), the lowest [Cl−]i reached under all experimental conditions. This graph clearly shows that the rate of Cl− transport is drastically reduced in the absence of Na+ or in the presence of bumetanide. In summary, these results clearly demonstrate that active Cl− accumulation is bumetanide-sensitive and Na+-dependent and suggests a central role of NKCC1.
Resting Cl− conductance in CR cells
Because our findings indicate a rather slow Cl− accumulation process in CR cells, the rate of Cl− loss via membrane conductance was also investigated. For this purpose, EGABA was determined after inhibition of Cl− uptake by 50 μm bumetanide. Within the first 20 min of the bumetanide application, EGABA decreased from −42.8 ± 1.4 to −50.5 ± 1.6 mV (n = 6), corresponding to a [Cl−]i reduction from ∼22 to ∼15 mm. The [Cl−]i decline was fitted by a monoexponential function, and the initial velocity of Cl− leakage was determined from the slope of these fits at resting [Cl−]i (Fig. 8A). The low initial [Cl−]i leakage rate of 18.4 ± 2.4 μm/s (n = 6) indicates slow passive Cl− fluxes in CR cells.
Figure 8.
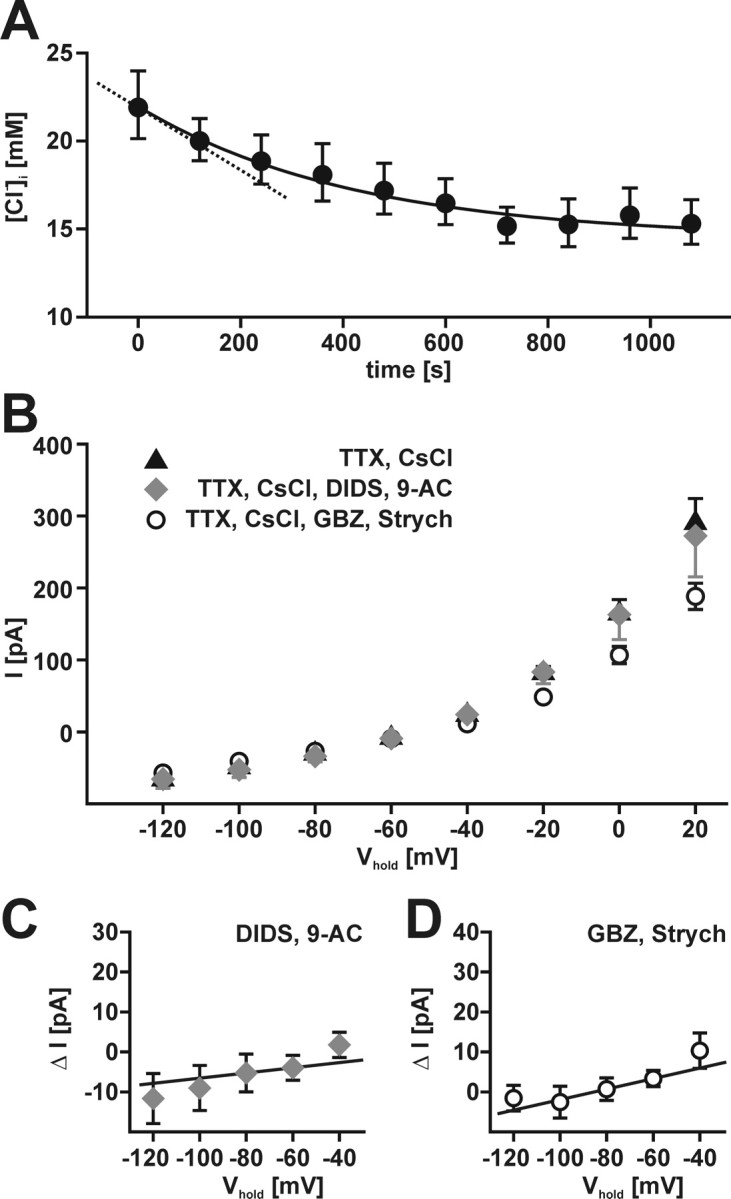
Cl− conductance in CR cells. A, Decline of [Cl−]i determined in gramicidin-perforated patch-clamp experiments after complete blockade of NKCC1 with 50 μm bumetanide. Circles represent mean ± SEM of six experiments. The maximal Cl− efflux rate was calculated from the tangent aligned to the fit at the first data point (dashed line). B, Current–voltage relationship of membrane currents observed in the continuous presence of 0.2 μm TTX and 1 mm CsCl (black triangle). Although the combined application of the Cl− channel blockers DIDS (375 μm) and 9-AC (1 mm) had little effect on membrane currents (gray diamonds), blockade of ligand-gated Cl− channels with GBZ (3 μm) and strychnine (Strych; 30 μm) reduced membrane currents at depolarized potentials (open circle). C, IV plot of current difference (ΔI) between control and 9-AC/DIDS containing bathing solutions. Slope Cl− conductance was estimated between −80 and −60 mV. D, IV plot of current difference (ΔI) between control and GBZ/strychnine containing bathing solutions. Slope Cl− conductance was estimated between −80 and −60 mV.
To address the question of which pathways contribute to the passive net Cl− fluxes, we determined the Cl− conductance of CR cells in whole-cell voltage-clamp experiments. For this purpose, current voltage (IV) relationships of CR cells were determined in the presence of 0.2–1 μm TTX and 1 mm CsCl to block voltage-dependent sodium and hyperpolarization-activated currents (Kilb and Luhmann, 2000). First, we investigated the effect of 1 mm 9-AC and 375 μm DIDS, known to block various Cl− conductance like voltage-dependent Cl− channels, Ca2+-activated Cl− channels, and volume-regulated anion channels (Nilius and Droogmans, 2003). The combined application of 9-AC and DIDS had only a very small effect on membrane currents (Fig. 8B). From differences in membrane currents between control and 9-AC/DIDS containing solutions, a slope Cl− conductance of ∼64 pS (n = 6) was estimated around RMP (Fig. 8C). To investigate the question of whether activation of ligand-gated Cl− channels by ambient GABA or glycine affects the Cl− conductance of CR cells, these channels were blocked by the combined application of the GABAA receptor antagonist GBZ (3 μm) and the glycinergic antagonist strychnine (30 μm). Although GBZ and strychnine had only small effects on membrane currents at potentials below −20 mV, currents were decreased at potentials exceeding −20 mV (Fig. 8B). The differences in membrane currents between control and GBZ/strychnine containing solutions revealed a slope conductance of ∼132 pS near the RMP (n = 8) (Fig. 8D). In summary, these results demonstrate a low Cl− conductance, which is mediated by ligand-dependent and -independent Cl− channels.
Excitatory GABA responses in CR cells
To evaluate functional consequences emerging from the slow Cl− accumulation process in CR cells, we investigated the effect of GABA application in current-clamp experiments under gramicidin-perforated patch-clamp conditions. As expected, focal GABA application induced a prominent membrane depolarization by 20.9 ± 0.7 mV in all investigated cells (n = 68). This depolarization was sufficient to reach the spike threshold and elicit action potentials in 79.1% of those cells (Fig. 9A). Incubation of the slices in 50 μm bumetanide for 7.5–30 min reduced GABA-induced depolarizations to −50.9 ± 1.5 mV (n = 7) and suppressed action potential discharges in all investigated cells (Fig. 9B). In summary, these findings suggest that the bumetanide-sensitive Cl− accumulation is required to maintain depolarizing GABA actions.
Figure 9.
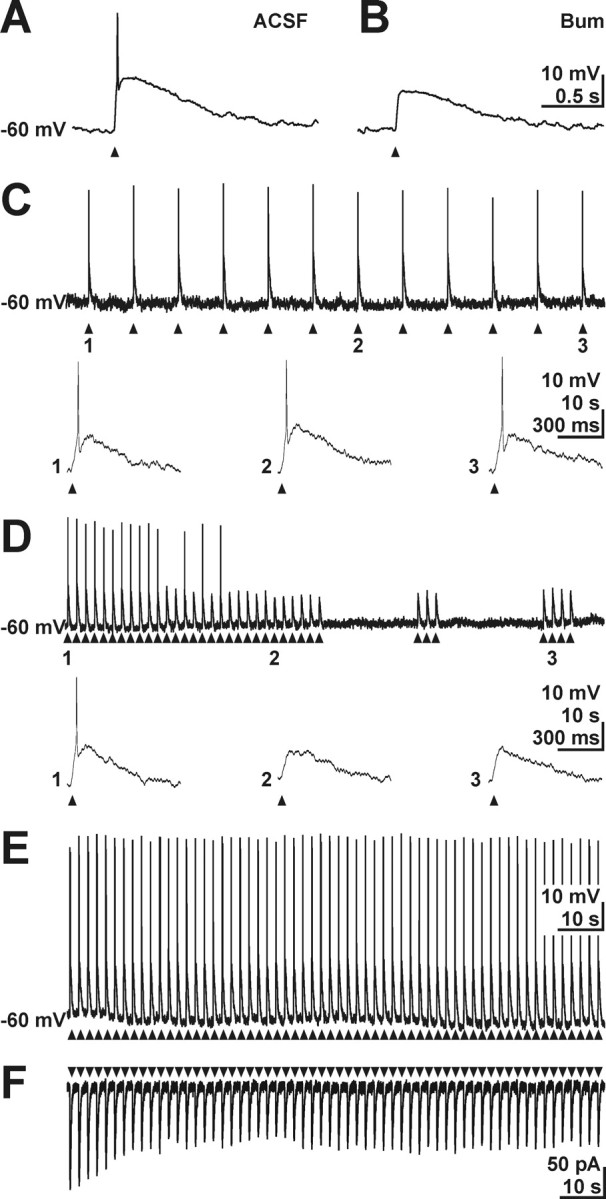
Effect of active Cl− uptake on GABA responses in CR cells. A, Gramicidin-perforated patch-clamp recording of a CR cell. Focal GABA application (arrowheads) elicited APs. B, In the same cell, 50 μm bumetanide suppressed GABA-induced AP. C, Repetitive GABA pulses (arrowheads) at a frequency of 0.1 Hz reliably elicited APs at each application under perforated-patch conditions. Events indicated by numbers are shown at a larger time scale below the current trace. D, Subsequent increase in application frequency to 0.5 Hz attenuated the amplitude of GABA responses and abolished AP (2). The amplitude of GABA-induced depolarization increased slightly after cessation of repetitive application, but no AP could be elicited (3). E, Current-clamp recording of GABA responses under whole-cell conditions at a [Cl−]p of 30 mm. Under whole-cell conditions, GABA application at a frequency to 0.5 Hz reliably evoked APs. F, Voltage-clamp recording of GABA responses under whole-cell conditions at a [Cl−]p of 30 mm. Repetitive application at a frequency to 0.5 Hz led to a partial desensitization of GABAergic inward currents.
Because each GABA pulse opens Cl− conductance and therefore alters [Cl−]i, the rather slow Cl− accumulation in CR cells may be exceeded by GABA-induced Cl− fluxes. To provide additional insights into the capacity of the Cl− accumulation process, we challenged the [Cl−]i homeostasis by repetitive GABA pulses. GABA elicited excitatory responses with stable amplitude at an application frequency of 0.1 Hz (n = 4) (Fig. 9C). Increasing the application frequency to 0.2 Hz slightly decreased the amplitude of GABAergic depolarizations from −45 ± 2 to −48 ± 2 mV within 120 s (n = 4). However, membrane depolarization was sufficient to elicit action potentials at nearly each GABA pulse (four failures from 96 applications). At an application frequency of 0.5 Hz, the reduction of GABAergic depolarizations was more pronounced and decreased from −46 ± 1 to −54 ± 1 mV (n = 6) within 48 s (Fig. 9D). After 20 ± 5 GABA pulses, no action potential could be elicited. Recovery from this attenuation of GABA responses took 15–20 min. Additional GABA pulses applied 14–78 s after the pulse train did not induce action potentials (n = 4) (Fig. 9D), indicating that receptor desensitization may not account for the amplitude reduction of GABA responses. To exclude that GABA induced depolarizations were diminished because of receptor desensitization, we performed control experiments in whole-cell configuration at a [Cl−]p of 30 mm. Under these conditions, GABA pulses at an application frequency of 0.5 Hz reliably elicited action potentials (n = 8) (Fig. 9E), although voltage-clamp experiments revealed desensitization by 44.3 ± 3.3% (n = 9) during the first 10 pulses at this application frequency (Fig. 9F). In addition, these repetitive GABA pulses did not diminish Rin (from 0.67 ± 0.11 to 0.65 ± 0.07 GΩ, n = 8, after 10 pulses) and had no effect on AP threshold (−37.2 ± 0.6 to −38.8 ± 0.5, n = 8), indicating that neither a decrease in Rin because of extracellular GABA accumulation nor inactivation of voltage-gated Na+ channels contribute to the attenuation of GABA responses (data not shown). In summary, these findings demonstrate that repetitive activation of GABAA receptors can lead to a reduction of [Cl−]i and thereby may suppress excitatory GABA actions.
Depolarizing GABAA-mediated responses do not necessarily provoke excitatory membrane responses but may also mediate shunting-inhibition, depending on the timing between the GABAergic and an additional excitatory input (Staley and Mody, 1992; Gao et al., 1998). To test whether, in CR cells, GABA also contributes to shunting-inhibition, we paired subthreshold GABA application with current injection of increasing strength at different intervals between both stimuli. At a [Cl−]p of 30 mm, resembling a physiological [Cl−]i, GABA pulses applied simultaneously with the current (Fig. 10A, left trace) attenuated the injection current required to trigger APs from 31.7 ± 4.2 to 21.7 ± 3.3 pA (n = 6). Similar results were obtained when the current stimulus was applied at the peak or in the decay phase of the GABA response (Fig. 10A, middle and right traces), suggesting reliable excitatory action of GABA under physiological conditions. In contrast, at 10 mm [Cl−]i, GABA increased the threshold current required to evoke action potentials by paired current injection independent of the timing between the stimuli (Fig. 10B). In summary, these results demonstrate that the depolarizing GABAergic action at resting [Cl−]i mediates excitatory actions.
Figure 10.

Facilitating and shunting actions of GABA in CR cells. Whole-cell recordings of membrane potential (black traces) in response to current injection of increasing intensities (gray traces). Current pulses were injected simultaneously with the GABA application (left traces), at the peak (middle traces), or in the decaying phase (right traces) of the GABA-induced membrane depolarization (triangles). A, At a [Cl−]p of 30 mm, GABA decreased the threshold current to evoke APs, independent of the timing between current injection and GABA application. In addition, the number of APs increased, compared with current injection without GABA application. B, At a [Cl−]p of 10 mm, GABA increased the threshold current to evoke APs and decreased the number of APs independent of the timing between current injection and GABA application.
Discussion
The present study provides detailed insight into the properties of Cl− accumulation in immature cortical neurons presenting unique data on velocity and transport capacity of Cl− uptake. We could demonstrate the following in CR cells: (1) bumetanide and Na+-free solutions decreased steady-state [Cl−]i; (2) NKCC1 expression could be detected at mRNA and protein level; (3) active Cl− uptake was bumetanide-sensitive and Na+-dependent and showed a rather low transport capacity; and (4) the activity of this Cl− uptake process was sufficient to maintain GABAergic membrane responses excitatory at low frequency of GABAergic stimulations. These results indicate that NKCC1 is mediating the Cl− accumulation required to render GABA responses excitatory.
Gramicidin-perforated patch-clamp and microfluorimetric measurements revealed a [Cl−]i of ∼30 mm. High [Cl−]i seems to be a common feature of immature neurons throughout the CNS (Ben-Ari, 2002). Previous estimations of [Cl−]i based on gramicidin-perforated patch-clamp measurements revealed values between 20 and 40 mm in immature neurons of the cerebral cortex (Owens et al., 1996; Kilb et al., 2002; Yamada et al., 2004), hippocampus (Sipila et al., 2006), brainstem (Kakazu et al., 1999), or spinal cord (Rohrbough and Spitzer, 1996). Similar values were estimated with noninvasive microfluorimetric methods (Shimizu-Okabe et al., 2002; Ikeda et al., 2003; Zhang et al., 2006). Because [Cl−]i in CR cells is higher than the 13.4 mm corresponding to passive Cl− distribution at −60 mV, active Cl− uptake is required to maintain high [Cl−]i (Rohrbough and Spitzer, 1996; Payne et al., 2003). One possible mechanism for active Cl− accumulation in neurons is Na+- and K+-dependent Cl− uptake (Ballanyi and Grafe, 1985; Alvarez-Leefmans et al., 1988). Such uptake can be mediated by the Na+-K+-2Cl−-cotransporter, a member of the cation-chloride-cotransporter family that uses the Na+ gradient for active Cl− accumulation and can be inhibited by loop diuretics like bumetanide (Delpire, 2000; Russell, 2000). The NKCC1 isoform of the Na+-K+-2Cl−-cotransporter is widely expressed in the immature brain (Plotkin et al., 1997; Clayton et al., 1998; Li et al., 2002; Shimizu-Okabe et al., 2002), and accordingly high [Cl−]i is reduced by Na+-free conditions or bumetanide in various neuronal cell types (Kakazu et al., 1999; Yamada et al., 2004). In contrast, the maintenance of high [Cl−]i was also described in cells in which no NKCC1 was detected (Balakrishnan et al., 2003). In the present study on CR cells, single-cell PCR, in situ hybridization, and immunohistochemical data indicate that NKCC1 is abundantly expressed on mRNA and protein levels. Accordingly, gramicidin-perforated patch-clamp and MEQ microfluorescence experiments revealed a reduction of the high steady-state [Cl−]i in Na+-free solutions or by bumetanide. Although these findings suggest a functional role of NKCC1 in [Cl−]i homeostasis, a detailed analysis of the contribution of NKCC1 to global [Cl−]i homeostatic processes in CR cells cannot be addressed by investigation of steady-state [Cl−]i alone. Because transport systems like the NKCC1 can only be analyzed in detail if the system is challenged, we directly investigated the recovery of [Cl−]i after Cl− depletion.
The depletion protocol used in the present study reduced [Cl−]i to ∼6 mm, which is less than the [Cl−]i of 13.4 mm at passive distribution. Thus, the first phase of [Cl−]i recovery after the depletion protocol represents a superposition of two simultaneous processes: passive Cl− influx and active Cl− uptake. In contrast, the recovery process above 13.4 mm is mediated by net Cl− accumulation to the cell and thus reflects an active process, but under this condition, passive Cl− efflux from CR cells attenuates [Cl−]i changes. Because at a [Cl−]i of 13.4 mm the driving force for Cl− diffusion is zero and no net passive Cl− fluxes occur, the rate of Cl− accumulation at this concentration represents only the velocity of active Cl− uptake. In CR cells, the rate of Cl− accumulation was ∼47 μm/s at this [Cl−]i. Assuming a cell volume of ∼4.2 pl, we estimated a transport of ∼108 Cl− ions/s. This low rate of Cl− accumulation resembles the slow [Cl−]i recovery after Cl− depletion and indicates a low capacity of active Cl− uptake in CR cells.
Corresponding to the low capacity of the Cl− uptake system, we observed a low resting Cl− conductance in CR cells. From the [Cl−]i decrease observed during complete blockade of Cl− uptake with bumetanide, a Cl− loss of ∼0.5 × 10⁸ ions/s, corresponding to a Cl− conductance of 430 pS, was calculated. This indicates that Cl− accumulation is fast enough to balance passive Cl− loss. Of course, we considered that analysis of [Cl−]i via EGABA requires repetitive GABA pulses, which contribute to passive Cl− fluxes. However, comparison of GABA-induced currents and observed [Cl−]i changes revealed only 15–20% of Cl− loss during blockade of NKCC1 was attributable to these GABA pulses. Pharmacological experiments support this finding, demonstrating very low resting Cl− conductance, which is partially mediated by ligand-dependent (∼132 pS) and independent (∼64 pS) Cl− channels. We can not exclude the possibility that Cl− conductance with different pharmacology may also contribute to Cl− loss.
In the presence of bumetanide, an incomplete [Cl−]i recovery to a final concentration of 13.4 mm (corresponding to passive Cl− distribution) was observed, which thus reflects only passive Cl− influx. This finding demonstrates that bumetanide completely blocks net Cl− uptake processes. Hence, the activity of NKCC1 is probably the main mechanism maintaining high [Cl−]i in CR cells, and steady-state [Cl−]i seems to be set by an equilibrium between active NKCC1-mediated Cl− uptake and passive Cl− loss. Although it cannot be excluded that an Cl− uptake by passive fluxes during depolarizing episodes may contribute to Cl− homeostasis (Titz et al., 2003), our results obtained under voltage-clamp conditions clearly show that the activity of NKCC1 is sufficient to explain Cl− accumulation in CR cells.
In the absence of Na+, the [Cl−]i recovery was impaired and led to a final [Cl−]i of ∼9 mm, which was below passive Cl− distribution. This finding suggests the existence of Cl− extrusion mechanisms under this condition. Removal of extracellular Na+ may reverse NKCC1, as has been described for other cation chloride transporters (Kakazu et al., 2000) and thus leads to Cl− extrusion. However, because bumetanide has no effect on [Cl−]i recovery in Na+-free ACSF, reversal of Cl− transport direction cannot explain this observation. The finding that bumetanide has no effect on [Cl−]i recovery in Na+-free solution also indicates that blockade of KCC2-mediated Cl− extrusion by bumetanide may not account for the discrepancy in [Cl−]i between bumetanide-containing and Na+-free ACSF. Removal of Na+ also affects other Na+-dependent transporters like the Na+/H+ exchanger (Aronson, 1985), which will lead to intracellular acidification thereby reducing [HCO3−]i. Reduced [HCO3−]i activates HCO3− influx mediated by anion exchangers in immature neurons (Sterling and Casey, 2002), which may lead to the observed Cl− extrusion.
Our results clearly demonstrate that under resting conditions, [Cl−]i was high enough to render GABA actions excitatory in most of the cells examined under perforated-patch conditions, and that the activity of NKCC1 is a prerequisite for excitatory GABA responses in CR cells. However, the capacity of the accumulation process was sufficient to maintain a constant [Cl−]i only during a minor challenge. GABA pulses applied at higher frequencies exceed the capacity of NKCC1-mediated Cl− uptake, which will lead to inhibitory GABAA receptor-mediated responses because of prevailing shunting-inhibition at an insufficiently strong membrane depolarization (Staley and Mody, 1992). At decreased [Cl−]i, GABA can even have excitatory and inhibitory actions depending on the timing between inputs (Gao et al., 1998). In contrast, no direct conclusion about the effect of ongoing or burst-like GABAergic synaptic inputs on [Cl−]i and thus on the functional consequences of GABAergic inputs could be drawn from the repetitive focal GABA application used in the present study. The rather inefficient Cl− accumulation in CR cells might reflect sparse GABAA-mediated synaptic inputs observed under resting conditions (Kilb and Luhmann, 2001; Chan and Yeh, 2003; Soda et al., 2003). However, carbachol-induced activity of immature cortical networks (Dupont et al., 2005) provoked a massive frequency increase of GABAergic postsynaptic potentials in mouse CR cells, which in turn abolished the capacity of GABAergic inputs to trigger action potentials (K. Achilles, W. Kilb, and H. J. Luhmann, unpublished results).
The limited Cl− accumulation capacity in immature neurons could provide a mechanism to regulate network activity. In developing chick spinal cord, episodes of spontaneous activity, mainly driven by GABA and glycine, last for ∼60 s and are followed by interepisode depression intervals of 10–15 min, which are attributable to a slow recovery of [Cl−]i after massive Cl− efflux during network activity episodes (Marchetti et al., 2005). In Mg2+-free solution, a similar kind of activity has been described in CR cells, where synchronous barrages of GABAergic postsynaptic currents lasting ∼2 s occurred at a frequency of ∼0.01 Hz (Soda et al., 2003). The limited Cl− accumulation capacity in CR cells might provide an explanation for this pattern of synchronous activity. Interestingly, network activity driven by excitatory GABAergic inputs induces transient events under physiological and pathophysiological conditions (Leinekugel et al., 1997; Khalilov et al., 2005). Thus, [Cl−]i dynamics may play a role in patterning network activity providing the temporal information required for the formation of functional synaptic connections (Penn and Shatz, 1999; Ben-Ari, 2001).
Footnotes
This work was supported by Deutsche Forschungsgemeinschaft (DFG) Grant KI 835/2 (W.K.) and Japan Society for the Promotion of Science-DFG Cooperative Research Grant and Grant-in-Aid 18021015 from the Ministry of Education, Science, Sports, Culture and Technology of Japan (A.F.). K.A. is a doctoral student of the neuroscience graduate school at the University of Mainz (DFG GRK 1044); this paper is part of her PhD thesis. We thank B. Krumm for excellent technical assistance and B. Sava for his contribution to some experiments. The T4 antibody developed by C. Lyte and B. Forbush III was obtained from the Developmental Studies Hybridoma Bank developed under the auspices of the National Institute of Child Health and Human Development and maintained by The University of Iowa (Department of Biological Sciences, Iowa City, IA). Part of this study has been shown in abstract form (Achilles et al., 2006).
References
- Achilles et al., 2006.Achilles K, Okabe A, Ikeda M, Shimizu-Okabe C, Fukuda A, Luhmann HJ, Kilb W. Excitatory GABA actions in Cajal-Retzius cells are mediated by NKCC1. FENS Abstr. 2006;3:A1118–1. [Google Scholar]
- Alvarez-Leefmans et al., 1988.Alvarez-Leefmans FJ, Gamino SM, Giraldez F, Nogueron I. Intracellular chloride regulation in amphibian dorsal root ganglion neurones studied with ion-selective microelectrodes. J Physiol (Lond) 1988;406:225–246. doi: 10.1113/jphysiol.1988.sp017378. [DOI] [PMC free article] [PubMed] [Google Scholar]
- Aronson, 1985.Aronson PS. Kinetic properties of the plasma membrane Na+-H+ exchanger. Annu Rev Physiol. 1985;47:545–560. doi: 10.1146/annurev.ph.47.030185.002553. [DOI] [PubMed] [Google Scholar]
- Balakrishnan et al., 2003.Balakrishnan V, Becker M, Lohrke S, Nothwang HG, Guresir E, Friauf E. Expression and function of chloride transporters during development of inhibitory neurotransmission in the auditory brainstem. J Neurosci. 2003;23:4134–4145. doi: 10.1523/JNEUROSCI.23-10-04134.2003. [DOI] [PMC free article] [PubMed] [Google Scholar]
- Ballanyi and Grafe, 1985.Ballanyi K, Grafe P. An intracellular analysis of gamma-aminobutyric-acid-associated ion movements in rat sympathetic neurones. J Physiol (Lond) 1985;365:41–58. doi: 10.1113/jphysiol.1985.sp015758. [DOI] [PMC free article] [PubMed] [Google Scholar]
- Ben-Ari, 2001.Ben-Ari Y. Developing networks play a similar melody. Trends Neurosci. 2001;24:353–360. doi: 10.1016/s0166-2236(00)01813-0. [DOI] [PubMed] [Google Scholar]
- Ben-Ari, 2002.Ben-Ari Y. Excitatory actions of GABA during development: the nature of the nurture. Nat Rev Neurosci. 2002;3:728–739. doi: 10.1038/nrn920. [DOI] [PubMed] [Google Scholar]
- Ben-Ari et al., 1989.Ben-Ari Y, Cherubini E, Corradetti R, Gaiarsa J-L. Giant synaptic potentials in immature rat CA3 hippocampal neurones. J Physiol (Lond) 1989;416:303–325. doi: 10.1113/jphysiol.1989.sp017762. [DOI] [PMC free article] [PubMed] [Google Scholar]
- Bormann et al., 1987.Bormann J, Hamill OP, Sakmann B. Mechanism of anion permeation through channels gated by glycine and gamma-aminobutyric acid in mouse cultured spinal neurones. J Physiol (Lond) 1987;385:243–286. doi: 10.1113/jphysiol.1987.sp016493. [DOI] [PMC free article] [PubMed] [Google Scholar]
- Chan and Yeh, 2003.Chan CH, Yeh HH. Enhanced GABA(A) receptor-mediated activity following activation of NMDA receptors in Cajal-Retzius cells in the developing mouse neocortex. J Physiol (Lond) 2003;550:103–111. doi: 10.1113/jphysiol.2003.042556. [DOI] [PMC free article] [PubMed] [Google Scholar]
- Clayton et al., 1998.Clayton GH, Owens GC, Wolff JS, Smith RL. Ontogeny of cation-Cl− cotransporter expression in rat neocortex. Dev Brain Res. 1998;109:281–292. doi: 10.1016/s0165-3806(98)00078-9. [DOI] [PubMed] [Google Scholar]
- D'Arcangelo et al., 1997.D'Arcangelo G, Nakajima K, Miyata T, Ogawa M, Mikoshiba K, Curran T. Reelin is a secreted glycoprotein recognized by the CR-50 monoclonal antibody. J Neurosci. 1997;17:23–31. doi: 10.1523/JNEUROSCI.17-01-00023.1997. [DOI] [PMC free article] [PubMed] [Google Scholar]
- De Bergeyck et al., 1998.De Bergeyck V, Naerhuyzen B, Goffinet AM, De Rouvroit CL. A panel of monoclonal antibodies against reelin, the extracellular matrix protein defective in reeler mutant mice. J Neurosci Methods. 1998;82:17–24. doi: 10.1016/s0165-0270(98)00024-7. [DOI] [PubMed] [Google Scholar]
- Delpire, 2000.Delpire E. Cation-chloride cotransporters in neuronal communication. News Physiol Sci. 2000;15:309–312. doi: 10.1152/physiologyonline.2000.15.6.309. [DOI] [PubMed] [Google Scholar]
- Dupont et al., 2006.Dupont E, Hanganu IL, Kilb W, Hirsch S, Luhmann HJ. Rapid developmental switch in the mechanisms driving early cortical columnar networks. Nature. 2006;439:79–83. doi: 10.1038/nature04264. [DOI] [PubMed] [Google Scholar]
- Fricker et al., 1999.Fricker D, Verheugen JA, Miles R. Cell-attached measurements of the firing threshold of rat hippocampal neurones. J Physiol (Lond) 1999;517:791–804. doi: 10.1111/j.1469-7793.1999.0791s.x. [DOI] [PMC free article] [PubMed] [Google Scholar]
- Fukuda et al., 1998.Fukuda A, Tanaka M, Yamada Y, Muramatsu K, Shimano Y, Nishino H. Simultaneous optical imaging of intracellular Cl- in neurons in different layers of rat neocortical slices: advantages and limitations. Neurosci Res. 1998;32:363–371. doi: 10.1016/s0168-0102(98)00099-6. [DOI] [PubMed] [Google Scholar]
- Gao et al., 1998.Gao XB, Chen G, van den Pol AN. GABA-dependent firing of glutamate-evoked action potentials at AMPA/kainate receptors in developing hypothalamic neurons. J Neurophysiol. 1998;79:716–726. doi: 10.1152/jn.1998.79.2.716. [DOI] [PubMed] [Google Scholar]
- Hubner et al., 2001.Hubner CA, Stein V, Hermans-Borgmeyer I, Meyer T, Ballanyi K, Jentsch TJ. Disruption of KCC2 reveals an essential role of K-Cl cotransport already in early synaptic inhibition. Neuron. 2001;30:515–524. doi: 10.1016/s0896-6273(01)00297-5. [DOI] [PubMed] [Google Scholar]
- Ikeda et al., 2003.Ikeda M, Toyoda H, Yamada J, Okabe A, Sato K, Hotta Y, Fukuda A. Differential development of cation-chloride cotransporters and Cl- homeostasis contributes to differential GABAergic actions between developing rat visual cortex and dorsal lateral geniculate nucleus. Brain Res. 2003;984:149–159. doi: 10.1016/s0006-8993(03)03126-3. [DOI] [PubMed] [Google Scholar]
- Kaila, 1994.Kaila K. Ionic basis of GABAA receptor channel function in the nervous system. Prog Neurobiol. 1994;42:489–537. doi: 10.1016/0301-0082(94)90049-3. [DOI] [PubMed] [Google Scholar]
- Kakazu et al., 1999.Kakazu Y, Akaike N, Komiyama S, Nabekura J. Regulation of intracellular chloride by cotransporters in developing lateral superior olive neurons. J Neurosci. 1999;19:2843–2851. doi: 10.1523/JNEUROSCI.19-08-02843.1999. [DOI] [PMC free article] [PubMed] [Google Scholar]
- Kakazu et al., 2000.Kakazu Y, Uchida S, Nakagawa T, Akaike N, Nabekura J. Reversibility and cation selectivity of the K(+)-Cl(−) cotransport in rat central neurons. J Neurophysiol. 2000;84:281–288. doi: 10.1152/jn.2000.84.1.281. [DOI] [PubMed] [Google Scholar]
- Kanaka et al., 2001.Kanaka C, Ohno K, Okabe A, Kuriyama K, Itoh T, Fukuda A, Sato K. The differential expression patterns of messenger RNAs encoding K-Cl cotransporters (KCC1,2) and Na-K-2Cl cotransporter (NKCC1) in the rat nervous system. Neuroscience. 2001;104:933–946. doi: 10.1016/s0306-4522(01)00149-x. [DOI] [PubMed] [Google Scholar]
- Khalilov et al., 2005.Khalilov I, Le Van QM, Gozlan H, Ben Ari Y. Epileptogenic actions of GABA and fast oscillations in the developing hippocampus. Neuron. 2005;48:787–796. doi: 10.1016/j.neuron.2005.09.026. [DOI] [PubMed] [Google Scholar]
- Kikkawa et al., 2003.Kikkawa S, Yamamoto T, Misaki K, Ikeda Y, Okado H, Ogawa M, Woodhams PL, Terashima T. Missplicing resulting from a short deletion in the reelin gene causes reeler-like neuronal disorders in the mutant shaking rat Kawasaki. J Comp Neurol. 2003;463:303–315. doi: 10.1002/cne.10761. [DOI] [PubMed] [Google Scholar]
- Kilb and Luhmann, 2000.Kilb W, Luhmann HJ. Characterization of a hyperpolarization-activated inward current in Cajal-Retzius cells in rat neonatal neocortex. J Neurophysiol. 2000;84:1681–1691. doi: 10.1152/jn.2000.84.3.1681. [DOI] [PubMed] [Google Scholar]
- Kilb and Luhmann, 2001.Kilb W, Luhmann HJ. Spontaneous GABAergic postsynaptic currents in Cajal-Retzius cells in neonatal rat cerebral cortex. Eur J Neurosci. 2001;13:1387–1390. doi: 10.1046/j.0953-816x.2001.01514.x. [DOI] [PubMed] [Google Scholar]
- Kilb et al., 2002.Kilb W, Ikeda M, Uchida K, Okabe A, Fukuda A, Luhmann HJ. Depolarizing glycine responses in Cajal-Retzius cells of neonatal rat cerebral cortex. Neuroscience. 2002;112:299–307. doi: 10.1016/s0306-4522(02)00071-4. [DOI] [PubMed] [Google Scholar]
- Kyrozis and Reichling, 1995.Kyrozis A, Reichling DB. Perforated-patch recording with gramicidin avoids artifactual changes in intracellular chloride concentration. J Neurosci Methods. 1995;57:27–35. doi: 10.1016/0165-0270(94)00116-x. [DOI] [PubMed] [Google Scholar]
- Lee et al., 2005.Lee H, Chen CX, Liu YJ, Aizenman E, Kandler K. KCC2 expression in immature rat cortical neurons is sufficient to switch the polarity of GABA responses. Eur J Neurosci. 2005;21:2593–2599. doi: 10.1111/j.1460-9568.2005.04084.x. [DOI] [PMC free article] [PubMed] [Google Scholar]
- Leinekugel et al., 1997.Leinekugel X, Medina I, Khalilov I, Ben Ari Y, Khazipov R. Ca2+ oscillations mediated by the synergistic excitatory actions of GABA(A) and NMDA receptors in the neonatal hippocampus. Neuron. 1997;18:243–255. doi: 10.1016/s0896-6273(00)80265-2. [DOI] [PubMed] [Google Scholar]
- Li et al., 2002.Li H, Tornberg J, Kaila K, Airaksinen MS, Rivera C. Patterns of cation-chloride cotransporter expression during embryonic rodent CNS development. Eur J Neurosci. 2002;16:2358–2370. doi: 10.1046/j.1460-9568.2002.02419.x. [DOI] [PubMed] [Google Scholar]
- Luhmann and Prince, 1991.Luhmann HJ, Prince DA. Postnatal maturation of the GABAergic system in rat neocortex. J Neurophysiol. 1991;65:247–263. doi: 10.1152/jn.1991.65.2.247. [DOI] [PubMed] [Google Scholar]
- Luhmann et al., 2000.Luhmann HJ, Reiprich RA, Hanganu I, Kilb W. Cellular physiology of the neonatal rat cerebral cortex: intrinsic membrane properties, sodium and calcium currents. J Neurosci Res. 2000;62:574–584. doi: 10.1002/1097-4547(20001115)62:4<574::AID-JNR12>3.0.CO;2-0. [DOI] [PubMed] [Google Scholar]
- Lytle et al., 1995.Lytle C, Xu JC, Biemesderfer D, Forbush B., III Distribution and diversity of Na-K-Cl cotransport proteins: a study with monoclonal antibodies. Am J Physiol. 1995;269:C1496–C1505. doi: 10.1152/ajpcell.1995.269.6.C1496. [DOI] [PubMed] [Google Scholar]
- Marchetti et al., 2005.Marchetti C, Tabak J, Chub N, O'Donovan MJ, Rinzel J. Modeling spontaneous activity in the developing spinal cord using activity-dependent variations of intracellular chloride. J Neurosci. 2005;25:3601–3612. doi: 10.1523/JNEUROSCI.4290-04.2005. [DOI] [PMC free article] [PubMed] [Google Scholar]
- Marty et al., 2002.Marty S, Wehrle R, Alvarez-Leefmans FJ, Gasnier B, Sotelo C. Postnatal maturation of Na+, K+, 2Cl- cotransporter expression and inhibitory synaptogenesis in the rat hippocampus: an immunocytochemical analysis. Eur J Neurosci. 2002;15:233–245. doi: 10.1046/j.0953-816x.2001.01854.x. [DOI] [PubMed] [Google Scholar]
- Mienville, 1998.Mienville JM. Persistent depolarizing action of GABA in rat Cajal-Retzius cells. J Physiol (Lond) 1998;512:809–817. doi: 10.1111/j.1469-7793.1998.809bd.x. [DOI] [PMC free article] [PubMed] [Google Scholar]
- Nilius and Droogmans, 2003.Nilius B, Droogmans G. Amazing chloride channels: an overview. Acta Physiol Scand. 2003;177:119–147. doi: 10.1046/j.1365-201X.2003.01060.x. [DOI] [PubMed] [Google Scholar]
- Okabe et al., 2004.Okabe A, Kilb W, Shimizu-Okabe C, Hanganu IL, Fukuda A, Luhmann HJ. Homogenous glycine receptor expression in cortical plate neurons and Cajal-Retzius cells of neonatal rat cerebral cortex. Neuroscience. 2004;123:715–724. doi: 10.1016/j.neuroscience.2003.10.014. [DOI] [PubMed] [Google Scholar]
- Owens and Kriegstein, 2002.Owens DF, Kriegstein AR. Is there more to GABA than synaptic inhibition? Nat Rev Neurosci. 2002;3:715–727. doi: 10.1038/nrn919. [DOI] [PubMed] [Google Scholar]
- Owens et al., 1996.Owens DF, Boyce LH, Davis MB, Kriegstein AR. Excitatory GABA responses in embryonic and neonatal cortical slices demonstrated by gramicidin perforated-patch recordings and calcium imaging. J Neurosci. 1996;16:6414–6423. doi: 10.1523/JNEUROSCI.16-20-06414.1996. [DOI] [PMC free article] [PubMed] [Google Scholar]
- Payne et al., 2003.Payne JA, Rivera C, Voipio J, Kaila K. Cation-chloride co-transporters in neuronal communication, development and trauma. Trends Neurosci. 2003;26:199–206. doi: 10.1016/S0166-2236(03)00068-7. [DOI] [PubMed] [Google Scholar]
- Penn and Shatz, 1999.Penn AA, Shatz CJ. Brain waves and brain wiring: the role of endogenous and sensory-driven neural activity in development. Pediatr Res. 1999;45:447–458. doi: 10.1203/00006450-199904010-00001. [DOI] [PubMed] [Google Scholar]
- Plotkin et al., 1997.Plotkin MD, Snyder EY, Hebert SC, Delpire E. Expression of the Na-K-2Cl cotransporter is developmentally regulated in postnatal rat brains: a possible mechanism underlying GABA's excitatory role in immature brain. J Neurobiol. 1997;33:781–795. doi: 10.1002/(sici)1097-4695(19971120)33:6<781::aid-neu6>3.0.co;2-5. [DOI] [PubMed] [Google Scholar]
- Represa and Ben Ari, 2005.Represa A, Ben Ari Y. Trophic actions of GABA on neuronal development. Trends Neurosci. 2005;28:278–283. doi: 10.1016/j.tins.2005.03.010. [DOI] [PubMed] [Google Scholar]
- Rivera et al., 1999.Rivera C, Voipio J, Payne JA, Ruusuvuori E, Lahtinen H, Lamsa K, Pirvola U, Saarma M, Kaila K. The K+/Cl− co-transporter KCC2 renders GABA hyperpolarizing during neuronal maturation. Nature. 1999;397:251–255. doi: 10.1038/16697. [DOI] [PubMed] [Google Scholar]
- Rohrbough and Spitzer, 1996.Rohrbough J, Spitzer NC. Regulation of intracellular Cl− levels by Na+-dependent Cl− cotransport distinguishes depolarizing from hyperpolarizing GABAA receptor-mediated responses in spinal neurons. J Neurosci. 1996;16:82–91. doi: 10.1523/JNEUROSCI.16-01-00082.1996. [DOI] [PMC free article] [PubMed] [Google Scholar]
- Russell, 2000.Russell JM. Sodium-potassium-chloride cotransport. Physiol Rev. 2000;80:211–276. doi: 10.1152/physrev.2000.80.1.211. [DOI] [PubMed] [Google Scholar]
- Shimizu-Okabe et al., 2002.Shimizu-Okabe C, Yokokura M, Okabe A, Ikeda M, Sato K, Kilb W, Luhmann HJ, Fukuda A. Layer-specific expression of Cl- transporters and differential [Cl-]i in newborn rat cortex. NeuroReport. 2002;13:2433–2437. doi: 10.1097/00001756-200212200-00012. [DOI] [PubMed] [Google Scholar]
- Sipila et al., 2006.Sipila ST, Schuchmann S, Voipio J, Yamada J, Kaila K. The Na-K-Cl cotransporter (NKCC1) promotes sharp waves in the neonatal rat hippocampus. J Physiol (Lond) 2006;573:765–773. doi: 10.1113/jphysiol.2006.107086. [DOI] [PMC free article] [PubMed] [Google Scholar]
- Soda et al., 2003.Soda T, Nakashima R, Watanabe D, Nakajima K, Pastan I, Nakanishi S. Segregation and coactivation of developing neocortical layer 1 neurons. J Neurosci. 2003;23:6272–6279. doi: 10.1523/JNEUROSCI.23-15-06272.2003. [DOI] [PMC free article] [PubMed] [Google Scholar]
- Soriano and Del Rio, 2005.Soriano E, Del Rio JA. The cells of Cajal-Retzius: still a mystery one century after. Neuron. 2005;46:389–394. doi: 10.1016/j.neuron.2005.04.019. [DOI] [PubMed] [Google Scholar]
- Staley and Mody, 1992.Staley KJ, Mody I. Shunting of excitatory input to dentate gyrus granule cells by a depolarizing GABAA receptor-mediated postsynaptic conductance. J Neurophysiol. 1992;68:197–212. doi: 10.1152/jn.1992.68.1.197. [DOI] [PubMed] [Google Scholar]
- Sterling and Casey, 2002.Sterling D, Casey JR. Bicarbonate transport proteins. Biochem Cell Biol. 2002;80:483–497. doi: 10.1139/o02-152. [DOI] [PubMed] [Google Scholar]
- Titz et al., 2003.Titz S, Hans M, Kelsch W, Lewen A, Swandulla D, Misgeld U. Hyperpolarizing inhibition develops without trophic support by GABA in cultured rat midbrain neurons. J Physiol (Lond) 2003;550:719–730. doi: 10.1113/jphysiol.2003.041863. [DOI] [PMC free article] [PubMed] [Google Scholar]
- Tyzio et al., 2003.Tyzio R, Ivanov A, Bernard C, Holmes GL, Ben Ari Y, Khazipov R. Membrane potential of CA3 hippocampal pyramidal cells during postnatal development. J Neurophysiol. 2003;90:2964–2972. doi: 10.1152/jn.00172.2003. [DOI] [PubMed] [Google Scholar]
- Verkman et al., 1989.Verkman AS, Sellers MC, Chao AC, Leung T, Ketcham R. Synthesis and characterization of improved chloride-sensitive fluorescent indicators for biological applications. Anal Biochem. 1989;178:355–361. doi: 10.1016/0003-2697(89)90652-0. [DOI] [PubMed] [Google Scholar]
- Yamada et al., 2004.Yamada J, Okabe A, Toyoda H, Kilb W, Luhmann HJ, Fukuda A. Cl- uptake promoting depolarizing GABA actions in immature rat neocortical neurones is mediated by NKCC1. J Physiol (Lond) 2004;557:829–841. doi: 10.1113/jphysiol.2004.062471. [DOI] [PMC free article] [PubMed] [Google Scholar]
- Zhang et al., 2006.Zhang LL, Pathak HR, Coulter DA, Freed MA, Vardi N. Shift of intracellular chloride concentration in ganglion and amacrine cells of developing mouse retina. J Neurophysiol. 2006;95:2404–2416. doi: 10.1152/jn.00578.2005. [DOI] [PubMed] [Google Scholar]