

Abstract
The hyperpolarization-activated cation current Ih exhibits a steep gradient of channel density in dendrites of pyramidal neurons, which is associated with location independence of temporal summation of EPSPs at the soma. In striking contrast, here we show by using dendritic patch-clamp recordings that in cerebellar Purkinje cells, the principal neurons of the cerebellar cortex, Ih exhibits a uniform dendritic density, while location independence of EPSP summation is observed. Using compartmental modeling in realistic and simplified dendritic geometries, we demonstrate that the dendritic distribution of Ih only weakly affects the degree of temporal summation at the soma, while having an impact at the dendritic input location. We further analyze the effect of Ih on temporal summation using cable theory and derive bounds for temporal summation for any spatial distribution of Ih. We show that the total number of Ih channels, not their distribution, governs the degree of temporal summation of EPSPs. Our findings explain the effect of Ih on EPSP shape and temporal summation, and suggest that neurons are provided with two independent degrees of freedom for different functions: the total amount of Ih (controlling the degree of temporal summation of dendritic inputs at the soma) and the dendritic spatial distribution of Ih (regulating local dendritic processing).
Keywords: dendrite, synaptic integration, patch clamp, Purkinje cell, modeling, pyramidal cell, temporal summation
Introduction
The hyperpolarization-activated cation current (Ih) is expressed in many neurons in the CNS. Ih is one of only a few voltage-dependent currents activated at resting membrane potential. The combination of its “inverted” voltage-dependent activation properties and its suprathreshold reversal potential gives Ih a unique signature in its contribution to neuronal excitability. Ih has been ascribed a plethora of functions in neurons (Robinson and Siegelbaum, 2003), probably the most recognized being its role in synaptic integration (Magee, 1999; Williams and Stuart, 2000; Berger et al., 2001), where Ih has been shown to shorten the width of postsynaptic potentials (PSPs) and dampen the summation of trains of inputs. The magnitude of this effect is distance dependent: Ih has a large effect on PSPs originating in the distal dendrites and a smaller effect on proximal inputs. Thus, regardless of their origin, all PSPs arriving at the soma have similar widths, and thus Ih is said to normalize the broadening effect of dendritic filtering on synaptic input.
Previous studies using dendritic cell-attached patch-clamp recordings have shown that, in hippocampal CA1 and layer 5 neocortical pyramidal neurons, Ih shows a pronounced increase in density along the dendrites (Magee, 1998; Williams and Stuart, 2000; Berger et al., 2001; Kole et al., 2006). These gradients have recently been confirmed on the ultrastructural level using EM immunogold techniques (Lörincz et al., 2002; Notomi and Shigemoto, 2004). This striking nonuniform distribution has led to the assumption that there is a tight link between the role of Ih in temporal summation and its high density in distal dendritic branches.
Purkinje cells exhibit a significant Ih (Crepel and Penit-Soria, 1986; Roth and Häusser, 2001; Williams et al., 2002), which is linked to HCN1 expression (Nolan et al., 2003). Given the differences in dendritic structure and excitability between Purkinje cells and pyramidal neurons, it is important to establish whether a dendritic gradient of Ih also exists in Purkinje cells, and how the Ih distribution influences synaptic integration in these neurons.
We used cell-attached patch-clamp recordings to map the distribution and characterize the kinetics of Ih in Purkinje neurons, and demonstrated that Ih exhibits a uniform dendritic density. We used simultaneous whole-cell somatic and dendritic recordings to explore the effect of the current on single and multiple synaptic inputs, and found that, as in pyramidal neurons, Ih shortens EPSP duration and minimizes EPSP summation. Despite the conductance change accompanying activation of Ih, its effect on synaptic integration was linear. Analyzing this linearity shows that it is crucial for understanding how Ih contributes to normalization of summation. To dissect the contribution of Ih to the integration of synaptic inputs, we used detailed and simplified compartmental models. Our simulations reveal that normalization of EPSP summation can be achieved with uniform as well as nonuniform distributions of Ih. We also define the boundaries of maximum and minimum summation for practically any spatial distribution of Ih. These findings provide a deeper understanding of the contribution of Ih to the regulation of the input–output functions of neurons.
Materials and Methods
Slice preparation and electrophysiology.
All experiments were performed using acute cerebellar slices prepared using standard techniques in accordance with institutional and national regulations. Sprague Dawley rats [postnatal day 18 (P18) to P25] were anesthetized with isoflurane (Abbott Labs, Kent, UK) and decapitated. At this age, HCN1 expression in the cerebellum as detected by immunoblotting has reached a steady state (Lujan et al., 2005). The cerebellum was surgically dissected and cut sagittally at a slice thickness of 250 μm on a vibratome (VT1000S; Leica Microsystems, Nussloch, Germany). Before recording slices were incubated for 30–45 min at 32°C in external solution bubbled with 95% O2 and 5% CO2. The standard external recording solution contained the following (in mm): 125 NaCl, 2.5 KCl, 2 CaCl2, 1 MgCl2, 25 NaHCO3, 1.25 NaH2PO4, and 25 d-glucose.
Neurons were visualized with a 60× water immersion objective (LUMPlanFI/IR; Olympus, Tokyo, Japan) using infrared (IR)-differential interference contrast optics on an Olympus microscope (BX51WI) equipped with an IR camera (C2400-07; Hamamatsu, Tokyo, Japan) connected to a video monitor. Pipettes were prepared from thick-walled filamented borosilicate glass capillaries (Harvard Apparatus, Kent, UK) pulled on a two-stage puller (model PC-10; Narishige, Tokyo, Japan) with tip resistances between 4 and 6 MΩ and between 7 and 9 MΩ for whole-cell somatic and dendritic recording, respectively. In all cell-attached experiments, the pipette resistance was standardized at 10 MΩ to minimize variations in patch area. The composition of the internal solution was as follows (in mm): 130 methanesulfonic acid (Fluka, Buchs, Switzerland), 10 HEPES, 7 KCl, 0.05 EGTA (Fluka), 2 Na2ATP, 2 MgATP, 0.5 Na2GTP, and 4% biocytin, KOH titrated to pH 7.2. Cell-attached pipettes were filled with high potassium solution of the following composition (in mm): 120 KCl, 2 CaCl2, 1 MgCl2, 10 HEPES, 20 tetraethylammonium-Cl, 5 4-aminopyridine, 1 BaCl2, 0.02 CdCl2, and 200 nm TTX (Tocris Cookson, Bristol, UK). The osmolarity was adjusted to 290 mOsm with d-glucose, and the pH was titrated to 7.4 with KOH. The Ih blocker 4-(N-ethyl-N-phenylamino)-1,2-dimethyl-6-(methylamino)pyridinum chloride (ZD 7288) (Tocris) was dissolved in distilled water to a stock concentration of 10 mm and diluted in the external solution to a final concentration of 40 μm. To prevent spontaneous firing during cell-attached recording, 200 nm TTX was added to the external solution.
Recordings were performed using a Multiclamp 700A amplifier (Molecular Devices, Palo Alto, CA) connected to a Macintosh computer via an ITC-18 board (Instrutech, Port Washington, NY). Data were acquired with Axograph (version 4.9). The current-clamp signal was Bessel filtered at 6 kHz and sampled at 20 kHz. Whole-cell dendritic recordings were discarded if the access increased >50 MΩ. PSPs were mimicked by injecting double-exponential current waveforms (τrise, 0.3 ms; τdecay, 3 ms). All voltage recordings shown are the average of between 20 and 25 single traces. The cell-attached voltage-clamp recordings were Bessel filtered at 1–2 kHz and acquired at 10 kHz. Leak subtraction of cell-attached data were done either on-line by running a P/N leak subtraction protocol in Axograph, or off-line. The liquid junction potential (+9.3 mV and +3 mV for the whole-cell and the cell-attached solutions, respectively) was not corrected for. For cell-attached recordings, the resting membrane potential was determined by recording the membrane potential immediately after break-in (−51.8 ± 0.8 mV; n = 40; in the presence of TTX). All data analysis was performed in Igor Pro (Wavemetrics, Lake Oswego, OR) using Neuromatic (courtesy of Jason Rothman, University College London, London, UK). The rise time of simulated EPSPs (sEPSPs) was measured between 20 and 80% of the peak amplitude. The integral of single sEPSPs is calculated as the area, normalized to peak amplitude, from the beginning of the voltage response to 312.5 ms after.
Computer modeling.
All simulations were performed using NEURON, version 5.7 (Hines and Carnevale, 1997). The cylinder model had the following passive properties: Rm = 20,000 Ωcm2, Ri = 200 Ωcm, Cm = 1 μF/cm2, whereas dendritic trees in Figure 4 had Rm = 50,000 Ωcm2, Ri = 70 Ωcm, Cm = 0.85 μF/cm2. These values were corrected for spines by scaling membrane conductance (both passive and gh) as well as Cm by a factor of 2. For simulations using realistic dendritic morphologies, we used reconstructions of layer 5 pyramidal cells, Purkinje cells, and CA1 pyramidal cells, taken from the Dendritica software package (www.dendrites.org) (Vetter et al., 2001). The cells that are presented in Figure 4 are “Rapp_cell3” (Purkinje), “913c.hoc” (CA1), and “p21.hoc” (pyramidal). For each cell, we divided the compartments to 10 groups according to their distance from the soma, and selected at random 10 locations from each group to obtain a total of 100 random locations spanning the whole tree. We computed the summation for each one of the locations for each of the distributions and for each density. To obtain a quantitative measure of the degree of normalization, we computed the SD of the summation as a function of distance over the 100 locations. For each cell and for every density, we also simulated the case in which gh follows a linear gradient with distance from the soma (Fig. 4D). The slope of the gradient was computed such that the integral of gh over the whole dendrite (including spine correction) will be identical with its value in the corresponding uniform case. Similarly for the exponential distribution, we followed the formula described by Kole et al. (2006) and normalized the conductance to have the same average gh over the tree. Kinetics of input currents were identical with those used in the experiments. We used fixed time steps with dt = 0.1 ms, because using finer time steps did not produce any apparent difference. In simulations in which the total density of Ih was changed, this manipulation led to changes in the resting membrane potential (Vrest). This change in Vrest makes it more difficult to compare different cases. To keep the dynamics comparable between similar conditions, we computed for each Ih density the value of Eleak that keeps Vrest at −70 mV when Ih is uniformly distributed. Changing the spatial distribution of Ih also affects Vrest at each compartment. For reasons of simplicity and analytical tractability, in the simulations involving cylinders (Figs. 5, 6), we thus changed Eleak in each compartment, such that even when Ih is not uniform, Vrest is still uniform. Note, however, that in Figure 4, once Eleak was computed for the uniform distribution for a given gh density, no additional adjustments were made for the nonuniform case, which means that the resting potential in different compartments was different, with differences reaching 10 mV in the case of layer 5 pyramidal neurons in Figure 4.
Figure 4.

The effect of Ih spatial distribution and density on temporal summation in models of dendritic neurons with realistic morphology. Three dendritic morphologies: cerebellar Purkinje cell (top row), CA1 pyramidal (middle row), and cortical layer 5 pyramidal neurons (bottom row) were modeled with uniform (C), linear gradient (D), and exponential (E) distributions of gh conductance (see Materials and Methods). Scale bar, 100 μm. For each cell type, we started with gh = 0.00005 S/cm2 and repeated the simulation 12 times (only 6 densities are depicted), each time gradually increasing the density by 0.00003 S/cm2 (C, top: low density to high density). For each of the neurons and each of the profiles of spatial distributions, there exists a density that results in location-independent temporal summation. B compares the voltage response at the soma for a somatic and dendritic current injection (cyan spots in A) for case of a uniform distribution shown in F. F shows the temporal summation for the Ih density for which the uniform distribution shows the best location independence of temporal summation (black). Also depicted are the summation for the linear gradient (red) and the exponential (blue) with the same average gh and the case in which Ih is absent (passive; green). In G, we quantify the degree of normalization for 12 neurons (4 of each type). For each distribution, we pick the optimal density for normalization and plot the SD of the summation (expressed as root mean square deviation) for this case. Colors are as in other panels.
Figure 5.
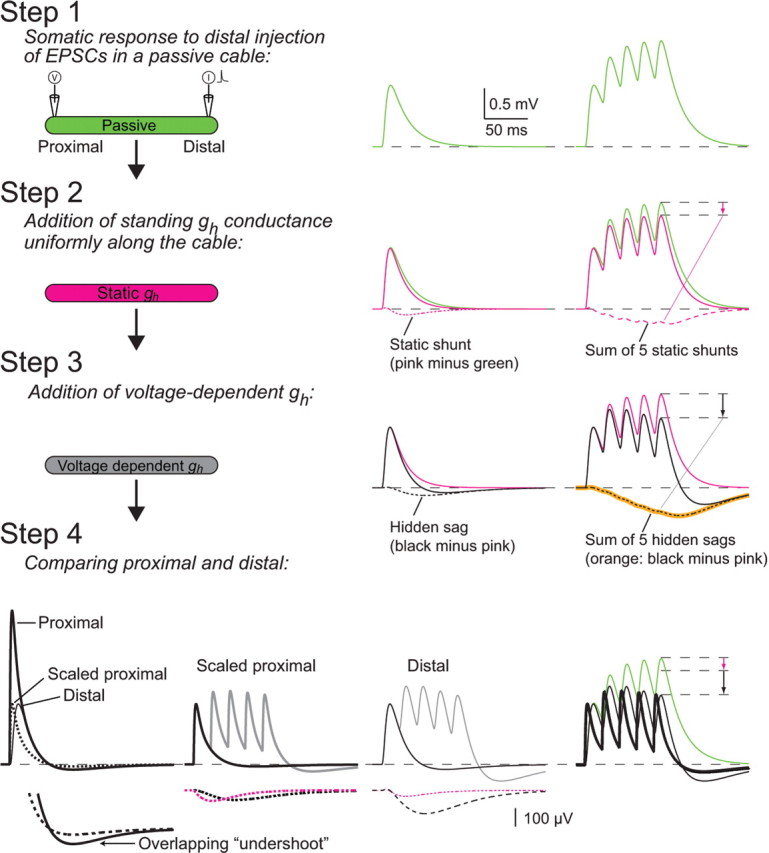
The mechanisms underlying normalization of temporal summation by Ih. Step 1, We compared the responses to a single input (double exponential current with τrise = 0.3 ms and τdecay = 3 ms) (left panel) and a train of five consecutive inputs at 50 Hz (right panel) at a distal location (x = 0.9 λ) on a passive cylinder of unit electrotonic length (Rm = 20,000 Ωcm2; Ri = 200 Ωcm; d = 4 μm; l = 1000 μm), recorded at the proximal location (X = 0) (see inset). Step 2, A uniform gh conductance was added (0.00011 S/cm2) [see Materials and Methods and supplemental Fig. 1 (available at www.jneurosci.org as supplemental material)]. The open conductance at an initial potential of −70 mV was computed (0.000012 S/cm2), and the conductance was fixed to that value during the whole simulation. The current injections at step 1 were repeated, and the response (pink line) was recorded at the proximal location. By subtracting the response in step 1 (green) from the response in step 2 (pink), we obtain the static shunt (dashed pink). Note that this is a small, but slow effect, and thus it summates more than the peak of the sEPSPs (arrow, right panel). Step 3, The constraint on Ih was released and the same simulation was repeated with voltage-dependent Ih (compare with control in the experiments). By subtracting the resulting sEPSPs (black) from those of step 2 (pink), we obtain the hidden sag, the net effect of the voltage-sensitive action of Ih (dashed black line), which is also slow and exhibits significant summation (black arrow). This analysis depends on Ih behaving linearly (Fig. 3D,E; supplemental Figs. 1, 2, available at www.jneurosci.org as supplemental material), and indeed we can predict the hidden sag of the train by a linear sum of the hidden sags associated with a single sEPSP (overlay of dashed black and orange lines in the right panel). Step 4, The voltage response in the proximal location is compared (in control conditions) for proximal and distal current injections (left panel). The peak response for the distal input is greatly attenuated; however, the undershoot of the distal response is identical to the proximal (see enlarged “overlapping undershoot,” left panel, bottom). This indicates that the sag and the peak of the response are filtered differentially by the cable. When the current amplitude at the proximal location is decreased to equalize the peaks (left panel, dashed, “scaled proximal”), the static shunt and hidden sag (from steps 2 and 3) for the distal injection are both larger than for the proximal input (middle panels, bottom, dashed traces; note enlarged scale). When comparing the summation of a train from a distal and proximal inputs, the joint effect of larger summation of small but slow sag signals and the larger sags for the distal locations, leads to similar reduction in temporal summation for both distal and proximal inputs.
Figure 6.

Differential filtering of peak and sag for different spatial distributions. A1, Two models were used, a cylinder with uniform gh (identical to the model in Fig. 5), and a nonuniform model, identical to the uniform model, with the exception that the total amount of gh was concentrated in the distal compartment. A2, The degree of temporal summation of five inputs measured at the proximal end of the cylinder (X = 0) in the control (uniform) and the nonuniform distribution models as a function of input location along the cylinder. Also depicted is the passive case (green). A3, The degree of temporal summation in the corresponding “static Ih” cases (as described in Fig. 5, step 2). B1 depicts the sEPSP measured in the proximal terminal in response to current injection at the same proximal location for both the uniform (solid black) and nonuniform (solid blue) distributions. Also shown are the corresponding hidden sags (dashed). B2, The local voltage response when the current is injected in the distal terminal. Again, the local hidden sag is also shown. B3, Propagated sEPSP and hidden sags when current is injected distally and voltage recorded proximally. C1 depicts the peak amplitude of the local hidden sag (see B2) as a function of input location. C2, The propagated hidden sag (example in B3). Same as C1, only the voltage response was measured at X = 0. C3, Comparison of the attenuation of voltage peak (solid lines) and hidden sag (dashed lines) for the two distributions as a function of input location. Peak attenuation was computed as the peak amplitude of the propagated voltage response divided by the local amplitude. Similarly sag attenuation is the amplitude of the propagated sag divided by the local sag.
The nonlinear kinetic model of Ih is given by the following set of equations:
 |
where Ih is a current density in units of milliamperes per square centimeter, V is the membrane potential in millivolts, Eh = −34.4 mV is the reversal potential of Ih, ḡh is the maximal conductance (millisiemens per square centimeter), and q is the time- and voltage-dependent activation variable, dictating the active proportion of the total conductance. q∞ sets the steady state of the activation variable according to the sigmoidal function, and τh is the voltage-dependent time constant in milliseconds with which q approaches q∞. All of the kinetic parameters were obtained by fitting the data from cell-attached recordings shown in Figure 1(see also supplemental Fig. 1, available at www.jneurosci.org as supplemental material). Note that, in contrast to Hodgkin–Huxley type models, here q∞ and τh are independent. Moreover, we used a single function to describe τh, which fits both the activation and deactivation time constant obtained from the data. In the simulation using reconstructions of CA1 pyramidal neurons and layer 5 pyramidal neurons, τh was sped up by a factor of 4, because these cell types exhibit approximately three to five times faster Ih activation kinetics compared with Purkinje cells, depending on membrane potential (Magee, 1998; Williams and Stuart, 2000; Berger et al., 2001). The simulations in Figure 4 were tested with both fast and slow Ih, giving no significant difference in the results (data not shown). This factor of 4 acceleration in the kinetics was also used in all simulations involving cylinders.
Figure 1.

Properties and distribution of Ih in Purkinje cells. A1, Ih recorded in a dendritic cell-attached patch-clamp recording 93 μm from the soma. The patch was held at −52 mV and hyperpolarized for 1 s in steps of 10 mV from −52 to −142 mV. Tail currents evoked by stepping back to −52 mV for 200 ms are expanded. A2, Activation curve of the Ih current in A1. The peak tail currents (*) are normalized to the top plateau of a Boltzmann function. The solid line represents a sigmoidal fit to the data points giving a midpoint of activation at −91.1 mV with a slope constant of −9.1 mV (sigmoidal fit to the mean ± SEM of 5 recordings: V1/2 = −90.3 mV, slope constant = −9.7 mV). A3, Time constants of Ih activation and deactivation. The time constants were obtained by fitting single exponentials to traces in which the Ih current is activated from the closed state or deactivated from a maximally open state at potentials between −142 and −82 mV (open) and between −72 and −52 mV (filled), respectively (n = 5). B, Distribution of Ih along the soma–dendritic axis. The steady-state Ih amplitudes from full activation of the current at −142 mV (inset, arrow) are plotted as a function of distance from the soma (n = 53 cell-attached patches). A straight line with a slope of −3 pA/100 μm is fitted to the data points.
We also derived a linearized model of Ih using a quasiactive description from the above nonlinear model (Koch, 1984; Cox and Griffith, 2001). In this model (supplemental Figs. 1, 2, available at www.jneurosci.org as supplemental material), the activation variable is voltage dependent, but in a linear manner. Assuming V0 is the resting membrane potential, then Ih is given by the following equations:
 |
where q∞ and τh are identical with the previous model, q′∞(V0) is the derivative of the sigmoidal activation function q∞ at V0 given by the following:
 |
Note that in the first equation the first component describes the standing current attributable to the open conductance at V0, whereas the second part is the linear component of the voltage dependence of the current. Also important to note is that the time constant of the activation variable is fixed to its value at the holding potential.
Results
Kinetics and distribution of the Ih current in Purkinje cells
We determined the kinetics and distribution of Ih in Purkinje cells using cell-attached patch-clamp recordings from the soma and dendrites of neurons visualized in cerebellar slices. Figure 1 shows an example of the properties of Ih in dendritic cell-attached recordings. The current activates with hyperpolarization beyond −60 mV and has a midpoint of activation at −91 mV (Fig. 1A2) with steady state attained within 25–300 ms depending on the degree of hyperpolarization (Fig. 1A3). The time constants of activation and deactivation were determined using single exponential fits and were slower than those of Ih in pyramidal neurons, which activates three to five times faster when measured under similar conditions (Magee, 1998; Williams and Stuart, 2000; Berger et al., 2001).
To determine the spatial distribution of Ih, cell-attached recordings were made using pipettes of the same tip size (estimated by pipette resistance) at different distances from the soma along the dendrite. The steady-state current measured at −142 mV is plotted as a function of the distance from the soma in Figure 1B. The apparent Ih current density was highly variable from patch to patch, both for somatic and dendritic patches. Mean current amplitude was 9.5 ± 1.2 pA (n = 53) at the dendritic recording sites and 1.2 ± 0.3 pA (n = 23) at the soma. A linear regression to the dendritic data points demonstrates that Ih has a uniform dendritic distribution (slope, −3 pA/100 μm; not significantly different from zero slope, p > 0.2).
Effect of Ih on PSP waveforms
To determine how Ih in Purkinje cells shapes synaptic potentials, we injected synaptic current waveforms via a dendritic whole-cell recording and measured the resulting sEPSPs at the soma. We used the Ih blocker ZD 7288 (BoSmith et al., 1993; Gasparini and DiFrancesco, 1997), which blocks the hyperpolarizing “sag” and Ih in Purkinje cells (Roth and Häusser, 2001; Williams et al., 2002), to identify the contribution of Ih. After wash-in of ZD 7288, Purkinje neurons hyperpolarize, indicating the presence of an Ih conductance “at rest.” To study the effect of Ih on the shape of a synaptic potential in isolation of its effect on spontaneous firing (Häusser and Clark, 1997; Williams et al., 2002), and to achieve comparable conditions in control and in ZD 7288, neurons were held at −70 mV using holding current. Figure 2A shows an example of somatic sEPSPs resulting from dendritic waveform injection (134 μm from the soma; see inset) in control conditions and after wash-in of ZD 7288. As expected, the peak amplitude of the propagated signals is attenuated because of dendritic filtering (Fig. 2A, top vs bottom panel). Superposition of the control and ZD 7288 traces for both somatic and dendritic current injections (Fig. 2A, right panels) shows that blocking Ih has little effect on sEPSP rise time and peak, but slows the decay and blocks the undershoot of the sEPSP. This results in increased half-widths both for the somatic and the propagated sEPSP (an effect that is also revealed in the integral of the sEPSP) (Fig. 2D). The effect of input location on sEPSP width recorded at the soma is illustrated by overlaying sEPSPs from somatic and dendritic injections in control and in ZD 7288 conditions (Fig. 2B). This comparison reveals that the half-width of the propagated sEPSP is only slightly larger than that of the somatically generated sEPSP, both with and without Ih, indicating that Ih does not have a strong distance-dependent effect on somatic sEPSP half-width.
Figure 2.

Effect of Ih on single sEPSP waveforms. A, Somatic sEPSP traces from a simultaneous dendritic and somatic current-clamp recording (see inset). sEPSPs were evoked by injection of an EPSC-like double-exponential waveform (τrise = 0.3 ms; τdecay = 3 ms; 500 pA). Control and ZD 7288 traces from the same experiment are overlaid to allow for a direct comparison of the shape of the sEPSPs with and without Ih. The thin and thick lines represent responses to somatic and dendritic current injections, respectively. B, The propagated sEPSP from injection at the dendritic location (134 μm) was superimposed and scaled to the peak of the sEPSP from injection at the soma to show the effect of distance on the PSPs. Waveforms in both the control situation (open) and after application of ZD 7288 (red) are presented. The rise time (C) and integral (D) of somatic sEPSPs are plotted as a function of distance from the injection site. The data points at the soma are the mean ± SEM of 7–20 recordings including 3–5 double somatic recordings.
We examined how the effect of Ih on somatic sEPSP shape depends on dendritic location by injecting the synaptic current waveform at different distances from the soma. As expected from dendritic filtering, the 20–80% rise times of somatic sEPSPs depended on their dendritic origin (Fig. 2C) (slopectrl = 2.2 ± 0.2 ms/100 μm; slopeZD = 2.5 ± 0.2 ms/100 μm; p < 0.05 compared with zero slope). In contrast, there was no significant location dependence of somatically recorded sEPSP integrals for dendritic inputs at different distances from the soma (Fig. 2D) (slopectrl = 5.7 ± 7.1 mV · ms/100 μm; p > 0.05 compared with zero slope). Application of ZD 7288 significantly increased somatic sEPSP integrals (31 ± 4 mV · ms in control; 122 ± 5 mV · ms in ZD 7288; mean ± SEM of all inputs; p < 0.05). However, there was also no dendritic location dependence in the presence of ZD 7288 (Fig. 2D) (slopeZD = 1.4 ± 9.7 mV · ms/100 μm; p > 0.05 compared with zero slope).
We next explored the effect of Ih on summation of multiple sEPSPs by injecting trains of five EPSCs at 50 Hz at various somatic and dendritic locations while recording the somatic sEPSP (Fig. 3A). Temporal summation was defined as the increase in sEPSP peak resulting from the fifth relative to the first current waveform injection (Magee, 1999). In control conditions, somatic sEPSP summation did not exhibit significant location dependence for dendritic inputs at different distances from the soma (Fig. 3C) (slopectrl = 21 ± 19%/100 μm; p > 0.05 compared with zero slope). The degree of sEPSP summation was significantly enhanced in ZD 7288 compared with control (Fig. 3A). In addition to producing an upward shift on the y-axis (Fig. 3C) (shiftsEPSP = 134 ± 48%; p < 0.05), ZD 7288 also increased the slope of the relationship between summation and dendritic location of inputs (Fig. 3C) (slopeZD = 46 ± 14%/100 μm; p < 0.05 compared with zero slope). Thus, although summation is location independent in control, block of Ih reveals slight location dependence, indicating that Ih helps to generate normalization of temporal summation in Purkinje cells. Similar results were found with respect to injections of single and trains of hyperpolarizing sIPSP waveforms (data not shown).
Figure 3.

Effect of Ih on summation of sEPSPs. A, Representative somatic sEPSP traces from injection of five EPSC-like waveforms at a frequency of 50 Hz in the presence and absence of ZD 7288. The control and ZD 7288 traces from the same recording are overlaid according to injection site (somatic or dendritic). The thin and thick lines represent responses to somatic and dendritic current injections, respectively. This comparison directly shows the effect of Ih on summation for the two injection sites. B, The somatic voltage response from a dendritic injection at 140 μm from the soma was scaled to peak of and superimposed on the voltage response from a somatic injection. Note the small effect of distance on summation both in control and in ZD 7288. C, Pooled data from experiments performed according to the experiment in A. The dendritic pipette was positioned at different locations on the dendritic tree up to a maximum of 190 μm from the soma. The summation recorded with the somatic pipette is plotted as a function of distance from the injection site. The open and red markers represent control and ZD 7288 data points, respectively. A straight line has been fitted to each dataset for the dendritic inputs. The data points at the soma represent the mean ± SEM of 15–17 recordings including three to four double somatic experiments. Values of summation were calculated from the control sEPSPs in Figure 2D assuming linear summation. The dashed line on the plot represents the result of linear regression to the predicted data. D, Linearity of sEPSP summation. Somatic voltage trace from somatic injection of five consecutive waveforms at 50 Hz (real train). The response to an individual EPSC waveform injection was recorded from the same cell and the linear sum of five single sEPSPs was subsequently calculated (---). The overlay demonstrates that the linear sum matches the recorded train. E, Scaling of summation. Superimposed somatic responses to sEPSP trains with first EPSC amplitudes of 0.2, 0.6, 1.0, and 1.4 nA. Scaling the 0.2 nA injection to the 1.4 nA injection shows the amplitude independence of the temporal summation.
To study how the effect of Ih develops during an input train, we compared single and trains of sEPSPs in the same cell (Fig. 3D). The linear sum of five single sEPSPs at 50 Hz was calculated off-line (Fig. 3D, linear sum), and perfectly matched the recorded response to a “real” train of EPSCs (Fig. 3D, overlay). Thus, Ih has the same impact on the first sEPSP as it has on the subsequent sEPSPs in a train. This result was consistent over a wide range of amplitudes of the injected current and also for negative waveform injections (data not shown). The linear prediction deviated from the recorded response only when action potentials were generated in response to the current injection. To examine whether Ih acts in this linear manner at all dendritic locations, we calculated the linear sum of single sEPSPs recorded at different locations (Fig. 2D) and compared them to summation of real trains in Figure 3C. The overlap of the linear prediction (dashed line) with real data demonstrates that the linear effect of Ih is location independent (Fig. 3C). The relationship between summation and sEPSP amplitude was examined by injecting trains of EPSC waveforms of increasingly larger amplitudes (0.2–2 nA) (Fig. 3D). We found that summation scales linearly for a broad range of first peak amplitudes (0–8 mV; n = 3). Essentially, this observed linear feature of the Ih current implies that, when analyzing dendritic or somatic inputs of different amplitudes, they can be scaled without changing the actual shape of the response, and therefore the normalization of temporal summation (which is a relative measure) is independent of the actual sEPSP peak or the amplitude of the injected current.
A detailed analysis of the linearity is provided in supplemental Figures 1 and 2 (available at www.jneurosci.org as supplemental material), which present a model in which the nonlinear activation curve of Ih is replaced with a linear one, and the voltage-dependent activation/deactivation time constants are replaced with a constant value. The Ih conductance in this model is therefore voltage dependent, but in a linear way, and thus despite any transient change in conductance it imposes, the integration process remains linear. This model provides a surprisingly good approximation to the behavior of the current, and reproduces the essential features of the experimental data. As we show below, this linearity proves to be a crucial feature for understanding how Ih contributes to normalization of temporal summation.
Modeling the effect of Ih density and distribution in realistic dendritic geometries
The fact that a uniform dendritic distribution of Ih still leads to normalization of summation is puzzling, as is the linear effect of Ih on temporal integration despite its highly nonlinear activation curve. To explore these issues, we used a theoretical approach to allow us to systematically vary the properties of Ih and its distribution in different dendritic geometries. This allows us to assess the contribution of Ih to shaping synaptic potentials and temporal integration in a more systematic manner than is possible using an experimental approach (Magee, 1999; Williams and Stuart, 2000, 2003). We started by using simulations in detailed compartmental models of different cell types (Purkinje neurons as well as neocortical and hippocampal pyramidal neurons) with different densities and distributions of Ih (Fig. 4). These simulations show that, for each of these morphologies, the average density of Ih is a far more important determinant of the degree of summation than its dendritic distribution. When the density of Ih increases, in all morphologies and spatial distributions the profiles of summation as a function of distance follow the same trend. At low Ih densities, summation increases with distance from the soma; then at some intermediate Ih density normalization of temporal summation is achieved, and finally for higher densities distal inputs summate less than proximal ones. Remarkably, normalization is achievable for both uniform and nonuniform Ih distributions in all cell types for a specific density. Figure 4G demonstrates that this is a general phenomenon (tested on 12 cells). In other words, a dendritic gradient of Ih is not a necessary condition for normalization of temporal summation in neurons.
It is interesting to note that the Purkinje cells in the simulations show, in agreement with the experimental results, that even in the passive case summation is not strongly dependent on distance from the soma. Nevertheless, for some Purkinje cells, there is a slope in the profile of summation for proximal inputs (Fig. 4F, top, green). The length and steepness of this slope is dependent on the specific morphology of the cell (and especially on the “bottleneck” connecting the dendritic tree to the soma). This feature is not obviously apparent in the experimental results (Fig. 3C), presumably because the population data are based on averaging results from different cells with different structures. Figure 4 also demonstrates that the longer the cell the bigger the effect of the spatial distribution of Ih on the temporal summation profile (compare different profiles for Purkinje cells and layer 5 pyramidal neurons). The fact that Purkinje cells are electrotonically short partially explains why in these simulations they are insensitive to the spatial distribution of Ih. Nevertheless, the effect of the distribution of Ih on temporal summation is weak even in extremely long cells. This phenomenon is analyzed in detail in supplemental Figures 3 and 4 (available at www.jneurosci.org as supplemental material).
Dissecting the mechanisms underlying temporal summation normalization by Ih
To understand the mechanisms underlying the contribution of Ih to normalization of temporal summation, we turned to a simple model consisting of a single cylindrical dendrite. This reduced model proved capable of capturing all the phenomena found both in our experiments and in detailed models of dendritic neurons (Fig. 4; compare with supplemental Fig. 4, available at www.jneurosci.org as supplemental material). The contribution of Ih to shaping synaptic potentials and temporal integration can be broken down into four steps (Fig. 5). In step 1, we begin by modeling the condition when Ih is absent (i.e., where summation is determined only by the passive properties of the dendritic tree). Next, we add gh to the model in two steps (see Materials and Methods): (1) the fraction of gh that is open in the steady state at the resting potential (step 2; “static gh”), and (2) the transient deactivation on depolarization (step 3). The static gh condition is also a passive cylinder, but with a leakier membrane. The additional conductance has a negligible effect on the peak of the sEPSP (Hubbard et al., 1969), but shortens the membrane time constant, resulting in a shorter sEPSP half-width. Concomitantly, temporal summation is significantly reduced (see pink arrow) because of the slow time course of the “static shunt” (step 2; dashed pink trace; see figure legend), which leads to significantly more summation of the static shunt compared with the peak of the sEPSP. Interestingly, the effective linearity of Ih (Fig. 3 C–E; supplemental Figs. 1, 2, available at www.jneurosci.org as supplemental material) permits us to likewise use the difference between the sEPSPs in the two different conditions (step 3; “hidden sag”) to show that the effect of the transient deactivation of gh (representing a change in conductance) is qualitatively similar to that of the static shunt. This result holds both for the kinetics measured in Purkinje cells as well as when the activation and deactivation time constants are sped up fourfold (as in the figure) (see also Materials and Methods).
In step 4, we examine how the effect of Ih depends on input location. The peak of the propagated sEPSP attenuates strongly for the distal input (left panel; compare with proximal). At the same time, the undershoot after the sEPSP is identical for both proximal and distal inputs (left panel; overlapping “undershoot”). In other words, the peak amplitude and the sag of the propagated distal sEPSP are affected differentially by cable filtering. To compare the relative contribution of the peak and sag for temporal summation, we normalize the proximal input to the peak of the propagated sEPSP. This scaling reveals a smaller relative undershoot of the proximal sEPSP than that of the propagated one (left panel; dashed line). Indeed both the static shunt and hidden sag of the distal input are larger than that of the normalized proximal input (compare middle panels). Although the difference in the undershoot is small for individual sEPSPs, being slow the static shunt and hidden sag summate more than the sEPSP peaks (see steps 2 and 3). Therefore, by the fifth input, the difference in the contribution of the sag of the distal input and the proximal input becomes large. In this specific example, it is precisely large enough to compensate for the difference in temporal summation induced by passive cable filtering (i.e., complete location-independent normalization; right panel). In conclusion, the differential filtering of the sag compared with the peak, in conjunction with the linearity of Ih, is essential for normalization of temporal summation.
Analyzing how the dendritic distribution of Ih affects temporal summation
The model in Figure 5 explains how normalization can be achieved in an electrotonic structure with a uniform distribution of Ih. How does the dendritic distribution of Ih affect temporal summation? In Figure 6, we use the cylinder model to compare the effect of two spatial distributions of Ih on temporal summation: a uniform distribution (as in Fig. 5) and a nonuniform distribution, in which the same total amount of gh is concentrated in the final 100 μm of the cylinder (Fig. 6A1, blue). Both of these distributions yield qualitative normalization of temporal summation (Fig. 6A2), with slightly different spatial profiles. The deactivation of gh (the hidden sag) is responsible for the difference between these profiles as they are very similar when only the static gh is present (Fig. 6A3) (London et al., 1999). We thus compare the properties of the hidden sag in the different distributions in Figure 6B. Local responses (i.e., injection and recording at the same site) both proximal (Fig. 6B1) and distal (Fig. 6B2) are sensitive to the spatial distribution of Ih, such that the amplitude of the hidden sags is larger when the current is injected where gh is higher (Fig. 6B2, dashed blue trace), and vice versa. However, this local sensitivity of the hidden sag to the Ih distribution disappears when considering the propagated signals (Fig. 6B3). The linearity of Ih permits us to consider the hidden sag as a signal that propagates and is filtered by the cable. For the distal current injection, the propagated hidden sags of the two distributions are very similar when “recorded” at the proximal site (this is in contrast to the difference in the local hidden sags) (Fig. 6, compare B2 and B3, bottom panel). This shows that, although the spatial distribution of Ih has an effect on the local signals, its effect on the propagated ones is very small. Figure 6, C1 and C2, shows this as a function of input location.
In Figure 6C3, we compare the attenuation of the sEPSP peak and the hidden sag (solid vs dashed lines) as a function of input location for the two distributions. This highlights the differential filtering in which the peak attenuates more than the sag (Fig. 6B) because the hidden sag is a slow signal and is therefore less filtered by the cable. In conclusion, the differential filtering of the sag compared with the sEPSP peak in the presence of Ih exists for both uniform and nonuniform distributions of Ih, providing both distributions with the ability to achieve normalization of temporal summation.
Interestingly, both distributions have identical degrees of temporal summation when the current is injected at the most distal location (Fig. 6A2, arrows). This is a consequence of the identical propagated hidden sags (Fig. 6B3,C2, arrow) resulting from a larger local hidden sag in the nonuniform case, which attenuates more than that of the uniform case. How general is this finding? Figure 7 shows the amplitude of the propagated hidden sag (Fig. 7B) and the degree of temporal summation (Fig. 7C) for seven spatial distributions of gh. Practically all distributions show a temporal summation profile that is only weakly dependent on input location when compared with the passive case. Furthermore, there is a one-to-one relationship between the profile of the propagated hidden sag and the profile of temporal summation. Although some variability exists between the different conditions, we can derive bounds for the propagated sag (and hence temporal summation) for most input locations (supplemental Fig. 3, available at www.jneurosci.org as supplemental material). These findings confirm that the effect of Ih on temporal summation depends only weakly on its dendritic distribution.
Figure 7.

Bounds on the hidden sag and temporal summation for different spatial distributions. A, Seven cylinder models with different spatial distributions of gh. As in previous figures, all models have the same total amount of gh. B, The propagated hidden sag is shown as a function of input location in the different models. The traces are color-coded as in A. The distributions (as appear in top to bottom in A) are as follows: (1) uniform gh as in Figure 6, (2) 100% of gh at X = 1, (3) 100% of gh at X = 0, (4) 50% of gh at X = 0 and 50% at X = 1, (5) gh is concentrated in the two middle compartments of the cylinder, (6) gh = 0 on the left half of the cylinder and equals 0.00022 S/cm2 (twice the value of the uniform case) on the other half, and (7) gh follows a linear gradient with distance from X = 0 such that gh(0) = 0 and gh(1) = 0.00022 S/cm2 (again twice as much as in the uniform case). The gray area marks the range of propagated hidden sag amplitude from any distribution (for details, see supplemental Fig. 3, available at www.jneurosci.org as supplemental material). C, The corresponding profile of temporal summation (5 inputs at 50 Hz) at X = 0 for all of the above models.
Discussion
The strikingly nonuniform dendritic distribution of Ih in pyramidal cells has attracted widespread attention and remains the only example of a nonuniform dendritic voltage-gated channel distribution that has both been characterized functionally and confirmed at the EM level. We showed that a nonuniform distribution of Ih is not a general feature of principal neurons in the CNS. Furthermore, we demonstrate that there is no causal link between the nonuniform distribution of dendritic Ih and normalization of temporal summation. Rather, our simulations demonstrate that the total density of Ih determines input summation. These findings place important constraints on our view of how the distribution and properties of Ih regulate synaptic integration.
Functional properties and dendritic distribution of Ih in Purkinje cells
Our experiments provide the first direct information regarding the properties and distribution of Ih in dendrites of Purkinje neurons. Cell-attached recordings revealed that the basic voltage-dependent properties of Ih in Purkinje cells are similar to those of Ih in other principal neurons. The half-activation voltage we found is within the range found in other studies (Magee, 1998; Berger et al., 2001; Roth and Häusser, 2001; Kole et al., 2006). Although the activation curve predicts only a relatively small fraction of Ih active during spontaneous firing in Purkinje cells, the half-activation voltage of HCN channels is sensitive to both extracellular potassium (Azene et al., 2003) and intracellular cAMP (Wang et al., 2002). The effective activation curve in Purkinje cells under physiological conditions is therefore likely to be depolarized compared with those obtained in cell-attached experiments, and hence a significant fraction of gh should be open under resting conditions in Purkinje cells, consistent with the hyperpolarizations observed with ZD 7288 application (Williams et al., 2002).
The kinetics of Ih in Purkinje cells are slower than for Ih in pyramidal neurons, with activation time constants being ∼300 versus ∼50 ms, respectively, at −80 mV (Magee, 1998; Williams and Stuart, 2000; Berger et al., 2001), but are still within the range associated with expression of the fast subtype of HCN channels, HCN1. This is in agreement with finding that the HCN1 subunit accounts for the majority of the Ih conductance of Purkinje neurons (Nolan et al., 2003). The discrepancy between the kinetics of Ih we measured and those in pyramidal neurons suggests that other, slower HCN subunits may also be expressed in Purkinje neurons (Notomi and Shigemoto, 2004). HCN1 and HNC2 subunits can combine to form stable channel complexes with heteromeric assembly, giving an Ih current with slower kinetics than that of homomeric HCN1 channels (Ulens and Tytgat, 2001). Alternatively, accessory subunits or modulation of HCN1 channels may contribute to changes in the kinetics of the current in Purkinje cells (Yu et al., 2001; Decher et al., 2003).
We showed that Ih exhibits a uniform distribution in the dendrites of Purkinje cells, in striking contrast to the principal neurons of the cortex and hippocampus. (Magee, 1998; Williams and Stuart, 2000; Berger et al., 2001; Kole et al., 2006). Consistent with our findings, HCN1 protein expression in Purkinje cells is low with no expression gradient detectable in dendritic shafts and spines with immunogold labeling (Lujan et al., 2005).
Our results suggests that the gradient of Ih density found in pyramidal neurons is not a general rule across all neuronal types, but rather may be a specific feature of these cells. Interestingly, recent experiments on pyramidal-like principal neurons in the stratum radiatum region of hippocampus have revealed a reverse Ih gradient with higher somatic than dendritic expression (Bullis et al., 2007).
Ih and temporal summation in Purkinje cells
Despite the impressive dendrites of Purkinje cells, their unusual geometry, consisting of short spiny branchlets connected to a thick trunk, results in the half-width of dendritic EPSPs measured at the soma being mostly location independent, even in the passive case (Roth and Häusser, 2001; Vetter et al., 2001). Thus, Purkinje cell dendrites act to “self-normalize” the EPSP shape, such that temporal summation of dendritic inputs is relatively location independent (Figs. 2–4).
We demonstrate that Ih shortens the time course of EPSPs in Purkinje neurons, reducing their half-width (with little effect on peak amplitude), in agreement with results in pyramidal neurons (Magee, 1998; Williams and Stuart, 2000; Berger et al., 2001). Using a model we show that this effect of Ih on EPSP shape can be well described by a two-step process. First, the effect of the static “resting” conductance of Ih shortens the membrane time constant. Second, the depolarization deactivates Ih channels because of the voltage dependence of Ih. Because Ih is an inward cationic current, this has a hyperpolarizing effect and thus accelerates the decaying phase of the EPSP. Although the EPSP undershoot is the “signature” of Ih, most of this effect takes place during the EPSP depolarized phase, hence the term “hidden sag” (Fig. 5). Because the time course of the static shunt and the hidden sag are slow and tend to summate more than the peaks of the relatively fast transient EPSP, the effect of Ih on temporal summation increases during an EPSP train.
We show that, surprisingly, the Ih response to multiple asynchronous inputs scales linearly and is identical with superposition of the individual inputs. Each input in the train has an equal contribution to the reduction of summation generated by Ih. Our simulations confirm that this linearity holds true for a wide range of resting potentials and activation–deactivation time constants (supplemental Figs. 1, 2, available at www.jneurosci.org as supplemental material). This linear property only breaks down when the depolarization is large enough to activate other currents that elicit highly nonlinear responses such as dendritic spikes or axonal action potentials.
How does Ih normalize temporal summation?
Our simulations reveal that the EPSP sag originating in the dendrites attenuates less than the EPSP peak. This differential cable filtering is the key feature enabling normalization. For distal inputs, the relative effect of the sag on temporal summation is larger than for proximal ones. Upregulating the density of gh can increase the amplitude of the propagated sag from distal locations sufficiently to compensate for the increase in temporal summation caused by passive dendritic filtering, and thus generate normalization of temporal summation. The differential filtering exists for all spatial distributions of the gh conductance, indicating that normalization of temporal summation can be achieved with uniform as well as nonuniform distributions of gh. This challenges the commonly held view that the dendritic gradient of Ih in pyramidal cells and normalization of temporal summation are causally related. Our findings are further supported by recent experiments showing that one can achieve normalization of summation even with a reverse somatodendritic gradient of Ih (Bullis et al., 2007).
Our dissection of the mechanism by which Ih normalizes temporal summation takes advantage of the surprising linearity of Ih observed in our experiments. The boundaries on temporal summation obtained in Figure 7 and supplemental Figure 3 (available at www.jneurosci.org as supplemental material) rely on the properties (and especially the reciprocity) of transfer resistance in linear systems (Koch, 2004). Importantly, this reciprocity has been observed in a study of Ih in dendrites of layer 5 pyramidal neurons (Berger et al., 2001).
What is the functional role of the dendritic Ih distribution?
Both the local hidden sag and the static shunt are larger in the dendrites for models exhibiting a dendritic Ih gradient compared with the uniform case (Fig. 6B2). This suggests that spatial gradients of Ih will have a strong effect on local synaptic integration in distal dendrites. Indeed, several experimental studies have shown that Ih in neocortical and CA1 pyramidal cells can affect local integration in distal dendrites, where it reduces the effective membrane time constant and EPSP summation (Magee, 1999; Poolos et al., 2002), while also lowering the threshold for initiation of dendritic Ca2+ spikes (Berger et al., 2003). However, it remains to be demonstrated directly (e.g., using molecular manipulations) that such effects are causally dependent on expression of an Ih gradient.
Our results provide a new framework for understanding how the local and global effects of Ih on neuronal excitability are integrated. The fact that a nonuniform Ih distribution can influence local integration in dendrites while keeping temporal summation normalization at the soma unchanged permits a high degree of flexibility. In particular, our results suggest that a neuron may regulate the degree of temporal summation by controlling the total number of Ih channels, while at the same time local excitability can be determined by regulating the gradient of Ih expression. Indeed, recent studies show that both global and local regulation of Ih can be observed after synaptic plasticity (Wang et al., 2003; Fan et al., 2005; Xu et al., 2006). Regulation of Ih expression may be under homeostatic control (Marder and Goaillard, 2006; Rabinowitch and Segev, 2006) to maintain independent operation of these effects, such that upregulation of Ih in a specific dendritic subregion will be accompanied by a corresponding downregulation of Ih in other subregions, allowing the total amount of Ih and the degree of normalization of temporal summation to be preserved. Resolving how these effects of Ih are “read out” by the neuron to in turn regulate its distribution and thus tune neuronal excitability should lead to a deeper understanding of the origin, maintenance, and functional relevance of nonuniform channel distributions in dendrites.
Footnotes
This work was supported by grants from the Wellcome Trust, the Medical Research Council, and the Gatsby Foundation. K.A. was supported by the Lundbeckfonden, and M.L. was supported by a Human Frontier Science Program Long-Term Fellowship. We thank Arnd Roth, Andreas Schaefer, Julian Jack, and Steve Cox for helpful discussions, and Nelson Spruston, Muki Rapp, and Beverley Clark for contributing neuronal reconstructions.
References
- Azene et al., 2003.Azene EM, Xue T, Li RA. Molecular basis of the effect of potassium on heterologously expressed pacemaker (HCN) channels. J Physiol (Lond) 2003;547:349–356. doi: 10.1113/jphysiol.2003.039768. [DOI] [PMC free article] [PubMed] [Google Scholar]
- Berger et al., 2001.Berger T, Larkum ME, Lüscher HR. High Ih channel density in the distal apical dendrite of layer V pyramidal cells increases bidirectional attenuation of EPSPs. J Neurophysiol. 2001;85:855–868. doi: 10.1152/jn.2001.85.2.855. [DOI] [PubMed] [Google Scholar]
- Berger et al., 2003.Berger T, Senn W, Lüscher HR. Hyperpolarization-activated current Ih disconnects somatic and dendritic spike initiation zones in layer V pyramidal neurons. J Neurophysiol. 2003;90:2428–2437. doi: 10.1152/jn.00377.2003. [DOI] [PubMed] [Google Scholar]
- BoSmith et al., 1993.BoSmith RE, Briggs I, Sturgess NC. Inhibitory actions of ZENECA ZD7288 on whole-cell hyperpolarization activated inward current (If) in guinea-pig dissociated sinoatrial node cells. Br J Pharmacol. 1993;110:343–349. doi: 10.1111/j.1476-5381.1993.tb13815.x. [DOI] [PMC free article] [PubMed] [Google Scholar]
- Bullis et al., 2007.Bullis JB, Jones TD, Poolos NP. Reversed somatodendritic I(h) gradient in a class of rat hippocampal neurons with pyramidal morphology. J Physiol (Lond) 2007;579:431–443. doi: 10.1113/jphysiol.2006.123836. [DOI] [PMC free article] [PubMed] [Google Scholar]
- Cox and Griffith, 2001.Cox SJ, Griffith BE. Recovering quasi-active properties of dendritic neurons from dual potential recordings. J Comput Neurosci. 2001;11:95–110. doi: 10.1023/a:1012858230117. [DOI] [PubMed] [Google Scholar]
- Crepel and Penit-Soria, 1986.Crepel F, Penit-Soria J. Inward rectification and low threshold calcium conductance in rat cerebellar Purkinje cells. An in vitro study. J Physiol (Lond) 1986;372:1–23. doi: 10.1113/jphysiol.1986.sp015993. [DOI] [PMC free article] [PubMed] [Google Scholar]
- Decher, et al., 2003.Decher N, Bundis F, Vajna R, Steinmeyer K. KCNE2 modulates current amplitudes and activation kinetics of HCN4: influence of KCNE family members on HCN4 currents. Pflügers Arch. 2003;446:633–640. doi: 10.1007/s00424-003-1127-7. [DOI] [PubMed] [Google Scholar]
- Fan et al., 2005.Fan Y, Fricker D, Brager DH, Chen X, Lu HC, Chitwood RA, Johnston D. Activity-dependent decrease of excitability in rat hippocampal neurons through increases in I(h) Nat Neurosci. 2005;8:1542–1551. doi: 10.1038/nn1568. [DOI] [PubMed] [Google Scholar]
- Gasparini and DiFrancesco, 1997.Gasparini S, DiFrancesco D. Action of the hyperpolarization-activated current (Ih) blocker ZD 7288 in hippocampal CA1 neurons. Pflügers Arch. 1997;435:99–106. doi: 10.1007/s004240050488. [DOI] [PubMed] [Google Scholar]
- Häusser and Clark, 1997.Häusser M, Clark BA. Tonic synaptic inhibition modulates neuronal output pattern and spatiotemporal synaptic integration. Neuron. 1997;19:665–678. doi: 10.1016/s0896-6273(00)80379-7. [DOI] [PubMed] [Google Scholar]
- Hines and Carnevale, 1997.Hines ML, Carnevale NT. The NEURON simulation environment. Neural Comput. 1997;9:1179–1209. doi: 10.1162/neco.1997.9.6.1179. [DOI] [PubMed] [Google Scholar]
- Hubbard et al., 1969.Hubbard JI, Llinás R, Quastel DMJ. Baltimore: Williams and Wilkins; 1969. Electrophysiological analysis of synaptic transmission. [Google Scholar]
- Koch, 1984.Koch C. Cable theory in neurons with active, linearized membranes. Biol Cybern. 1984;50:15–33. doi: 10.1007/BF00317936. [DOI] [PubMed] [Google Scholar]
- Koch, 2004.Koch C. New York: Oxford UP; 2004. Biophysics of computation: information processing in single neurons. [Google Scholar]
- Kole et al., 2006.Kole MH, Hallermann S, Stuart GJ. Single Ih channels in pyramidal neuron dendrites: properties, distribution, and impact on action potential output. J Neurosci. 2006;26:1677–1687. doi: 10.1523/JNEUROSCI.3664-05.2006. [DOI] [PMC free article] [PubMed] [Google Scholar]
- London et al., 1999.London M, Meunier C, Segev I. Signal transfer in passive dendrites with nonuniform membrane conductance. J Neurosci. 1999;19:8219–8233. doi: 10.1523/JNEUROSCI.19-19-08219.1999. [DOI] [PMC free article] [PubMed] [Google Scholar]
- Lörincz et al., 2002.Lörincz A, Notomi T, Tamas G, Shigemoto R, Nusser Z. Polarized and compartment-dependent distribution of HCN1 in pyramidal cell dendrites. Nat Neurosci. 2002;5:1185–1193. doi: 10.1038/nn962. [DOI] [PubMed] [Google Scholar]
- Lujan et al., 2005.Lujan R, Albasanz JL, Shigemoto R, Juiz JM. Preferential localization of the hyperpolarization-activated cyclic nucleotide-gated cation channel subunit HCN1 in basket cell terminals of the rat cerebellum. Eur J Neurosci. 2005;21:2073–2082. doi: 10.1111/j.1460-9568.2005.04043.x. [DOI] [PubMed] [Google Scholar]
- Magee, 1998.Magee JC. Dendritic hyperpolarization-activated currents modify the integrative properties of hippocampal CA1 pyramidal neurons. J Neurosci. 1998;18:7613–7624. doi: 10.1523/JNEUROSCI.18-19-07613.1998. [DOI] [PMC free article] [PubMed] [Google Scholar]
- Magee, 1999.Magee JC. Dendritic Ih normalizes temporal summation in hippocampal CA1 neurons. Nat Neurosci. 1999;2:848. doi: 10.1038/12229. [DOI] [PubMed] [Google Scholar]
- Marder and Goaillard, 2006.Marder E, Goaillard JM. Variability, compensation and homeostasis in neuron and network function. Nat Rev Neurosci. 2006;7:563–574. doi: 10.1038/nrn1949. [DOI] [PubMed] [Google Scholar]
- Nolan et al., 2003.Nolan MF, Malleret G, Lee KH, Gibbs E, Dudman JT, Santoro B, Yin D, Thompson RF, Siegelbaum SA, Kandel ER, Morozov A. The hyperpolarization-activated HCN1 channel is important for motor learning and neuronal integration by cerebellar Purkinje cells. Cell. 2003;115:551–564. doi: 10.1016/s0092-8674(03)00884-5. [DOI] [PubMed] [Google Scholar]
- Notomi and Shigemoto, 2004.Notomi T, Shigemoto R. Immunohistochemical localization of Ih channel subunits, HCN1–4, in the rat brain. J Comp Neurol. 2004;471:241–276. doi: 10.1002/cne.11039. [DOI] [PubMed] [Google Scholar]
- Poolos et al., 2002.Poolos NP, Migliore M, Johnston D. Pharmacological upregulation of h-channels reduces the excitability of pyramidal neuron dendrites. Nat Neurosci. 2002;5:767–774. doi: 10.1038/nn891. [DOI] [PubMed] [Google Scholar]
- Rabinowitch and Segev, 2006.Rabinowitch I, Segev I. The interplay between homeostatic synaptic plasticity and functional dendritic compartments. J Neurophysiol. 2006;96:276–283. doi: 10.1152/jn.00074.2006. [DOI] [PubMed] [Google Scholar]
- Robinson and Siegelbaum, 2003.Robinson RB, Siegelbaum SA. Hyperpolarization-activated cation currents: from molecules to physiological function. Annu Rev Physiol. 2003;65:453–480. doi: 10.1146/annurev.physiol.65.092101.142734. [DOI] [PubMed] [Google Scholar]
- Roth and Häusser, 2001.Roth A, Häusser M. Compartmental models of rat cerebellar Purkinje cells based on simultaneous somatic and dendritic patch-clamp recordings. J Physiol (Lond) 2001;535:445–472. doi: 10.1111/j.1469-7793.2001.00445.x. [DOI] [PMC free article] [PubMed] [Google Scholar]
- Ulens and Tytgat, 2001.Ulens C, Tytgat J. Functional heteromerization of HCN1 and HCN2 pacemaker channels. J Biol Chem. 2001;276:6069–6072. doi: 10.1074/jbc.C000738200. [DOI] [PubMed] [Google Scholar]
- Vetter et al., 2001.Vetter P, Roth A, Häusser M. Propagation of action potentials in dendrites depends on dendritic morphology. J Neurophysiol. 2001;85:926–937. doi: 10.1152/jn.2001.85.2.926. [DOI] [PubMed] [Google Scholar]
- Wang et al., 2002.Wang J, Chen S, Nolan MF, Siegelbaum SA. Activity-dependent regulation of HCN pacemaker channels by cyclic AMP: signaling through dynamic allosteric coupling. Neuron. 2002;36:451–461. doi: 10.1016/s0896-6273(02)00968-6. [DOI] [PubMed] [Google Scholar]
- Wang et al., 2003.Wang Z, Xu NL, Wu CP, Duan S, Poo MM. Bidirectional changes in spatial dendritic integration accompanying long-term synaptic modifications. Neuron. 2003;37:463–472. doi: 10.1016/s0896-6273(02)01189-3. [DOI] [PubMed] [Google Scholar]
- Williams and Stuart, 2000.Williams SR, Stuart GJ. Site independence of EPSP time course is mediated by dendritic Ih in neocortical pyramidal neurons. J Neurophysiol. 2000;83:3177–3182. doi: 10.1152/jn.2000.83.5.3177. [DOI] [PubMed] [Google Scholar]
- Williams and Stuart, 2003.Williams SR, Stuart GJ. Voltage- and site-dependent control of the somatic impact of dendritic IPSPs. J Neurosci. 2003;23:7358–7367. doi: 10.1523/JNEUROSCI.23-19-07358.2003. [DOI] [PMC free article] [PubMed] [Google Scholar]
- Williams et al., 2002.Williams SR, Christensen SR, Stuart GJ, Häusser M. Membrane potential bistability is controlled by the hyperpolarization-activated current I(H) in rat cerebellar Purkinje neurons in vitro. J Physiol (Lond) 2002;539:469–483. doi: 10.1113/jphysiol.2001.013136. [DOI] [PMC free article] [PubMed] [Google Scholar]
- Xu et al., 2006.Xu NL, Ye CQ, Poo MM, Zhang XH. Coincidence detection of synaptic inputs is facilitated at the distal dendrites after long-term potentiation induction. J Neurosci. 2006;26:3002–3009. doi: 10.1523/JNEUROSCI.5220-05.2006. [DOI] [PMC free article] [PubMed] [Google Scholar]
- Yu, et al., 2001.Yu H, Wu J, Potapova I, Wymore RT, Holmes B, Zuckerman J, Pan Z, Wang H, Shi W, Robinson RB, El-Maghrabi MR, Benjamin W, Dixon J, McKinnon D, Cohen IS, Wymore R. MinK-related peptide 1: a beta subunit for the HCN ion channel subunit family enhances expression and speeds activation. Circ Res. 2001;88:E84–E87. doi: 10.1161/hh1201.093511. [DOI] [PubMed] [Google Scholar]