Abstract
A previous study has suggested that complex cells perform a MAX-like operation on their inputs: when two bar stimuli are presented within the receptive field, regardless of their relative separation, the cell's response is similar in amplitude to the larger of the responses elicited by the individual stimuli. This description of complex cells seems at odds with the classical energy model in which complex cells receive input from multiple simple cells with overlapping receptive fields. The energy model predicts, and experiments have confirmed, that bar stimuli should facilitate or suppress one another depending on their relative separation. We have recorded intracellularly from a population of complex cells and studied their responses to paired bar stimuli in detail. A wide range of behavior was observed, from the more classical separation-dependent interactions to purely MAX-like responses. We also found that the more MAX-like a cell was, the broader its spatial-frequency tuning as measured with drifting gratings. These observations are consistent with energy models in which classical complex cells receive input from simple cells with similar preferred spatial frequencies, and MAX-like complex cells receive input from simple cells with disparate preferred spatial frequencies. Generalized energy models, then, can account for diverse modes of computation in cortical complex cells.
Keywords: primary visual cortex, complex cells, MAX operation, spatial-frequency tuning, cortical energy model, spatial summation
Introduction
Simple cells in the primary visual cortex are well described by feedforward models in which their basic response properties are derived from the lateral geniculate nucleus (LGN) (Hubel and Wiesel, 1962). The nature of the circuitry that gives rise to cortical complex cells is, by comparison, much less clear. Similar to simple cells, complex cells are selective for orientation and spatial frequency (Hubel and Wiesel, 1962; Movshon et al., 1978). Unlike simple cells, complex cells lack obvious substructure in their receptive fields (Hubel and Wiesel, 1962; Movshon et al., 1978; Szulborski and Palmer, 1990), and as a group appear to be more heterogeneous.
How can we best account for the aspects of complex cell responses that are shared with simple cells as well as those that are disparate? Hubel and Wiesel (1962) proposed that complex cell tuning is inherited from simple cell progenitors. In support of their hierarchical model, extracellular experiments designed to detect second-order structure in complex cell receptive fields have revealed simple-cell like patterns (Movshon et al., 1978; Emerson et al., 1987; Szulborski and Palmer, 1990; Livingstone and Conway, 2003). In particular, it has been reported that the spike rate response to an oriented bar flashed in the center of a complex cell's receptive field was modulated by the presence of a second, simultaneously presented bar in a manner that depended on the separation between the two bars (Movshon et al., 1978). The dependence of this interaction effect on bar separation was reminiscent of the subfield structure of simple cell receptive fields, and it predicted for individual complex cells the shape of their spatial-frequency tuning curves.
In a previous model, it was proposed that complex cells might perform a very different computation on their inputs, one resembling a MAX-like operation (Riesenhuber and Poggio, 1999, 2002; Serre et al., 2007). That is, when presented with pairs of stimuli, the response of a complex cell would resemble the larger of the responses to the two stimuli alone. MAX-like behavior has been observed in extracellular recordings from primate areas V4 (Gawne and Martin, 2002) and inferotemporal cortex (Sato, 1989) and in intracellular recordings from complex cells in cat area V1 (Lampl et al., 2004).
The MAX-like computation reported by Lampl et al. (2004) is distinct from that measured in previous experiments (Movshon et al., 1978; Emerson et al., 1987; Szulborski and Palmer, 1990; Livingstone and Conway, 2003), and is not predicted by the standard hierarchical model of cortical processing. How, then, can the rather different reports of complex cell behavior be reconciled? We found in a detailed intracellular study of complex cells that both types of response patterns exist: in some complex cells, the interactions between stimuli in a pair clearly depended on the separation between stimuli and their polarity; in others, stimuli interacted in a MAX-like manner, independent of separation or polarity. The two types of cells lay at the ends of a continuum: quantitative indices of MAX-like behavior showed a unimodal distribution and were inversely correlated with the spatial-frequency tuning bandwidth of the cells.
A hierarchical energy model (Adelson and Bergen, 1985) constructed using one or two pairs of simple cells qualitatively reproduced the complex-cell behavior observed here. Classical responses emerged when a single pair of simple cells with matched statial frequencies was used. More MAX-like behavior was observed when two pairs of cells with different spatial-frequency selectivities provided input to the model complex cell. Thus, it may be the case that complex cells participate in a variety of image processing computations dependent in part on the spatial-frequency preferences of the inputs they receive.
Materials and Methods
Animal preparation.
Adult female cats weighing between 2 and 3 kg were anesthetized with a ketamine/acepromazine mixture (30 mg/kg ketamine, 0.7 mg/kg acepromazine, i.m.). Cannuli were inserted into the femoral veins and anesthesia was subsequently maintained with intravenous infusion of sodium pentathol (1–2 mg/kg/hr). A trachea tube for artificial respiration and a vertebral clamp for suspension of the thorax were surgically inserted, and the animal was placed in a stereotaxic head holder. Small caliber holes were drilled in the cranium for placement of screws used to monitor the electroencephalogram, and a craniotomy measuring between 2 and 4 mm in width and 4 and 7 mm in length was made at Horsley–Clark coordinates centered 2 mm laterally and 6 mm posteriorly. After a suitable period during which the animal's vital signs remained stable, paralysis was induced with the perfusion of 3–4 ml of vecuronium bromide (1.5 mg/kg), after which the animal was artificially respirated at 30 breaths/min. Heart rate and expired CO2 were monitored, with the later adjusted periodically by the alteration of an administered room air/O2 mixture to keep end tidal CO2 in the range of 3.5–4.2%. Continuous perfusion of the paralytic was administered at 0.2 mg/kg/hr for the duration of the experiment; the anesthetic (pentothal) was set to perfuse automatically at a rate between 1 and 2 mg/kg/hr to maintain the animal in stage 2 sleep. Body temperature was monitored and maintained close to 38.3°C with a feedback-controlled heat lamp. Gas-permeable hard contact lenses filled with a saline/atropine mixture to effect pupil dilation were inserted in both eyes after the nictating membranes were retracted by the application of 2–3 drops of 2% phenylephrine hydrochloride. Corrective external lenses were then placed in front of the eyes to focus the display screen onto the retinas. Focus was determined by imaging the retinas onto the display screen with a fiber-optic light source directed into the eyes. To minimize brain movement related to respiration, bilateral pneumothoracotomies were performed to limit respiration-induced changes in intrathoracic pressure. Before recording, a durotomy was made, typically with an area between 2 and 5 mm2, over which a layer of warm agar (3% in 0.9% saline) was applied to protect the cortex during and between electrode penetrations. All methods related to animal treatment during experiments have been approved by Northwestern University's Committee on Experimental Animal Research.
Stimulation and recording.
Recordings were made with whole-cell patch microelectrodes pulled on a Flaming/Brown micropipette puller (model p87; Sutter Instrument, Novato, CA) from 1.2 mm thin-wall borosilicate glass filaments. The electrodes, with resistances ranging between 7 and 11 MΩ, were filled with an internal solution, consisting of (in mm) 130 K+-gluconate, 2 MgCl2, 5 HEPES 1.1, EGTA, 0.1 CaCl2, and 4 Mg2+-ATP, which was subsequently buffered to pH 7.3 and adjusted (via dilution with ddH2O) to 285 mOsm. Membrane potentials were recorded with an Axoclamp-2A amplifier in current-clamp mode and digitized at between 4 and 10 kHz. Spikes were identified by subtracting a low-pass-filtered version of the membrane potential from the original voltage trace. For voltage analyses, spikes were removed by median filtering. Stimuli were generated on a Macintosh computer (Apple, Cupertino, CA) running Matlab (Mathworks, Natick, MA) with the Psychophysics toolbox libraries, which controls the output of a Viewsonic (Walnut, CA) video monitor (mean luminance, 20cd/m2) placed 50 cm in front of the animal. All neurons were recorded from areas 17 or 18 and had receptive fields with eccentricities <10°.
Receptive-field characterization and cell classification.
Receptive fields were initially identified by hand. Once localized, the ocular dominance of the cell was determined and the nondominant eye was blocked. Orientation preference was assessed with a protocol that pseudorandomly interleaves 12 4 s presentations, each preceded by 250 ms of blank stimulation, of a drifting grating at 12 different orientations between 0 and 330°. The preferred orientation was defined as that which produced the largest change in mean potential (F0) at the grating's temporal frequency. To position the visual stimulus more precisely over the receptive-field center, a one-dimensional map was made using two sets of between eight and 12 bars of high, typically 90%, contrast: bright bars (“ON”) were presented at 38 cd/m2 and dark bars (“OFF”) were presented at 2 cd/m2. The bars were between 0.2 and 0.6° wide and were presented individually and pseudorandomly for 60 ms, with a subsequent 240 ms of blank stimulation to allow the cell to return to near the resting potential between stimuli. Both ON and OFF bar maps were constructed, and those bars that produced a response different from the mean at 50–80 ms latency were considered to lie within the receptive field. This protocol was repeated a number of times (between 5 and 25). Stimulation boundaries were set to encompass the extremes of each map. Overlap between maps made with ON and OFF stimuli, as well as the F1/F0 ratio derived from responses to preferred orientation drifting gratings, were used to classify cells as complex.
Spatial-frequency measurements.
Spatial-frequency selectivity was measured by presenting eleven (including a blank trial) pseudorandomly interleaved drifting gratings of different spatial frequencies, all at the preferred orientation and temporal frequency and at 64% contrast. Tuning curves were constructed from the average response to each spatial frequency. Preferred spatial frequency and bandwidth were obtained from fits to the equation V(sf) = Vrest + A × exp(−(sf/lpF)lpE) × (1/√1 + (hpF/sf)2)hpL, where Vrest is the resting membrane potential of the cell, A is amplitude, sf is spatial frequency, lpF and lpE are variables capturing the low-pass behavior of the curve, and hpF and hpL are variables capturing the high-pass behavior of the curve. The spatial frequency that elicited a maximal response was considered to be the preferred spatial frequency. Bandwidth was determined by extracting the high and low spatial-frequency cutoffs (where the response dropped to one-half maximal) and taking the ratio of the two (Sceniak et al., 2002). The preferred spatial frequency determined in large part the number of stimuli used for paired-bar mapping: the bars were chosen such that 0.5/bar width, which is the highest frequency that can be resolved, was larger than the cell's peak spatial frequency.
Paired-bar measurements.
All paired-bar experiments contained presentations of (1) single bars presented at each position with both ON and OFF polarity (±45% contrast), (2) every possible pair of ON and OFF polarity bars at ± 45% contrast, (3) single bars of ±90% contrast at each position, representing the superposition of bars of ±45% contrast, and (4) blank stimuli.
Results
Complex cell responses to paired bar stimuli
Whole-cell intracellular recordings were obtained from complex cells in anesthetized cats. We first determined the cell's orientation and spatial-frequency preferences using drifting gratings. The cell's receptive field center and extent were then mapped by measuring subthreshold responses to narrow, optimally oriented, single bright (ON) and dark (OFF) bar stimuli (±45% Weber contrast relative to background). For paired bar mapping, the receptive field, together with a small portion of the surrounding region, was divided into between 8 and 12 oriented bars, with the bar width chosen to be as narrow or narrower than one-half of the period of the cell's preferred spatial frequency. Bars were presented for 20–60 ms followed by blank periods of 160–240 ms. We measured responses to a complete set of second order (paired) stimuli by flashing every combination of bar position and polarity. When the members of a pair with the same polarity were both located in the same position, the contrasts added to create a single bar with doubled (±90%) contrast.
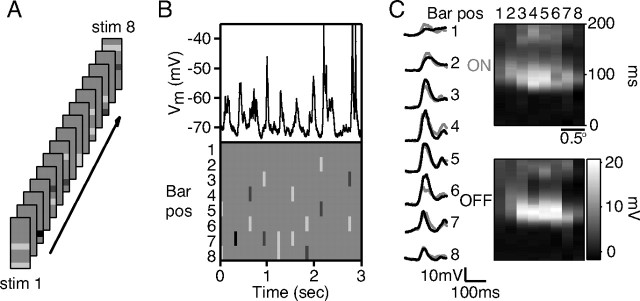
The stimulation method and example responses recorded from a complex cell are shown in Figure 1. Here, the stimuli were flashed for 60 ms, followed by 240 ms of a blank screen (Fig. 1A). All bar pairs were displayed once in random order during a stimulus trial. A subset of one trial is shown for an example complex cell in Figure 1B with the cell's responses above the stimuli that evoked them; note that this block of 10 stimuli contained a blank stimulus (at 2.4 s) in among the pairs and singleton bars. We generally presented the full stimulus set between 10 and 30 times (each time with a different random order), and then averaged the responses to each stimulus after eliminating spikes with a median filter.
Figure 1.
The paired-bar stimulus protocol and example complex cell responses. A, Example stimulus frames for the paired-bar protocol. All possible pairs of ON and OFF bars were flashed at 45% contrast along with individual bars of both polarities at 45 and 90% contrast. B, Complex cell responses to part of a paired-bar protocol. Bars were flashed for 60 ms with 240 ms of succeeding blank time. This cell depolarized in response to almost all combinations of bars, regardless of polarity. C, Responses to ON and OFF bars at 90% contrast for the complex cell in B. The similarity between ON and OFF responses at each position clearly marked this cell as being complex. pos, Position.
Figure 1C shows average responses for the cell in Figure 1B to high-contrast single bright bars (gray traces) and dark bars (black traces). At most spatial locations, the peak responses of the cell were very similar in amplitude and occurred at nearly the same latency, identifying the cell as being complex. To the right are space-time maps of the responses, again showing the receptive field similarity when probed with either ON or OFF polarity bars.
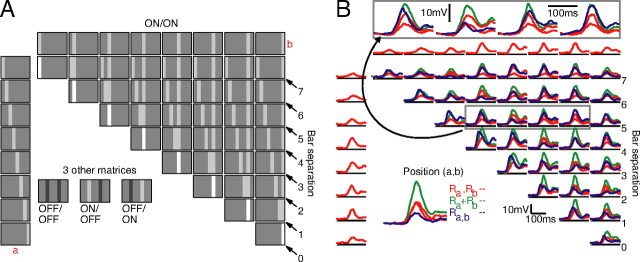
A matrix representation of all the ON–ON bar pairs with which the cell was stimulated is shown in Figure 2A. Individual bar stimuli are arrayed along the top row and leftmost column. Across any given row a, one bar stimulus remains constant and is paired with its appropriate partner from column b. Thus, along the major diagonal (when a = b, marked “0” in the figure), the bars superimpose to produce a single bar stimulus that is doubled in contrast. In this representation, paired-bar stimuli with the same separation between bars fall along diagonals; looking along the diagonal marked by 2, for example, the center-to-center distance between paired bars is exactly two bar widths. Altogether, four different matrices could be constructed from our stimulus set, one for each combination of bar polarities: ON–ON, OFF–OFF, ON–OFF, and OFF–ON.
Figure 2.
Stimulus organization. A, Responses to all stimuli were arranged in matrices as depicted. Stimuli falling along the arrows contained bars that were equidistant from each other. The major diagonal stimuli (bar separation, 0) were at 90% contrast, mimicking the coincidence of two 45% contrast stimuli at the same spatial location; all other stimuli were at 45% contrast. Four variations of this stimulus arrangement were created for each cell: ON–ON (shown), ON–OFF, OFF–OFF, and OFF–ON. B, The full set of ON–ON responses for the complex cell from Figure 1. Responses to each bar presented individually at 45% contrast (Ra and Rb) are in red, the response to both bars together (Ra + b) is in blue, and the predicted response to both bars together (Ra + Rb) is in green. Along the main diagonal, the blue responses are identical to the gray traces in Figure 1C. The gray box contains traces that have been magnified for easier viewing (arrow).
Average responses to each stimulus in Figure 2A are illustrated in Figure 2B for the complex cell from Figure 1. The responses are plotted relative to, and slightly elevated from, the resting membrane potential of the cell (horizontal lines). At all positions (a,b) where a ≠ b, we placed the response to bar a alone (red), the response to bar b alone (red), the response to bars a and b together (blue), and the linear prediction generated by summing the responses to a and b alone (green). For major diagonal entries (a = b; bar separation, 0) in ON–ON and OFF–OFF matrices, we placed the response to a (red), the response to a at double contrast (±90%; blue; same as ON responses in Fig. 1C), and twice the response to a (green). Above the example ON–ON matrix are four entries (gray box) that have been magnified so that the individual traces can more easily be identified. The coincidence of an ON bar and an OFF bar at the same spatial location is equivalent to showing no stimulus at all, and so the major diagonals in ON–OFF and OFF–ON matrices were not filled in.
MAX-like and classical complex cells
We recorded paired bar responses from 45 complex cells, two of which are shown in Figure 3. For MAX-like cell 1 (M1) (Fig. 3A), we show the ON–ON matrix (left) and the ON–OFF matrix (right). For cell M2 (Fig. 3B), we show the OFF–OFF matrix (left) and OFF–ON matrix (right). The remaining two matrices for M1 and M2 can be found in supplemental Figures 1 and 2 (available at www.jneurosci.org as supplemental material). The format of Figure 3 is identical to that of Figure 2B, except that the matrix entries with bar separation 0 are not shown. Here, again the gray boxes depict entries that have been magnified for easier viewing. For M1, eight bars of 0.31° width were flashed in pairs, with each stimulus on for 60 ms and followed by 240 ms of a blank screen. For M2, eight bars of 0.39° width were flashed in pairs with each stimulus on for 40 ms and followed by 180 ms of a blank screen.
Figure 3.
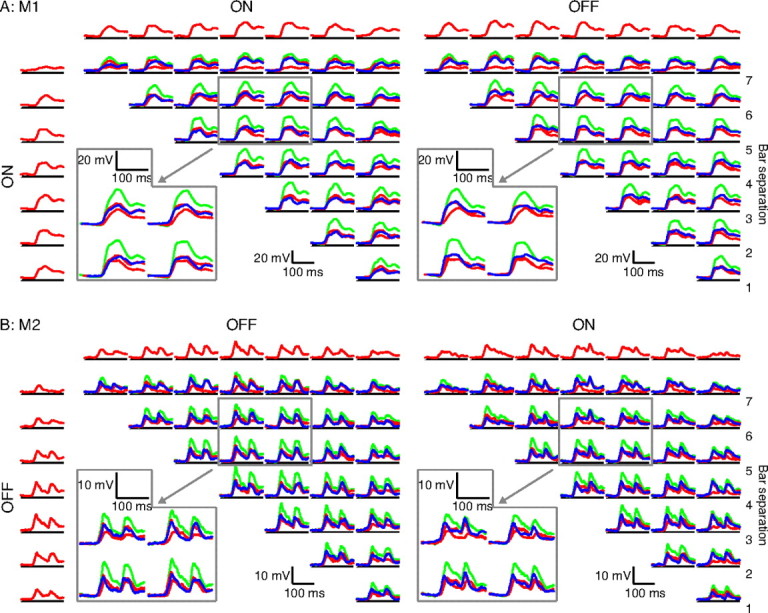
MAX-like responses in complex cells. A, A complex cell ON–ON matrix and ON–OFF matrix filled as described in Figure 2. All of the paired responses are clearly sublinear, and the example magnified traces show that the paired responses are very similar to the maximum of the individual responses, indicating MAX-like behavior. B, OFF–OFF and OFF–ON matrices for a second complex cell, both demonstrating mostly MAX-like responses independent of bar distance or polarity.
These two cells appeared to behave in a very MAX-like manner: their responses to almost all bar pairs (blue traces) were consistently similar to the larger of the individual responses (red traces), and invariably smaller than the sum of the individual responses (green). The two cells in Figure 4, however, showed very different behavior, resembling more the classical complex cells described by Movshon et al. (1978) in which the interactions between bars in a pair depended systematically on bar separation and polarity. In classical cell 1 (C1), for example, bright bars separated by a distance of two bar widths showed consistent suppression across the entire receptive field: for the violet-shaded traces in Figure 4A (left), the paired response (blue) was always smaller than the larger of the individual (red) responses. When the polarity of one of the bars was reversed, however, the suppression turned into facilitation: for the gray shaded traces in Figure 4A (right), the paired response to the bars (blue) was always greater than the larger of the individual responses (red). At further separations between bars (five bar widths), the interaction reversed, with summation seen between two bright bars (Fig. 4A, left, gray shading). Note that there is no obvious corresponding suppression for the larger bar separation visible in Figure 4A (right). This was a consistent finding in that we did not often observe suppression between bars of opposite polarity.
Figure 4.
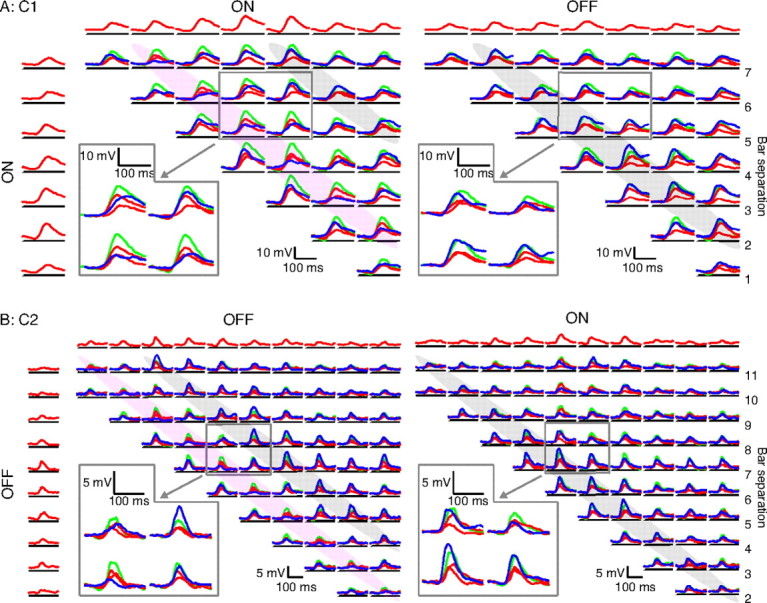
Classical responses in complex cells. A, ON–ON and ON–OFF matrices for a complex cell with varied responses to pairs of bars. At a bar distance of 2, the response to both bars together is consistently less than the maximum response to the bars alone for same-polarity stimuli (indicated by violet shading); the reverse is true for opposite-polarity stimuli (indicated by gray shading). At a bar distance of 5, same-polarity bars evoke a larger response together than individually. B, A second complex cell's OFF–OFF and OFF–ON matrices showing the same behavior as in A.
Similar separation- and polarity-dependent changes in bar interactions are shown for a second cell (C2) in Figure 4B; note that bar separations 0 and 1 are, however, not shown. The remaining two matrices for the cells in Figure 4 can be found in supplemental Figures 3 and 4 (available at www.jneurosci.org as supplemental material).
Quantification of responses to flashed stimuli
For each cell, we measured the amplitude of its responses to all flashed stimuli by calculating the average membrane potential within a 10 ms window centered on the peaks of the responses. In separate graphs, we plotted the paired stimulus amplitudes (Ra,b) against the maximum, the minimum, and the linear sum of the component bar amplitudes (Ra and Rb). Figure 5 shows the results of this analysis for three MAX-like cells (including M1 and M2 from Fig. 3) and three classical cells (including C1 and C2 from Fig. 4, and C3 from Figs. 1, 2).
Figure 5.
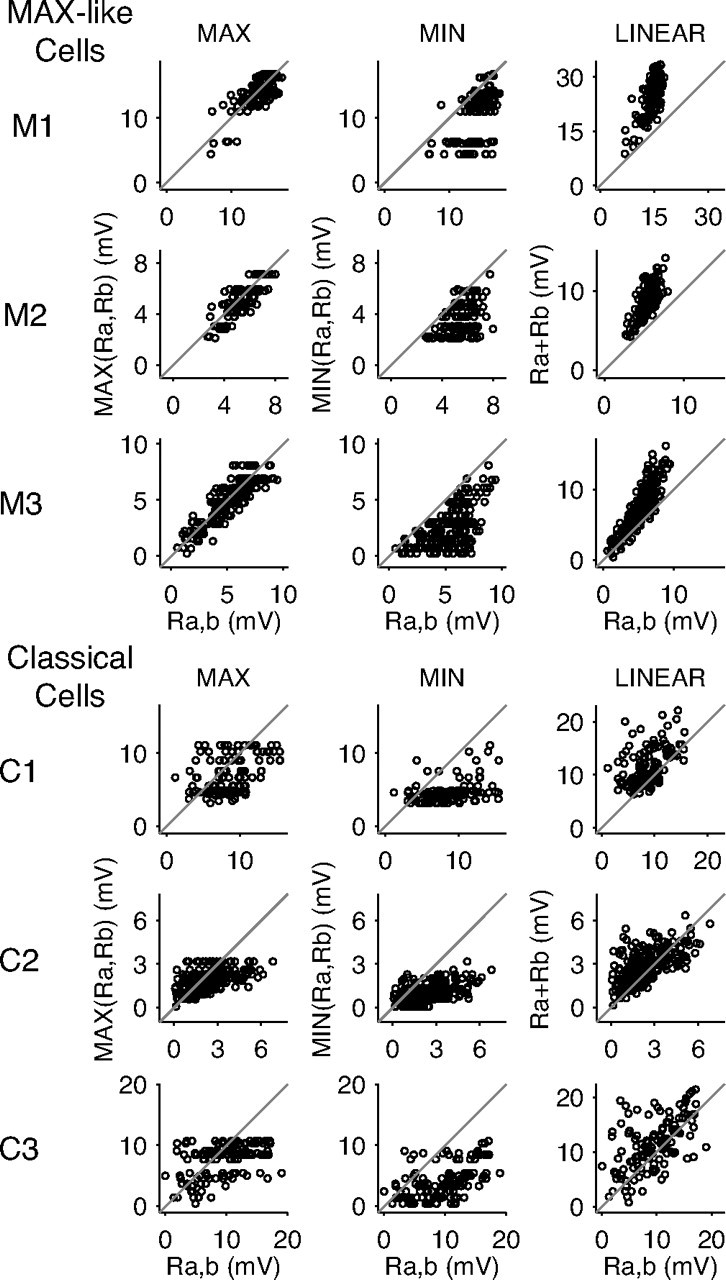
Plots of complex cell response amplitudes. For MAX-like cells, the responses to bar pairs are most accurately predicted by the maximum of the responses to the individual bars (MAX column) across all spatial positions and bar polarities. The minimum and linear sum of the responses to individual bars do not predict well the paired responses (Min and Linear columns). For classical cells, the maximum, minimum, and linear sum of responses to individual bars all fail to predict the paired responses.
For MAX-like cells, the maximum of the individual responses to the bars in a pair was a good predictor of the cell's response to the pair, whereas for classical cells the prediction was poor. The MIN measure underpredicted the paired responses for both types of cells in almost all cases. As expected from the data in Figures 3 and 4, the linear sum of the responses to individual stimuli generally overpredicted the paired response in the case of MAX-like cells, and did not accurately predict the paired response in the case of classical cells.
To determine the MAX behavior of each stimulus pair, we computed a MAX index as follows:
 |
This formulation was originally proposed by Sato (1989) and has been used previously to study complex cells (Lampl et al., 2004). It has the benefit of being able to represent perfect MAX behavior (a max index of 0) as well as perfectly linear behavior (a max index of 1); in addition, facilitation (a paired response greater than the maximum of the individual responses) is represented by values >0, whereas suppression (a paired response less than the maximum of the individual responses) is represented by values <0.
The MAX index attempts to capture the relationship between three different quantities (Ra, Rb, Ra,b) in a single number, and as such does not always represent all aspects of the relationships perfectly. For example, as a quotient, the MAX index can be overly sensitive to the size of the denominator (MIN response): if the MIN response is very small, the index will be artificially inflated, whereas if the MIN response is large, the index will be closer to perfect MAX (0) than would, intuitively, be expected. In our data, the former problem arose infrequently, as 75% of the MIN responses we measured were at least 25% the size of the corresponding MAX responses. In addition, Figure 5 illustrates that even for cells where the MAX and MIN responses were often comparable in amplitude (M1), the paired responses were, in general, better explained by the MAX responses than the MIN responses. These observations suggest that, for our data, the MAX index should serve well as a single, normalized index capable of differentiating between the spatial integration demonstrated by MAX-like cells and that demonstrated by classical cells.
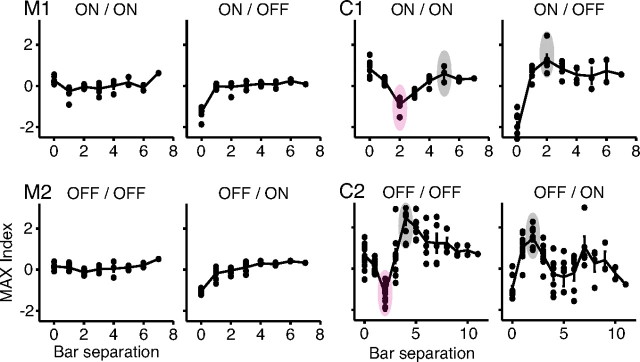
That the MAX index can faithfully represent the behavior seen in cells M1, M2, C1, and C2 is shown in Figure 6, where we plot MAX index against bar separation for all of the entries in the matrices from Figures 3 and 4. The MAX indices for M1 and M2 were all close to zero (individual points), as was the average MAX index at each bar separation (solid line). In these cells, the interaction between any two bars was almost completely independent of the separation and polarity of the bars. Cells C1 and C2, on the contrary, had strongly modulated MAX index profiles. The MAX indices clearly depended on the distance between bars, and the dependence flipped when one bar changed polarity (compare ON–ON with ON–OFF or OFF–OFF with OFF–ON); the shape of the dependence, however, was the same for matrices in which both bars had the same polarity (ON–ON compared with OFF–OFF) or in which the two bars had opposite polarity (ON–OFF compared with OFF–ON). The strong dependence of the MAX index on bar separation and polarity thus explains why, for these cells, both the MAX and the linear measures in Figure 5 failed to represent their behavior.
Figure 6.
MAX index plots for the matrices from Figures 3 and 4. The filled circles represent individual MAX indices, whereas the solid line tracks the mean of the indices at each bar separation. Cells M1 and M2 show relatively flat average MAX index profiles that do not vary greatly with bar separation or polarity. Cells C1 and C2 show modulated average MAX index profiles with suppression (MAX indices <0) at small bar separations (purple ovals), and enhancement (MAX indices >0) at larger bar separations (gray ovals) for the same polarity bars. The pattern of suppression reverses when one of the bars switches polarity.
Quantification of overall MAX behavior
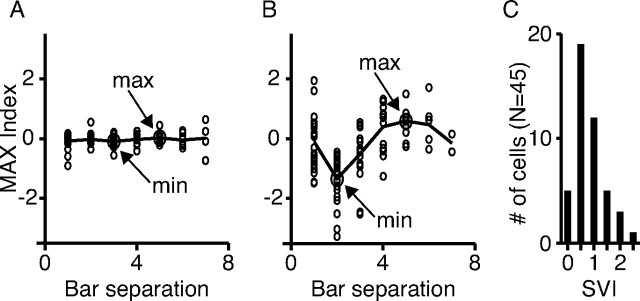
To determine whether the MAX-like behavior of cells such as M1 and M2 is distinct from the classical behavior of cells like C1 and C2, or whether there exists a continuum between MAX-like cells and classical cells, we quantified the degree to which complex cells were sensitive to the separation between bar stimuli. For each cell, the indices from all four graphs of MAX index versus bar separation were combined (Figs. 7A,B, individual points). Indices for opposite-polarity pairs (ON–OFF and OFF–ON) were negated, and then at each bar separation, the points were averaged together to give a composite MAX index (Figs. 7A,B, solid lines).
Figure 7.
Method for measuring complex cell spatial variation. A, Average MAX indices (composite MAX index) for cell M1. The SVI is derived by taking the largest composite MAX index and subtracting the smallest composite MAX index. B, Same as in A for the cell C3. C, Histogram of the SVI showing a continuum of MAX-like behavior over the population.
Figures 7, A and B, shows the composite MAX indices for a MAX-like cell (M1), and a more classical cell (C3). To quantify the sensitivity of the composite MAX index to bar separation, we took the difference between the maximum and minimum composite MAX indices, which we refer to as the spatial-variation index (SVI). Cells like M1 and M2 with little or no modulation to their composite MAX index profiles had small SVIs (M1, 0.2; M2, 0.1). Cells with highly modulated composite MAX index profiles like C1 and C2 had larger SVIs (C1, 1.1; C2, 2.4). A histogram of the SVIs for the 45 cells studied is plotted in Figure 7C.
We also applied a second method, one that does not rely on MAX indices, to evaluate the dependence of stimulus interactions on bar separation distance; this method, which is based on the difference between the average responses to same-polarity and opposite-polarity pairs at each bar separation, is detailed in supplemental Figure 5 (available at www.jneurosci.org as supplemental material). The correlation between the two measurements of spatial variation was very strong (r = 0.86; p < 0.001). Neither metric gives any indication that the population of complex cells is split into two distinct groups. Instead, both measures show a unimodal distribution (supplemental Fig. 5C, available at www.jneurosci.org as supplemental material).
Spatial-frequency peak and bar-pair interactions
Movshon et al. (1978) demonstrated that the spatial-frequency tuning of some complex cells could be explained by the spatial interactions among paired bar stimuli. This relationship falls out naturally from the commonly used energy model of complex cell receptive fields (Adelson and Bergen, 1985). In the model, a single complex cell receives the squared output of two simple cells with overlapping receptive fields that are 90° out of spatial phase from each other. The preferred spatial frequency of the complex cell derives from the preferred spatial frequencies of the presynaptic simple cells, which are assumed to be identical. Because simple cells are roughly linear in spatial summation, their preferred spatial frequencies are, in turn, determined mostly by the distance between their subfields. At the same time, subfield separation determines the way in which the simple cells, and therefore the complex cells they project to, respond to paired bars. When bars of opposite polarity are separated by the same amount as the underlying subfields, that is, when a bright bar falls in a simple cell's ON region and a dark bar falls in the simple cell's OFF region, the simple cell (and consequently the complex cell) will respond strongly. Conversely, bars of the same polarity that fall one in an ON region and one in an OFF region will antagonize each other such that the simple cell (and the complex cell) will not respond strongly (supplemental Fig. 6, available at www.jneurosci.org as supplemental material).
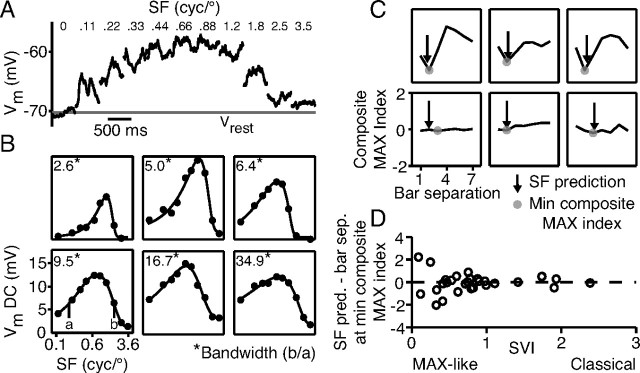
According to the energy model, then, the separation between same-polarity bars that generates maximum suppression in a complex cell (or, equivalently, the separation between opposite-polarity bars that yields maximum facilitation), should be one-half the reciprocal of the preferred spatial frequency of the cell. In terms of the MAX index, the reciprocal of preferred spatial frequency should equal the bar separation for which the composite MAX index is the smallest. We tested this expectation by measuring the spatial-frequency tuning of complex cells with drifting gratings. The cycle averaged responses of an example cell are shown in Figure 8A. Tuning curves were constructed from the mean depolarization at each spatial frequency and fit with a six-parameter function (see Materials and Methods). In Figure 8B, tuning curves for six different cells are shown, three with very classical behavior (top) and three with MAX-like behavior (bottom).
Figure 8.
Complex cell preferred spatial frequencies predict the distance of maximum paired-bar suppression. A, Cycle-averaged responses of a complex cell to drifting gratings of varied spatial frequency. B, Spatial-frequency tuning curves for six cells with similar preferred spatial frequencies; their bandwidths, however, varied considerably. The smooth curve is a least-squares fit to the data (closed circles). C, Plots of composite MAX indices for the cells in B and predictions of minimal composite MAX index (filled circles) from the preferred spatial frequency (vertical arrows). D, Difference between the location of the smallest composite MAX indices and the predictions based on spatial frequency plotted against SVI. The predictions are worse for MAX-like cells.
The comparison between preferred spatial frequency and paired bar interactions is shown in Figure 8C. Here, we plot the composite MAX index against bar separation for the same cells as in Figure 8B. The vertical arrow in each graph points to the bar separation at which maximum suppression should be observed considering the cell's preferred spatial frequency in response to drifting gratings. That is, the position of the arrow is at one-half of the reciprocal of the preferred spatial frequency. Note that the prediction is plotted in terms of the bar width used for stimulation (rather than degrees of visual angle).
For cells that were more classical in their behavior (strong dependence of the MAX index on bar separation) (Fig. 8C, top), the predictions based on preferred spatial frequency clearly matched the bar separations at which the composite MAX index was minimal (filled circles). For MAX-like cells (cells with weak dependence of MAX index on bar separation) (Fig. 8C, bottom), the match was more variable. To capture this observation for the population, we quantified the match by taking the difference between the location of the arrow in Figure 8C and the location of the minimum of the composite MAX index. We then plotted this difference against the spatial-variation index for each cell (Fig. 8D). As can be seen from the graph, the more classical a cell's behavior was (the larger the SVI of the cell), the better the match between the predicted and measured bar separation yielding a minimal composite MAX index.
Spatial-frequency bandwidth and bar-pair interactions
An underlying assumption of the energy model is that the preferred spatial frequencies of the presynaptic simple cells are identical. In this way, bars of a given polarity and separation will interact similarly, regardless of their absolute position within the complex cell's receptive field. One possible difference between classical complex cells and more MAX-like complex cells, then, is that in the former the constituent simple cells match in spatial frequency, whereas in the latter they do not. The spatial-frequency tuning curves of Figure 8B are suggestive in this regard, in that the classical complex cells (top row) are more narrowly tuned for spatial frequency than the MAX-like cells (bottom row). This relationship would be consistent with the simple-cell inputs to MAX-like cells having a range of preferred spatial frequencies, rather than matching preferred spatial frequencies.
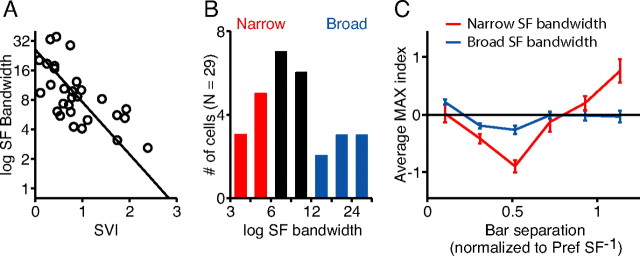
To determine whether spatial-frequency bandwidth is correlated with MAX-like behavior, we derived bandwidths for each cell from the fitted tuning curves by dividing the high and low spatial-frequency cutoffs (at which half-maximal responses were observed). Bandwidths for curves in Figure 8B are indicated by the number in the top left corner of each panel. In Figure 9A, bandwidth is plotted against the degree of MAX-like behavior for each cell (Fig. 7, spatial-variation index). The plot shows a significant negative correlation (r = 0. 65; p < 0.001).
Figure 9.
The relationship between spatial-frequency bandwidth and complex cell spatial variation. A, Plot showing negative correlation between the spatial-variation index and spatial-frequency bandwidth for 29 complex cells (r = 0.65). B, Histogram of spatial-frequency bandwidth over the population. C, MAX indices for eight cells with narrow spatial-frequency bandwidths (<6, red cells in B) were averaged after converting their raw bar distances to multiples of the preferred spatial period (red curve). Maximal suppression and facilitation for the average MAX indices occurred around 0.5, as predicted. MAX indices for eight cells with broad spatial-frequency bandwidths (>12, blue cells in B) were also averaged (blue curve). The curve stayed much closer to the line y = 0, or perfect MAX behavior, than the curve for cells with narrow spatial-frequency bandwidths. Error bars indicate SEM.
Figure 9C demonstrates explicitly the relationship between MAX behavior and spatial-frequency-tuning bandwidth. Here, we chose two subsets of complex cells, the eight cells with the narrowest bandwidths (Fig. 9B, red), and the eight cells with the widest bandwidths (Fig. 9B, blue). For each subset, we averaged together the plots of MAX index versus bar separation distance (plots like those in Fig. 7A,B). Before combining the plots, however, we rescaled the x-axis in units of optimal spatial period. That is, a value of 1 on the x-axis is equal to the reciprocal of the preferred spatial frequency of a given cell, as measured with drifting gratings. Using this normalization, the spacing of points on the x-axis became different for each cell, because the bar width in relation to the preferred spatial period was not the same over the population. To obtain the average curves, then, the entire set of points for each group of eight cells was binned in intervals of approximately one-fourth of the preferred period.
It is clear from the graphs in Figure 9C that cells with large spatial-frequency bandwidths (blue line and SEM bars) show significantly less modulation in their MAX index profiles than cells with narrow bandwidths (red line and SEM bars). Both curves peak at one-half the preferred spatial period, as would be expected from the energy model. The curve for the large-bandwidth (>12) cells, however, has a peak amplitude less than half that of the small-bandwidth (<6) cells, the peak is broader, and the curve falls nearly to 0 for larger bar separations. Overall, the average MAX index then depends only weakly on bar separation for cells with large spatial-frequency bandwidths.
Spatial-frequency bandwidth in the energy model
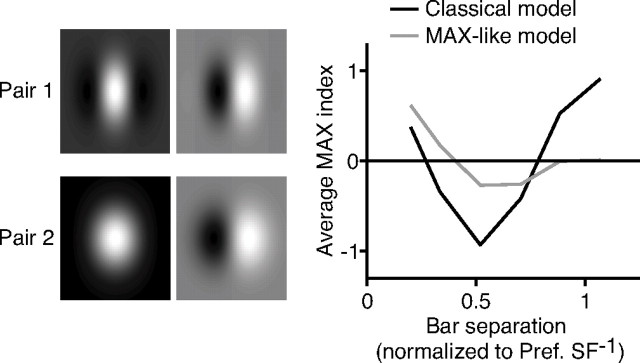
We proposed above that one way to generate MAX-like cells is to modify the energy model (Adelson and Bergen, 1985) by combining inputs from simple cells with a range of preferred spatial frequencies. To test the effect of this scenario on MAX-like behavior in complex cells, we created two versions of the energy model. In the classical version, the complex cells received input from a single pair of simple cells with identical preferred spatial frequencies and receptive fields 90° out of spatial phase from one another. The sensitivity of each simple cell varied (in the direction perpendicular to the preferred orientation) as a Gabor function of distance: S1 = cos(1.5πx) × e−x2/0.23; S2 = sin(1.5πx) × e−x2/0.23.
In the MAX-like version of the model, the complex cell received input from an additional pair of simple cells with a preferred spatial frequency of a little less than half that of those in pair 1: S3 = cos(0.6πx) × e−x2/0.23; S4 = sin(0.6πx) × e−x2/0.23.
For each version of the model, we presented 6000 pairs of bars, either with the same or opposite polarity, that were one-eighth the size of the receptive fields of the model cells, with the bar positions chosen randomly and constrained only to be nonoverlapping. The response of each constituent simple cell to a bar was obtained by summing the extent of the receptive field of the simple cell covered by the bar (taking the dot product of the stimulus and the receptive field sensitivity profile); the response to bar pairs was taken as the sum of the responses to each bar individually. All responses were measured relative to rest (0 mV). To obtain the response of the complex cells, the output of each simple cell was squared and then all of the outputs were summed, with the result normalized by taking the square root (for an equivalent and more physiological formulation, see Discussion). MAX indices were calculated and then grouped according to the distance between bar centers in the same manner as the experimental data; note that here, as in Figures 7, A and B, and 8C, the MAX indices for opposite polarity pairs were negated before averaging.
The average MAX indices for both versions of the model are plotted in Figure 10. The two simple models successfully captured many qualitative features of the curves in Figure 9C. With simple cell pair 1 alone providing input, the average MAX index for the model complex cell was strongly dependent on bar separation, with a pronounced trough at a separation of one-half of the preferred spatial period, similar to the real data. At larger separations, the average MAX index reached well above 0, again matching the behavior of real complex cells seen in Figure 9C. Most importantly, in the model complex cell with input from pair 1 and pair 2, both the trough in the average MAX index at small distances and the peak at larger distances were reduced, as was observed in the real complex cells with large spatial-frequency bandwidths. Thus, even in this extremely simplified model, input from simple cells with different preferred spatial frequencies prevented the full expression of suppression and facilitation that is expected from an energy model with simple cells that have identical spatial-frequency tuning.
Figure 10.
Multiple spatial-frequency channels in an energy model of complex cells produce MAX-like responses. An energy model with two simple cells in quadrature phase (pair 1), whose responses were measured relative to rest (0 mV) and squared (which is physiologically equivalent to using four simple cells with rectification at rest and half-squaring), generates MAX index plots similar to those for complex cells with narrow spatial-frequency bandwidths (red curve). An energy model with two pairs (pair 1 and pair 2) of simple cells having different preferred spatial frequencies generates MAX index plots similar to those for complex cells with broad spatial-frequency bandwidths (blue).
Discussion
Lampl et al. (2004) observed MAX-like behavior in complex cells, but because single cells were not tested with a complete stimulus set and the indices measured from many cells were aggregated in their analysis, the authors could only draw conclusions about the average behavior of cortical complex cells. We have studied complex cells in more detail and observed that the manner in which individual complex cells integrate stimuli across their receptive fields is diverse. Many cells exhibit the classical patterns of interaction observed in previous extracellular experiments such as those of Movshon et al (1978). Others perform an almost perfect MAX-like computation similar to that reported by Lampl et al. (2004).
A continuum of complex cell behavior
Although we make reference to two distinct patterns of response, it is clear that the distinction between MAX-like and classical complex cells is one of degree and not one of type. Quantitative measures of MAX-like behavior (Fig. 7, spatial-variation index, and a second index in supplemental Fig. 5, available at www.jneurosci.org as supplemental material) showed that complex cells fall along a continuum. This observation is in line with the characterization of complex cells as an extremely heterogeneous group that defies easy subcategorization. We have not attempted here to match various classification schemes for complex cells [for example, the A, B, and C subgroups of Henry et al. (1978), or the special complex cells many of which project to the superior colliculus (Palmer and Rosenquist, 1974; Gilbert, 1977)] with variation along the SVI axis. Additional study will also be required to determine whether MAX-like behavior varies systematically among cortical layers. A preliminary analysis correlating electrode depth with SVI for our data would suggest, however, that it does not. SVI also does not correlate with the F1/F0 metric for classifying simple and complex cells (Skottun et al., 1991). For most of the complex cells in this study, F1/F0 lies between 0.2 and 0.3.
Evidence for models of complex cell formation
Hubel and Wiesel (1962) proposed a hierarchical model in which simple cells converge onto complex cells, preserving orientation selectivity, but generating phase insensitivity. Some complex cells, however, particularly those in lower layer 3 and below, receive direct input from relay cells of the lateral geniculate nucleus. Alternatives to the hierarchical model have made use of this connection to construct complex cell receptive fields. Mel et al. (1998), for example, proposed that individual complex cell dendrites could act similarly to simple cell subfields by integrating input from LGN relay cells aligned in space; complete simple cell-like input would then be mimicked by the integration of multiple dendrites in the complex cell soma. There is as yet, however, no clear evidence that this scheme is used in cortex.
Evidence for the hierarchical model, both direct and indirect, has come in many forms. Based on the matches obtained between two-bar profiles and predictions of those profiles derived from spatial-frequency tuning, Movshon et al. (1978) concluded that spatial-frequency tuning for some complex cells could be explained by the convergence of input from relatively linear subunits similar to simple cells. Anatomical experiments (Gilbert and Wiesel, 1979) show a strong projection from layer 4, which contains a large number of simple cells, to layers 2 and 3, where complex cells predominate. Alonso and Martinez (1998) showed that complex cells in the upper layers receive monosynaptic excitatory input from simple cells with overlapping and similarly oriented receptive fields.
Complex cell energy models
The energy model of Adelson and Bergen (1985) demonstrated theoretically that a complex cell could be built from the squared output of two linear filters (approximations to simple cells) with receptive fields offset by 90° in spatial phase, and indirect evidence for such a mechanism has been obtained from analyses of one-dimensional (bars) and two-dimensional (spots) white-noise experiments on complex-cell receptive fields (Touryan et al., 2002, 2005; Rust et al., 2005). We note that the energy model as traditionally formulated has some physiological correlates, but is not altogether realistic. For example, the squaring of simple-cell input implies that simple cells are only sensitive to the magnitude of a contrast change, but not its sign. A more realistic model would substitute two simple cells for each one simple cell in the model, with the new simple cells having identical receptive field positions but opposite subunit signs. Each simple cell would then give half-squared output with rectification at rest, the half-squaring arising from the power-law relationship between membrane potential and spike rate as observed previously (Hansel and van Vreeswijk, 2002; Miller and Troyer, 2002; Priebe and Ferster, 2005).
In the original energy model, the output of the complex cells is un-normalized, being simply the squared sum of the inputs. Because squaring is an expansive nonlinearity, the range of MAX indices produced by such a model is far larger than those observed in real complex cells. The square-root normalization of the complex cells' output we have used in our model is designed to make the relationship between stimulus contrast and response amplitude more physiological and to bring the MAX indices into a more realistic range, between approximately −1 and 1. Although the square root is a computationally convenient way of performing this normalization, it carries no theoretical significance. Other compressive or saturating nonlinear functions, such as the soft-MAX function or divisive normalization would serve equally well (Riesenhuber and Poggio, 1999, 2002). Physiological mechanisms that could contribute to the normalization step in the model include synaptic depression, depolarization-induced changes in driving force on synaptic currents, and synaptic inhibition (Heeger, 1992).
Conclusions
In this work, we characterized complex cells on the basis of their membrane-potential responses. Although we have not made a systematic study of the MAX-like behavior of complex cells spike responses, it is likely that complex cells would show a range of behaviors in spiking similar to what we find in the membrane potential responses. Lampl et al. (2004) reported that complex cell spike responses were MAX-like on average. And two example cells, one MAX-like cell and one classical, in which the membrane potential and spike responses were similar in character, are shown in supplemental Figure 7 (available at www.jneurosci.org as supplemental material). A quantitative characterization of the range of complex cell MAX behavior in spiking would require a comprehensive extracellular study.
On the face of it, MAX-like behavior might seem contradictory to that expected from a hierarchical or energy model, because in such models, the interactions between stimuli at each stage propagate in a manner that should reflect the combination of stimuli as opposed to favoring one stimulus over the other. As we have shown, however, incorporating simple cells with different preferred spatial frequencies into the energy model can account for important aspects of MAX-like complex cells, including broader spatial-frequency tuning and a minimal dependence of MAX indices on bar separation distance or polarity. The model as presented was designed to replicate the average behavior of MAX-like complex cells (Fig. 8), which shows some variation in the MAX index with bar separation. Changing the saturation function for complex cell output and adding more simple cells with different preferred spatial frequencies can produce responses that are closer to the almost perfectly invariant behavior seen in some individual cells, such as in Figure 5A.
The energy model is parsimonious in that it can account for both MAX-like and classical complex cells, the only difference being the preferred spatial frequencies of its component simple cells. Other models are possible. As suggested by Lampl et al. (2004), a MAX response to a bar pair would be expected if the bar that evoked the larger response also evoked strong shunting inhibition. The authors further suggest that measuring the conductance changes evoked by paired bar stimuli could potentially determine whether inhibitory mechanisms contribute to MAX-like behavior. A second possibility is that direct relay-cell inputs could be combined onto the complex-cell dendrites to mimic the energy model (Mel et al., 1998), but with the dendritic subunits each having different preferred spatial frequencies. Experiments to determine whether MAX-like and classical complex cells receive different amounts of monosynaptic input from geniculate relay cells could help to address this question.
Whether MAX-like behavior arises from the convergence of multiple spatial-frequency channels or through a different network mechanism (Ohzawa et al., 1990; Mel et al., 1998; Chance et al., 1999; Tao et al., 2004; Serre et al., 2007), our observation that a subset of complex cells in the primary visual cortex compute a MAX operation over a wide variety of stimuli affirms the conclusion of Lampl et al. (2004). The authors wrote that the visual system may use MAX-computing complex cells to achieve robust object recognition as in the model proposed by Riesenhuber and Poggio (1999). Given the recent successes of their model in high-level object recognition (Serre et al., 2007), the potential is great for a computational approach to continue to inform biological experimentation, and vice-versa, in the study of the functioning of the neocortex.
Footnotes
This work was supported by National Eye Institute Grant R01 EY04726 and National Institute of Mental Health Grant P20 MH066239. We thank Tomaso Poggio, Ulf Knoblich, and Nicholas Priebe for helpful discussions, and Ilan Lampl, Jose-Manuel Alonso, and Maximilian Reisenhuber for comments on this manuscript.
References
- Adelson EH, Bergen JR. Spatiotemporal energy models for the perception of motion. J Opt Soc Am. 1985;2:284–299. doi: 10.1364/josaa.2.000284. [DOI] [PubMed] [Google Scholar]
- Alonso JM, Martinez LM. Functional connectivity between simple cells and complex cells in cat striate cortex. Nat Neurosci. 1998;1:395–403. doi: 10.1038/1609. [DOI] [PubMed] [Google Scholar]
- Chance FS, Nelson SB, Abbott LF. Complex cells as cortically amplified simple cells. Nat Neurosci. 1999;2:277–282. doi: 10.1038/6381. [DOI] [PubMed] [Google Scholar]
- Emerson RC, Citron MC, Vaughn WJ, Klein SA. Nonlinear directionally selective subunits in complex cells of cat striate cortex. J Neurophysiol. 1987;58:33–53. doi: 10.1152/jn.1987.58.1.33. [DOI] [PubMed] [Google Scholar]
- Gawne TJ, Martin JM. Responses of primate visual cortical V4 neurons to simultaneously presented stimuli. J Neurophysiol. 2002;88:1128–1135. doi: 10.1152/jn.2002.88.3.1128. [DOI] [PubMed] [Google Scholar]
- Gilbert CD. Laminar differences in receptive field properties of cells in cat primary visual cortex. J Physiol (Lond) 1977;268:391–421. doi: 10.1113/jphysiol.1977.sp011863. [DOI] [PMC free article] [PubMed] [Google Scholar]
- Gilbert CD, Wiesel TN. Morphology and intracortical projections of functionally characterized neurons in the cat visual cortex. Nature. 1979;280:120–125. doi: 10.1038/280120a0. [DOI] [PubMed] [Google Scholar]
- Hansel D, van Vreeswijk C. How noise contributes to contrast invariance of orientation tuning in cat visual cortex. J Neurosci. 2002;22:5118–5128. doi: 10.1523/JNEUROSCI.22-12-05118.2002. [DOI] [PMC free article] [PubMed] [Google Scholar]
- Heeger DJ. Normalization of cell responses in cat striate cortex. Vis Neurosci. 1992;9:181–197. doi: 10.1017/s0952523800009640. [DOI] [PubMed] [Google Scholar]
- Henry GH, Goodwin AW, Bishop PO. Spatial summation of responses in receptive fields of single cells in cat striate cortex. Exp Brain Res. 1978;32:245–266. doi: 10.1007/BF00239730. [DOI] [PubMed] [Google Scholar]
- Hubel DH, Wiesel TN. Receptive fields, binocular interaction and functional architecture in the cat's visual cortex. J Physiol (Lond) 1962;160:106–154. doi: 10.1113/jphysiol.1962.sp006837. [DOI] [PMC free article] [PubMed] [Google Scholar]
- Lampl I, Ferster D, Poggio T, Riesenhuber M. Intracellular measurements of spatial integration and the MAX operation in complex cells of the cat primary visual cortex. J Neurophysiol. 2004;92:2704–2713. doi: 10.1152/jn.00060.2004. [DOI] [PubMed] [Google Scholar]
- Livingstone MS, Conway BR. Substructure of direction-selective receptive fields in macaque V1. J Neurophysiol. 2003;89:2743–2759. doi: 10.1152/jn.00822.2002. [DOI] [PMC free article] [PubMed] [Google Scholar]
- Mel BW, Ruderman DL, Archie KA. Translation-invariant orientation tuning in visual “complex” cells could derive from intradendritic computations. J Neurosci. 1998;18:4325–4334. doi: 10.1523/JNEUROSCI.18-11-04325.1998. [DOI] [PMC free article] [PubMed] [Google Scholar]
- Miller KD, Troyer TW. Neural noise can explain expansive, power-law nonlinearities in neural response functions. J Neurophysiol. 2002;87:653–659. doi: 10.1152/jn.00425.2001. [DOI] [PubMed] [Google Scholar]
- Movshon JA, Thompson ID, Tolhurst DJ. Receptive field organization of complex cells in the cat's striate cortex. J Physiol (Lond) 1978;283:79–99. doi: 10.1113/jphysiol.1978.sp012489. [DOI] [PMC free article] [PubMed] [Google Scholar]
- Ohzawa I, DeAngelis GC, Freeman RD. Stereoscopic depth discrimination in the visual cortex: neurons ideally suited as disparity detectors. Science. 1990;249:1037–1141. doi: 10.1126/science.2396096. [DOI] [PubMed] [Google Scholar]
- Palmer LA, Rosenquist AC. Visual receptive fields of single striate cortical units projecting to the superior colliculus in the cat. Brain Res. 1974;67:27–42. doi: 10.1016/0006-8993(74)90295-9. [DOI] [PubMed] [Google Scholar]
- Priebe NJ, Ferster D. Direction selectivity of excitation and inhibition in simple cells of the cat primary visual cortex. Neuron. 2005;45:133–145. doi: 10.1016/j.neuron.2004.12.024. [DOI] [PubMed] [Google Scholar]
- Riesenhuber M, Poggio T. Hierarchical models of object recognition in cortex. Nat Neurosci. 1999;2:1019–1025. doi: 10.1038/14819. [DOI] [PubMed] [Google Scholar]
- Riesenhuber M, Poggio T. Neural mechanisms of object recognition. Curr Opin Neurobiol. 2002;12:162–168. doi: 10.1016/s0959-4388(02)00304-5. [DOI] [PubMed] [Google Scholar]
- Rust NC, Schwartz O, Movshon JA, Simoncelli EP. Spatiotemporal elements of macaque v1 receptive fields. Neuron. 2005;46:945–956. doi: 10.1016/j.neuron.2005.05.021. [DOI] [PubMed] [Google Scholar]
- Sato T. Interactions of visual stimuli in the receptive fields of inferior temporal neurons in awake macaques. Exp Brain Res. 1989;77:23–30. doi: 10.1007/BF00250563. [DOI] [PubMed] [Google Scholar]
- Sceniak MP, Hawken MJ, Shapley R. Contrast-dependent changes in spatial frequency tuning of macaque V1 neurons: effects of a changing receptive field size. J Neurophysiol. 2002;88:1363–1373. doi: 10.1152/jn.2002.88.3.1363. [DOI] [PubMed] [Google Scholar]
- Serre T, Wolf L, Bileschi S, Riesenhuber M, Poggio T. Robust object recognition with cortex-like mechanisms. IEEE Trans Pattern Anal Mach Intell. 2007;29:411–426. doi: 10.1109/TPAMI.2007.56. [DOI] [PubMed] [Google Scholar]
- Skottun BC, De Valois RL, Grosof DH, Movshon JA, Albrecht DG, Bonds AB. Classifying simple and complex cells on the basis of response modulation. Vision Res. 1991;31:1079–1086. doi: 10.1016/0042-6989(91)90033-2. [DOI] [PubMed] [Google Scholar]
- Szulborski RG, Palmer LA. The two-dimensional spatial structure of nonlinear subunits in the receptive fields of complex cells. Vision Res. 1990;30:249–254. doi: 10.1016/0042-6989(90)90040-r. [DOI] [PubMed] [Google Scholar]
- Tao L, Shelley M, McLaughlin D, Shapley R. An egalitarian network model for the emergence of simple and complex cells in visual cortex. Proc Natl Acad Sci USA. 2004;101:366–371. doi: 10.1073/pnas.2036460100. [DOI] [PMC free article] [PubMed] [Google Scholar]
- Touryan J, Lau B, Dan Y. Isolation of relevant visual features from random stimuli for cortical complex cells. J Neurosci. 2002;22:10811–10818. doi: 10.1523/JNEUROSCI.22-24-10811.2002. [DOI] [PMC free article] [PubMed] [Google Scholar]
- Touryan J, Felsen G, Dan Y. Spatial structure of complex cell receptive fields measured with natural images. Neuron. 2005;45:781–791. doi: 10.1016/j.neuron.2005.01.029. [DOI] [PubMed] [Google Scholar]


