

Abstract
The hippocampus encodes both spatial and nonspatial aspects of a rat's ongoing behavior at the single-cell level. In this study, we examined the encoding of intended destination by hippocampal (CA1) place cells during performance of a serial reversal task on a double Y-maze. On the maze, rats had to make two choices to access one of four possible goal locations, two of which contained reward. Reward locations were kept constant within blocks of 10 trials but changed between blocks, and the session of each day comprised three or more trial blocks. A disproportionate number of place fields were observed in the start box and beginning stem of the maze, relative to other locations on the maze. Forty-six percent of these place fields had different firing rates on journeys to different goal boxes. Another group of cells had place fields before the second choice point, and, of these, 44% differentiated between journeys to specific goal boxes. In a second experiment, we observed that rats with hippocampal damage made significantly more errors than control rats on the Y-maze when reward locations were reversed. Together, these results suggest that, at the start of the maze, the hippocampus encodes both current location and the intended destination of the rat, and this encoding is necessary for the flexible response to changes in reinforcement contingencies.
Keywords: hippocampus, place cell, spatial cognition, goals, memory, reversal learning
Introduction
One of the dominant views of the hippocampus is that it contains a neural representation of space, a cognitive map, that encodes locations via the spatial receptive fields of place cells (O'Keefe and Nadel, 1978; O'Keefe, 1999). Individual place cells are active, to a first approximation, whenever the animal's head is in a portion of the environment to which the cell is responsive. However, these neurons are also responsive to ongoing dimensions of the rats' purposive behavior (Markus et al., 1995; Wood et al.,1999, 2000; Frank et al., 2000; Ferbinteanu and Shapiro, 2003; Bower et al., 2005; Smith and Mizumori, 2006; Ainge et al., 2007; Griffin et al., 2007). These and additional empirical clarifications (Huxter et al., 2003; Leutgeb et al., 2005) indicate that the hippocampus likely processes spatial and episodic dimensions of the animal's experience.
Although place cells encode current location, it is not clear how they give rise to a representation of the rat's intended destination (Morris, 1990). One possibility is that a downstream set of “goal” neurons fire maximally near the desired location of the animal (Burgess and O'Keefe, 1996). Evidence for such a representation within the hippocampus has been mixed (Breese et al., 1989; Speakman and O'Keefe, 1990; Lenck-Santini et al., 2001), although representations of arrival at a goal have been observed in the water maze (Hollup et al., 2001; Fyhn et al., 2002) and in an open-field task (Hok et al., 2007). Place fields have been also observed to move toward an intended goal as rats run a series of turns during a continuous T-maze alternation task (Lee et al., 2006).
One way of examining the encoding of intended destination is to look for changes in place cell activity at critical choice points on a maze. Early studies had suggested that rats, in deciding on a destination, use an overall representation of the maze environment to guide performance (Tolman, 1948). If such a representation is based in the hippocampus, one might expect that, as a rat learns that a given choice will lead to reward, a subset of its place fields will begin to reflect both the animal's current location and its intended destination. Such a representation of current location and learned association has been observed with a conditioned auditory stimulus in a fear conditioning task (Moita et al., 2003).
The expectation that place cells may fire differentially at choice points on a maze is a logical extension of several recent observations of prospective, retrospective, and contextual encoding (Frank et al., 2000, 2006; Wood et al., 2000; Ferbinteanu and Shapiro, 2003; Holscher et al., 2004; Bower et al., 2005; Smith and Mizumori, 2006; Ainge et al., 2007) (for review, see Shapiro et al., 2006). If prospective encoding is critical for choice behavior, one would expect that, when faced with a number of alternative destinations, place cells would develop selective firing for specific choices. Our results provide clear evidence for conditional firing and suggest that the hippocampus encodes the intended destination of the rat at the beginning of the maze.
Materials and Methods
Apparatus.
The maze was built of wood and painted black. It consisted of a start box area, three choice points, connecting alleyways, and four goal boxes. These were arranged in a double Y-maze configuration (Fig. 1a). The start box, choice points, and goal boxes were all octagons with 25 cm between opposing edges. The octagons had 30-cm-high walls. The interconnecting alleyways were 25 cm long and 8 cm wide with 10-cm-high walls. Each goal box contained a round ceramic food bowl of 5 cm depth. To help distinguish the four goal boxes from one another, we equipped each box with a different object (unopened bottle of salad dressing, metal plate, unopened liquid soap, and rock), ∼15 cm high × 8 cm wide × 5 cm deep, and a different Perspex figure. The figure was attached to the wall opposite the object, and the shape and color of each figure was different in each box. The maze was mounted on circular stools so that it rested 64 cm above the floor, and it was situated in a square curtained enclosure (1.85 m square) with no deliberate extramaze cues.
Figure 1.

A, Schematic representation of the concatenated Y-maze. In pretraining, two of the four goal boxes contained reward in each block of 10 trials. In this example, boxes 2 and 4 are rewarded in the first 10 trials and boxes 1 and 3 in the second 10 trials. B, Representation of the binned areas used to examine the influence of goal destination on place cell firing. C, Example of the paths taken by a rat on 20 consecutive trials. The paths are ballistic and reflect little hesitation at choice points. The rat returns to the same goal on every trial until it is not rewarded and then immediately chooses another box. If that box is rewarded, it returns to this location in subsequent trials. This illustrates the ability of the rat to learn in one trial that the reward location has changed. D, Frequency distribution of place fields on the maze. Higher peaks and warmer colors indicate higher numbers of place fields.
Behavioral training.
The goal of the task was for the rat to find out which of four goal boxes contained a food reward [Weetos chocolate cereal loops (Weetabix, Kettering, UK); broken into halves or quarters] and to return to a “correct” (reinforced) box over blocks of 10 consecutive trials (Fig. 1a). Two of the four goal boxes were baited on every trial, and, on different days, different pairs of goal boxes were baited such that all combinations of boxes were presented. To increase the likelihood that the rats would return to the rewarded goal boxes, each baited food bowl contained more cereal loop pieces than could be consumed on an individual trial. It was reasoned that rats would be more likely to return to a location where they perceived that food remained, as opposed to returning to a location where they have just consumed all the reward. After 10 trials, the food reward was shifted to other combinations of boxes, and the rat's task was to switch to a different rewarded goal box. Within 1 d, the order of baited boxes was pseudorandomized to ensure the rat visited all boxes.
Before their training on the task, rats were habituated to the maze for two 10 min sessions with no food or food bowls present. Thereafter, food bowls were added to all four goal boxes. Two food bowls were baited, and the other two were unbaited (although they contained cereal dust to help control for odor cues). Each rat was run for 20 min each day or until 20 trials had been completed, whichever came first.
On each trial, the rat was placed in the start box at the base of the Y and kept in this area briefly by a wooden barrier that blocked the start box door. The experimenter stood in a constant location directly behind the start box. The experimenter then removed the barrier and allowed the rat to explore the maze and choose a goal box. A choice was recorded as an entry into one of the four goal boxes. If the rat chose a goal box that was baited with food, it was allowed to eat for ∼5 s. If the box was not baited, a wooden barrier was placed behind the rat and the rat was kept in the goal box for ∼5 s. The rat was then picked up by the experimenter and replaced in the start box, with the wooden barrier again blocking the start box exit. The maze was then wiped with a weak solution of detergent, and the interval between the end of one trial and the beginning of the next was ∼10 s. Trials were run in blocks of 10. A correct response was a visit to either of the baited goal boxes, although in practice rats would almost always return to the same baited box on consecutive trials. Rats were trained until they reached a criterion of 75% correct (rewarded goal box choices) over 20 trials (within 1 d) for 4 d.
Experiment 1: place fields on a Y-maze
Subjects.
Subjects were five male Lister hooded rats, with a weight range of 330–368 g. They were housed individually and kept on a 12 h light/dark cycle. Behavioral testing was performed during the light phase. During testing, rats were kept on a food deprivation schedule to maintain ∼90% (and not less than 85%) of their free-feeding weight. Testing was performed 5 d/week. In this and the subsequent experiments, compliance was ensured with national [Animals (Scientific Procedures) Act, 1986] and international [European Communities Council Directive of November 24, 1986 (86/609/EEC)] legislation governing the maintenance of laboratory animals and their use in scientific experiments.
Electrode and microdrive preparation.
The electrode arrays consisted of two groups of four tetrodes. Each tetrode consisted of four, Formvar-coated, 25 μm nichrome wires (California Fine Wire, Grover City, CA) twisted together and reinforced by coating with superglue. Each set of four tetrodes was threaded through a 27-gauge thin-walled stainless steel cannula (Small Parts, Miami Lakes, FL), and the individual wires were wrapped around 16 separate pins of an 18 pin socket (Millmax, Oyster Bay, NY). The wires were covered with silver paint to improve the connection to the socket. The remaining two pins of the socket were connected to the cannula and a copper wire, respectively (both of which acted as animal grounds). All of the connections were then secured in place using dental acrylic. Three drive screws (80 threads per inch; Small Parts) were attached to each electrode array, creating a moveable microdrive similar to that described previously (Kubie, 1984). This allowed the tetrodes to be advanced into the brain after surgery. Immediately before the electrode arrays were implanted, the tetrodes were cut to ∼2 mm from the end of the cannula. The electrodes were bubble tested, and their impedance was measured. The impedance of the electrodes before implanting was typically 150 KΩ. The electrode tips were coated in a small drop of carbowax as described previously (Wood et al., 2000), and the cannula was coated in sterile petroleum jelly.
Surgery.
Rats were anesthetized with isofluorane and positioned in a stereotaxic frame (David Kopf Instruments, Tujunga, CA). To maintain hydration, rats were given 5 ml of Hartman's solution intraperitoneally. For analgesia, rats were given a subcutaneous injection of carprofen and buprenorphine before the incision. Isofluorane anesthesia was maintained for the surgery.
Under sterile conditions, the skull was exposed, and lambda and bregma were made level. Two small holes were made 3.5 mm posterior to bregma and ±2.5 mm lateral of the midline, and dura was exposed. The dura was pierced, and the two electrode arrays were lowered to 1.5–1.7 mm below dura, one in each hemisphere. Each electrode array comprised four tetrodes. The ground wire from each electrode array was attached to two different skull screws and coated in silver paint. The electrode arrays were then secured in place by using dental acrylic and five small screws affixed to the skull. Rats were then injected with an additional 5 ml of Hartman's solution. The rats were monitored until they awoke and then placed in a modified home cage designed to prevent the microdrive from getting caught on the cage sides. On the day after surgery, an additional dose of carprofen was given. All animals were allowed 1 week to recover before screening for cells began.
Screening, testing, and data acquisition.
After recovery, rats were screened daily for complex spike activity in a circular arena (68 cm diameter with 49-cm-high walls) within the curtained recording environment. Screening for place cells was done by connecting the rat to the recording system (Axona, Herts, UK) via a lightweight cable and connectors (Millmax) that fit into the sockets on the electrode arrays. The signal from each electrode was passed through an alternating current-coupled unity gain operational amplifier mounted at the base of the cable, proximal to the rat's head. They were then passed, via the recording cable, through a 36-channel commutator (Dragonfly Research and Development, Ridgeley, WV), to the recording system. The signals on each wire within a tetrode were recorded differentially with respect to those recorded on a wire in another tetrode in that electrode array. The signal was amplified (5000–20,000 times) and bandpass filtered (600–6000 Hz). One channel in each array was dedicated to recording EEG. The position of the rat was monitored during the recording session through a black and white camera mounted on the ceiling above the maze. Two groups of ultra-bright light-emitting diodes (LEDs) were attached to the amplifier on the rat's head. These were tracked using the recording system that detected the position of the two groups of LEDs at a sampling rate of 50 Hz. To record neuronal activity, each channel was monitored every 20 μs, and 50 samples per channel were collected whenever the signal on any one of the four channels of a tetrode exceeded a predetermined threshold (set based on signal-to-noise ratio). These digitized spike waveforms were stored on the hard drive of a personal computer, together with the LED coordinates and the time since the start of the recording session. This permitted off-line analysis of correlations between cell activity and the position, head direction, and movement of the animal.
If complex spike activity was observed during the screening session, an 8 min session was recorded in the circular arena with the rat foraging for randomly distributed pieces of cereal. The arena was then removed from the recording enclosure and replaced with the Y-maze. Rats ran at least three blocks of 10 trials on the double Y-maze while complex spike activity was recorded. At the end of the trials, this activity was recorded as the rat explored the Y-maze for 8 min with no food present. Finally, another 8 min session in the circular arena was recorded. If no complex spike activity was seen, the electrodes were advanced by 40–80 μm and allowed to stabilize overnight.
Perfusion and histology.
At the end of the experiment, rats were given an overdose of sodium pentobarbitol, and the electrode position was marked by passing current through the tetrodes making small electrolytic lesions. Rats were perfused transcardially with saline, followed by 4% Formalin, and the brains were removed. Brains were kept in 4% Formalin mixed with 4% potassium ferrocyanide for at least 48 h to elicit a Prussian blue reaction at the tetrode tips. Brains were sectioned on a freezing microtome, with 30 μm sections taken from area of the electrode track.
Place cell identification and analysis.
Initial data analysis was performed using TINT analysis software (Axona) on the data from the circular arena and the free exploration of the Y-maze. Spikes were sorted into clusters using comparisons of peak amplitude, trough, and time-to-peak and trough on each channel. Autocorrelograms were generated for each cluster to ensure that no spikes fired within 1.5 ms of any other spikes from the same cluster. Clusters were then processed by a program (F-rate; Axona) to measure mean spike duration, amplitude, and firing rate over the whole session. Only clusters with mean amplitude >95 μV on at least one channel, mean spike duration of over 250 ms, and mean firing rate of <2.5Hz over the whole session were accepted for analysis. Firing rate maps were generated by dividing the maze into a grid of 60 × 60 pixels (each pixel being 3 × 3 cm). The firing rate for each pixel was calculated by dividing the number of spikes fired in that pixel by the number of seconds that the rat spent there. Cells were deemed to have place fields on the maze if there were at least six adjacent pixels with a firing rate of at least three times the session mean firing rate. Only cells with well defined place fields on the Y-maze were used for additional analysis. Recordings from consecutive days were closely examined, and cells with similar cluster boundaries across days were only counted once. Cluster quality was examined using a custom-written Matlab program (Steven Huang, University of Edinburgh, Edinburgh, UK). For each tetrode, energy and first principle component of the waveforms for each session were calculated. Using these, the Lratio and isolation distance (i.d.), as described by Schmitzer-Torbert et al. (2005), were derived.
Influence of intended destination.
For cell isolation, the cluster parameters from the 8 min session on the Y-maze were applied to the preceding test trials. In some cases, very few spikes were seen in the test trials using these cluster parameters. If <50 spikes were recorded across trials within the recording session of a day, the cell was excluded from additional analysis.
To examine firing rates during the test trials, the maze was divided up into areas of interest (Fig. 1b) and assessed using a Matlab script. For each trial, the number of spikes fired and time spent in each area were extracted, and these data were used to calculate an average firing rate in each area for every trial. To avoid double-counting fields that occupied more than one adjacent area, such fields were assigned to one of the two areas on an alternating basis. The trials were then separated by the goal box the rat selected. As is evident from Figure 1b, the start box (area 1) and common stem (area 2) of the maze were common to all four goal box trajectories. To see whether place cell firing in the start box or common stem differed as a function of the rat's destination, we compared the firing rate of cells using a univariate ANOVA with destination (goal box) as the independent factor. Additional analyses examined firing rates in the alleyways after the first choice point (areas 3 and 4). In both of these locations, there are two possible subsequent destinations that the rat may choose. To examine this, the firing rates of cells with place fields in areas 3 and 4 were analyzed using independent sample t tests with goal destination as the independent factor.
Experiment 2: Y-maze performance after a hippocampal lesion
Subjects.
Ten male hooded Lister rats (weight range of 542–618 g) served as subjects for this experiment. These rats had participated previously in a behavioral study on maze learning but had not been exposed to the Y-maze or undergone invasive procedures. Rats were housed and fed as in experiment 1.
Y-maze training.
Before surgery, rats were trained on the Y-maze task as in experiment 1. Rats were first habituated to the maze in a single 10 min session and then given daily sessions comprising 10 trials. Reward was available in two of the four goal locations, and the rewarded locations were changed daily. Thus, on the initial trial of a day, the rats had a 50% chance of making a correct response. Once a rat completed 10 trials in <6 min for 2 consecutive days and did so with six or more correct responses on each day, they were moved to the final phase of presurgery testing. Here, rats were given 20 trials per day, and the two initial reward locations were changed to the previously nonrewarded goal locations after the first 10 trials. Rats were trained in this version of the task until they made an average of seven or more correct responses in their first 10 trials over 3 consecutive days. In addition, rats had to get five of their last six responses correct within their first 10 trials for 2 consecutive days. Two rats did not achieve this last criterion on consecutive days but did so on nonconsecutive days.
Surgery.
After pretraining, rats were assigned to one of two groups: a “hippocampal lesion” group, which received ibotenic acid lesions of the hippocampus (dentate gyrus and CA fields) (n = 6), or a surgical sham lesion, “control” group (n = 4). The general anesthesia and surgical procedures were as in experiment 1. After exposure of the skull, a craniotomy was made bilaterally, exposing the dura above the hippocampus on each side. For rats in the hippocampal lesion group, 13 injections of ibotenic acid (Sigma, Poole, UK) (dissolved in PBS at 10 mg/ml) were made in each hemisphere using techniques adapted from Jarrard (1989) and described previously (Ainge et al., 2006, 2007). The injections were made via a 1 μl syringe (SGE, Milton Keynes, UK) securely attached to a stereotaxic arm (David Kopf Instruments). Ibotenic acid was injected at a rate of 0.1 μl/min, beginning 30 s after the needle was lowered. The needle was removed slowly 1 min and 30 s after the injection. A total of 0.91 μl per hemisphere was used for each lesion (for coordinates and volumes, see Ainge et al., 2007). For rats in the control group, no injections were made. Instead, the dura above the hippocampus was punctured with a needle nine times on each side, at sites corresponding to those at which injections were made in the lesion group. For rats in both groups, the skin was sutured together over the skull. The animals were then placed on a warmed blanket for a short time after surgery. All rats were permitted access to food and water ad libitum after surgery and were allowed 10 d of recovery. The food restriction schedule (see above, Subjects) was then resumed and behavioral testing began.
Postlesion testing.
After surgery, rats were tested on the double Y-maze for 15 20-trial sessions, using the same protocol as in pretraining. In each trial, two of the four goal boxes contained reward on each trial, and the specific boxes that were rewarded at the start of each day varied. After completing the first 10 trials within a session, the reward locations were reversed: the previously unrewarded boxes now contained reward, whereas the previously rewarded boxes did not. To examine the possibility that rats with hippocampal damage may have difficulty extinguishing or inhibiting a previously correct response, an additional three sessions were run with the number of trials in each block being increased to 20. Our prediction was that increasing the number of trials in each block would exacerbate any tendencies to choose previously rewarded locations after a reversal.
The rats were then tested on a standard, within-trial alternation task using only the right side (Fig. 1a, goals 3, 4) of the Y-maze. The left side of the double Y-maze was made inaccessible by removing the alleyway leading to it after the first choice point. Alternation tasks on a T-maze are particularly sensitive to disruption of the hippocampus if there is a delay between arm choices (Ainge et al., 2007). These tasks also require a reversal, in that the rat must choose a location that was not reinforced during the immediately proceeding sample run. This might be a particular challenge for the animals trained on the Y-maze task, because the rats were reinforced for going back to the same locations for 10 or 20 trials (“win-stay”), and then, after the change in reward location, for shifting to the new location (“lose-shift”).
On the sample run, only one of the two goal boxes was open. After entering the box, the rat was picked up by the experimenter and replaced in the start box at the base of the Y-maze. The rat was then permitted to run up the maze. Both the previously visited, “sample” goal box, and the goal box that had been blocked off were open, and reward was only available in the box that had not been visited in the sample run. Rats were given 10 trials per day on the task, and each of the two goal boxes served equally as the sample and goal box.
Perfusion and histology.
At the conclusion of the behavioral testing, rats were given an overdose of sodium pentobarbitol and perfused transcardially with saline, followed by 4% formalin. The brains were removed and fixed in egg yolk and kept in a 4% formalin solution. Subsequently, the brains were sectioned at 50 μm using a freezing microtome. Sections were mounted on gelatin-coated slides and processed for Nissl stain. The extent of hippocampal tissue loss in the lesion group was quantified using an image analysis program (QWin; Leica, Nussloch, Germany). The tissue volume through the anteroposterior extent of the hippocampus was compared with the average hippocampal volume of two sham-lesioned rats.
Results
Experiment 1
Behavioral analysis
Rats reached a criterion level of performance (75% correct for 4 consecutive days) on the Y-maze in an average of 13 d. During the test trials, they made 77.3% correct choices. It should be noted that, because of the serial reversal nature of the task, a number of errors were inevitable. If a rat learned the correct strategy of returning to a reward goal box, it should make an error on the first trial of every new block because it would not know that the reward location has changed. If these errors are removed from the analysis, rats performed at 84.5% correct during the test trials. Figure 1c illustrates paths taken by a rat on 20 consecutive trials of a session. These paths suggest that the rat's movements were ballistic; once the rat was released from the start box, it ran quickly to the goal without deviating or hesitating. The paths also demonstrate the rat's ability to learn, in one trial, that once no reward was found in a goal box it should search elsewhere.
Histology
Inspection of the brain histology confirmed that the electrodes were situated in the hippocampus (Fig. 2) (supplemental Fig. 1, available at www.jneurosci.org as supplemental material). For four of the five subjects, the Prussian blue reaction was consistent with an electrode placement in the CA1 cell layer. In the fifth subject (data not shown), the track of the electrode array was somewhat deeper, and the location of this animal's recordings could not be specified. The data from this animal (six cells) were excluded from the analysis.
Figure 2.

Electrode placement. The arrow indicates the mark of the electrode tip in the dorsal hippocampus.
Place field identification and distribution
A total of 139 cells with place fields fitting the specified criteria were recorded on the Y-maze. A number of these cells had two or more fields, and so a total of 205 place fields were available for analysis. Table 1 presents the cluster quality measures for the cells, using the Lratio and isolation distance measures (for a comparison, see Schmitzer-Torbert et al., 2005). Based on these measures, 110 of the 139 clusters were classified as good (i.d., >30; Lratio, <0.1), 26 were classified as intermediate (i.d., >20; Lratio, <0.15), and three were classified as poor (i.d., <20; Lratio, >0.1). Goal-sensitive cells (discussed below) were observed in nearly equal proportions in both the good and intermediate clusters; none of the three poor clusters were goal sensitive.
Table 1.
Cluster quality measures
| Total | Good (i.d., >30; Lratio < 0.1) | Intermediate (i.d., >20; Lratio, <0.15) | Poor (i.d., <20; Lratio, >0.1) | |
|---|---|---|---|---|
| Number of cells | 139 | 110 | 26 | 3 |
| Average i.d. | 68.28 | 81.62 | 25.65 | 15.02 |
| Average Lratio | 0.062 | 0.045 | 0.106 | 0.213 |
| Goal-sensitive cells | 48 | 39 | 9 | 0 |
| Proportion of goal sensitive | 34.53 | 35.35 | 34.64 | 0 |
Our initial analysis examined the position of the place field on the maze (Fig. 1E) and found that the majority of the place fields were clustered around the start box area. A total of 70 place fields were identified in the start box area, with 52 fields in the start box and 18 fields in the common stem of the maze. A χ2 test comparing the distribution of fields in the start box, choice points, and goal boxes (all of which were the same size) indicated that the observed distribution of field differed significantly from one in which these locations were represented equally [χ2 (7, n = 122) = 108.5; p < 0.005]. An additional 39 fields were found after the first choice point (20 fields on the left alleyway and 19 fields on the right). All of these were assessed for encoding of intended destination.
Influence of goal destination on place fields in the start box area
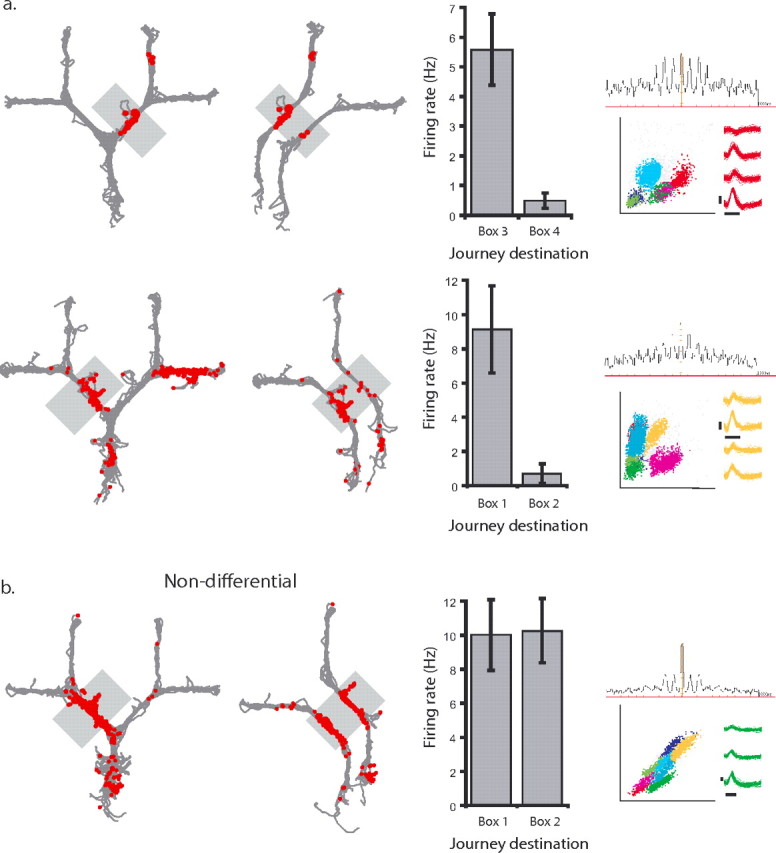
Firing rates in the start box and common stem of the maze were calculated for each of the test trials. The test trials were next grouped in terms of the final goal destination (i.e., goal boxes 1–4), and differences in firing rate as a function of goal destination were examined with univariate ANOVA for each cell. Of the 70 cells with place fields in the start box and common stem of the maze, 32 (46%) showed significant effects of intended goal destination, indicating that firing rates for these cells differed between journeys to different goal boxes. Examples of cells that fired at high rates on journeys to a specific box are shown in Figure 3a. In these four examples, differential place cell activity was manifest in a relatively high rate of firing when the rats made the journey to one goal box and substantially fewer spikes when the rats ran to the other three goal boxes. Twenty-five of 32 place fields with significant differential activity exhibited this pattern of firing (supplemental Table 1, available at www.jneurosci.org as supplemental material). Six of 32 significant fields showed a more graded difference in firing rates between the highest and next highest rate journeys, and only one field showed a high firing rate for journeys to three goals, with a low firing rate to the remaining goal (supplemental Table 1, Fig. 2, available at www.jneurosci.org as supplemental material). Clear examples of differential activity were seen in all rats. In addition, in cells showing differential activity, the firing to “nonpreferred” goal boxes journeys, when present, appeared in the same location as the firing to the high rate journey, consistent with a rate-remapping perspective (Leutgeb et al., 2005).
Figure 3.

CA1 place cells in the start box encode intended destination. A, Four examples (1 on each row) of cells with place fields in the start box that fired predominantly on journeys to one of the four goal boxes. The left column shows all of the paths for a single recording session, with red dots indicating the spikes from one neuron. The shaded gray box is the place field assessed for intended trajectory. The middle left column shows the data separated into journeys to each goal box. The middle right column shows the average firing rate of the cell in the start box on journeys to each of the goal boxes. The right column shows the cluster, waveforms, and autocorrelogram of the cell. Calibration: horizontal lines, 300 μs; vertical lines, 100 μV. B, An example of a cell that had similar firing rates in the start box on journeys to all goal boxes.
Figure 3b is an example of a cell whose firing did not differ as a function of the rat's goal box choice. Thirty-eight of the 70 fields found in the start box and first common stem did not fire differentially. The autocorrelograms for the cell in Figure 3b and those of Figure 3a show theta modulation of the cell firing, consistent with the activity in these fields occurring during theta. (The theta modulation of the third example in Figure 3a was somewhat less robust but this may be attributable in part to the spikes at the arm ends, in which the rat stopped to consume its reward.) It is possible that the number of nondifferential fields may be an overestimate of the true nondifferential firing, because firing on multiple reference frames (Redish, 1999) will occasionally occur in the same location.
Influence of goal destination on place fields after the first choice point
Differential firing was also observed beyond the first choice point. Firing rates in the alleyways to the left and right of the first choice point (areas 3 and 4) were calculated for each trial. Trials were then grouped by goal destination, and a comparison of firing rates for a given place field as a function of the rat's intended destination was performed using an independent samples t test. Of the 39 cells with fields in the alleyways immediately beyond the first choice point, 17 (44%) showed a significant difference in firing rate depending on the rat's destination. Examples of cells that have higher firing rates on journeys to one goal box relative to the other are shown in Figure 4a. As in the start area, place fields that did not differentiate between intended destinations were observed, and an example is shown in Figure 4b.
Figure 4.
CA1 place cells before the final choice point encode intended destination. A, Two examples (1 on each row) of CA1 place cells with place fields before the final choice point that fired predominantly on trials to one of the two possible goals. The left column shows all of the trials from a single session, with the spikes from an individual neuron represented as red dots. The shaded gray box indicates the area of the maze with the place field of interest. The middle left column shows journeys to each goal box separately. The middle right column shows the average firing rate in the gray shaded area for journeys to the two possible goal boxes. The right column shows the cluster, waveforms, and autocorrelogram of the cell. Calibration: horizontal lines, 300 μs; vertical lines, 100 μV. B, An example of a cell that had similar firing rates on journeys to both goal boxes.
As is evident in the second example in Figure 4a, some cells had multiple place fields. To see whether these fields encoded common elements of the maze, we reviewed the place field plots of all 45 cells with multiple fields (supplemental Table 2, available at www.jneurosci.org as supplemental material). The most common pattern, seen in 12 cells, was the presence of a field in the start area and in one of the goal arms. However, only one of these cells fired differentially in the start box to the goal encoded by the second field. Eight cells had a field in the left or right arm after the first choice point and a second field in one of the goal boxes. Only one of these cells fired differentially for the same goal encoded by the second field. Six cells had fields in both the start area and the left or right arms after the first choice point, but only one of these cells showed differential firing in both fields to the same goal. The firing of this cell could be construed as encoding a specific path, but, if so, it represents the only example we observed. Only one cell appeared to encode second choices, e.g., right turns at both second choice points (Fig. 3a, fourth example). However, this cell also fired in the start box when the rat traveled to one of the other arms. Overall, although different combinations of fields were observed (supplemental Table 2, available at www.jneurosci.org as supplemental material), a clear hierarchy in the conditional activity of the fields was not evident. Rather, multiple fields from the same cells appeared to be relatively independent of one another.
The proportions of place fields showing goal sensitivity are shown in Figure 5a. The top plot shows the proportions of place fields found in the start box area (areas 1 and 2) relative to those found before the final choice point (areas 3 and 4). For place fields in the start box area, 32 fields were goal sensitive, and 38 showed no significant influence of intended destination. For the place fields before the second choice point, 17 fields were goal sensitive, whereas 22 were goal nonsensitive. Thus, in both regions, there were somewhat more nondifferential cells (Figs. 3b, 4b) than goal-sensitive cells. Nonetheless, the percentages of fields showing significant differences in firing rate as a function of intended goal, 46% in the start box area and 44% after the first choice point, were considerably higher than the 5% one would expect based solely on type I error.
Figure 5.

A, Proportion of place fields in the start of the maze (areas 1 and 2) and after the start areas, but before the second choice point (top pie chart). These are broken down into the proportions of goal-sensitive and goal-nonsensitive cells in each of these two regions (bottom pie chart). B, Distribution of F ratios for goal-sensitive and goal-nonsensitive fields in the start box and first common stem of the maze (areas 1 and 2).
To assess further the possibility that place fields with differential activity simply reflect the extremes of a distribution of nondifferential fields, we plotted the test statistic for all 70 place fields from areas 1 and 2 (Fig. 5b). The test statistic, the F ratio from the ANOVA, is the ratio of firing rate variability between goals relative to the variability within trials to the same goals. Higher F ratios indicate greater differences in firing rates as a function of intended destination. (Ratios for the differential fields after the first choice point were not included in this analysis because their test statistics were based on different degrees of freedom.) The distribution of the lower, nonsignificant F ratios in Figure 5b resembles a typical F distribution, with a peak near 1. However, the number of fields with statistically significant F ratios (>3) suggests that there is also a separate distribution of goal-sensitive fields.
Dynamic changes in place cell firing within a session
Although the majority of the cells recorded on the maze showed consistent firing within a place field across trials, a number of place cells showed clear changes in firing rates within a test session. From the total 205 place fields recorded, 46 showed intrasession changes in firing. This was characterized as a period of complete inactivity (at least one trial with zero spikes in the place field) followed by a period of sustained firing (at least three trials with firing rate in the place field more than three times the average firing rate for the session).
Nine examples of these changes are shown in Figure 6. The changes fell into three categories. The most prevalent were cells that were silent at the beginning of the sessions and then developed robust place fields after a number of trials (Fig. 6a). Thirty-seven of the 46 fields showed this pattern of place field change. A second category had robust place fields at the beginning of the session, which disappeared after a number of trials (Fig. 6b). Five fields showed this pattern. A third category of cells had fields that moved within a session from one area of the maze to another, for example from a goal box to the start box (Fig. 6c). Four place fields exhibited this pattern of change.
Figure 6.

Place field changes within a session. A, Five examples (1 on each row) of cells that developed robust place fields after several trials. The left column shows the whole session, with red dots indicating spikes fired by an individual neuron. The right column shows the individual trials to a specific goal box (the first one is on the left). B, Two examples (1 on each row) of cells that initially had robust place fields but ceased to fire at some point during the session. The left column shows the whole session, with red dots indicating spikes fired by an individual neuron. The right column shows the individual trials to a specific goal box (the first one is on the left). C, Two examples of cells (1 on each row) whose fields changed locations over maze trials.
In Figure 6, there is some evidence for out-of-field spikes. Although we restricted our analysis to place fields, it is possible that such activity may occur at critical junctures on the maze (Johnson and Redish, 2006).
Experiment 2
Lesion extent
Infusions of ibotenic acid produced significant, although not complete, removal of the neuropil within the hippocampus. Damage was greater in the anterodorsal hippocampus; substantial neuronal sparing was observed in the more posteroventral hippocampus. As can be seen in Table 2, the percentage of dorsal hippocampus removed ranged from 46.2 to 64.6%, with an average tissue loss of 57.4%. For the entire hippocampus, the average amount of tissue loss was 45.8%, with a range of 37.5–54.7%.
Table 2.
Percentage of tissue loss within the hippocampus
| Subject | % Dorsal lesion | % Total lesion |
|---|---|---|
| 7 | 64.4 | 54.7 |
| 5 | 61.9 | 45.6 |
| 2 | 60.2 | 52.7 |
| 6 | 56.2 | 42.6 |
| 10 | 55.4 | 37.5 |
| 1 | 46.2 | 41.4 |
| Average | 57.4 | 45.8 |
Postlesion behavior
Figure 7a shows the performance of the hippocampal lesion and control groups on the first 10 trials of each day over 15 postsurgery testing sessions. For clarity, the data are presented in three-session blocks. As is evident in the left plot, there was no difference between the groups in the number of correct choices made in the first 10 trials in each block of sessions (F(1,8) = 0.241; p = 0.64). There was also no change in performance across blocks (F(4,32) = 0.454; p = 0.77) or difference between groups as a function of session block (F(4,32) = 1.1; p = 0.37).
Figure 7.

Performance on the double Y-maze task. A, The mean ± SEM number of correct choices made by the hippocampal lesion and control group in the first 10 trials of each session (reward locations constant) in the 15 postsurgery sessions (for clarity, the data are presented in 3-session blocks). The dashed line indicates the chance performance level. B, The mean ± SEM number of correct choices made in the second 10 trials of the same sessions after the reversal in reward location in the same session blocks. C, The mean ± SEM number of correct choices made in the first 20 trials of each session (reward locations constant) by the hippocampal lesion and control group in the three 40-trial testing sessions. D, The mean ± SEM number of correct choices made in the second 20 trials of the same sessions after the reversal in reward location. E, Average performance of the hippocampal lesion and control groups on each trial. Each data point is the mean ± SEM percentage of correct choices for a given trial across the 15 postsurgery testing sessions.
After the first 10 trials each day, the reward locations were reversed. In the second 10 trials of each testing session (Fig. 7b), the hippocampal lesion group were significantly impaired relative to the control group (F(1,8) = 9.08; p < 0.017). Again, there was no difference in overall performance across blocks of sessions (F(4,32) = 1.18; p = 0.34) or difference between groups as a function of session block (F(4,32) = 0.067; p = 0.98). A regression analysis revealed that the degree of impairment after reversal was not predicted by the overall size of the lesion (r = 0.12; F(1,5) = 0.06; p = 0.82) or by the amount of damage to the dorsal hippocampus (r = 0.52; F(1,5) = 1.48; p = 0.29). However, the power of this analysis may be constrained by the limited variability in the lesioned animals' performance (range of 5.53–6.47 correct).
To examine the possibility that rats with hippocampal damage may have difficulty inhibiting a previously correct response, both groups were given three sessions of two blocks of trials in which the number of trials in each block was increased to 20. Reward locations were constant within a block. As in the previous condition, there were no differences between the groups in the number of correct choices in the first set of (now 20) trials (F(1,8) = 0.203; p = 0.65). There was also no overall difference in performance across the three sessions (F(2,16) = 1.129; p = 0.35) or difference between groups as a function of session (F(2,16) = 0.02; p = 0.98). After reversal of the reward locations, the hippocampal lesion group appeared to exhibit lower average scores than the control group in each session (Fig. 7c), although this difference was not statistically significant (F(1,8) = 1.99; p = 0.2). No overall difference across sessions was found (F(2,16) = 0.99; p = 0.39), and the performance of the two groups did not differ in different sessions (F(2,16) = 0.36; p = 0.96).
As is evident in Figure 7b (and to a lesser extent in d), the hippocampal lesion group performed worse than the control group when the reward locations were reversed. To see whether this impairment was attributable to perseverative responding by the lesioned animals when the reward locations were reversed, we examined the performance of both groups on each of the 20 trials for the 15 testing sessions shown in Figure 7, a and b. In Figure 7e, the performance of the control and hippocampal lesioned groups across each of the 20 trials is plotted. In the first 10 trials of each daily session, performance for both groups began at near chance (50%) and improved. Statistically, this was revealed by a significant effect of trials (F(9,72) = 14.1; p < 0.001) but no overall difference between groups (F(1,8) = 0.34; p = 0.58) or interaction between groups as a function of trials (F(9,72) = 1.18; p = 0.32). When the reward locations were reversed, the performance of both groups dropped below 50% on the next (the 11th) trial. After this reversal, performance improved for both groups, although the hippocampal lesion group was consistently worse than the control group. Statistically, this was supported by a main effect of trials (F(9,72) = 27.4; p < 0.001), a significant difference between groups (F(1,8) = 10.3; p < 0.012), but no interaction between groups as a function for trials (F(9,72) = 0.67; p = 0.74).
Figure 8 shows the performance of the hippocampus lesion and control groups in learning the spatial alternation task. Both groups were tested for 21 sessions, and, for clarity of presentation, the data has been grouped into seven three-session blocks. As is evident from the graph, the control animals learned this task more readily than the animals with hippocampal damage. Both groups improved with training, and, by the final training block, the animals with hippocampus damage were at nearly the same performance levels as the control animals. Statistically, the overall improvement across training blocks was significant (F(6,48) = 21.92; p < 0.001). The performance of the hippocampal damage group was significantly worse than the control group (F(1,8) = 29.34; p < 0.001), and there was a significant interaction between groups and testing session (F(6,48) = 4.65; p < 0.001). Post hoc, independent samples t tests revealed that the source of the this interaction was a nonsignificant difference between groups in the first and seventh testing block (p values ≥0.26) and significant differences between groups in all other testing blocks (blocks 2–6, all p values <0.05).
Figure 8.

Performance on the alternation task. The mean ± SEM number of correct choices (of 10) in the 21 training sessions for both the hippocampal lesion and control groups are plotted. For clarity, the data are presented in blocks of three sessions. The dashed line is the number of correct responses expected by chance.
Discussion
In a double Y-maze task in which reward is found repeatedly at the end of some arms but not others, a subset of hippocampal place cells exhibited differential firing at the start of the maze and before the final choice point that predicted the rat's ultimate destination. Partial removal of the hippocampus did not impair learning of the initial reward locations but did impair performance when reward locations changed.
The encoding of intended destination
Forty-six percent of the place fields at the beginning of the maze, in the start box and the first alleyway, exhibited significant differences in firing rates as a function of the rat's intended destination. This trajectory-specific encoding was also observed in 44% of the place fields beyond the first choice point but before the final choice. This result reinforces previous demonstrations of conditional or contextual place field activity (Frank et al., 2000; Wood et al., 2000; Ferbinteanu and Shapiro, 2003; Holscher et al., 2004; Bower et al., 2005; Bahar and Shapiro, 2006; Smith and Mizumori, 2006) but provides an important extension of these by showing that such encoding is not simply dichotomous but instead reflects the encoding of a specific trajectory among several alternatives. Such encoding may reflect a trajectory-specific intention, present from the beginning of the trial.
Goal-sensitive place fields may reflect rate remapping between trajectories (Leutgeb et al., 2005). As suggested by Redish (1999), multiple maps or reference frames may allow both current location and intended destination to be represented in situations in which reward locations change. A test of the multiple-map view would be to see whether place fields initially fire in a single reference frame when a rat is first exposed to a maze but later develop differential firing and multiple reference frames when the rat learns that reward is in different locations in different trial blocks.
Distribution of place fields on the maze
A disproportionate number of place fields were observed at the start of the maze. It is possible that this overrepresentation was attributable to the greater amount of time the rats spend in the start box (where they were placed between trials) relative to the rest of the maze, but rats also spent longer periods of time in the goal boxes at the maze end, and these locations were not overrepresented. Alternatively, the overrepresentation may reflect a greater significance of this maze area for the rats, similar to the overrepresentation of the area near the goal platform in an annular water maze (Hollup et al., 2001). Another possibility is that, if each of the goal box trajectories is represented independently, the locations common to all four paths will of necessity have greater numbers of place fields. Conceptually, this would be akin to the independent (but spatially overlaid) representations that are seen when rats move in opposite directions on a maze (McNaughton et al., 1983; Gothard et al., 1996).
A final possibility is that the overrepresentation of the start area of the Y-maze participates in, or is the product of, changes in the representation of the task as it becomes habit based. Jog et al. (1999) observed that, on a conditional T-maze task, 88% of task-related neurons recorded in the sensorimotor striatum responded at the start of the maze. Barnes et al. (2005) confirmed and extended this finding by showing that increases in activity at the beginning of the T-maze develop with overtraining. The striking similarities between these findings and the overrepresentation of the start area we observed may suggest that some aspects of a habit-based task are represented in the hippocampus, even when the task becomes dependent on the caudate (Packard and McGaugh, 1996).
Determinants of behavior at a choice point
The current results complement the intriguing results of Johnson and Redish (2006), who recorded from CA3 neuronal ensembles on a T-maze apparatus with return arms. They observed that, at the critical choice point on the maze, the ensemble appeared to “look ahead” down the potential arm choices before the rat made its choice. These results imply a difference in the way the rats behave on their task relative to the current double Y-maze task, because, presumably, the rats paused briefly at the choice point on their T-maze but showed little evidence of doing so on the Y-maze. However, it is possible that, at the start box, a part of the overrepresentation we observed was based on the type of anticipatory activity observed by Johnson and Redish (2006).
Changes in place fields within a series of trials
Nearly 23% of the place fields recording on the Y-maze exhibited changes across trials within a session, the most common of which was the appearance of a place field in an initially quiet cell. Frank et al. (2004) also showed this on a novel arm of a radial maze, in which some place fields only became evident after 1–2 min experience. In a subsequent study, 20% of CA1 place fields were observed to develop rapidly, whereas very few entorhinal cortex cells did so (Frank et al., 2006).
A striking difference between the current results and those of Frank et al. (2004, 2006) is that, in this study, the entire Y-maze apparatus was, presumably, highly familiar to the rats. All rats were trained on the Y-maze task before surgery, and, once a place cell was encountered, the rats received repeated testing using all maze arms. The changes observed by Frank et al. occurred primarily within the first 2 d on the new maze arm; by day 3, the representation appeared stable. One possibility is that our Y-maze task has elements (e.g., the change in reward locations) that are perceived as novel in each session. However, even if this is true, it is unclear how the appearance or disappearance of a field after several maze trials contributes to essentially stable maze behavior.
Additional types of place field changes have been described by Mehta et al. (1997) and Lee et al. (2006). Our data were based on fewer repeated journeys than Mehta et al. (1997), but some beginnings of backward place field expansion (Fig. 6a, first and fourth examples) may be evident. Backward expansion presumably occurs whenever a rat runs repeatedly in the same direction through a place field, and it is possible that the synaptic potentiation underlying this effect also contributes to the emergence of place fields in previously quiescent place cells. It is unclear, however, how backward field expansion could account for goal-sensitive activity we observed, because the goal encoding seemed to be in the form of large differences of firing rate in the same location (i.e., rate remapping) and not a shift in field locations between trajectories. The forward shifts in place fields observed by Lee et al. (2006) were not evident in our results, although this may be attributable to (1) the smaller number of repeated trials we ran, (2) the separation of trials by a brief delay, and (3) the reward of the same location within blocks of trials as opposed the reward of alternate locations.
Reversal and alternation on the Y-maze
The impairment in reversal performance after the partial lesions of the hippocampus is consistent with contemporary views of the hippocampus as a component of a memory system necessary for the flexible use of relations between stimuli to guide behavior (Eichenbaum and Cohen, 2001). This deficit also agrees with earlier data on reversal learning (Kimble and Kimble, 1965) (but see Murray and Ridley, 1999) and earlier views of hippocampus function provided by Kimble (1968), Hirsch (1974), and Gray (1982). Kimble (1968) argued that impairments in reversal learning, among other tasks, indicate that the hippocampus is essential for the ability to inhibit responses that the animal has a predisposition to make. Hirsch's view was that the hippocampus is necessary for the use of contextual information to guide behavior, and, in the absence of a hippocampus, animals rely on stimulus-response, habit-based strategies. Thus, animals with hippocampus damage can learn initial discriminations but are impaired in reversals, because they require segregation of the previously rewarded responses and the new responses. The related perspective of Gray (1982) is that the septohippocampal system is essential to act on mismatches between the animal's expectations and its actual experience. In the current study, such a mismatch may occur on the first trial of the reversal when the rat discovers that a previously reinforced goal box no longer contains food. In Gray's view, the septohippocampal system would then inhibit an ongoing motor program, such as the rats' ballistic return to the same goal box, and initiate exploration of other potential reward sites.
The deficits in Y-maze alternation in the current experiment were consistent with a number of studies using delayed alternation tasks, in which 50–90% damage to the hippocampus produced significant impairments in performance (Racine and Kimble, 1965; Hock and Bunsey, 1998). They are also consistent with a study using delayed non-matching-to-sample task on a Y-maze (Higgs et al., 2001) in which the hippocampus-lesioned animals were significantly impaired in choosing the non-matching box relative to the control animals but still performed at a 75% correct level. This agrees with the current findings that lesioned animals were impaired in acquiring the alternation task but ultimately learned the alternation rule.
Implications
The finding that place cells encode intended destination may complement recent findings implicating the human hippocampus in the ability to imagine future events. People with hippocampus damage exhibit impoverished descriptions of imagined future situations (Hassabis et al., 2007). Furthermore, when recalling past event or imagining future events, functional magnetic resonance imaging scans show that the right hippocampus exhibits a significant activation, and the left hippocampus is significantly more active during future event elaboration (Addis et al., 2007). Addis et al. suggest that the function of episodic memory is not simply to retrieve past events but also to envision future ones. The encoding of both current location and intended destination by hippocampal place neurons shown here may reflect the single-unit instantiation of this capacity.
Footnotes
This work was supported by United Kingdom Biotechnology and Biological Sciences Research Council Grant BB/C516079/1. We thank Catriona Bruce for her expert assistance with surgery and behavioral testing. We also thank Dr. Emma Wood for her helpful comments on this manuscript and Steven Huang for his assistance with cluster analysis.
References
- Addis DR, Wong AT, Schacter DL. Remembering the past and imagining the future: common and distinct neural substrates during event construction and elaboration. Neuropsychologia. 2007;45:1363–1377. doi: 10.1016/j.neuropsychologia.2006.10.016. [DOI] [PMC free article] [PubMed] [Google Scholar]
- Ainge JA, Heron-Maxwell C, Theofilas P, Wright P, de Hoz L, Wood ER. The role of the hippocampus in object recognition in rats: examination of the influence of task parameters and lesion size. Behav Brain Res. 2006;167:183–195. doi: 10.1016/j.bbr.2005.09.005. [DOI] [PubMed] [Google Scholar]
- Ainge JA, van der Meer M, Langston RF, Wood ER. Exploring the role of context dependent hippocampal activity in spatial alternation behaviour. Hippocampus. 2007 doi: 10.1002/hipo.20301. in press. [DOI] [PubMed] [Google Scholar]
- Bahar AS, Shapiro ML. Reorganised prospective and retrospective hippocampal memory coding after switching the start and goal of a journey. Soc Neurosci Abstr. 2006;32:68–21. [Google Scholar]
- Barnes TD, Kubota Y, Hu D, Jin DZ, Graybiel AM. Activity of striatal neurons reflects dynamic encoding and recoding of procedural memories. Nature. 2005;437:1158–1161. doi: 10.1038/nature04053. [DOI] [PubMed] [Google Scholar]
- Bower MR, Euston DR, McNaughton BL. Sequential-context-dependent hippocampal activity is not necessary to learn sequences with repeated elements. J Neurosci. 2005;25:1313–1323. doi: 10.1523/JNEUROSCI.2901-04.2005. [DOI] [PMC free article] [PubMed] [Google Scholar]
- Breese CR, Hampson RE, Deadwyler SA. Hippocampal place cells: stereotypy and plasticity. J Neurosci. 1989;9:1097–1111. doi: 10.1523/JNEUROSCI.09-04-01097.1989. [DOI] [PMC free article] [PubMed] [Google Scholar]
- Burgess N, O'Keefe J. Neuronal computations underlying the firing of place cells and their role in navigation. Hippocampus. 1996;6:749–762. doi: 10.1002/(SICI)1098-1063(1996)6:6<749::AID-HIPO16>3.0.CO;2-0. [DOI] [PubMed] [Google Scholar]
- Eichenbaum H, Cohen NJ. New York: Oxford UP; 2001. From conditioning to conscious recollection. [Google Scholar]
- Ferbinteanu J, Shapiro ML. Prospective and retrospective memory coding in the hippocampus. Neuron. 2003;40:1227–1239. doi: 10.1016/s0896-6273(03)00752-9. [DOI] [PubMed] [Google Scholar]
- Frank LM, Brown EN, Wilson ML. Trajectory encoding in the hippocampus and entorhinal cortex. Neuron. 2000;27:169–178. doi: 10.1016/s0896-6273(00)00018-0. [DOI] [PubMed] [Google Scholar]
- Frank LM, Stanley GB, Brown EN. Hippocampal plasticity across multiple days of exposure to novel environments. J Neurosci. 2004;24:7681–7689. doi: 10.1523/JNEUROSCI.1958-04.2004. [DOI] [PMC free article] [PubMed] [Google Scholar]
- Frank LM, Brown EN, Stanley GB. Hippocampal and cortical place cell plasticity: implications for episodic memory. Hippocampus. 2006;16:775–784. doi: 10.1002/hipo.20200. [DOI] [PubMed] [Google Scholar]
- Fyhn M, Molden S, Hollup S, Moser MB, Moser E. Hippocampal neurons responding to first-time dislocation of a target object. Neuron. 2002;35:555–566. doi: 10.1016/s0896-6273(02)00784-5. [DOI] [PubMed] [Google Scholar]
- Gothard KM, Skaggs WE, McNaughton BL. Dynamics of mismatch correction in the hippocampal ensemble code for space: interaction between path integration and environmental cues. J Neurosci. 1996;16:8027–8040. doi: 10.1523/JNEUROSCI.16-24-08027.1996. [DOI] [PMC free article] [PubMed] [Google Scholar]
- Gray JA. Precis of the neuropsychology of anxiety: an inquiry into the functions of the septo-hippocampal system. Behav Brain Sci. 1982;5:469–484. [Google Scholar]
- Griffin AL, Eichenbaum H, Hasselmo ME. Spatial representations of hippocampal CA1 neurons are modulated by behavioral context in hippocampus-dependent memory task. J Neurosci. 2007;27:2416–2423. doi: 10.1523/JNEUROSCI.4083-06.2007. [DOI] [PMC free article] [PubMed] [Google Scholar]
- Hassabis D, Kumaran D, Vann SD, Maguire EA. Patients with hippocampal amnesia cannot imagine new experiences. Proc Natl Acad Sci USA. 2007;104:1726–1731. doi: 10.1073/pnas.0610561104. [DOI] [PMC free article] [PubMed] [Google Scholar]
- Higgs S, Bannerman DM, Rawlins JN. The effect of cytotoxic lesions of the hippocampus on recognition memory in the rat: effects of stimulus size. Behav Neurosci. 2001;115:1193–1203. doi: 10.1037//0735-7044.115.6.1193. [DOI] [PubMed] [Google Scholar]
- Hirsch R. The hippocampus and contextual retrieval of information from memory: a theory. Behav Biol. 1974;12:421–444. doi: 10.1016/s0091-6773(74)92231-7. [DOI] [PubMed] [Google Scholar]
- Hock BJ, Jr, Bunsey MD. Differential effects of dorsal and ventral hippocampal lesions. J Neurosci. 1998;18:7027–7032. doi: 10.1523/JNEUROSCI.18-17-07027.1998. [DOI] [PMC free article] [PubMed] [Google Scholar]
- Hok V, Lenck-Santini PP, Roux S, Save E, Muller RU, Poucet B. Goal-related activity in hippocampal place cells. J Neurosci. 2007;27:472–482. doi: 10.1523/JNEUROSCI.2864-06.2007. [DOI] [PMC free article] [PubMed] [Google Scholar]
- Hollup SA, Molden S, Donnet JG, Moser MB, Moser EI. Accumulation of hippocampal place fields at the goal location in an annular water maze task. J Neurosci. 2001;21:1635–1644. doi: 10.1523/JNEUROSCI.21-05-01635.2001. [DOI] [PMC free article] [PubMed] [Google Scholar]
- Holscher C, Jacob W, Mallot HA. Learned association of allocentric and egocentric information in the hippocampus. Exp Brain Res. 2004;158:233–240. doi: 10.1007/s00221-004-1896-z. [DOI] [PubMed] [Google Scholar]
- Huxter J, Burgess N, O'Keefe J. Independent rate and temporal coding in hippocampal pyramidal cells. Nature. 2003;425:828–832. doi: 10.1038/nature02058. [DOI] [PMC free article] [PubMed] [Google Scholar]
- Jarrard LE. On the use of ibotenic acid to lesion selectively different components of the hippocampal formation. J Neurosci Methods. 1989;29:251–259. doi: 10.1016/0165-0270(89)90149-0. [DOI] [PubMed] [Google Scholar]
- Jog MS, Kubota Y, Connolly CI, Hillegaart V, Graybiel AM. Building neural representations of habits. Science. 1999;286:1745–1749. doi: 10.1126/science.286.5445.1745. [DOI] [PubMed] [Google Scholar]
- Johnson A, Redish AD. Neural ensembles in CA3 transiently encode paths forward of the animal at a decision point: a possible mechanism for the consideration of alternatives. Soc Neurosci Abstr. 2006;32:574–2. doi: 10.1523/JNEUROSCI.3761-07.2007. [DOI] [PMC free article] [PubMed] [Google Scholar]
- Kimble DP. Hippocampus and internal inhibition. Psych Bull. 1968;70:285–295. doi: 10.1037/h0026470. [DOI] [PubMed] [Google Scholar]
- Kimble DP, Kimble RJ. Hippocampectomy and response perseveration in the rat. J Comp Physiol Psychol. 1965;60:474–476. doi: 10.1037/h0022550. [DOI] [PubMed] [Google Scholar]
- Kubie JL. A driveable bundle of microwires for collecting single-unit data from freely-moving rats. Physiol Behav. 1984;32:115–118. doi: 10.1016/0031-9384(84)90080-5. [DOI] [PubMed] [Google Scholar]
- Lee I, Griffin AL, Zilli EA, Eichenbaum H, Hasselmo ME. Gradual translocation of spatial correlates of neuronal firing in the hippocampus toward prospective reward locations. Neuron. 2006;51:639–650. doi: 10.1016/j.neuron.2006.06.033. [DOI] [PubMed] [Google Scholar]
- Lenck-Santini PP, Save E, Poucet B. Place-cell firing does not depend on the direction of turn in a Y-maze alternation task. Eur J Neurosci. 2001;13:1055–1058. doi: 10.1046/j.0953-816x.2001.01481.x. [DOI] [PubMed] [Google Scholar]
- Leutgeb S, Leutgeb JK, Barnes CA, Moser EI, McNaughton BL, Moser MB. Independent codes for spatial and episodic memory in hippocampal neuronal ensembles. Science. 2005;309:619–623. doi: 10.1126/science.1114037. [DOI] [PubMed] [Google Scholar]
- Markus EJ, Qin YL, Leonard B, Skaggs WE, McNaughton BL, Barnes CA. Interactions between location and task affect the spatial and directional firing of hippocampal neurons. J Neurosci. 1995;15:7079–7094. doi: 10.1523/JNEUROSCI.15-11-07079.1995. [DOI] [PMC free article] [PubMed] [Google Scholar]
- McNaughton BL, Barnes CA, O'Keefe J. The contributions of position, direction, and velocity to single unit activity in the hippocampus of freely-moving rats. Exp Brain Res. 1983;52:41–49. doi: 10.1007/BF00237147. [DOI] [PubMed] [Google Scholar]
- Mehta MR, Barnes CA, McNaughton BL. Experience-dependent, asymmetric expansion of hippocampal place fields. Proc Natl Acad Sci USA. 1997;94:8918–8921. doi: 10.1073/pnas.94.16.8918. [DOI] [PMC free article] [PubMed] [Google Scholar]
- Moita MAP, Rosis S, Zhou Y, LeDoux JE, Blair HT. Hippocampal place cells acquire location-specific responses to the conditioned stimulus during auditory fear conditioning. Neuron. 2003;37:485–497. doi: 10.1016/s0896-6273(03)00033-3. [DOI] [PubMed] [Google Scholar]
- Morris RGM. Does the hippocampus play a disproportionate role in spatial memory? Disc Neurosci. 1990;VI:39–45. [Google Scholar]
- Murray TK, Ridley RM. The effect of excitotoxic hippocampal lesions on simple and conditional discrimination learning in the rat. Behav Brain Res. 1999;99:103–113. doi: 10.1016/s0166-4328(98)00077-1. [DOI] [PubMed] [Google Scholar]
- O'Keefe J. Do hippocampal pyramidal cells signal non-spatial as well as spatial information? Hippocampus. 1999;9:352–364. doi: 10.1002/(SICI)1098-1063(1999)9:4<352::AID-HIPO3>3.0.CO;2-1. [DOI] [PubMed] [Google Scholar]
- O'Keefe J, Nadel L. New York: Oxford UP; 1978. The hippocampus as a cognitive map. [Google Scholar]
- Packard MG, McGaugh JL. Inactivation of hippocampus or caudate nucleus with lidocaine differentially affects expression of place and response learning. Neurobiol Learn Mem. 1996;65:65–72. doi: 10.1006/nlme.1996.0007. [DOI] [PubMed] [Google Scholar]
- Racine RL, Kimble DP. Hippocampal lesions and delayed alternation in the rat. Psychon Sci. 1965;3:285–286. [Google Scholar]
- Redish AD. London: MIT; 1999. Beyond the cognitive map. [Google Scholar]
- Schmitzer-Torbert N, Jackson J, Henze D, Harris K, Redish AD. Quantitative measures of cluster quality for use in extracellular recordings. Neuroscience. 2005;131:1–11. doi: 10.1016/j.neuroscience.2004.09.066. [DOI] [PubMed] [Google Scholar]
- Shapiro ML, Kennedy PJ, Febinteanu J. Representing episodes in the mammalian brain. Curr Opin Neurobiol. 2006;16:701–709. doi: 10.1016/j.conb.2006.08.017. [DOI] [PubMed] [Google Scholar]
- Smith DM, Mizumori SJY. Learning-related development of context-specific neuronal responses to places and events: the hippocampal role in context processing. J Neurosci. 2006;26:3154–3163. doi: 10.1523/JNEUROSCI.3234-05.2006. [DOI] [PMC free article] [PubMed] [Google Scholar]
- Speakman A, O'Keefe J. Hippocampal complex spike cells do not change their place fields if the goal is moved within a cue controlled environment. Eur J Neurosci. 1990;2:544–555. doi: 10.1111/j.1460-9568.1990.tb00445.x. [DOI] [PubMed] [Google Scholar]
- Tolman EC. Cognitive maps in rats and men. Psychol Rev. 1948;55:189–208. doi: 10.1037/h0061626. [DOI] [PubMed] [Google Scholar]
- Wood ER, Dudchenko PA, Eichenbaum H. The global record of memory in hippocampal neuronal activity. Nature. 1999;397:613–616. doi: 10.1038/17605. [DOI] [PubMed] [Google Scholar]
- Wood ER, Dudchenko PA, Robitsek RJ, Eichenbaum H. Hippocampal neurons encode information about different types of memory episodes occurring in the same location. Neuron. 2000;27:623–633. doi: 10.1016/s0896-6273(00)00071-4. [DOI] [PubMed] [Google Scholar]