

Abstract
The effects of attention on neuronal responses in visual cortex have been likened to a change in stimulus contrast. Attention and stimulus contrast both modulate the magnitude of neuronal responses. However, changes in stimulus contrast also affect the latency of visual responses. Although many neurophysiological studies have examined how attention affects the strength of neuronal responses, few have considered whether attention affects neuronal latencies. To compare directly the effects of stimulus contrast and attention, we recorded responses from individual neurons in area V4 of macaque monkeys while they performed a task that independently controlled spatial attention and stimulus contrast. As expected, changes in stimulus contrast affected both the magnitude and latency of neuronal responses. Although attention had the expected effects on the magnitudes of neuronal responses, we did not detect statistically reliable changes in neuronal latency. A direct comparison of the effects of contrast and attention revealed a reliable difference. When a shift in spatial attention decreased response magnitude, response latency increased much less than when the same magnitude change was caused by reducing stimulus contrast. Thus, attention is distinct from contrast in the way it affects the relationship between neuronal response magnitude and latency.
Keywords: attention, latency, contrast, area V4, single-unit, macaque
Introduction
Attention affects the strength of neuronal responses throughout the visual cerebral cortex (for review, see Hillyard and Anllo-Vento, 1998; Pessoa et al., 2003; Reynolds and Chelazzi, 2004). Neuronal responses are also affected by changes in stimulus contrast, and it has been noted that attending to a stimulus has an effect that is similar in some ways to increasing the contrast of that stimulus. This notion is appealing because the behavioral advantages conferred by attention, such as faster responses and superior discrimination, are similar to those associated with higher-contrast stimuli (Teichner and Krebs, 1972; Mansfield, 1973; Tartaglione et al., 1975). Single-unit studies in monkeys that have examined how attention alters neural contrast response functions have observed that its effects can be adequately described as adding a fixed increment of contrast to attended stimuli (Reynolds et al. 2000; Martinez-Trujillo and Treue, 2002; Williford and Maunsell, 2006), and psychophysical experiments have shown that attention increases the apparent contrast of visual stimuli (Carrasco et al., 2004; Ling and Carrasco, 2006).
Although there exists at least a superficial similarity between the effects of stimulus contrast and those of attention, it remains to be determined how far the analogy applies. One dimension where it may break down is neuronal response latency. Neuronal responses to stimuli of higher contrast or luminance typically are stronger and have much shorter latency (Gawne et al., 1996; Gawne, 1999, 2000; VanRullen and Thorpe, 2002), with most neurons showing a systematic relationship between response magnitude and response latency (Maunsell et al., 1999). However, little is known about how spatial attention affects the dynamics of neuronal responses. In particular, few studies have considered the effect of attention on the latency of neuronal responses.
Attention, like stimulus contrast, might cause coupled changes in neuronal response magnitude and latency. However, there are reasons to suspect that attention might affect the magnitude of neuronal responses without affecting their latency. Several studies have shown that whereas contrast has profound effects on neuronal response latencies, other stimulus dimensions that affect the magnitude of neuronal responses, such as orientation, do not (Gawne et al., 1996; Gawne, 1999, 2000; Reich et al., 2001; Albrecht et al., 2002; VanRullen and Thorpe, 2002). Better understanding of whether attention affects neuronal response latencies will clarify how similar its actions are to changes in stimulus contrast, and will also reveal the extent to which its effects on reaction time depend on speeding sensory responses.
To examine whether attention produces changes in neuronal latency like those caused by stimulus contrast, we measured the response latency and magnitude of individual neurons in area V4 of macaque monkeys while they did a task that independently varied stimulus contrast and spatial attention. We found that changes in spatial attention had significantly less effect on neuronal response latencies than changes in stimulus contrast that produced an equivalent change in response magnitude.
Materials and Methods
Animal preparation and behavioral task.
The animal protocols used in this study were approved by the Baylor College of Medicine Institutional Animal Care and Use Committee. The methods of data collection are described in detail previously (Williford and Maunsell, 2006).
Recordings were made from two rhesus monkeys (Macaca mulatta). A scleral search coil and a head post were implanted under general anesthesia. After recovery, each animal was trained to do an orientation-change detection task (Fig. 1). The animal was required to hold its gaze within 1° of a small central square (0.1∼0.2° across) while a series of achromatic Gabor stimuli were flashed on either side. Odd-symmetric Gabors were used so that they had the same space-averaged luminance as the gray background on which they appeared. The animal was cued to attend to one stimulus location and to respond when a Gabor with a different orientation appeared there, ignoring orientation changes at the uncued location. The animal responded to an orientation change by making a saccade to the target's location within 500 ms of its appearance. Correct responses were rewarded with a drop of juice or water. Orientation changes occurred at least as frequently on the uncued side (distractors). If the animal responded to these the trial ended without reward. The animal was cued to attend to one location by instruction trials. In these trials, a series of Gabor stimuli appeared on one side of fixation only. Two instruction trials were inserted each time the cued location changed. Instruction trials were not used in data analyses.
Figure 1.

Task and stimulus timing. One series of Gabor stimuli was centered in the receptive field of a V4 neuron, and a second was located at the same eccentricity directly across the fixation point. The location to be attended was signaled to the monkey by instruction trials. A series of Gabor stimuli was presented in synchrony at both sites (94 ms duration, 141–294 ms interstimulus period) and the monkey's task was to detect an orientation change in the series at cued location while ignoring orientation changes at uncued location. The contrast of each Gabor was selected in a random manner and different orientations were presented on different trials.
The Gabors in both locations appeared synchronously for 94 ms and were separated from other stimuli by periods with randomly selected durations of 141–294 ms. The SD and spatial frequency of the Gabors were fixed for each cell tested (medians 0.3° and 2.0 cycles per degree), but they differed in their contrasts. The contrast of each Gabor was randomly selected from a predetermined set of contrasts (see below), constrained so that all possible pairings of contrasts at the two stimulus locations occurred equally often.
The timing of the target appearance in each trial was selected from an exponential distribution (the flat hazard function for orientation change) to encourage the animals to maintain constant vigilance throughout each trial. However, trials were truncated at 5 s if the target had not appeared (∼10% of trials), in which case the animal was rewarded for maintaining fixation up to that time.
Data collection and analysis.
After training was complete, a recording chamber was implanted over V4 (Horsley–Clarke coordinates, ∼5 mm posterior, ∼12 mm dorsal). Recordings were made using transdural, glass-insulated platinum–iridium microelectrodes (∼1 MΩ at 1 kHz). Extracellular signals were amplified and filtered, and action potentials from individual neurons were isolated with a window discriminator. Spike times were recorded with 1 ms resolution.
Once spikes from a single unit were isolated, a hand-controlled visual stimulus was used to map the receptive field and find the optimal orientation, size, and spatial frequency for a Gabor. Data were collected from every neuron that had a clear visual response to an optimized achromatic Gabor. The stimuli were then configured so that one series of Gabors was centered on the receptive field and the other was on the opposite side of the fixation point. We collected neuronal responses for 5–11 contrasts presented in two or four orientations (on different trials), but the data analysis presented here is restricted to the preferred orientation and the five contrasts that were used for every neuron (0, 1.6, 6.2, 25, and 100%). The 0% contrast condition (i.e., no stimulus) was included in the series so that the effects of attention on spontaneous activity could be assessed under conditions that were directly comparable with the stimulus presentations.
Target stimuli and stimuli paired with a distractor were excluded from analysis, as were stimuli that appeared after the target. Analysis was restricted to those neurons from which we collected responses to at least 12 repetitions of each contrast for the preferred orientation in both attentional states. The rate of firing for each stimulus condition was taken as the average rate from 50 to 200 ms after stimulus onset. We used time to half peak as a measure of neuronal latency. This was found by constructing a peristimulus time histogram (PSTH) for each stimulus condition and smoothing it with a Gaussian filter (8 ms SD). The peak rate was taken as the first maximum that exceeded baseline rate of firing by 3.72 times its SEM (p < 10−5), where the baseline firing was taken from the 0% contrast condition in the same attentional state. Latency was taken as the first time that the filtered PSTH exceeded half the peak rate plus baseline activity. If there was no peak significantly greater than the baseline activity, the peak rate between 0 and 250 ms after stimulus onset was found and the last time before the time of this peak that the rate exceeded half the peak rate plus baseline was taken as the latency. The reliability of each latency measurement was assessed using a bootstrap analysis (1000 resamplings). Latencies with 95% confidence intervals larger than 50 ms were excluded from the population regression analysis.
Results
Complete data sets were recorded from 131 neurons in V4 of two monkeys. Because we were interested in changes in response related to attention, the following analyses were restricted to those cells in which attention increased responses by at least 10% (averaged over all five contrasts). This restriction yielded 78 cells (60%).
Individual neurons
Responses of two representative V4 cells are presented on Figure 2. Figure 2A shows the responses of one V4 neuron to four contrasts presented while the animal had been cued to attend to the receptive field location (dark gray) or to attend to the opposite visual hemifield (light gray). Responses were on average 16% stronger when the receptive field contained the attended stimulus. Horizontal lines mark the average rates of firing for each condition (solid for the attended condition, dashed for the unattended condition). The response latencies are marked by corresponding vertical lines. As expected, when the stimulus contrast was lower, responses were weaker and latencies were longer. Within each contrast condition, attention modulated the magnitude of the response, but had little effect on response latency.
Figure 2.
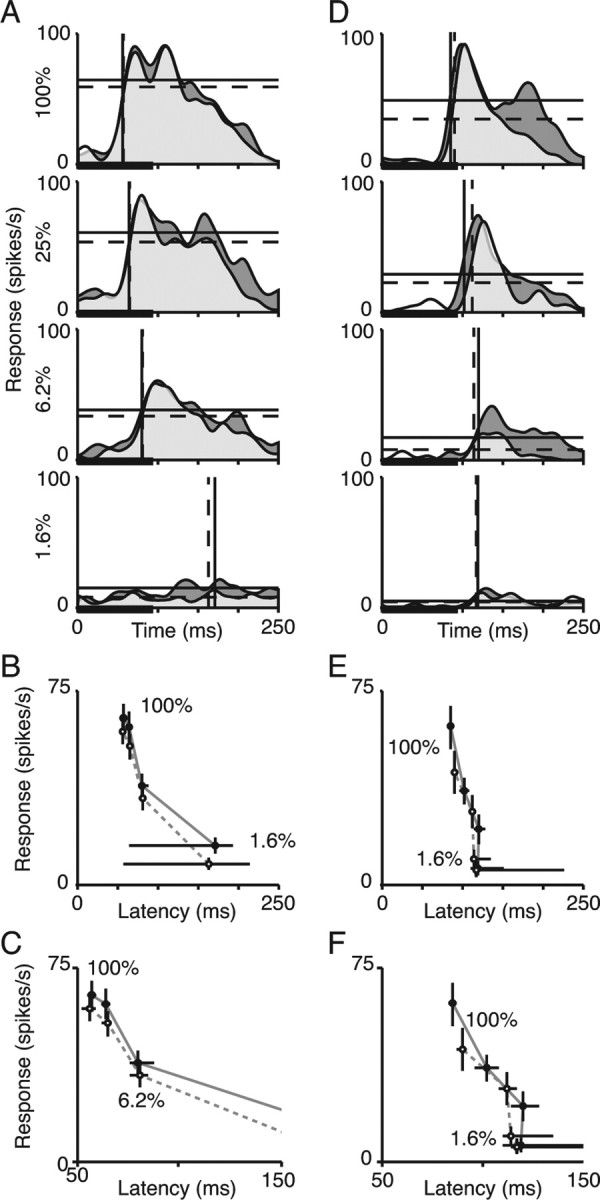
Responses of two example V4 neurons. A, D, PSTHs for the responses of two cells to different stimulus contrasts and different attention states. The thick black line at the bottom of each histogram marks the stimulus duration. Each histogram was Gaussian filtered (8 ms SD). The dark gray area shows the response in the attended condition and the light gray area shows the response in the unattended condition. Horizontal solid lines show the mean response magnitudes (firing rate) during the sampling period in the attended condition, and dashed lines show mean response magnitudes in the unattended condition. Vertical lines show the corresponding response latencies in each condition. B, E, Plots of the relationship between response magnitude and latency for the same cells, parameterized by stimulus contrast and attention. Filled circles show response magnitude and latency at different contrasts in attended condition, and open circles show response magnitude and latency for the same stimuli in the unattended condition. Error bars are 95% confidence intervals from bootstrap. C, F, Some of the same data from B and E, plotted on an expanded time scale.
Figure 2B plots response magnitude against response latency for this neuron, parameterized in contrast and attention, using the same time scale as the histograms in Figure 2A. Figure 2C shows some of the same data plotted with an expanded time scale. In Figure 2, B and C, error bars are 95% confidence intervals estimated from bootstrap analysis (see Materials and Methods), which are sometimes smaller than the data markers. If attention affected responses in the same way as contrast, the points would all fall on a single function. Instead, for this neuron, the change in attentional state seems to affect response latency less than expected for a change in stimulus contrast that would produce the same change in response magnitude. For example, lowering the contrast of an attended stimulus from 100 to 25% decreased the rate of firing (65 spike/s to 61 spikes/s) and increased response latency (57 to 64 ms). Directing attention away from the 100% stimulus had a similar effect on response magnitude (65 spikes/s to 59 spikes/s), but no detectable effect on latency (57 to 56 ms).
For other cells, changing the location of attention had a clearer effect on response latency. The plots in Figure 2D show responses from one such cell. For at least the higher contrasts, changes in response magnitude associated with attention were accompanied by changes in response latency. The points in Figure 2, E and F, could be approximated by a single function, as if attention did not change the relationship between response magnitude and latency.
Although the responses in Figure 2 provide hints of different effects of attention on latency, the data from individual cells were not reliable enough to individually provide robust statistical results given the moderate size of the attentional effects on response magnitude and latency. To address the reliability of attention-related changes we observed, we turn instead to analyses of the combined responses from the whole set of neurons.
Populations responses
Average responses from the population of V4 neurons are presented in Figure 3(n = 78). Lines again mark the latencies and average rates of firing in the two attentional states. Figure 3A shows the average rate of firing and Figure 3B shows the same responses normalized to each neuron's maximal response. Although the PSTH for the attended conditions appears slightly shifted in time relative to the unattended condition, this shift can be attributed to the difference in spontaneous activity (visible during the period from 0 to 50 ms) (Fig. 3B, top left, arrow). Attention changes not only responses to visual stimuli, but also the spontaneous rate of firing (Luck et al., 1997; Reynolds et al., 2000; Williford and Maunsell, 2006). Because latency is measured as the time to traverse half the difference from spontaneous to peak activity, a vertical offset does not lead to large differences in latency. Other common measures of latency, such as time to the first significant change in activity (Maunsell and Gibson, 1992) or time to peak (Weng et al., 2005) would similarly show no change in latency from this effect of attention. A measure of latency that used time to a fixed rate of firing would show a change in latency, but even that change would be modest. Overall, these pooled responses suggest that attention had little effect on response latency relative to its effect on response magnitude.
Figure 3.

Population contrast responses of V4 neurons (n = 78). The same format as in Figure 2, A and D, is shown. Histograms were smoothed with a Gaussian filter (4 ms SD). A, Population average responses of V4 neurons. The black arrow in the top panel points to elevated spontaneous activity caused by attention. Latency values for the attended and unattended conditions were as follows: 100% contrast, 62 and 63 ms; 25% contrast, 73 and 74 ms; 6.2% contrast 96 and 85 ms; 1.6% contrast, 209 and 144 ms. B, Normalized average responses of V4 neurons. The response of each neuron was normalized to its maximum response magnitude over all trials. Horizontal lines show normalized response magnitudes of the population. Latency values for the attended and unattended conditions were as follows: 100% contrast, 65 and 64 ms; 25% contrast, 76 and 77 ms; 6.2% contrast 96 and 86 ms; 1.6% contrast, 192 and 139 ms.
We tested whether contrast and attention had significant effects on response magnitude and latency using two-way ANOVAs (within subject design). For this analysis, we used responses to the four nonzero contrasts (100, 25, 6.2, and 1.6%) from all 78 cells, with each neuron contributing response values for each contrast. As expected based on previous studies (Gawne et al., 1996; Gawne, 1999, 2000; Reich et al., 2001; Albrecht et al., 2002; VanRullen and Thorpe, 2002), there were highly significant main effects of contrast on response magnitude (p < 0.0001) and latency (p < 0.0001). The main effect of attention on response magnitude was also significant (p < 0.0001), but its effect on latency was not (p > 0.13). The interaction between contrast and attention was not significant for response latency (p > 0.6), but was significant for response magnitude (p < 0.0001). A significant interaction in response magnitude was expected because attention has a multiplicative, not additive, effect on responses to different contrasts. Thus, although attention had the expected effect on response magnitude, it had no detectable effect on latency under these conditions.
One reason attention might not have an effect on latency would be that responses always had a fixed transient response that was unaffected by attention. We specifically sought to reduce this possibility by using odd-symmetric Gabor stimuli, which have the same average luminance as their background. We selected stimuli that caused no change in luminance and that had no high spatial frequencies in an attempt to reduce transient responses, which might have a relatively fixed latency and therefore mask changes in latency. The PSTHs in Figure 3 suggest that we succeed in this goal, because they show only a minimal transient component (cf. Reynolds et al., 2000) and attention modulation is visible throughout the response. Thus, we do not believe that latency changes were being masked by fixed-latency transient responses to stimulus onset.
The absence of a significant effect of attention on latency does not address directly the question of whether attention modulates responses differently than contrast. If the effects of attention on response magnitude are much smaller than the effects of the contrasts that we used, then even if attention affected latency to an extent that was commensurate with its effect on response magnitude, that latency change might not reach statistical significance. To address whether attention was modulating responses in a way that was distinct from the effects of contrast, we did a regression analysis on average normalized responses from those cells that had reliable latencies. Responses for which the 95% confidence interval (see Materials and Methods) for the latency was >50 ms were excluded, leaving 62 neurons for the 100% contrast, 54 neurons for the 25% contrast, and 16 neurons for the 6.2% contrast (1.6% contrast responses were not included because only one cell satisfied this criterion). We normalized the response magnitude of each cell to the strongest rate of firing to any contrast, and normalized the latency of each cell to its shortest latency. Lines were fit to the data for the three high-contrast responses from each attentional state independently. We used a weighted least-square method for the fitting, and variances from both the response magnitude and the latency were considered in weighing responses.
Each point in Figure 4 is the sample average of normalized response latency and magnitude, parameterized in contrast. The error bars are SEs. Solid and dashed lines are means of the regression from the bootstrap for each attentional state, and the shaded areas represent the 95% confidence interval for the regression line in each attention condition. The confidence intervals are nonoverlapping for the responses to 100 and 25% contrast. If attention were affecting response magnitude and latency in the same way as contrast, the confidence intervals should overlap. Instead, changes in response magnitude caused by attention are accompanied by changes in latency that are much smaller than those associated with comparable changes in magnitude caused by changing contrast. The confidence intervals overlap for contrasts below 25%, but that is expected because both the response magnitude and latency become more variable at low contrasts, and attentional modulation becomes smaller, such that the fitted lines should converge near the x-axis.
Figure 4.

Average latency–magnitude relationships for V4 neurons. Cells that satisfied bootstrap criterion were included in this plot (100% contrast, n = 62; 25% contrast, n = 54; 6.2% contrast, n = 16). The latencies for each cell were normalized to their minimum value and magnitudes were normalized to their maximum value. Each data point represents the sample average of normalized response latencies and magnitudes. Filled circles are data for the attended condition and open circles are data for the unattended condition. Error bars are SEs of the means. Gray regions represent the 95% confidence interval for regression lines from the bootstrap in each condition and the lines are the means of the bootstraps. The means and 95% confidence intervals for the regressions were as follows: attended slope, −1.15 (−0.89 to −1.44), intercept, 2.11 (1.82 to 2.42); unattended slope, −1.00 (−0.79 to −1.24), intercept, 1.83 (1.60 to 2.09).
Discussion
Neurons in V4 have a different relationship between the response magnitude and latency when their responses are modulated by attention compared with when their responses are modulated by contrast. When a shift in spatial attention decreased response magnitude, response latency increased much less than when the same magnitude change was caused by reducing stimulus contrast. To our knowledge, this is the first study to examine whether the effects of spatial attention on response magnitude and latency are the same as the effects of stimulus contrast. Some of the neural effects of attention have been described as similar to changing stimulus contrast (Reynolds et al., 2000; Treue, 2001; Martinez-Trujillo and Treue, 2002; Carrasco et al., 2004; Ling and Carrasco, 2006). Although that may be a useful analogy for response magnitude, the current results suggest that attention is quite unlike contrast in that its effects on neuronal response latency are far smaller.
We did not find attention to cause significant changes in latency, although there is a trend in the pooled data (Fig. 4). Our results are consistent with several earlier single-unit studies that have reported that attention appears to have little effect on neuronal dynamics. Reynolds et al. (2000) noted that they did not observe attention to change the visual latencies of V4 neurons, but did not analyze response latencies directly. Similarly, Bisley et al. (2004) reported that attentional allocation did not affect either the latency or the magnitude of the initial portion of the responses of neurons in the lateral intraparietal area. A previous study from our laboratory examined how spatial attention affects the linear kernel for motion integration for neurons in the middle temporal visual area of monkeys and found that although attention scaled the temporal profile of these kernels, it did not shift the kernels in time (Cook and Maunsell, 2004).
Studies using evoked potentials have produced more mixed results. Some EEG measurements from humans have failed to detect changes in visual evoke potential (VEP) latency caused by attention (Mangun, 1995; Russo and Spinelli, 1999a). However, other EEG studies have reported that spatial attention can change the latencies of the VEP, especially early components such as the N60 or P100 (Russo and Spinelli, 1999a,b; Schuller and Rossion, 2005). Because the EEG sums over large populations of neurons, it may be more sensitive to small changes in latencies than signals from individual units or samples of units, and differences in experimental design may cause some EEG experiments to be more sensitive than others. It should be noted, however, that a change in the latency of a VEP component does not necessarily indicate a change in the latency of individual neurons. Each component sums activity from large groups of neurons that may have different latencies. If attention were to preferentially modulate the magnitude of either early or late-latency neurons, those magnitude changes could sum to a change in latency of VEP components even though changed its latency.
Intensity attributes like contrast and luminance may influence neuronal latencies much more than other stimulus features. Changes in stimulus intensity cause pronounced changes in the latency of neurons in the retina (Sestokas and Lehmkuhle, 1986; Sestokas et al., 1991), and these changes are likely to persist throughout cortical processing. However, sensitivities to stimulus features such as orientation and binocular disparity are elaborated in cortex, and therefore should have little effect on neuronal latencies in the subcortical pathways or in the earliest stages of cortex. Moreover, sensitivity to a feature like orientation could be introduced by filtering mechanisms that alter response magnitude with little effect on neuronal latency. Consistent with this, studies that compared the effects of stimulus contrast and orientation on neuronal response magnitude and latency have reported that response latency was mostly determined by stimulus contrast and response magnitude was largely determined by stimulus orientation (Gawne et al., 1996; Gawne, 1999, 2000). The current results, together with earlier findings describing a multiplicative scaling by attention that is similar to effects seen when stimulus features are manipulated (McAdams and Maunsell, 1999), suggest that attentional modulation of response magnitude may operate through a mechanism that is similar to those that impart selectivity for stimulus features.
Finally, we note that the latency changes associated with attention appear to be far too small to account in a direct way for the changes in reaction time that it produces. It seems more likely that the faster reaction times associated with attention arise indirectly from its effects on the magnitude of sensory responses.
Footnotes
This work was supported by National Institutes of Health Grant R01 EY05911. J.H.R.M. is an Investigator with the Howard Hughes Medical Institute. We thank Marlene Cohen, Incheol Kang, and Alexandra Smolyanskaya for helpful comments on drafts of this manuscript and Vivian Imamura and Dennis Murray for technical support.
References
- Albrecht DG, Geisler WS, Frazor RA, Crane AM. Visual cortex neurons of monkeys and cats: temporal dynamics of the contrast response function. J Neurophysiol. 2002;88:888–913. doi: 10.1152/jn.2002.88.2.888. [DOI] [PubMed] [Google Scholar]
- Bisley JW, Krishna BS, Goldberg ME. A rapid and precise on-response in posterior parietal cortex. J Neurosci. 2004;24:1833–1838. doi: 10.1523/JNEUROSCI.5007-03.2004. [DOI] [PMC free article] [PubMed] [Google Scholar]
- Carrasco M, Ling S, Read S. Attention alters appearance. Nat Neurosci. 2004;7:308–313. doi: 10.1038/nn1194. [DOI] [PMC free article] [PubMed] [Google Scholar]
- Cook EP, Maunsell JHR. Attentional modulation of motion integration of individual neurons in the middle temporal visual area. J Neurosci. 2004;24:7964–7977. doi: 10.1523/JNEUROSCI.5102-03.2004. [DOI] [PMC free article] [PubMed] [Google Scholar]
- Gawne TJ. Temporal coding as a means of information transfer in the primate visual system. Crit Rev Neurobiol. 1999;13:83–101. doi: 10.1615/critrevneurobiol.v13.i1.40. [DOI] [PubMed] [Google Scholar]
- Gawne TJ. The simultaneous coding of orientation and contrast in the responses of V1 complex cells. Exp Brain Res. 2000;133:293–302. doi: 10.1007/s002210000381. [DOI] [PubMed] [Google Scholar]
- Gawne TJ, Kjaer TW, Richmond BJ. Latency: another potential code for feature binding in striate cortex. J Neurophysiol. 1996;76:1356–1360. doi: 10.1152/jn.1996.76.2.1356. [DOI] [PubMed] [Google Scholar]
- Hillyard SA, Anllo-Vento L. Event-related brain potentials in the study of visual selective attention. Proc Natl Acad Sci USA. 1998;95:781–787. doi: 10.1073/pnas.95.3.781. [DOI] [PMC free article] [PubMed] [Google Scholar]
- Ling S, Carrasco M. Sustained and transient covert attention enhance the signal via different contrast response functions. Vision Res. 2006;46:1210–1220. doi: 10.1016/j.visres.2005.05.008. [DOI] [PMC free article] [PubMed] [Google Scholar]
- Luck SJ, Chelazzi L, Hillyard SA, Desimone R. Neural mechanisms of spatial selective attention in areas V1, V2, and V4 of macaque visual cortex. J Neurophysiol. 1997;77:24–42. doi: 10.1152/jn.1997.77.1.24. [DOI] [PubMed] [Google Scholar]
- Mangun GR. Neural mechanisms of visual selective attention. Psychophysiology. 1995;32:4–18. doi: 10.1111/j.1469-8986.1995.tb03400.x. [DOI] [PubMed] [Google Scholar]
- Mansfield RJ. Latency functions in human vision. Vision Res. 1973;13:2219–2234. doi: 10.1016/0042-6989(73)90224-1. [DOI] [PubMed] [Google Scholar]
- Martinez-Trujillo JC, Treue S. Attentional modulation strength in cortical area MT depends on stimulus contrast. Neuron. 2002;35:365–370. doi: 10.1016/s0896-6273(02)00778-x. [DOI] [PubMed] [Google Scholar]
- Maunsell JHR, Gibson JR. Visual response latencies in striate cortex of the macaque monkey. J Neurophysiol. 1992;68:1332–1344. doi: 10.1152/jn.1992.68.4.1332. [DOI] [PubMed] [Google Scholar]
- Maunsell JHR, Ghose GM, Assad JA, McAdams CJ, Boudreau CE, Noerager BD. Visual response latencies of magnocellular and parvocellular LGN neurons in macaque monkeys. Vis Neurosci. 1999;16:1–14. doi: 10.1017/s0952523899156177. [DOI] [PubMed] [Google Scholar]
- McAdams CJ, Maunsell JHR. Effects of attention on orientation-tuning functions of single neurons in macaque cortical area V4. J Neurosci. 1999;19:431–441. doi: 10.1523/JNEUROSCI.19-01-00431.1999. [DOI] [PMC free article] [PubMed] [Google Scholar]
- Pessoa L, Kastner S, Ungerleider LG. Neuroimaging studies of attention: from modulation of sensory processing to top-down control. J Neurosci. 2003;23:3990–3998. doi: 10.1523/JNEUROSCI.23-10-03990.2003. [DOI] [PMC free article] [PubMed] [Google Scholar]
- Reich DS, Mechler F, Victor JD. Temporal coding of contrast in primary visual cortex: when, what, and why. J Neurophysiol. 2001;85:1039–1050. doi: 10.1152/jn.2001.85.3.1039. [DOI] [PubMed] [Google Scholar]
- Reynolds JH, Chelazzi L. Attentional modulation of visual processing. Annu Rev Neurosci. 2004;27:611–647. doi: 10.1146/annurev.neuro.26.041002.131039. [DOI] [PubMed] [Google Scholar]
- Reynolds JH, Pasternak T, Desimone R. Attention increases sensitivity of V4 neurons. Neuron. 2000;26:703–714. doi: 10.1016/s0896-6273(00)81206-4. [DOI] [PubMed] [Google Scholar]
- Russo FD, Spinelli D. Spatial attention has different effects on the magno- and parvocellular pathways. NeuroReport. 1999a;10:2755–2762. doi: 10.1097/00001756-199909090-00011. [DOI] [PubMed] [Google Scholar]
- Russo FD, Spinelli D. Electrophysiological evidence for an early attentional mechanism in visual processing in humans. Vision Res. 1999b;39:2975–2985. doi: 10.1016/s0042-6989(99)00031-0. [DOI] [PubMed] [Google Scholar]
- Schuller AM, Rossion B. Spatial attention triggered by eye gaze enhances and speeds up visual processing in upper and lower visual fields beyond early striate visual processing. Clin Neurophysiol. 2005;116:2565–2576. doi: 10.1016/j.clinph.2005.07.021. [DOI] [PubMed] [Google Scholar]
- Sestokas AK, Lehmkuhle S. Visual response latency of X- and Y-cells in the dorsal lateral geniculate nucleus of the cat. Vision Res. 1986;26:1041–1054. doi: 10.1016/0042-6989(86)90038-6. [DOI] [PubMed] [Google Scholar]
- Sestokas AK, Lehmkuhle S, Kratz KE. Relationship between response latency and amplitude for ganglion and geniculate X- and Y-cells in the cat. Int J Neurosci. 1991;60:59–64. doi: 10.3109/00207459109082037. [DOI] [PubMed] [Google Scholar]
- Tartaglione A, Goff DP, Benton AL. Reaction time to square-wave gratings as a function of spatial frequency, complexity and contrast. Brain Res. 1975;100:111–120. doi: 10.1016/0006-8993(75)90245-0. [DOI] [PubMed] [Google Scholar]
- Teichner WH, Krebs MJ. Laws of the simple visual reaction time. Psychol Rev. 1972;79:344–358. doi: 10.1037/h0032946. [DOI] [PubMed] [Google Scholar]
- Treue S. Neural correlates of attention in primate visual cortex. Trends Neurosci. 2001;24:295–300. doi: 10.1016/s0166-2236(00)01814-2. [DOI] [PubMed] [Google Scholar]
- VanRullen R, Thorpe SJ. Surfing a spike wave down the ventral stream. Vision Res. 2002;42:2593–2615. doi: 10.1016/s0042-6989(02)00298-5. [DOI] [PubMed] [Google Scholar]
- Weng C, Yeh CI, Stoelzel CR, Alonso JM. Receptive field size and response latency are correlated within the cat visual thalamus. J Neurophysiol. 2005;93:3537–3547. doi: 10.1152/jn.00847.2004. [DOI] [PubMed] [Google Scholar]
- Williford T, Maunsell JHR. Effects of spatial attention on contrast response functions in macaque area V4. J Neurophysiol. 2006;96:40–54. doi: 10.1152/jn.01207.2005. [DOI] [PubMed] [Google Scholar]