

Abstract
As a step toward generating a fate map of identified neuron populations in the mammalian hindbrain, we assessed the contributions of individual rhombomeres to the vestibular nuclear complex, a major sensorimotor area that spans the entire rhombencephalon. Transgenic mice harboring either the lacZ or the enhanced green fluorescent protein reporter genes under the transcriptional control of rhombomere-specific Hoxa2 enhancer elements were used to visualize rhombomere-derived domains. We labeled functionally identifiable vestibular projection neuron groups retrogradely with conjugated dextran-amines at successive embryonic stages and obtained developmental fate maps through direct comparison with the rhombomere-derived domains in the same embryos. The fate maps show that each vestibular neuron group derives from a unique rostrocaudal domain that is relatively stable developmentally, suggesting that anteroposterior migration is not a major contributor to the rostrocaudal patterning of the vestibular system. Most of the groups are multisegmental in origin, and each rhombomere is fated to give rise to two or more vestibular projection neuron types, in a complex pattern that is not segmentally iterated. Comparison with studies in the chicken embryo shows that the rostrocaudal patterning of identified vestibular projection neuron groups is generally well conserved between avians and mammalians but that significant species-specific differences exist in the rostrocaudal limits of particular groups. This mammalian hindbrain fate map can be used as the basis for targeting genetic manipulation to specific subpopulations of vestibular projection neurons.
Keywords: lineage, brainstem, patterning, Cre-transgenic, neuromere, rhombencephalon, patterning
Introduction
Understanding the molecular and cellular interactions that underlie brain development requires a thorough knowledge of the origins and ultimate destinations of the various neuron types within any brain region. One of the mainstay approaches to assessing neuronal origin is fate mapping (Stern and Fraser, 2001). In vertebrates, fate mapping was initially accomplished by applying indelible histological markers to specific regions of the neural plate and neural tube (Vogt, 1925). Xenotypic transplantation led to a breakthrough in the ability to follow the progeny of specific, coherent progenitor populations in higher vertebrates and an explosion of information about the fate of neural anlage, especially in avian embryos (Le Douarin et al., 1975; Couly and Le Douarin, 1985; Balaban et al., 1988). Modern techniques for marking single cells or small regions of the neural primordium use intracellular injection or electroporation of dyes or DNA constructs (Olofsson et al., 2003; Bonnot et al., 2005). All of the above techniques, however, require relatively unhindered access to the developing neural primordium and therefore have been limited primarily to avian and anamniote vertebrate embryos. Their application to mammalian embryos poses considerable technical challenges (Inoue et al., 2000; Anderson et al., 2001; Wichterle et al., 2001; Nery et al., 2002).
Recent genetic approaches have facilitated the study of neuronal origins in mammals. Single progenitors or clusters of progenitors can be labeled by genetically engineered retroviruses or germline-transmitted genetic insertions. This has provided information on the number of progenitors giving rise to a given brain region and the types of neurons derived from single progenitors (Cepko, 1988; Sanes, 1989, 1994; Miyake et al., 1993; Baader et al., 1996; Goldman et al., 1997; Mathis et al., 1997; Mathis and Nicolas, 2000, 2003, 2006). As general fate-mapping tools, however, these particular techniques suffer from limitations in targeting (random progenitors are labeled) as well as in scope (few or scattered progenitors are labeled). An alternative approach that overcomes these limitations involves the knock-in of marker genes under the control of region- or cell type-specific promoters (Dymecki and Tomasiewicz, 1998; Zinyk et al., 1998; Stenman et al., 2003; Farago et al., 2006 and references therein).
Here we use rhombomere-specific enhancer elements associated with the Hoxa2 gene to follow segmental fate in the mouse embryo hindbrain. We combine this with retrograde axonal tracing to create developmental fate maps of functionally identified neuron groups in a specific complex of sensorimotor nuclei, the vestibular nuclei. The vestibular nuclear complex spans all the rhombomeres and contains well characterized neuron populations identifiable by their axon trajectories and connectivity (Glover, 2003). In the chicken embryo, xenotypic transplantation of quail rhombomeres in place of chicken rhombomeres has generated several hindbrain fate maps based on the cytoarchitectonic organization of nuclei or patterns of projection-specific neuron groups, including the vestibular complex (Marin and Puelles, 1995; Díaz et al., 1998; Cambronero and Puelles, 2000). The present study provides a first step toward a more comprehensive fate map in the mouse, as well as comparative data on the patterning of the avian and mammalian hindbrains.
Materials and Methods
Generation of the r3/5::lacZ transgenic line.
To construct this line, a floxed βGeo-SV40 poly(A) (loxPβGeoloxP) cassette was put under the control of Hoxa2 genomic sequences driving lacZ expression specifically in rhombomere 3 (r3)- and r5-derived domains. In addition, the loxPβGeoloxP transgene was followed by a cassette containing a mutated form of Hoxa2 (ENG/Hoxa2), an internal ribosomal entry site (IRES) sequence, and the EGFP cDNA (ENG/Hoxa2-IRES-EGFP). Under these conditions, the expression of the ENG/Hoxa2-IRES-EGFP cassette could be activated only after conditional Cre-mediated recombination, causing excision of the lacZ-expressing cassette (data not shown). In contrast, in the absence of Cre-mediated excision, the ENG/Hoxa2-IRES-EGFP cassette was inactive (data not shown), and the lacZ expression from the loxPβGeoloxP cassette could be used for the r3 and r5 tracing experiments.
Briefly, the primers ATATTCATGGTCGACTGAATCCCTGGAAATAGCTGAT and TCTTGAAGTGTCGACTTAGTAATTCAGATGCTGTAGG (restriction enzyme sites are underlined) were used to PCR amplify the second exon of mouse Hoxa2, using the Pfu DNA polymerase (Stratagene, La Jolla, CA). The amplified fragment was digested with SalI and subcloned in-frame to the C terminus of the Drosophila Engrailed (ENG) repressor domain into the XhoI site of the pCS2-ENG-N vector (a kind gift from Dr. D. Kessler, University of Pennsylvania, Philadelphia, PA), generating the pCS2-ENG/Hoxa2 vector. A BstxI/XhoI Kleenow-filled fragment containing the IRES, enhanced green fluorescent protein (EGFP) cDNA, and SV40 poly(A) signal from pIRES-EGFP (Clontech, Cambridge, UK) was inserted into the blunted XbaI site of pCS2-ENG/Hoxa2, generating the ENG/Hoxa2-IRES-EGFP vector. The blunted ENG/Hoxa2-IRES-EGFP fragment was then subcloned downstream of the loxPβGeoloxP plasmid (courtesy of Dr. Daniel Metzger, Centre National de la Recherche Scientifique/Inserm, Strasbourg, France). Finally, the entire loxPβGeoloxP-ENG/Hoxa2-IRES-EGFP excised fragment was cloned into the EcoRI/NotI sites of a plasmid containing the SpeI-SacI 6.5 kb genomic fragment carrying regulatory sequences from the Hoxa2 locus (Rijli et al., 1993). The resultant transgene construct was linearized and used for pronuclear injection into fertilized mouse oocytes. Five transgenic founders were identified as assessed by PCR amplification with lacZ-specific primers, three transmitted the transgene through the germ line, and one of the three transgenic lines expressed the βGeo reporter gene selectively in the r3- and r5-derived domains from 9.0 d postcoitum through birth, as assessed by X-gal (5-bromo-4-chloro-3-indolyl-β-d-galactopyranoside) staining. For this reason, the newly generated transgenic line was referred to as r3/5::lacZ.
Embryo preparations, retrograde axonal tracing, and histological staining.
In addition to the r3/5::lacZ line, the following transgenic mouse lines were used in this study: the r2::lacZ line (Ren et al., 2002), the Hoxa2EGFP and Hoxa2EGFP(lox-neo-lox) lines (Pasqualetti et al., 2002), and the r2::Cre line (Ren et al., 2002). Mice were mated as described previously (Auclair et al., 1999), and embryonic staging was as defined by Kaufman (2002). Pregnancy was allowed to continue until embryonic day 11.5 (E11.5) to E16.5, at which time the pregnant dams were quickly killed by cervical dislocation and the embryos were removed by cesarean section into ice-cold, oxygenated physiological saline (in mm: 137 NaCl, 5 KCl, 2 CaCl2, 1 MgCl2, 1 Na-phosphate, 5 HEPES, and 11 glucose, pH 7.4) and decapitated. Embryos of different genotypes were prepared for retrograde labeling of vestibular projection neurons. In the case of mice carrying the Hoxa2EGFP knock-in allele, wild-type and Hoxa2EGFP+/− heterozygote embryos were distinguished by EGFP fluorescence as seen under a fluorescence dissection microscope. In the case of mice carrying the lacZ transgenic allele, wild-type and transgenic embryos were distinguished by the presence of lacZ expression later in the procedure (see below). Both Hoxa2EGFP+/− and lacZ transgenic embryos displayed a normal phenotype, indistinguishable from wild type.
The brains were dissected free and maintained in vitro for retrograde axonal labeling with 3000 molecular weight (MW) rhodamine dextran-amine (RDA; Invitrogen, Eugene, OR) in the EGFP preparations, or 3000 MW biotin dextran-amine (BDA; Invitrogen) in the lacZ preparations, as described previously (Glover et al., 1986; Glover, 1995; Auclair et al., 1999). Vestibulospinal groups were retrogradely labeled after a unilateral application of RDA or BDA to the ventral and ventrolateral funiculi of the first cervical spinal segment. Vestibulo-ocular groups were labeled retrogradely after a unilateral application of RDA or BDA to the medial longitudinal fascicle (MLF) and the underlying brachium conjunctivum just caudal to the trochlear nucleus (Fig. 1). Based on their axon trajectories and positions, the retrogradely labeled vestibular projection neurons could be assigned to specific vestibulospinal or vestibulo-ocular groups, named using the system introduced by Díaz et al. (1998) and slightly modified by Díaz et al. (2003). For purposes of orientation, the groups are shown in sagittal sections and in a dorsal view of the entire E16.5 brain in Figure 1. In some preparations, the trigeminal and facial motor nuclei were retrogradely labeled with 3000 MW fluorescein dextran-amine (FDA; Invitrogen) to provide additional internal landmarks for delineating rhombomere-derived territories.
Figure 1.
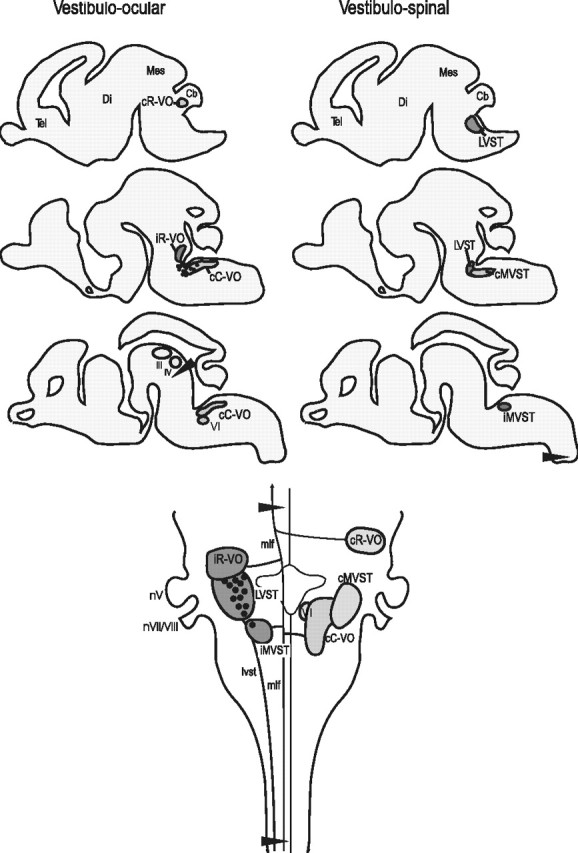
Top, Application sites (arrowheads) for dextran-amine labeling of vestibulo-ocular (left) and vestibulospinal (right) neuron groups and the domains of these groups as seen in serial parasagittal sections (lateral to medial = top to bottom) of the entire brain at E16.5. Ipsilaterally projecting groups are in dark gray, and contralaterally projecting groups are in light gray. Bottom, The domains of the groups as seen from the dorsal surface of the E16.5 hindbrain. Ipsilaterally projecting groups are on the left side, and contralaterally projecting are on the right side. Arrowheads indicate dextran-amine application sites. Tel, Telencephalon; Di, diencephalon; Mes, mesencephalon; Cb, cerebellum; nV, trigeminal nerve entry zone.
After up to 16 h of postoperative incubation, the tissue was fixed in buffered 4% paraformaldehyde overnight at 4°C (EGFP preparations) or in buffered 2% formaldehyde for 2 h at 4°C (lacZ preparations). EGFP preparations were then embedded in 3% agarose. lacZ preparations were processed for β-galactosidase as described by Mombaerts et al. (1996), immersed in 0.2% hydrogen peroxide for 6 h to quench endogenous peroxidases, and embedded in 20% gelatin. All preparations were sectioned on a vibratome at 50–100 μm. EGFP expression and the RDA-labeled vestibular neurons were examined in the same sections using epifluorescence optics (DMX-RA microscope; Leica, Nussloch, Germany) and confocal microscopy (LSM 5 Pascal, Axioplan 2 microscope; Zeiss, Oberkochen, Germany). Sections from lacZ preparations were reacted to visualize the BDA using the standard Vectastain ABC kit (Vector Laboratories, Burlingame, CA) following the manufacturer's instructions, and the β-galactosidase label and the BDA-labeled vestibular neurons were examined in the same sections using conventional optics. Image processing (contrast enhancement and limited retouching only) was performed using Photoshop version 7.0 (Adobe Systems, San Jose, CA).
Results
General strategy and appearance of labeling in transgenic mouse lines
In these experiments, we used different mouse constructs to highlight different sets of rhombomere-derived domains. To trace r2-derived or r3- plus r5-derived domains, we used r2::lacZ and r3/r5::lacZ transgenic mice in which the β-galactosidase reporter was put under the control of specific Hoxa2 enhancer elements (see Materials and Methods). Specific rhombomere derivatives could be traced because of the persistence of β-galactosidase activity throughout development. In addition, we used EGFP as a tracer, taking advantage of two Hoxa2 knock-in alleles in which the Hoxa2 gene was replaced by an EGFP cassette, Hoxa2EGFP or Hoxa2EGFP(lox-neo-lox) (Pasqualetti et al., 2002). In Hoxa2EGFP embryos at early stages, EGFP is expressed from the r1/r2 border to the spinal cord, faithfully mimicking the endogenous Hoxa2 expression pattern (Pasqualetti et al., 2002). Here we have followed the EGFP expression pattern at later stages and used segmental variations in expression as landmarks of rhombomere-derived domains for our labeling studies (see below). In addition, in some experiments, we exploited a Hoxa2EGFP(lox-neo-lox) allele that expresses EGFP only after Cre-mediated deletion of the selection marker cassette, thus allowing Cre-mediated in vivo tracing of specific subsets of Hoxa2-expressing cells (Pasqualetti et al., 2002). For instance, by mating mice bearing this allele with r2::Cre transgenic mice expressing Cre selectively in r2 (Ren et al., 2002), we obtained r2::Cre;Hoxa2EGFP(lox-neo-lox) double heterozygotes that enabled us to trace r2-restricted Hoxa2-expressing derivatives with EGFP. The resultant expression pattern was indistinguishable from that of the r2::lacZ transgenic line (Fig. 2 and data not shown). Below, we provide detailed accounts of the reporter expression patterns obtained with the different mouse lines.
Figure 2.
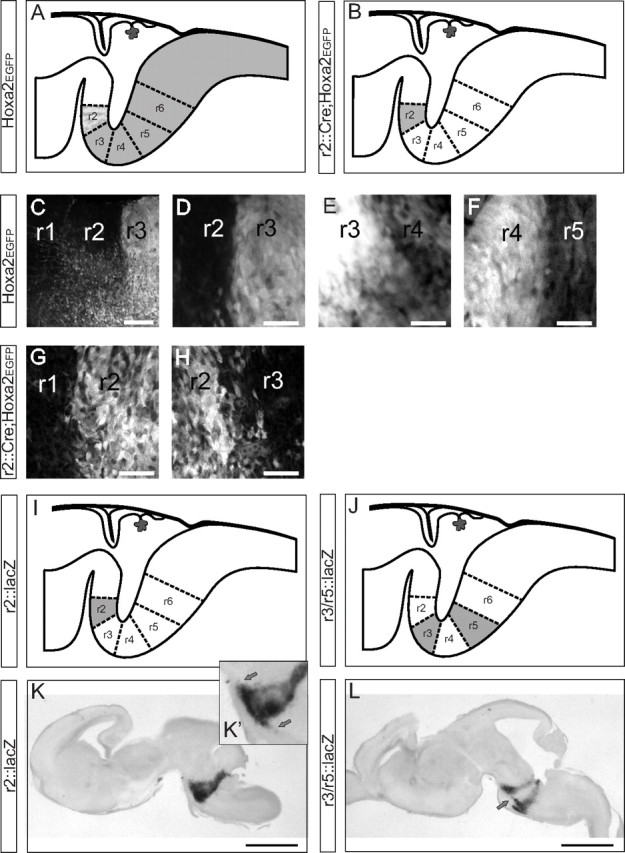
Changes in reporter gene expression along the rostrocaudal axis can be used to define rhombomere-derived territories. A–H, Schematic summaries and confocal images of rhombomere boundaries in the Hoxa2EGFP and r2::Cre;Hoxa2EGFP(lox-neo-lox) reporter mice in parasagittal sections at E12.5. Note that brightness and contrast may vary from panel to panel in C–H to highlight the domain with the highest expression. I–L, Schematic summaries and images of β-galactosidase expression domains in the r2::lacZ and r3/r5::lacZ reporter mice seen in parasagittal vibratome sections at E16.5 (the only stage at which these mice were used). Note longitudinal streams of migrating cells in the ventral region extending from r2 into r1 and r3 in the r2::lacZ mouse (K′, inset, arrows) and between r3 and r5 in the r3/r5::lacZ mouse (arrow). Examples of expression boundaries (and additional migratory streams in more dorsal regions) in the r3/r5::lacZ mouse can also be seen in horizontal sections in Figure 3. Scale bars: C, 100 μm; D–H, 60 μm; K, L, 1 mm.
Hoxa2EGFP
At E11.5–E16.5, the EGFP expression pattern extended caudally from the rostral boundary of r2 (Fig. 2A), as reported previously at earlier stages (Pasqualetti et al. 2002). The EGFP expression levels varied along the rostrocaudal axis in relatively equal steps that we take operationally to define territories derived from successive rhombomeres. In the r2-derived domain, expression was low and non-uniform, with very few EGFP+ cells in the most dorsal region, except for a few scattered along the dorsal part of the r1/r2 boundary. EGFP levels were highest and most uniform in the r3-derived domain, high in the r4-derived domain, and moderate from the r5-derived domain and down. This pattern allowed us to readily distinguish the territories derived from r1 through r5 and their boundaries in parasagittal sections (Fig. 2 C–F). The r2/r3 boundary was particularly sharp, whereas the r3/r4 border was relatively patchy. Support for a correlation with rhombomere boundaries comes from four sources: (1) the domains were in register with those rhombomere boundaries still visible morphologically at these stages (see below); (2) in comparison, the domains matched well the r2-derived domain in the r2::lacZ and r2::Cre;Hoxa2EGFP(lox-neo-lox) mice and the r3- and r5-derived domains in the r3/r5::lacZ mice (see below); (3) the exit zones of the trigeminal and facial motor nerves, recognizable by their paucity of EGFP expression, were located, respectively, in the ventral portions of r2- and r4-derived domains in accordance with previous descriptions (see below); and (4) in parasagittal sections, the domains appeared as wedges expanding from dorsal to ventral and canted according to the angle of the pontine flexure, entirely reminiscent of the rhombomeric domains seen in quail–chicken chimeric hindbrains of similar developmental maturity (Marin and Puelles, 1995; Díaz et al., 1998; Cambronero and Puelles, 2000) and as noted more recently in the mouse by Farago et al. (2006). From r3 caudal, EGFP expression was strongest in the dorsal region, where the vast majority of the vestibular neurons resides, but faded in more ventral regions, in keeping with endogenous Hoxa2 expression (data not shown) (Pasqualetti et al., 2002). In the documentation of vestibular neuron group locations below, we only traced putative rhombomere boundaries where we could clearly see step changes in EGFP expression under the microscope.
R2::Cre;Hoxa2EGFP(lox-neo-lox) and R2::lacZ
At E11.5–E16.5, the EGFP expression pattern in the r2::Cre;Hoxa2EGFP(lox-neo-lox) mouse matched the r2-derived domain in the Hoxa2EGFP mouse (Ren et al., 2002) (Fig. 2 B,G,H). Expression was uniformly strong throughout, with only a minor proportion of the cells within the domain not expressing detectable levels of the reporter genes. In the dorsal region where the vestibular neuron groups reside, the r1/r2 boundary was sharp, but the r2/r3 boundary was less sharp, and also less sharp than the r2/r3 boundary in the Hoxa2EGFP mouse (Fig. 2D,H). The r2::lacZ mouse was only used at E16.5. At this stage, β-galactosidase expression was essentially identical to the EGFP expression in the r2::Cre;Hoxa2EGFP(lox-neo-lox) mouse (Fig. 2I,K).
R3/r5::lacZ
The r3/r5::lacZ mouse was only used at E16.5. The β-galactosidase expression pattern at this stage highlighted the r3- and r5-derived domains (Fig. 2J,L). These domains were labeled in their full mediolateral and dorsoventral extents, with especially strong labeling in the dorsolateral regions where most of the vestibular complex lies. Labeling was weaker in more ventral and central regions of the hindbrain. In horizontal sections of preparations in which the hindbrain was straightened along the rostrocaudal axis, each rhombomeric domain appeared as an oblique stripe of similar mediolateral width (Fig. 3), and in parasagittal sections, they appeared as wedges as described above.
Figure 3.
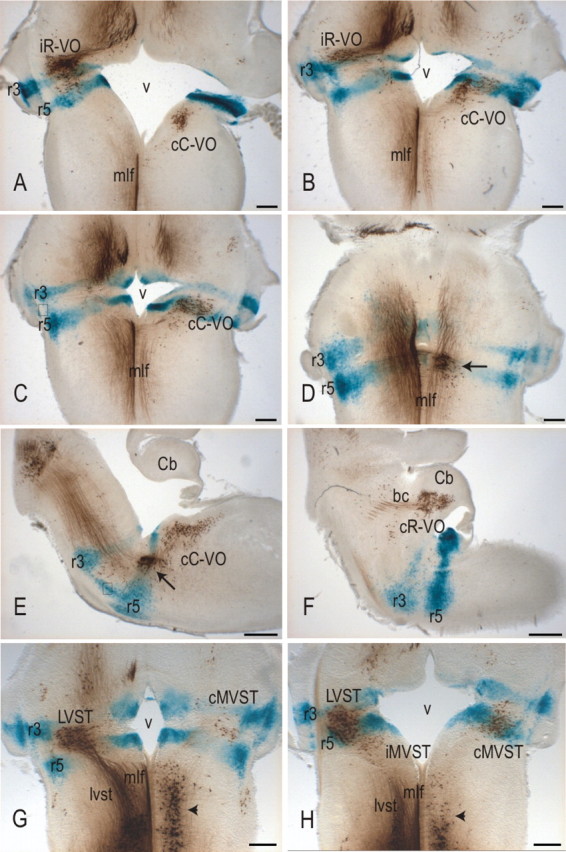
The relationship between rhombomere-derived territories and the domains of the vestibulo-ocular and vestibulospinal groups in horizontal sections at E16.5, assessed by retrograde labeling with BDA in the r3/r5::lacZ mouse. bc, Brachium conjunctivum; Cb, cerebellum; v, fourth ventricle. Arrows in D and E indicate the subpopulation of cC-VO neurons located in the abducens nucleus. Boxes in C and E indicate migratory cell streams between r3 and r5. Arrowheads in G and H indicate reticulospinal neurons that are also labeled by the spinal BDA application site used to label vestibulospinal neurons. Scale bars: A–D, G, H, 200 μm; E, F, 400 μm.
Migratory streams
As in the chicken embryo (Marin and Puelles, 1995), longitudinally oriented streams of cells could be seen issuing from labeled rhombomeric domains into adjacent domains at specific sites. In the r2::Cre;Hoxa2EGFP(lox-neo-lox) and r2::lacZ mice, a few scattered EGFP+ or lacZ+ cells, respectively, could be seen in the ventral regions of r1 and r3 (Fig. 2K,K′, inset; and data not shown). In the r3/5::lacZ mice, a large stream could be seen in the ventromedial area between r3 and r5 just dorsal to the pontine nuclei (Figs. 2L, 3E). In addition, more compact streams extended both rostrally and caudally from r3 and r5 in association with white matter tracts in the dorsolateral region (Fig. 3). None of these streams of cells were associated with the vestibular neuron groups.
General appearance of retrograde labeling of vestibular neuron groups
Depending on the developmental stage, the BDA and RDA applications labeled six easily identifiable groups of vestibular projection neurons and their axons and an additional specific population of more scattered vestibular projection neurons, as well as other neurons and axons that project through the same application sites (e.g., reticulospinal neurons and raphe neurons) (Figs. 3–8) (see below and data not shown). Based on their locations and axon trajectories, the six vestibular neuron groups could be identified as direct counterparts of vestibular projection neuron groups originally characterized in the chicken embryo (Glover and Petursdottir, 1988, 1991; Díaz et al., 2003). On the basis of anterograde labeling, neurotransmitter profiling, and optical recording of functional connectivity in the chicken embryo, these vestibular neuron groups are believed to have specific functional roles in the context of vestibulo-ocular and vestibulospinal reflexes (Glover, 2003; J. C. Glover, H. Mochida, Y. Momose-Sato, and K. Sato, unpublished results). Their names reflect either a combination of projection and rostrocaudal position, in the case of the vestibulo-ocular groups, or the axon tract of projection, in the case of the vestibulospinal groups. The vestibulo-ocular groups identified in the mouse embryo were the ipsilateral rostral vestibulo-ocular (iR-VO) group and the contralateral rostral vestibulo-ocular (cR-VO) and contralateral caudal vestibulo-ocular (cC-VO) groups. The vestibulospinal groups were the lateral vestibulospinal tract (LVST) group and the ipsilateral medial vestibulospinal tract (iMVST) and contralateral medial vestibulospinal tract (cMVST) groups.
Figure 4.
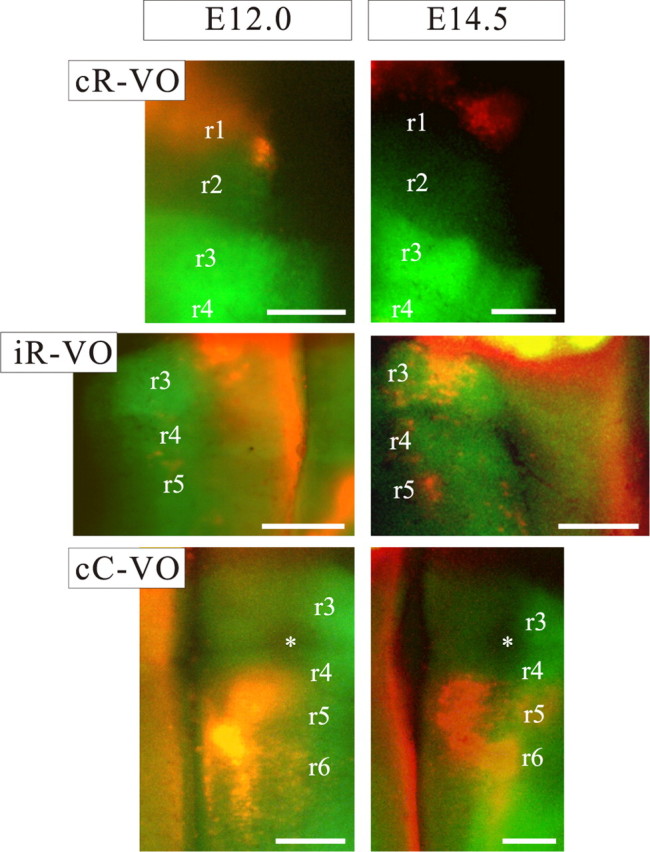
The relationship between rhombomeric territories (r1–r6) and the domains of the vestibulo-ocular groups at E12.0 and E14.5 as seen in whole-mount preparations of the Hoxa2EGFP mouse. Medial is to the left for the cR-VO and cC-VO groups and to the right for the iR-VO group. Some of the rhombomere boundaries can be seen clearly at these stages, independently of the EGFP expression pattern. Note that overlaps between the neuron groups and the EGFP expression domains can only be definitively assessed in sections (see Figs. 5–8). Asterisks mark the trigeminal nerve root, where EGFP expression is absent. Scale bars, 200 μm.
Figure 5.
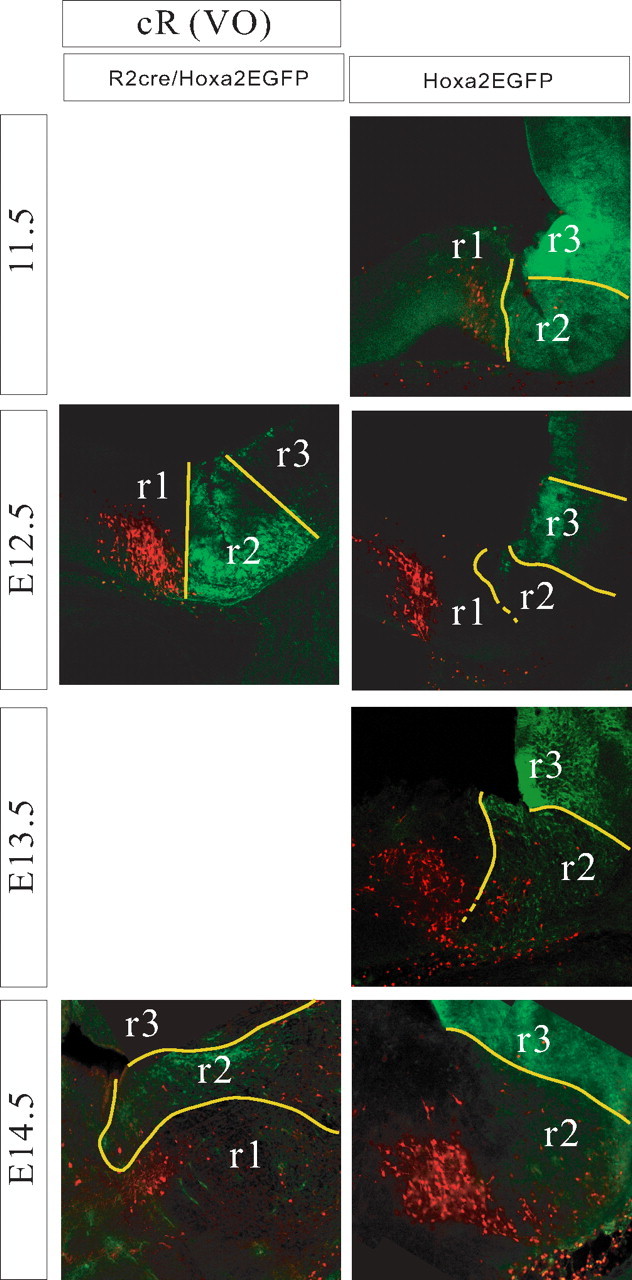
Relationship of the cR-VO group to rhombomere-derived domains as seen in parasagittal sections of r2::Cre;Hoxa2EGFP(lox–neo–lox) mice (left) and Hoxa2EGFP mice (right) at E11.5–E14.5. Yellow lines indicate expression domain boundaries that were clearly visible, and broken lines indicate less certain boundaries. Dorsal is up, and rostral is to the left.
Figure 6.
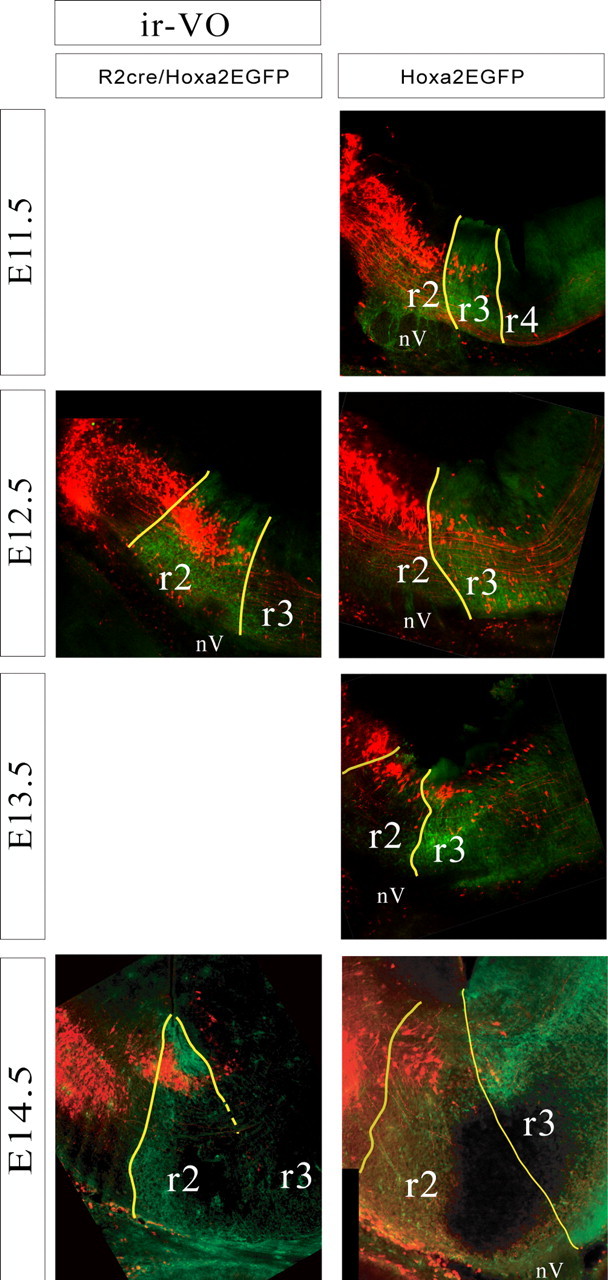
Relationship of the iR-VO group to rhombomere-derived domains as seen in parasagittal sections of r2::Cre;Hoxa2EGFP(lox–neo–lox) mice (left) and Hoxa2EGFP mice (right) at E11.5–E14.5. Yellow lines indicate expression domain boundaries that were clearly visible, and broken lines indicate less certain boundaries. Dorsal is up, and rostral is to the left. nV, Trigeminal nerve entry zone, which is devoid of EGFP expression.
Figure 7.
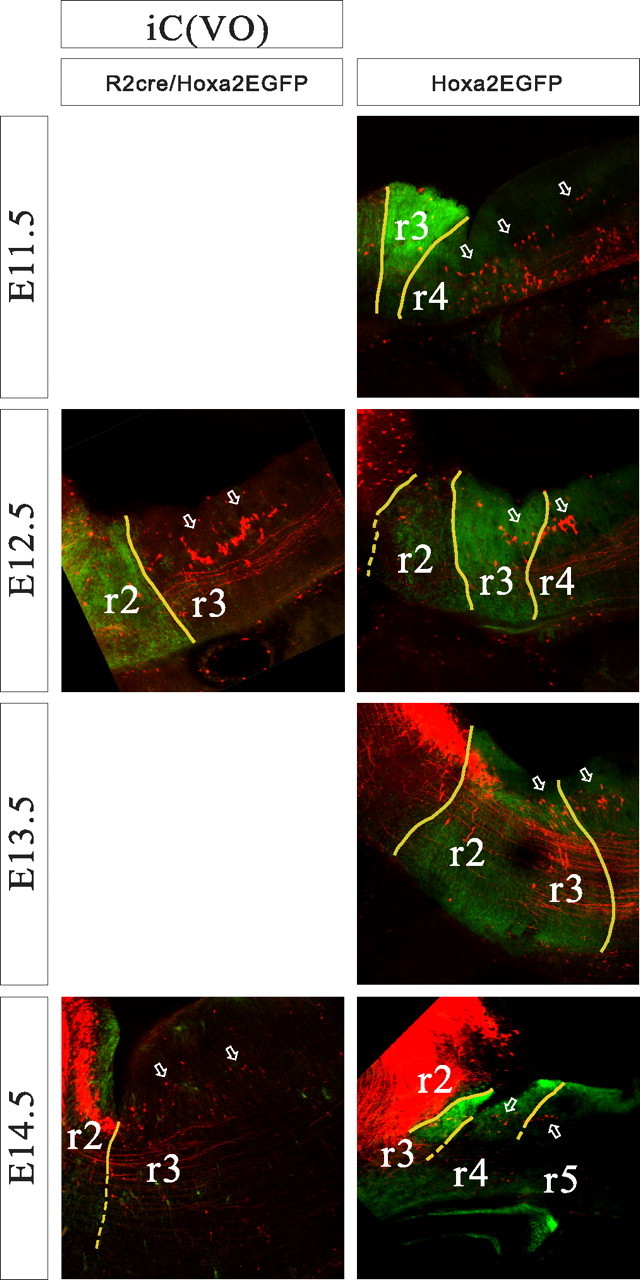
Relationship of the iC-VO group to rhombomere-derived domains as seen in parasagittal sections of r2::Cre;Hoxa2EGFP(lox–neo–lox) mice (left) and Hoxa2EGFP mice (right) at E11.5–E14.5. Arrows indicate the iC-VO neurons, which are few in number and dwindle markedly by E14.5. Yellow lines indicate expression domain boundaries that were clearly visible, and broken lines indicate less certain boundaries. Dorsal is up, and rostral is to the left.
Figure 8.
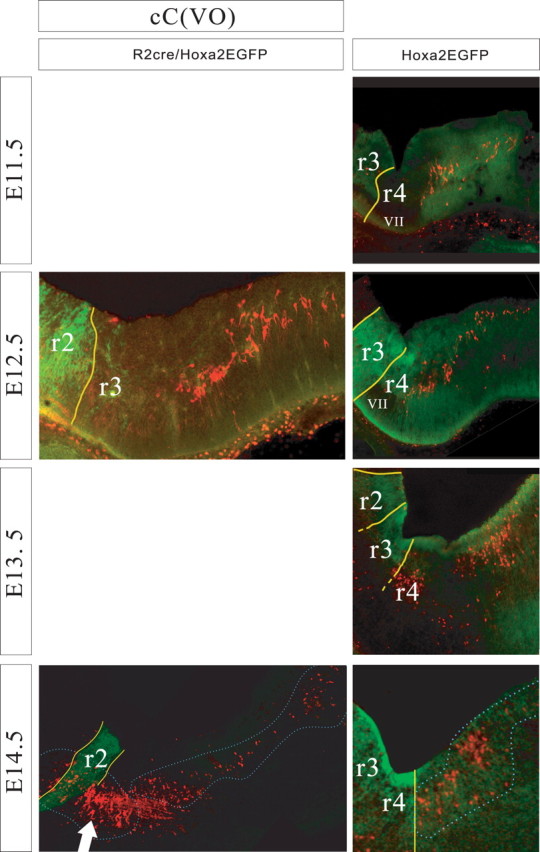
Relationship of the cC-VO group to rhombomere-derived domains as seen in parasagittal sections of r2::Cre;Hoxa2EGFP(lox–neo–lox) mice (left) and Hoxa2EGFP mice (right) at E11.5–E14.5. Yellow lines indicate expression domain boundaries that were clearly visible, and broken lines indicate less certain boundaries. Dorsal is up, and rostral is to the left. nVII, Facial nerve entry zone, which is devoid of EGFP expression. At E14.5, the cC-VO group is outlined. In the r2::Cre;Hoxa2EGFP(lox–neo–lox) panel (left), the large arrow indicates a population of labeled neurons, probably rostrally projecting raphe neurons, located ventral to the domains that contain the vestibular projection neuron populations.
Although the labeled groups were very similar to those in the chicken embryo, there was one striking difference. In the chicken embryo, a seventh group, the ipsilateral caudal vestibulo-ocular (iC-VO) group, can be recognized easily from an early stage. It is located caudal to the iR-VO group and the LVST group and contains numerous densely packed neurons (Petursdottir, 1990, Glover and Petursdottir 1991). In the mouse, scattered neurons could be seen in this location but were scarce from an early stage and rarely observed at E16.5. Thus, although we document the domain of these iC-VO neurons below, we do not feel that they constitute a group in the mouse.
Two of the vestibular projection neuron groups, the medially projecting vestibulospinal groups (iMVST and cMVST), could not be identified unambiguously before E16.5. This probably reflects a later development of their axon projections, as is the case in the chicken embryo (Glover and Petursdottir, 1991).
Group-by-group fate mapping
In assessing the relationship of each vestibular neuron group to the rhombomere-derived domains, we initially examined the groups at E16.5 in the r2::lacZ and the r3/r5::lacZ mice (Fig. 3). This was done to allow a direct comparison with our previously published material obtained in chicken embryos at a developmental stage (day 11) roughly equivalent to E16.5 in the mouse. Based on the findings obtained at E16.5, we then examined the same groups at earlier stages (E11.5–E14.5) in the Hoxa2EGFP and the r2::Cre;Hoxa2EGFP(lox-neo-lox) mice (Figs. 4–8). In some cases, neuron groups and expression domains were visible in whole-mount preparations (Fig. 4), but a complete analysis of spatial relationships was always performed in sections using confocal microscopy (Figs. 5–8).
Vestibulo-ocular groups
The cR-VO group was chiefly localized in the r1-derived domain with very few cells in the r2-derived domain (Figs. 3–5). At the earliest stages (E11.5, E12.5) the rostral limit lay within r1, and the caudal limit had a varying relationship to the r1/r2 boundary, depending on the mediolateral level. Medially, the caudal limit lay close to the r1/r2 boundary, with a few labeled neurons located in the very most rostral rim of r2. At progressively more lateral levels, the caudal boundary shifted progressively more rostral. With subsequent development, the entire cR-VO group gradually attained a more rostral, dorsal, and lateral position as the cerebellum and cerebellar peduncles grew and expanded. As a consequence, by E16.5, the cR-VO group was located in the presumptive cerebellar peduncle (Fig. 3F). We presume this to be primarily a morphogenetic transformation, not a wholesale migration of neurons.
The iR-VO group comprised at E16.5 a dense cluster of neurons located primarily in the r2-derived and the caudal portion of the r1-derived domains, with a tail of cells extending into r3-derived territory (Fig. 3). At early stages (E11.5), it had basically the same appearance: a coherent cell column starting near the application site in r1 and extending through r2, then dwindling to a few scattered cells in r3 (Figs. 4, 6). The rhombomere-derived domain was therefore already established by E11.5 and maintained through E16.5. The axons of the iR-VO neurons could be followed in horizontal sections along the rostral wall of the fourth ventricle toward the MLF (Fig. 3A), just as the axons of the iR-VO neurons do in the chicken embryo (Petursdottir, 1990; Glover and Petursdottir, 1991).
The iC-VO neurons lay caudal to the scattered cells in the tail of the iR-VO group at early stages. In the chicken embryo, the iC-VO neurons constitute a coherent group located caudal to the iR-VO group and separated from it by scattered neurons. In the mouse embryo, iC-VO neurons were scarce and loosely packed (on which grounds we did not define them as a group per se), located in r4 and extending through r5 and into r6 at E11.5 (Fig. 7). With subsequent development, the number of retrogradely labeled iC-VO neurons decreased, such that by E16.5, iC-VO neurons could hardly be detected (Fig. 3). In contrast, the scattered neurons in the “tail” of the iR-VO group, within the r3-derived domain, were still obvious at E16.5.
The cC-VO group was the most extensive rostrocaudally. At E11.5–E12.5, it consisted of a broad column of neurons extending from r5 at least as far as the caudal limit of r7 (Figs. 4, 8). In its more lateral reaches, the group also extended into r4, a feature that was most evident at later stages (Figs. 3C, 8) A dense cluster of cC-VO neurons could be seen in the ventromedial portion of the r5-derived territory (Figs. 3D,E, 4). This cluster most likely corresponds to the interneurons of the abducens nucleus, a well defined component of the cC-VO group in the chicken (Glover, 2003) and an important relay in the control of horizontal eye movements in mammals (Baker and Highstein, 1975).
To corroborate their placement in specific rhombomere-derived domains, we took advantage of the known segmental distribution of other neuron populations that could be visualized in the same preparations. For example, the vestibulo-ocular labeling paradigm consistently labeled the rostrally projecting raphe neuron populations (Fig. 8). Additional labeling experiments were also performed in which the vestibulo-ocular neuron groups and the trigeminal and facial motor nuclei, respectively, located at late stages in the r2/r3- and r6-derived domains, were labeled differentially with RDA and FDA (Fig. 9). The locations of these motor nuclei, although located ventral to the vestibular neurons, supported the rhombomeric distributions of the vestibular neuron groups by being situated in the ventral portions of the corresponding wedge-shaped domains.
Figure 9.

Relationship of the three vestibulo-ocular projection neuron groups [iR-VO (iR), iC-VO (iC), and cC-VO (cC); labeled red] to the trigeminal (Vm) and facial (VIIm) cranial motor nuclei (labeled green) at E14.5. Approximate locations of the rhombomere domains are indicated.
Figure 10 summarizes the developmental changes that occur in the vestibulo-ocular projection group domains.
Figure 10.

Developmental summary of vestibular projection neuron group domains.
Some of the vestibular projection groups had dense cell packing throughout their rostrocaudal extent, whereas others had more scattered cells at their rostral and/or caudal limits. The relationship of group domain to rhombomere boundaries was therefore sharper in some cases than others. To determine whether neurons had moved from one rhombomere-derived domain into another, labeled neurons present just outside of a genetically marked rhombomere-derived domain were assiduously examined for evidence of double labeling using confocal microscopy and spectral analysis. This was only relevant for the cR-VO and iR-VO groups in the r2::Cre;Hoxa2EGFP(lox-neo-lox) mouse. The analysis showed unequivocally that no cR-VO neurons in the r1-derived domain and no iR-VO neurons in the r1- or r3-derived domain expressed EGFP, indicating that they did not derive from r2. Moreover, nearly all iR-VO neurons in the r2-derived domain were EGFP positive. Those few that were not may have been part of the minor proportion of Hoxa2-negative (and therefore EGFP-negative) cells normally seen in the r2::Cre;Hoxa2EGFP(lox–neo–lox) mouse. Together, these findings suggest that the minority of cR-VO and iR-VO neurons that lie outside the principal rhombomeric domain do not attain these positions by interrhombomeric migration but rather by either intrarhombomeric migration or a patterning event that is not exquisitely aligned with rhombomere boundaries.
Vestibulospinal groups
The vestibulospinal groups were only assessed at E16.5, primarily because at earlier stages, two of the three groups (the iMVST and cMVST groups) are not readily retrogradely labeled, and the third group (the LVST group) is difficult to distinguish from nearby neuron populations in the principal and spinal trigeminal nuclei and the nucleus of the solitary tract, which are retrogradely labeled from the same tracer application site (Auclair et al., 1999).
The LVST group was located in the r3-, r4-, and r5-derived domains. Its rostral limit lay within the r3 domain, and its caudal limit lay at or near the r5/6 boundary. The cMVST group was located primarily in the r4-, r5-, and r6-derived domains, with a few cells in the very most caudal part of r3. Its rostral limit lay therefore near the r3/4 boundary, and its caudal limit lay within r6. The iMVST group was located only in the r6-derived domain (Fig. 3).
The relationship between the longitudinal domains of vestibular projection neurons with different axon trajectories and the rhombomere-derived domains are summarized in Table 1. This shows that there is no strict relationship between rhombomere of origin and axon projection phenotype. Rather, each of the clearly delimited rhombomeres (i.e., r2–r6) contains at least two and as many as four different projection phenotypes within the composite vestibular neuron population. In contrast, each rhombomere does exhibit a characteristic profile of vestibular projection phenotypes. Had we defined the LVST group as a separate category by virtue of its unique lateral axon trajectory, the diversity among the rhombomeres would be even greater, with ipsilateral caudal medial trajectories deriving only from the iMVST neurons in r6. Yet, despite the clear rostrocaudal diversity within the longitudinal column that contains the vestibular complex, only one projection phenotype (ipsilateral caudal medial) is unique to a single rhombomere. Moreover, only one phenotype (ipsilateral rostral) is even close to being segmentally iterated.
Table 1.
Relationship between the longitudinal domains of axon projection phenotypes and rhombomere-derived domains
| Ipsi rostral (iR-VO, iC-VO) | Ipsi caudal (LVST, iMVST) | Contra rostral (cR-VO, cC-VO) | Contra caudal (cMVST) | |
|---|---|---|---|---|
| ″r1″ | * | X | ||
| r2 | X | * | * | |
| r3 | X | X | * | |
| r4 | X | X | * | X |
| r5 | X | X | X | X |
| r6 | * | X | X | * |
| ″r7″ | X |
Ipsi, ipsilateral; Contra, contralateral; X, present throughout the longitudinal extent of indicated rhombomere-derived domain; *, present in a fraction of the longitudinal extent of the indicated rhombomere-derived domain (note that in the case of the iC-VO neurons, this is a stage-dependent feature).
Discussion
This is the first study to map the segmental origins of a large complex of mammalian hindbrain nuclei at the level of functionally identifiable neuron groups. It is also one of few such studies in which the fate of well defined neuron groups has been assessed through successive stages of development. This is a general weakness in many earlier fate maps. Here we have attempted to rectify this weakness by following the pattern from the earliest stage that vestibular groups can be identified consistently (E11.5). Because the vestibular nuclear complex spans all the hindbrain neuromeres and encompasses diverse neuron groups involved in complex sensorimotor processing, it provides an ideal subject for addressing many questions regarding hindbrain patterning. For example, are particular neuron types present in all rhombomeres, in an iterated pattern, as suggested by previous studies (Clarke and Lumsden, 1993)? Do functional neuron groups derive from single or multiple rhombomeres? Are specific phenotypic characters generated in specific anteroposterior domains? To elucidate the segmental patterning of the vestibular nuclear complex, we have used a transgenic fate-mapping approach in which rhombomere-specific promoters or enhancer elements drive reporter genes. This permits visualization of rhombomere-derived domains well after the rhombomeres themselves have disappeared, at stages when specific vestibular projection neuron phenotypes can be labeled and identified. A similar approach has been used recently to assess the rostrocaudal origins of rhombic lip-derived neurons in the auditory nuclei of the mouse (Farago et al., 2006).
Fidelity of rhombomeric domains revealed by Hoxa2 enhancer elements
The reporter gene expression patterns that are generated using the Hoxa2-associated enhancer elements define striped patterns in the hindbrain that resemble the original rhombomeres (Pasqualetti et al., 2002; Ren et al., 2002) (data not shown). Because rhombomere development involves dynamic interactions among Hox and other genes (for review, see Glover et al., 2006), and because cell movement across rhombomere boundaries is known to occur (Birgbauer and Fraser, 1994; Wingate and Lumsden, 1996), an important question is whether the striped Hox gene expression patterns faithfully represent the rhombomere-derived domains throughout development. For example, expansion or shrinkage of expression territories or any interrhombomeric cell movement could compromise the precision of this representation.
The segmental precision of gene expression is difficult to test, because the transience of rhombomeres precludes their use as independent morphological landmarks at later stages when most neurons have differentiated sufficiently to be identified. Nevertheless, it is clear on comparison with previous studies that the striped expression patterns we observe from E11.5 to E16.5 are essentially identical to those seen at earlier stages, when they neatly delineate the still visible rhombomeres (Ren et al., 2002) (Fig. 4). We also obtain consistent results using three different reporter gene contexts that provide complementary expression domains. Thus, despite inherent difficulties in assessing the precise relationship between their expression patterns and the actual rhombomere-derived domains, the transgenic lines used here provide useful tools for the anteroposterior fate mapping of hindbrain neuron populations. In combination with similar fate mapping based on dorsoventral progenitor domains, a complete fate map of the mammalian hindbrain can be envisioned. The use of Cre/Flp double conditional transgenic models provides a powerful combinatorial approach that will undoubtedly accelerate such analyses (Farago et al., 2006).
Interrhombomeric migration is not a major determinant of vestibular neuron domains
Interrhombomeric cell movement clearly does occur, as shown by cells that stream from genetically marked rhombomeres into adjacent, unmarked rhombomeres (Figs. 2, 3). In addition, several studies have demonstrated pronounced rostrocaudal peregrinations by neuron populations. For example, cells derived from the rhombic lip of r6–r8 give rise to an anterior migratory stream that traverses several rhombomeres to populate the pontine nuclei (Farago et al., 2006), and facial branchial motoneurons migrate caudally from their origin in r4 to settle in r6 (Muller et al., 2003). In quail–chicken chimeras, Marin and Puelles (1995) reported the migration of small proportions of vestibular neurons from their rhombomere of origin into the neighboring rhombomere. In contrast, we did not observe any obvious interrhombomeric cell movement within the vestibular region, although we cannot rule out minor interrhombomeric movements. Thus, it appears unlikely that the vestibular projection neuron populations attain their rhombomeric domains through large-scale migration. Rather, because the domains are essentially established already by E11.5, it seems probable that they represent the sites where the neuron groups are generated. Could migration have occurred before E11.5? Based on birthdating studies in the rat embryo (Altman and Bayer, 1980), and given the general 1.5 d shift in developmental stage between mouse and rat, it can be estimated that the vast majority of vestibular neurons are generated between E10.5 and E11.5 in the mouse. Thus, if migration plays a significant role, it must occur quite soon after the neurons are born and be much more rapid than that of facial branchial motoneurons, which use ∼2 d to migrate from r4 to r6 (Muller et al., 2003). On the whole, it seems most likely that the consistent rhombomeric patterns seen from E11.5 to E16.5 represent the sites of vestibular neuron generation rather than patterns of migratory settlement.
The role of segmental patterning in establishing functionally identifiable vestibular neuron groups
Given that migration is not a major determinant of the rostrocaudal patterning of these vestibular projection neuron groups, and given that the groups' domains are related to specific rhombomes, it is important to ask whether the pattern is indeed caused by the segmentation that creates the rhombomeres. Our results suggest that these groups typically derive from domains that are not uniquely defined by rhombomere boundaries, but rather overlap partially a portion of a neighboring rhombomere. This has been observed previously for the vestibular neuron groups in the chicken embryo (Díaz et al., 1998), and more recently in specific cranial motoneuron nuclei in the lamprey (Murakami et al., 2004). By extension, such overlap suggests that the actual determinants of these neuron groups are expressed in rostrocaudal domains that are not perfectly aligned with the rhombomeres, although it remains to be tested whether restriction to a portion of a rhombomere represents migratory relocation from an initial full rhombomeric domain. Partial domains would not necessarily contradict the general concept of rhombomere-restricted gene expression, because some rhombomeric expression patterns are attained gradually under the control of dynamic sources of signaling molecules such as retinoic acid (for review, see Glover et al., 2006). The locations of specific vestibular neuron groups could thus arise from a dynamic pattern of determinants that leave nonaligned traces (neuron groups) as they approach their ultimately segmentally aligned domains (for discussion, see Glover, 2001).
We also observe that each rhombomere contains a unique set of vestibular projection neuron phenotypes (Table 1), suggesting that differentially distributed rostrocaudal determinants assign different fates within functionally related longitudinal neuron columns. At least part of this rostrocaudal diversity may potentially be traced to the specification of neuronal progenitors, as is the case for the r4-specific switch from serotonergic neuron fate to visceral motoneuron fate in a specific population of ventral progenitors (Pattyn et al., 2003). Thus, rostrocaudal diversity, synonymous with segmental diversity if correlated exquisitely to the rhombomeres, is likely to be an early event during neurogenesis, rather than being imposed on a segmentally iterated pattern by later factors such as regressive changes or interactions with ingrowing afferents (cf. Clarke and Lumsden, 1993).
Functional and anatomical relationships: hodology versus cytoarchitectonics
As assessed directly in the chicken embryo previously (Díaz et al., 2003), the vestibulo-ocular and vestibulospinal neuron groups defined by axon projection pathway (hodology) are with only one exception non-overlapping (a few contralaterally projecting vestibular neurons with bifurcating axons belong to both the cC-VO and cMVST groups). Together, they generate a spatial mosaic of neuron groups (the “hodological mosaic”) that differs from the classical vestibular nuclei defined by cytoarchitectonics. Other vestibular neuron classes that have not been assessed here include vestibulocerebellar [which have been analyzed in the chicken embryo by Díaz and Puelles (2003)], intrinsic commissural, vestibuloreticular, and vestibulothalamic neurons. Nor have neurons that project to the abducens nucleus been assessed because of the technical difficulty of labeling these retrogradely from the nearby abducens nucleus, although in the chicken embryo, some of the cMVST neurons extend axon collaterals into the abducens nucleus as they project to the spinal cord (Glover, unpublished observations). A complete account of the hodological mosaic will require a description of these neurons and their spatial relationships within the vestibular complex.
The relationship between the hodologically defined vestibulospinal and vestibulo-ocular groups and the classic vestibular nuclei has been investigated thoroughly in the chicken embryo (Díaz et al., 2003). Based on this study and a comparison with the existing literature on the mammalian vestibular nuclei, tentative relationships can be proposed for the mouse, as shown in Table 2. An important feature is that a given hodological group may overlap several classical nuclei or, in contrast, be restricted to a subdomain of a classical nucleus. The chicken LVST group, for example, overlaps several classical nuclei and as a result is heterogeneous with respect to cytoarchitecture despite being homogeneous with respect to axon projection (Díaz et al., 2003). The chicken iR-VO group, in contrast, is located centrally within the superior nucleus and is homogeneous both in cytoarchitecture and in axon projection (Díaz et al., 2003), as well as in putative neurotransmitter phenotype, because it contains predominantly GABA-positive neurons (Glover, 2000). Another important feature is that, for the vestibulo-ocular groups, synaptic connections as deduced from anterograde labeling follow a system in which each group drives a pair of ocular motoneuron pools that function synergistically within the context of vestibulo-ocular reflexes (Jansen, 1991; Glover, 2000, 2003). The iR-VO group, for example, innervates the superior oblique (trochlear) and inferior rectus (oculomotor) motoneurons on the ipsilateral side, which because of the crossing of the trochlear nerve innervate the corresponding muscles in opposite eyes, consistent with a synergistic effect of these muscles in conjugated eye movements. The functional significance of the hodologically defined vestibular neuron groups therefore derives from their evidently unique patterns of synaptic connections. This implies a direct link between the developmental patterning inherent in the fate map described here and functional connectivity (Glover, 2000; Díaz and Puelles, 2002).
Table 2.
Correlation between hodological subdivisions and classical cytoarchitectonic vestibular nuclei
| Chickena | Mouseb | |
|---|---|---|
| Vestibulo-ocular groups | ||
| iR-VO | Central portion of superior nucleus; small fraction in Deiters' nucleus | Superior nucleus |
| cR-VO | Mostly in lateral inferior cerebellar nucleus of Cajal; small fraction in dorsal part of superior nucleus | Superior nucleus; y-group (infracerebellar nucleus)? |
| iC-VO | Mostly descending nucleus; a few in Deiters' nucleus | |
| cC-VO | Deiters', tangential, medial, descending, abducens nuclei | Lateral (Deiters'), medial, inferior (descending) nuclei |
| Vestibulo-spinal groups | ||
| LVST | Deiters', tangential nuclei | LVST + cMVST + iMVST Lateral (Deiters'), medial, inferior (descending) nuclei |
| iMVST | Descending nucleus | |
| cMVST | Deiters', tangential, descending nuclei | |
| Vestibulo-cerebellar groups | ||
| R-VC | Central portion of superior nucleus, ventral part of Deiters' nucleus | Superior nucleus and ventral y-group |
| C-VC | Descending and medial nuclei | Descending (inferior) and medial nuclei; nucleus prepositus hypoglossi? |
R-VC, Rostral vestibulo-cerebellar; C-VC, caudal vestibulo-cerebellar.
aFrom Díaz et al. (2003).
bCompared with Büttner-Ennever (2000), her Figures 1.5 and 1.7.
Clearly, additional work is required to extend the tentative relationships proposed for the mouse in Table 2 to a complete account of the functional neuroanatomy of the mammalian vestibular system in which hodology, cytoarchitectonics, and synaptic connections are integrated.
Evolutionary conservation and divergence in the rhombomeric pattern
We chose E16.5 as the developmental end point in the mouse specifically because it is comparable to the day 11 chicken embryo, in which we have fate mapped the vestibular complex using the chicken/quail chimera approach (Díaz et al., 1998; Díaz and Puelles, 2003). We find an overall correspondence in the rhombomeric pattern of the same vestibular group domains in mouse and chicken embryos (Fig. 11). The only major exceptions are the LVST group, which appears to have a more extensive rostrocaudal extent in the mouse than in the chicken, and the iC-VO group, which never appears as a well defined group and eventually disappears in the mouse, either through cell death or retraction of axons. Although the functional implications of these differences are not clear, they may have evolved to tailor the vestibular system to fit the behavioral repertoires of rodents and birds, which use different modes of locomotion and differ in their patterns of head–eye and head–body coordination. Better functional characterization of these groups should shed light on this issue. That the basic pattern seen in both mouse and chicken represents a more ancient blueprint that has been modified in different vertebrate lineages is supported by the existence of similar but not identical rhombomeric patterns in fish and amphibians (Suwa et al., 1996; Straka et al., 2001; for review, see Díaz and Glover, 2002).
Figure 11.

Comparison of vestibular projection neuron fate maps in the chicken and mouse embryos. The chicken fate map is as reported by Díaz et al. (1998).
General summary
This study demonstrates the general utility of the transgenic approach to fate mapping and lays an important foundation for an important further development. By establishing the anteroposterior and dorsoventral domains from which specific functional neuron groups derive, it will be possible to use combinatorial conditional transgenics to target genetic manipulations to specific groups. Here we see that targeting manipulations to individual rhombomeres can single out specific vestibular neuron groups in a functional context. For example, a manipulation targeted to r2 would affect almost exclusively the iR-VO group in the context of vestibulo-ocular function, and a manipulation targeted to r6 would affect almost exclusively the iMVST group in the context of vestibulospinal function. This and future transgenic fate maps thereby facilitate a powerful genetic approach to the selective functional manipulation of neural circuits in this part of the brain.
Footnotes
This work was supported by grants from the European Union fifth Framework (Brainstem Genetics, QLG2-CT01-01467), the Agence Nationale pour la Recherche, the Fondation pour la Recherche Medicale (“Equipe labelisée”), the Association pour la Recherche contre le Cancer, the Association Française contre les Myopathies, and the Ministère pour le Recherche (Action concentée incitative program) and by institutional funds from the University of Oslo, University of Castilla-La Mancha, Centre National de la Recherche Scientifique, and Inserm. We thank Kobra Sultani for technical assistance.
References
- Altman J, Bayer SA. Development of the brain stem in the rat. III. Thymidine-radiographic study of the time of origin of neurons of the vestibular and auditory nuclei of the upper medulla. J Comp Neurol. 1980;194:877–904. doi: 10.1002/cne.901940410. [DOI] [PubMed] [Google Scholar]
- Anderson SA, Marin O, Horn C, Jennings K, Rubenstein JL. Distinct cortical migrations from the medial and lateral ganglionic eminences. Development. 2001;128:353–363. doi: 10.1242/dev.128.3.353. [DOI] [PubMed] [Google Scholar]
- Auclair F, Marchand R, Glover JC. Regional patterning of reticulospinal and vestibulospinal neurons in the hindbrain of rat and mouse embryos. J Comp Neurol. 1999;411:288–300. doi: 10.1002/(sici)1096-9861(19990823)411:2<288::aid-cne9>3.0.co;2-u. [DOI] [PubMed] [Google Scholar]
- Baader SL, Schilling ML, Rosengarten B, Pretsch W, Teutsch HF, Oberdick J, Schilling K. Purkinje cell lineage and the topographic organization of the cerebellar cortex: a view from X inactivation mosaics. Dev Biol. 1996;174:393–406. doi: 10.1006/dbio.1996.0083. [DOI] [PubMed] [Google Scholar]
- Baker R, Highstein SM. Physiological identification of interneurons and motoneurons in the abducens nucleus. Brain Res. 1975;91:292–298. doi: 10.1016/0006-8993(75)90551-x. [DOI] [PubMed] [Google Scholar]
- Balaban E, Teillet MA, Le Douarin N. Application of the quail-chick chimera system to the study of brain development and behavior. Science. 1988;241:1339–1342. doi: 10.1126/science.3413496. [DOI] [PubMed] [Google Scholar]
- Birgbauer E, Fraser SE. Violation of cell lineage restriction compartments in the chick hindbrain. Development. 1994;120:1347–1356. doi: 10.1242/dev.120.6.1347. [DOI] [PubMed] [Google Scholar]
- Bonnot A, Mentis GZ, Skoch J, O'Donovan MJ. Electroporation loading of calcium-sensitive dyes into the CNS. J Neurophysiol. 2005;93:1793–1808. doi: 10.1152/jn.00923.2004. [DOI] [PubMed] [Google Scholar]
- Büttner-Ennerver JA. Overview of the vestibular system: anatomy. In: Beitz AJ, Anderson JH, editors. Neurochemistry of the vestibular system. Vol 1. New York: CRC; 2000. pp. 3–24. [Google Scholar]
- Cambronero F, Puelles L. Rostrocaudal nuclear relationships in the avian medulla oblongata: a fate map with quail chick chimeras. J Comp Neurol. 2000;427:522–545. doi: 10.1002/1096-9861(20001127)427:4<522::aid-cne3>3.0.co;2-y. [DOI] [PubMed] [Google Scholar]
- Cepko C. Retrovirus vectors and their applications in neurobiology. Neuron. 1988;1:345–353. doi: 10.1016/0896-6273(88)90184-5. [DOI] [PubMed] [Google Scholar]
- Clarke JD, Lumsden A. Segmental repetition of neuronal phenotype sets in the chick embryo hindbrain. Development. 1993;118:151–162. doi: 10.1242/dev.118.1.151. [DOI] [PubMed] [Google Scholar]
- Couly GF, Le Douarin NM. Mapping of the early neural primordium in quail-chick chimeras. I. Developmental relationships between placodes, facial ectoderm, and prosencephalon. Dev Biol. 1985;110:422–439. doi: 10.1016/0012-1606(85)90101-0. [DOI] [PubMed] [Google Scholar]
- Díaz C, Glover JC. Comparative aspects of the hodological organization of the vestibular nuclear complex and related neuron populations. Brain Res Bull. 2002;57:307–312. doi: 10.1016/s0361-9230(01)00673-6. [DOI] [PubMed] [Google Scholar]
- Díaz C, Puelles L. Segmentary organisation of the efferents of the vestibular complex in chicken embryos: is this an example of the general case? Rev Neurol. 2002;35:922–930. [PubMed] [Google Scholar]
- Díaz C, Puelles L. Plurisegmental vestibulocerebellar projections and other hindbrain cerebellar afferents in midterm chick embryos: biotinylated dextranamine experiments in vitro. Neuroscience. 2003;117:71–82. doi: 10.1016/s0306-4522(02)00834-5. [DOI] [PubMed] [Google Scholar]
- Díaz C, Puelles L, Marín F, Glover JC. The relationship between rhombomeres and vestibular neuron populations as assessed in quail-chicken chimeras. Dev Biol. 1998;202:14–28. doi: 10.1006/dbio.1998.8986. [DOI] [PubMed] [Google Scholar]
- Díaz C, Glover JC, Puelles L, Bjaalie J. The relationship between hodological and cytoarchitectonic organization in the vestibular complex of the 11-day chicken embryo. J Comp Neurol. 2003;457:87–105. doi: 10.1002/cne.10528. [DOI] [PubMed] [Google Scholar]
- Dymecki SM, Tomasiewicz H. Using Flp-recombinase to characterize expansion of Wnt1-expressing neural progenitors in the mouse. Dev Biol. 1998;201:57–65. doi: 10.1006/dbio.1998.8971. [DOI] [PubMed] [Google Scholar]
- Farago AF, Awatramani RB, Dymecki SM. Assembly of the brainstem cochlear nuclear complex is revealed by intersectional and subtractive genetic fate maps. Neuron. 2006;50:205–218. doi: 10.1016/j.neuron.2006.03.014. [DOI] [PubMed] [Google Scholar]
- Glover JC. Retrograde and anterograde axonal tracing with fluorescent dextrans in the embryonic nervous system. Neurosci Protoc. 1995;30:1–13. [Google Scholar]
- Glover JC. Neuroepithelial “compartments” and the specification of vestibular projections. Prog Brain Res. 2000;124:3–21. doi: 10.1016/S0079-6123(00)24004-1. [DOI] [PubMed] [Google Scholar]
- Glover JC. Correlated patterns of neuron differentiation and Hox gene expression in the hindbrain: a comparative analysis. Brain Res Bull. 2001;55:683–693. doi: 10.1016/s0361-9230(01)00562-7. [DOI] [PubMed] [Google Scholar]
- Glover JC. The development of vestibulo-ocular circuitry in the chicken embryo. J Physiol (Paris) 2003;97:17–25. doi: 10.1016/j.jphysparis.2003.10.003. [DOI] [PubMed] [Google Scholar]
- Glover JC, Petursdottir G. Pathway specificity of reticulospinal and vestibulospinal projections in the 11-day chicken embryo. J Comp Neurol. 1988;270:25–38. doi: 10.1002/cne.902700104. [DOI] [PubMed] [Google Scholar]
- Glover JC, Petursdottir G. Regional specificity of developing reticulospinal, vestibulospinal, and vestibulo-ocular projections in the chicken embryo. J Neurobiol. 1991;22:353–376. doi: 10.1002/neu.480220405. [DOI] [PubMed] [Google Scholar]
- Glover JC, Petursdottir G, Jansen JKS. Fluorescent dextran-amines used as axonal tracers in the nervous system of the chicken embryo. J Neurosci Methods. 1986;18:243–254. doi: 10.1016/0165-0270(86)90011-7. [DOI] [PubMed] [Google Scholar]
- Glover JC, Renaud JS, Rijli F. Retinoic acid and hindbrain patterning. J Neurobiol. 2006;66:705–725. doi: 10.1002/neu.20272. [DOI] [PubMed] [Google Scholar]
- Goldman JE, Zerlin M, Newman S, Zhang L, Gensert J. Fate determination and migration of progenitors in the postnatal mammalian CNS. Dev Neurosci. 1997;19:42–48. doi: 10.1159/000111184. [DOI] [PubMed] [Google Scholar]
- Inoue T, Nakamura S, Osumi N. Fate mapping of the mouse prosencephalic neural plate. Dev Biol. 2000;219:373–383. doi: 10.1006/dbio.2000.9616. [DOI] [PubMed] [Google Scholar]
- Jansen JKS. A note on the development of the vestibulo-ocular pathway in the chicken. Anat Embryol. 1991;184:305–311. doi: 10.1007/BF01673265. [DOI] [PubMed] [Google Scholar]
- Kaufman ME. London: Harcourt Brace; 2002. The atlas of mouse development. [Google Scholar]
- Le Douarin NM, Renaud D, Teillet MA, Le Douarin GH. Cholinergic differentiation of presumptive adrenergic neuroblasts in interspecific chimeras after heterotopic transplantations. Proc Natl Acad Sci USA. 1975;72:728–732. doi: 10.1073/pnas.72.2.728. [DOI] [PMC free article] [PubMed] [Google Scholar]
- Marin F, Puelles L. Morphological fate of rhombomeres in quail/chick chimeras: a segmental analysis of hindbrain nuclei. Eur J Neurosci. 1995;7:1714–1738. doi: 10.1111/j.1460-9568.1995.tb00693.x. [DOI] [PubMed] [Google Scholar]
- Mathis L, Nicolas JF. Clonal organization in the postnatal mouse central nervous system is prefigured in the embryonic neuroepithelium. Dev Dyn. 2000;219:277–281. doi: 10.1002/1097-0177(2000)9999:9999<::aid-dvdy1042>3.3.co;2-c. [DOI] [PubMed] [Google Scholar]
- Mathis L, Nicolas JF. Progressive restriction of cell fates in relation to neuroepithelial cell mingling in the mouse cerebellum. Dev Biol. 2003;258:20–31. doi: 10.1016/s0012-1606(03)00098-8. [DOI] [PubMed] [Google Scholar]
- Mathis L, Nicolas JF. Clonal origin of the mammalian forebrain from widespread oriented mixing of early regionalized neuroepithelium precursors. Dev Biol. 2006;293:53–63. doi: 10.1016/j.ydbio.2005.12.055. [DOI] [PubMed] [Google Scholar]
- Mathis L, Bonnerot C, Puelles L, Nicolas JF. Retrospective clonal analysis of the cerebellum using genetic laacZ/lacZ mouse mosaics. Development. 1997;124:4089–4104. doi: 10.1242/dev.124.20.4089. [DOI] [PubMed] [Google Scholar]
- Miyake T, Fujiwara T, Fukunaga T, Takemura K, Kitamura T. Allocation of mouse cerebellar granule cells derived from embryonic ventricular progenitors–a study using a recombinant retrovirus. Brain Res Dev Brain Res. 1993;74:245–252. doi: 10.1016/0165-3806(93)90010-8. [DOI] [PubMed] [Google Scholar]
- Mombaerts P, Wang F, Dulac C, Chao SK, Nemes A, Mendelsohn M, Edmondson J, Axel R. Visualizing an olfactory sensory map. Cell. 1996;87:675–686. doi: 10.1016/s0092-8674(00)81387-2. [DOI] [PubMed] [Google Scholar]
- Muller M, Jabs N, Lorke DE, Fritzsch B, Sander M. Nkx6.1 controls migration and axon pathfinding of cranial branchio-motoneurons. Development. 2003;130:5815–5826. doi: 10.1242/dev.00815. [DOI] [PubMed] [Google Scholar]
- Murakami Y, Pasqualetti M, Takio Y, Hirano S, Rijli FM, Kuratani S. Segmental development of reticulospinal and branchiomotor neurons in lamprey: insights into the evolution of the vertebrate hindbrain. Development. 2004;131:983–995. doi: 10.1242/dev.00986. [DOI] [PubMed] [Google Scholar]
- Nery S, Fishell G, Corbin JG. The caudal ganglionic eminence is a source of distinct cortical and subcortical cell populations. Nat Neurosci. 2002;5:1279–1287. doi: 10.1038/nn971. [DOI] [PubMed] [Google Scholar]
- Olofsson J, Nolkrantz K, Ryttsen F, Lambie BA, Weber SG, Orwar O. Single-cell electroporation. Curr Opin Biotechnol. 2003;14:29–34. doi: 10.1016/s0958-1669(02)00003-4. [DOI] [PubMed] [Google Scholar]
- Pasqualetti M, Ren SY, Poulet M, LeMeur M, Dierich A, Rijli FM. A Hoxa2 knockin allele that expresses EGFP upon conditional Cre-mediated recombination. Genesis. 2002;32:109–111. [PubMed] [Google Scholar]
- Pattyn A, Vallstedt A, Dias JM, Samad OA, Krumlauf R, Rijli FM, Brunet JF, Ericson J. Coordinated temporal and spatial control of motor neuron and serotonergic neuron generation from a common pool of CNS progenitors. Genes Dev. 2003;17:729–737. doi: 10.1101/gad.255803. [DOI] [PMC free article] [PubMed] [Google Scholar]
- Petursdottir G. Vestibulo-ocular projections in the 11-day chicken embryo: pathway specificity. J Comp Neurol. 1990;297:283–297. doi: 10.1002/cne.902970210. [DOI] [PubMed] [Google Scholar]
- Ren SY, Pasqualetti M, Dierich A, Le Meur M, Rijli FM. A Hoxa2 mutant conditional allele generated by Flp- and Cre-mediated recombination. Genesis. 2002;32:105–108. doi: 10.1002/gene.10052. [DOI] [PubMed] [Google Scholar]
- Rijli FM, Mark M, Lakkaraju S, Dierich A, Dolle P, Chambon P. A homeotic transformation is generated in the rostral branchial region of the head by disruption of Hoxa-2, which acts as a selector gene. Cell. 1993;75:1333–1349. doi: 10.1016/0092-8674(93)90620-6. [DOI] [PubMed] [Google Scholar]
- Sanes JR. Analysing cell lineage with a recombinant retrovirus. Trends Neurosci. 1989;12:21–28. doi: 10.1016/0166-2236(89)90152-5. [DOI] [PubMed] [Google Scholar]
- Sanes JR. Lineage tracing. The latest in lineage. Curr Biol. 1994;4:1162–1164. doi: 10.1016/s0960-9822(00)00264-5. [DOI] [PubMed] [Google Scholar]
- Stenman J, Toresson H, Campbell K. Identification of two distinct progenitor populations in the lateral ganglionic eminence: implications for striatal and olfactory bulb neurogenesis. J Neurosci. 2003;23:167–174. doi: 10.1523/JNEUROSCI.23-01-00167.2003. [DOI] [PMC free article] [PubMed] [Google Scholar]
- Stern CD, Fraser SE. Tracing the lineage of tracing cell lineages. Nat Cell Biol. 2001;9:216–218. doi: 10.1038/ncb0901-e216. [DOI] [PubMed] [Google Scholar]
- Straka H, Baker R, Gilland E. Rhombomeric organization of vestibular pathways in larval frogs. J Comp Neurol. 2001;437:42–55. doi: 10.1002/cne.1268. [DOI] [PubMed] [Google Scholar]
- Suwa H, Gilland E, Baker R. Segmental organization of vestibular and reticular projections to spinal and oculomotor nuclei in the zebrafish and goldfish. Biol Bull. 1996;191:257–259. doi: 10.1086/BBLv191n2p257. [DOI] [PubMed] [Google Scholar]
- Vogt W. Gestaltungsalalyse am Amphibienkeim mitörtlicher VitalfärbungVortwort über Wege und Ziele I. Wilh Roux Arch Entwick Org. 1925;106:542–610. doi: 10.1007/BF02079545. [DOI] [PubMed] [Google Scholar]
- Wichterle H, Turnbull DH, Nery S, Fishell G, Alvarez-Buylla A. In utero fate mapping reveals distinct migratory pathways and fates of neurons born in the mammalian basal forebrain. Development. 2001;128:3759–3771. doi: 10.1242/dev.128.19.3759. [DOI] [PubMed] [Google Scholar]
- Wingate RJ, Lumsden A. Persistence of rhombomeric organisation in the postsegmental hindbrain. Development. 1996;122:2143–2152. doi: 10.1242/dev.122.7.2143. [DOI] [PubMed] [Google Scholar]
- Zinyk DL, Mercer EH, Harris E, Anderson DJ, Joyner AL. Fate mapping of the mouse midbrain-hindbrain constriction using a site-specific recombination system. Curr Biol. 1998;8:665–668. doi: 10.1016/s0960-9822(98)70255-6. [DOI] [PubMed] [Google Scholar]