

Abstract
The molecular mechanisms occurring in the nervous system that underlie behavioral responses to ethanol remain poorly understood. Here, we report that molecular requirements for two of these responses, initial sensitivity and the development of rapid tolerance, comap to the same small set of neurons. We show that null homer mutant flies exhibit both increased sensitivity to the sedative effects of ethanol and failure to develop normal levels of rapid tolerance. Both the sensitivity and rapid tolerance phenotypes of the homer mutants are rescued by the expression of wild-type homer in a subset of neurons that include the ellipsoid body. Thus, some of the molecular- and systems-level requirements for these two behavioral responses to ethanol are identical.
Keywords: homer, Drosophila, ethanol, sensitivity, tolerance, ellipsoid body
Introduction
We have developed an assay system to study sensitivity and tolerance to the sedative effects of ethanol in Drosophila. Using this assay system and microarray experiments, we identified many genes that exhibit changes in gene expression after a single and/or multiple exposures to ethanol vapor. The mRNA levels for one of the genes identified, homer, were found to be depressed after a single or multiple exposures to ethanol, suggesting that ethanol may exert its behavioral effects through regulation of homer expression and/or function.
Drosophila Homer is highly homologous to mammalian Homer1 proteins. It contains an N-terminal Enabled/Vasp homology 1 domain (EVH1) and a C-terminal coiled-coil domain that mediates self-association (Diagana et al., 2002). Through the EVH1 domain, mammalian Homer proteins interact with the group 1 metabotropic glutamate receptors (mGluR1/5) (Tu et al., 1998; Xiao et al., 1998), the inositol-triphosphate receptor (InsP3R) (Tu et al., 1998; Xiao et al., 1998), and the postsynaptic scaffolding protein Shank (Tu et al., 1999), implicating Homer in the regulation and maintenance of synaptic structure and/or plasticity. Drosophila lacking Homer (homerR102) exhibit deficits in behavioral plasticity as assayed by the courtship conditioning paradigm and in the control of locomotor activity (Diagana et al., 2002). In addition, yeast two-hybrid studies have confirmed a direct interaction between Drosophila Homer and Drosophila Shank (Diagana et al., 2002). Interestingly, the Homer1 and Homer2 genes in mammals participate in different neurophysiological and behavioral functions (Szumlinski et al., 2006). Homer2 mutant mice fail to develop place preference or locomotor sensitization to repeated presentations of ethanol and are more sensitive to ethanol sedation (Szumlinski et al., 2003, 2005), whereas Homer1 knock-outs (KOs) exhibit heightened anxiety and impaired sensorimotor processing and working memory because of the likely requirement for Homer1 function in the prefrontal cortex (Lominac et al., 2005; Szumlinski et al., 2006).
To determine whether Homer mediates some of the behavioral adaptations underlying ethanol action in Drosophila, homer null mutant flies (Diagana et al., 2002) were tested for ethanol sensitivity and rapid tolerance. Rapid tolerance is defined as the attenuated response to ethanol that occurs from a single exposure and after elevated blood levels from the initial exposure have returned to near basal levels (Crabbe et al., 1979). Here we report that homerR102 null mutant flies display increased sensitivity to ethanol and fail to develop normal levels of rapid tolerance, both of which are rescued by pan-neuronal expression of wild-type homer. We also show rescue of these homer phenotypes by expression of wild-type homer in a subset of neurons of the ellipsoid body, a neural structure that makes up part of the central complex, a series of neuropil structures implicated in the control of locomotor activity from genetic manipulation experiments (Strauss et al., 1992; Strauss and Heisenberg, 1993; Martin et al., 1999). These studies establish Drosophila Homer as an important mediator of ethanol action and identify the neuronal networks in the ellipsoid body as essential for the expression of normal ethanol sensitivity and tolerance.
Materials and Methods
Drosophila strains and genetics. The homerR102 mutant and P{UAS-homer-myc} transgenic flies were obtained from J. B. Thomas (The Salk Institute for Biological Studies, San Diego, CA). Flies were maintained on a 12 h dark/light cycle on standard Drosophila medium at 25°C and 60% relative humidity. The white-eyed Canton S (CS) line, w(CS10), was used as the wild-type control in all experiments. All mutant, P{GAL4}, and P{UAS} transgenic lines were outcrossed to the w(CS10) control line for six generations to normalize the genetic background. Male flies of 2–5 d of age were used for all experiments.
Sensitivity and tolerance assays.
We developed a new and simple test apparatus that allows us to expose Drosophila to constant ethanol vapor at controlled concentrations and measure sensitivity, rapid, and chronic tolerance. This apparatus consists of a circular Plexiglas manifold that distributes pressurized ethanol vapor to eight empty clear plastic fly vials arranged around its circumference. Flies are placed in the empty fly vials, and ethanol vapor is passed through the vials. The behavior of the flies is easily scored through the walls of the vials by an observer.
Flies were collected and placed in vials containing fresh food (30 flies per vial) for 24 h before behavioral testing. They were then transferred to the empty plastic vials of the test apparatus and exposed to humidified air (30 ml/min) for 30 min before testing. Flies were subsequently exposed to a stream of ethanol vapor (56% unless noted) at a flow of 160 ml/min for 50 min to test for ethanol sensitivity. The ethanol vapor was produced by bubbling fresh air through an ethanol solution and mixing the vapor with a stream of humidified air. The % ethanol refers to the percentage of the final air/ethanol stream made up of the air bubbled through ethanol. The percentage of flies sedated in each vial of the test apparatus was recorded at 5 min intervals. A fly was counted as being sedated if it was motionless and had fallen onto its back or side.
For the standard assay of rapid tolerance, flies were exposed to a stream of high-concentration ethanol vapor (50–70%) at a flow rate of 130 ml/min for 40 min. At the end of this treatment, the percentage of flies sedated in each vial was recorded. Flies were then allowed to recover for 80 min in the presence of 10% ethanol vapor at a reduced flow rate of 30 ml/min in vials with food. To test for the development of rapid ethanol tolerance, flies were re-exposed to a stream of high-concentration ethanol vapor, and the percentage of flies sedated in each vial at the end of the 40 min treatment was recorded. Chronic tolerance assays were simple extensions of the rapid tolerance assays. For chronic tolerance, the flies received three additional exposures of concentrated ethanol vapor with a recovery period of 80 min between each exposure in the presence of 10% ethanol in vials with food. After a total of five sequential exposures, flies were rested overnight in the presence of 10% ethanol vapor in vials with food. They were tested at 24 h after the first exposure by challenging them with a 40 min presentation of high-concentration ethanol. The ethanol concentration used for different experiments varied, as indicated in the text and figure legends, but was normally between 50 and 70%.
Microarray experiments.
For each microarray hybridization, total RNA from the heads of 60 flies was used. Seventeen independent whole genome microarray hybridizations were performed. Five sets of flies received humidified air at 30 ml/min for 50 min (naive group). Six sets received humidified air for 50 min, followed by a single exposure of 50% ethanol vapor for 40 min, and were allowed to recover for 80 min in 10% ethanol vapor (30 ml/min) in vials with food before receiving a second exposure of humidified air for 40 min (rapid tolerance group). Six sets received humidified air for 50 min, followed by five exposures of 50% ethanol vapor for 40 min with 80 min of humidified air plus 10% ethanol in vials with food between each exposure to 50% ethanol vapor; after the fifth treatment, flies were allowed to recover overnight in 10% ethanol vapor in vials with food before being exposed to humidified air for 40 min at exactly 24 h after the initial treatment (chronic tolerance group). For all groups, flies were collected and frozen in liquid nitrogen immediately after the last treatment. Fly heads were separated from bodies and were used for RNA extraction.
For each set of flies, total RNA was isolated from heads using the Qiagen (Chatsworth, CA) RNAeasy kit. RNA (5 μg from each set of flies) was processed using standard Affymetrix (Santa Clara, CA) protocols (GeneChip Expression Analysis Technical Manual, 2001). Biotinylated cRNA was synthesized in vitro from the double-stranded cDNA using the ENZO BioArray High Yield RNA Transcript Labeling kit (ENZO Diagnostics, Farmingdale, NY). Yields of labeled RNA from whole heads were high, and 15 μg of fragmented, biotinylated cRNA was mixed into 300 μl of a hybridization mixture, of which 200 μl was used for each hybridization experiment. Hybridization was for 17 h at 42°C. Washing, staining, and scanning were performed according to standard protocols.
The intensity signals obtained from the microarray chips stored in CEL files were extracted and normalized by the DNA-Chip Analyzer (dChip) program (Li and Wong, 2001). The RNA expression levels of each probe set were calculated as model-based expression indexes (MBEI) by the dChip program and exported to the R program (Ihaka and Gentleman, 1996) for one-way ANOVA analyses. These results were exported to Microsoft (Redmond, WA) Excel for additional analyses such as sorting and filtering. The fold change was calculated by dividing the average MBEI for each gene in each ethanol-treated population with the corresponding average MBEI in the naive animal population.
Ethanol absorption and metabolism.
To study ethanol absorption, flies were exposed to 56% ethanol vapor at a 160 ml/min flow rate for 0, 20, or 40 min. Immediately after exposure, flies were frozen in liquid nitrogen and homogenized in 300 μl of 50 mm Tris-HCl, pH 7.5. The homogenate was then centrifuged at 15,000 × g at 4°C for 20 min, and the supernatant was collected. The ethanol concentration in the supernatant was measured using the Ethanol ASSAY (Diagnostic Chemicals, Oxford, CT). To determine whether equivalent amounts of flies were assayed for each genotype, the protein concentration in the fly extracts was measured using the Protein Assay Dye Reagent Concentrate (Bio-Rad, Hercules, CA). Ethanol metabolism in flies was studied by exposing flies to 56% ethanol vapor for 40 min and allowing flies to recover for 0, 20, 40, or 80 min. The ethanol concentration in fly extracts was measured at the end of each recovery period, and ethanol concentrations were determined.
Immunofluorescence.
Immunofluorescence analysis of Homer expression in Drosophila head sections was performed as described previously (Diagana et al., 2002). Drosophila Homer was stained with a rat anti-Homer primary antibody (a kind gift from U. Thomas, Leibniz Institute for Neurobiology, Magdeburg, Germany) and the Alexa Fluor 488 goat anti-rat secondary antibody (Invitrogen, Eugene, OR). The dilutions for rat anti-Homer and Alexa 488 goat anti-rat antibodies were 1:1000 and 1:200, respectively. For confocal studies, Drosophila brains were dissected and stained with rat anti-Homer. This was followed by incubation with the Alexa Fluor 488 goat anti-rat secondary antibody. The brain samples were then mounted in Vectashield. The dilutions for rat anti-Homer and Alexa 488 goat anti-rat antibodies were 1:1000 and 1:500, respectively. All images presented are z-projections generated by ImageJ of 30 serial sections through the brain.
Rescue experiments.
For rescue experiments, P{UAS-homer-myc} and P{GAL4} transgenic lines were crossed into the homerR102 mutant background to generate homerR102,P{UAS-homer-myc}/homerR10 2 flies also carrying a GAL4 element. Flies were genotyped for the homerR102 deletion by PCR using the following primers: dH-F2, 5′-CATGTAGGCGCACAACTAGACAGTC-3′; and dH-R1, 5′-GCCTTGAGCCAATGACGGTCAACGC-3′. For rescue experiments, male flies were F1 progeny of a genetic cross [e.g., homerR102 flies carrying a P{GAL4} driver were crossed to homerR102;P{UAS-homer-myc} flies].
Data analysis.
Sedation data for Figure 1 A were analyzed by an ANOVA with repeated measures, followed by a Bonferroni post hoc test. For all other sensitivity assay experiments, a logarithmic function that best fit the sedation data was created using Microsoft Excel, where y is time (minutes) and x is the percentage sedated. From this function, the time at which 50% of the flies were sedated (T50%) was calculated for each genotype. For each of the experiments, the T50% for each genotype was analyzed by one-factor ANOVA, followed by Bonferroni post hoc tests. For the tolerance experiments, the sedation data were analyzed by a t test or an ANOVA, followed by Bonferroni post hoc tests. All experiments included an n ≥ 4, where each n is the mean ± SEM of the percentage of flies sedated among two or four vials of one test apparatus within an experiment. As described above, the test apparatus holds eight vials. Therefore, for experiments in which only two genotypes were being analyzed, each n is the mean of four vials attached to the test apparatus. For experiments in which three to four genotypes were being analyzed, each n is the mean of two vials attached to the test apparatus.
Figure 1.
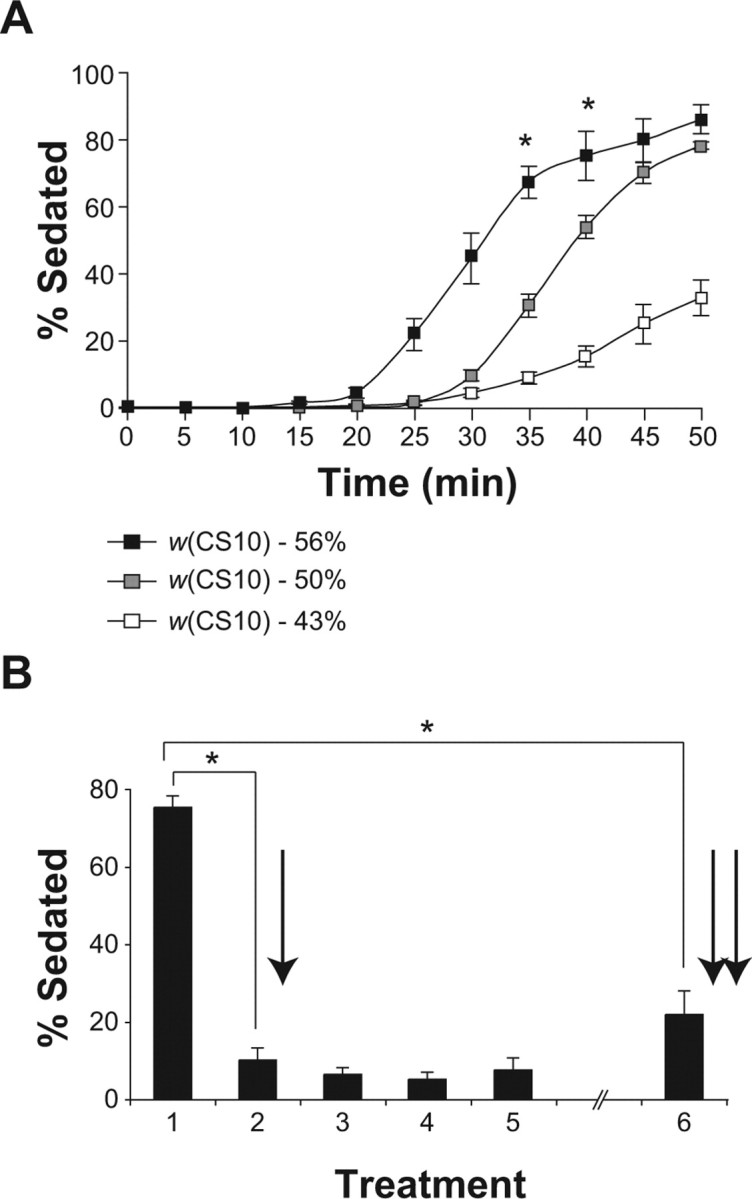
Sensitivity and tolerance to the sedative effects of ethanol. A, The ethanol sensitivity of w(CS10) male flies is dose dependent. Sensitivity to ethanol was measured at three increasing concentrations of ethanol vapor (43, 50, and 56%). The percentage of flies sedated was recorded at 5 min intervals and plotted as a function of time. Time points significantly different between the three groups after repeated-measures ANOVA and post hoc Bonferroni/Dunn comparisons are indicated by an asterisk (n = 4; *p < 0.0167). B, Flies developed both rapid and chronic ethanol tolerance. The CS male flies received five treatments (40 min each) of concentrated ethanol vapor (50%) on day 1. Between treatments and after the last treatment on day 1, flies were allowed to recover in the presence of 10% ethanol vapor in vials with food. To test for chronic ethanol tolerance, flies received a 40 min treatment 24 h after the initial treatment. The percentage of sedation on the second treatment compared with the first treatment was used as a measure of rapid ethanol tolerance. The percentage of sedation on the sixth treatment compared with the first treatment was used as a measure of chronic ethanol tolerance. The percentage of sedation on the second and sixth treatments was significantly different from the first as measured by a one-factor ANOVA and post hoc Bonferroni/Dunn comparisons (n = 4; *p < 0.0001). Error bars indicate SEM.
Microarray data.
The complete microarray dataset from experiments presented here can be found at http://www.ncbi.nlm.nih.gov/projects/geo/ using the accession number GSE4531.
Results
Ethanol sensitivity and tolerance in Drosophila
We first developed a simple apparatus that allows us to expose Drosophila to a constant stream of ethanol vapor at controlled concentrations. Using this apparatus, we established three independent assays to study sensitivity and tolerance to the sedative effects of ethanol. For the ethanol sensitivity assay, flies contained in empty plastic vials were exposed to ethanol vapor for 50 min, and the percentage of flies sedated was recorded at 5 min intervals. Using this assay, we measured the ethanol sensitivity of w(CS10) flies at three ethanol concentrations (Fig. 1 A). At all ethanol concentrations tested, the percentage of flies sedated continued to increase with time immediately after the onset of sedation. The sensitivity to ethanol was dose dependent.
Previous studies have shown that flies develop rapid and chronic tolerance to the intoxicating effects of ethanol after one or several treatments of ethanol vapor, respectively, and that this tolerance is not caused by changes in ethanol absorption or metabolism (Scholz et al., 2000; Berger et al., 2004). To assay rapid tolerance, flies were exposed to ethanol vapor for 40 min and allowed to recover for 80 min in the presence of 10% ethanol vapor and food. Flies were then re-exposed to ethanol vapor for 40 min, and their sedation quantified. When tested in this assay, CS flies developed rapid tolerance to the sedative effects of ethanol. The percentage of flies sedated at the end of the second treatment (∼10%) was significantly less than the percentage of flies sedated at the end of the first treatment (∼70%) (Fig. 1 B, single arrow).
In our experiments, flies were allowed to recover in the presence of 10% ethanol vapor in food vials. We found that ethanol levels fall close to basal levels with a recovery period of 80 min in 10% ethanol vapor in a vial with food after an acute exposure (supplemental Fig. 1B, available at www.jneurosci.org as supplemental material). However, rapid tolerance develops, as illustrated in Figure 1 B, even when flies are rested for 80 min in the presence of humidified air (data not shown).
In flies, extended treatment with concentrated bouts of ethanol vapor interspersed with low levels produces chronic tolerance. We treated flies with five 40 min treatments of ethanol on day 1, each followed by an 80 min recovery period. After the fifth treatment, the flies were allowed to recover overnight. To test for the development of chronic ethanol tolerance, the flies were then re-exposed to ethanol vapor 24 h after the initial exposure. The percentage of flies sedated at the end of the last treatment was then compared with the percentage of flies sedated at the end of the initial treatment. A large decrease in the percentage of flies sedated at 24 h compared with the percentage of flies sedated by the initial treatment indicates the development of chronic tolerance. We found that CS flies developed chronic ethanol tolerance using this assay (Fig. 1 B, double arrow).
Using the data from Figure 1 B, we next calculated the decrease in the percentage of flies sedated between the first and second ethanol treatment and between the first and sixth treatment. Thus, for CS male flies, 87 ± 4% of the flies that were sedated during the first treatment were not sedated during the second treatment, and 72 ± 7% of the flies sedated during the first treatment were not sedated during the sixth treatment (Fig. 1 B). We define the change in the percentage of flies sedated between the first and second treatments as rapid tolerance and between the first and sixth treatment as chronic tolerance. Rapid and chronic tolerance are quantified and presented graphically in this way in subsequent figures (Fig. 2 B).
Figure 2.
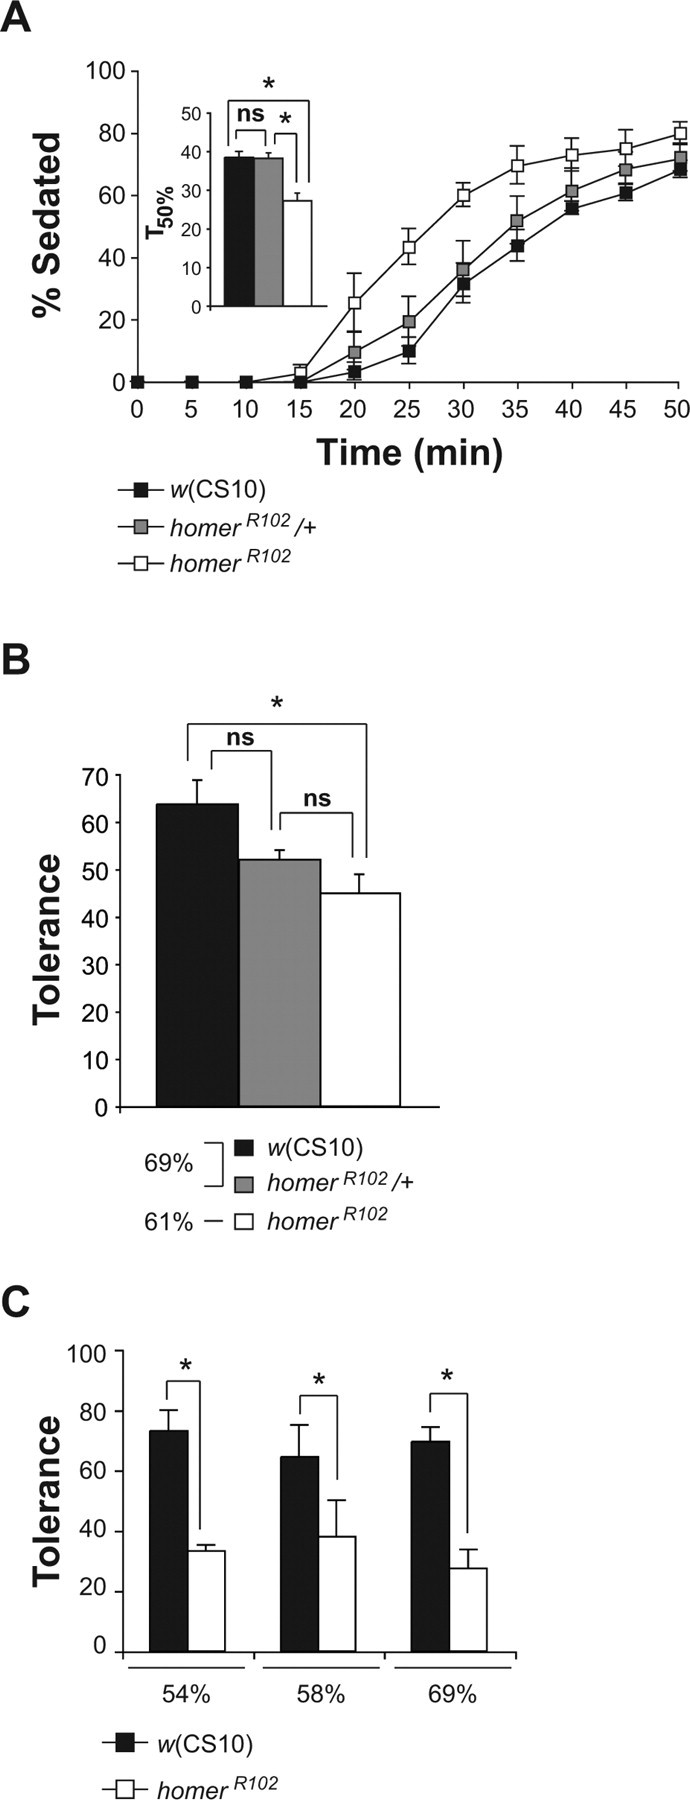
Increased ethanol sensitivity and impaired rapid tolerance of homerR102 mutant flies. A, The homerR102 mutants exhibited increased and recessive sensitivity to the sedative effects of ethanol vapor. Using a best-fit function, the time at which 50% of the flies were sedated (T50%) using 56% ethanol vapor was calculated for each of the genotypes. The T50% of the homerR102 flies was significantly different from the T50% of the w(CS10) and homerR102/+ flies as measured by a one-factor ANOVA, followed by post hoc analysis using the Bonferroni/Dunn test (n = 4; *p < 0.0167). B, The homerR102 mutants developed significantly less rapid ethanol tolerance than control w(CS10) flies, whereas the homerR102/+ flies developed rapid tolerance that was not significantly different from either the w(CS10) or the homerR102 flies. Because flies of the different genotypes exhibited differences in sensitivity, the w(CS10) and homerR102/+ flies were exposed to a higher ethanol vapor concentration than homerR102 flies so that the initial percentage of sedation would be normalized among groups. The w(CS10) flies showed a 64% decrease in the number of flies sedated during the second treatment, whereas the homerR102 flies showed a 45% decrease. The asterisk indicates significant differences as determined by a one-factor ANOVA, followed by post hoc analysis with the Bonferroni/Dunn test (n = 5, *p < 0.0167). C, The impairment of rapid tolerance is independent of the ethanol vapor concentration used to induce rapid tolerance. At three ethanol concentrations tested, the percentage of flies sedated at the end of the second exposure was significantly less than the percentage of flies sedated at the end of the first exposure for both genotypes. At each of the concentrations used to induce rapid tolerance, the w(CS10) control flies exhibited a 70% decrease in the percentage of flies sedated during the second ethanol exposure, whereas the homerR102 mutant flies displayed only a 30% decrease with significance determined by t tests (n = 4; *p < 0.01). Error bars indicate SEM. ns, Not significant.
Microarray experiments identify adaptive changes in gene expression with ethanol exposure
Using microarray experiments, we identified many genes that exhibit a change in expression in the heads of flies in response to a single and/or several treatments of ethanol. For this experiment, mRNA from the heads of 2- to 5-d-old CS flies was isolated from naive flies and from flies that received either one or five treatment(s) of ethanol vapor (50%). To ensure that the mRNA was extracted at a time when the flies are known to display rapid tolerance, flies that received one treatment of ethanol vapor were collected after a recovery period of 120 min (Fig. 1 B, single arrow). Similarly, flies that received five treatments of ethanol were allowed to recover overnight and were collected at a time when flies are known to display chronic tolerance (Fig. 1 B, double arrow). The mRNA was extracted separately from each group of flies and used to generate probes for hybridization to 17 independent Affymetrix Drosophila genomic oligonucleotide microarrays. Using the R statistical program to perform one-way ANOVA, 647 of 14,000 genes were identified as exhibiting significant changes in mRNA expression at a p value of <0.001 (supplemental Table 1, available at www.jneurosci.org as supplemental material). Of the 647 genes, 26% exhibited changes in response to the single treatment with ethanol but not to the chronic treatment (series of five treatments) with ethanol, indicating that the mRNA levels of these genes returned to basal levels after their initial upregulation or downregulation (Table 1). The mRNA level of 29% of the 647 genes changed only in response to chronic treatment with ethanol, indicating that there are specific changes in gene expression that occurred from prolonged exposure to ethanol but not from one treatment of ethanol. Alternatively, it is possible that some of these genes were altered by one exposure but that their response was delayed relative to the exposure. Genes that follow the other four possible patterns of alteration were also detected, including those that were increased in both the rapid and chronic treatment groups, decreased in both groups, or showed opposite patterns between these two treatment groups.
Table 1.
Microarray results
| Category | Number of genes |
|---|---|
| Rapid (↑) | 106 |
| Chronic (↑) | 82 |
| Rapid (↓) | 65 |
| Chronic (↓) | 105 |
| Rapid (↓) chronic (↓) | 94 |
| Rapid (↑) chronic (↑) | 78 |
| Rapid (↑) chronic (↓) | 60 |
| Rapid (↓) chronic (↑) | 57 |
One hundred fifty-three of the 647 genes that exhibited significant changes in response to one or chronic ethanol treatment have a known biological function. The remaining genes have only CG identifiers with the biological function of some of these genes deduced from sequence homology with other genes. The 647 genes encode several different categories of proteins, including transcription factors, signaling proteins, RNA-binding proteins, and metabolic enzymes, suggesting that ethanol exposure produces a broad and perhaps coordinated response in gene expression. There were several gene families present prominently in the gene list of the 647 ethanol-responsive genes. For instance, the expression of 12 glutathione transferase genes and 16 cytochrome P450 genes changed in response to ethanol treatment. The expression of most of these genes was elevated after one treatment of ethanol. These two families of genes have been reported to be closely involved in the metabolism of ethanol in mammals (McKillop and Schrum, 2005). Our microarray data suggest that specific forms of these detoxifying enzymes are deployed robustly after ethanol exposure. Many structural proteins, such as the actins and myosins, tended to decrease in expression with ethanol treatment.
Increased ethanol sensitivity and decreased ethanol tolerance in homerR102 mutants
One of the genes with altered expression that piqued our interest was homer. We observed a 17 and 24% decrease in homer mRNA expression in response to a single or multiple ethanol exposures, respectively. Although these decreases were modest, they were significant and highly reproducible. Because our goal was to define genes that are functionally involved in ethanol-related behaviors, we opted to examine the behavioral responses of homer mutants, rather than to spend time validating the changes in expression level using additional assays of the many candidate genes identified by the microarray experiments. We focused on testing the sensitivity and rapid tolerance of homer mutant flies (homerR102). For sensitivity tests, w(CS10) and homerR102 mutant male flies were exposed to ethanol vapor (56%) for 50 min; the mean onset of sedation for the homerR102 mutant flies occurred ∼5 min earlier than the mean onset of sedation for control flies, and a larger fraction of homer mutant flies compared with control flies were sedated at each subsequent time point (Fig. 2 A). Thus, homer mutants displayed a significant increase in ethanol sensitivity compared with w(CS10) control flies, indicating that homer gene function is probably required for establishing normal sensitivity levels. The sensitivity of males heterozygous for the homerR102 deletion was also tested. The homerR102 heterozygous flies displayed ethanol sensitivity that was indistinguishable from w(CS10) control flies (Fig. 2 A), demonstrating that the homerR102 ethanol sensitivity phenotype is recessive.
We next examined the ability of homerR102 mutant flies to develop rapid ethanol tolerance to the sedative effects of ethanol. The homerR102 mutant and w(CS10) male flies were exposed to constant ethanol vapor for 40 min and allowed to recover for 80 min. To compare tolerance between genotypes, homerR102 mutant flies received a lower concentration of ethanol vapor (61% vs 69%), so that the initial percentage of sedation of homerR102 mutant flies was indistinguishable from that of w(CS10) control flies. To test for the development of rapid ethanol tolerance, flies were then re-exposed after recovery to the same initial concentration of ethanol vapor for 40 min. When compared with the control w(CS10) male flies, homerR102 mutant male flies developed significantly less ethanol tolerance (Fig. 2 B). Whereas only 45% of homerR102 flies developed rapid tolerance, 64% of w(CS10) flies developed rapid tolerance. Thus, deletion of the homer gene results in a defect in the development of rapid ethanol tolerance. Flies heterozygous for the homerR102 deletion were also tested for the development of ethanol tolerance. The homerR102 heterozygous males displayed ethanol tolerance that was intermediate between the w(CS10) and the homerR102 flies (Fig. 2 B).
To confirm and extend these results, we compared the rapid tolerance developed by homerR102 and w(CS10) flies at three increasing ethanol vapor concentrations. Although both genotypes developed rapid tolerance at each of the concentrations tested (Fig. 2 C), the homerR102 mutant flies failed to develop the same level of tolerance as the control flies. Thus, the tolerance phenotype observed in Figure 2 B is not attributable to the lower concentration of ethanol vapor used to produce the initial sedation of the homerR102 flies.
Ethanol absorption and metabolism in homerR102 mutants
One possible explanation for the altered ethanol sensitivity and rapid tolerance phenotypes observed for the homer mutant is a defect in ethanol absorption and/or metabolism in the mutant flies. To determine whether the homer deletion alters ethanol absorption, the ethanol concentration in fly extracts prepared from homerR102 and w(CS10) flies exposed to constant ethanol vapor (56%) for 0, 20, or 40 min was measured. The ethanol concentration in extracts of homerR102 flies was indistinguishable from that of w(CS10) control flies at all time points during the initial exposure (supplemental Fig. 1A, available at www.jneurosci.org as supplemental material), indicating that the homer deletion does not alter ethanol absorption. Next, we tested whether the homer deletion alters ethanol metabolism. The w(CS10) control and homerR102 mutant flies were exposed to constant ethanol vapor (56%) for 40 min and allowed to recover for 20, 40, or 80 min. The ethanol concentration of homerR102 mutant and w(CS10) flies was not significantly different at the 20 and 40 min time points (supplemental Fig. 1B, available at www.jneurosci.org as supplemental material). The ethanol concentration of the w(CS10) flies was significantly higher than the homerR102 flies at the 80 min time point; however, these results cannot explain the increased ethanol sensitivity of the homerR102 flies. In addition, we tested whether one exposure to ethanol vapor alters the ethanol absorption during a second exposure, using the same treatment schedule used for assaying rapid tolerance. Previous treatment with ethanol also failed to uncover a difference between the homer mutants and controls in adsorption of ethanol (supplemental Fig. 1C, available at www.jneurosci.org as supplemental material) at the 40 min time point when rapid ethanol tolerance is measured. Thus, the homerR102 ethanol-related phenotypes are difficult to explain by inherent or ethanol-induced differences in ethanol absorption and/or metabolism between homer mutants and normal controls. This conclusion is reinforced by the mapping of the requirement for Homer activity to a specific set of neurons in the brain (see below).
Rescue of ethanol sensitivity and rapid tolerance phenotypes with pan-neuronal expression of Homer
To determine whether the absence of homer expression in the nervous system is responsible for the ethanol sensitivity and tolerance phenotypes observed in the homerR102 mutant flies, we used the GAL4-UAS system to drive wild-type homer expression in the nervous system of homer mutant flies. Because homer is expressed in the central and peripheral nervous systems, we first used the pan-neuronal c155-GAL4 driver line to express homer in all neurons. The homerR102 mutant flies carrying the c155-GAL4 driver and a P{UAS-homer-myc} transgene were generated and tested for both ethanol sensitivity and rapid tolerance. Pan-neuronal expression of wild-type homer restored the ethanol sensitivity of homerR102 flies to w(CS10) control levels (Fig. 3 A). The T50% of the w(CS10) flies was not significantly different from the T50% of the c155-GAL4;homerR102,P{UAS-homer-myc}/homerR102 flies. Neither the c155-GAL4 driver (Fig. 3 B) nor the P{UAS-homer-myc} transgene alone (Fig. 3 C) altered the ethanol sensitivity of homerR102 mutant flies, indicating that the rescue required the presence of both the driver and UAS-homer. Thus, expression of wild-type homer in the nervous system is sufficient for conferring normal ethanol sensitivity to Drosophila. Additionally, pan-neuronal expression of wild-type homer in the homerR102 mutant flies rescued the rapid tolerance phenotype to levels observed in w(CS10) flies (Fig. 3 D). To compare ethanol tolerance between genotypes, flies received ethanol vapor concentrations that yielded an initial sedation of 80%. Thus, c155-GAL4;homerR102 and homerR102,P{UAS-homer-myc}/homerR102 flies were exposed to a lower concentration of ethanol vapor than w(CS10) and c155-GAL4;homerR102,P{UAS-homer-myc}/homerR102 flies. Neither the c155-GAL4 driver (Fig. 3 D) nor the P{UAS-homer-myc} transgene alone altered the ethanol tolerance of the homerR102 mutant flies. Rescue of the rapid tolerance phenotype was not dependent on the concentration of ethanol used to induce rapid tolerance. At two different ethanol concentrations, pan-neuronal expression of the P{UAS-homer-myc} transgene with the c155-GAL4 driver rescued the rapid tolerance phenotype of the homerR102 flies (Fig. 3 E,F). The rescue of the behavioral phenotypes in response to ethanol administration by pan-neuronal expression of homer proves that deletion of homer is responsible for the homerR102 behavioral phenotypes and that Homer regulates both ethanol sensitivity and rapid tolerance by acting within the nervous system.
Figure 3.

Rescue of homerR102 ethanol sensitivity and rapid tolerance phenotypes by pan-neuronal expression of wild-type Homer. A, Pan-neuronal expression of P{UAS-homer-myc} by the c155-GAL4 driver rescued the homerR102 ethanol sensitivity phenotype to w(CS10) control levels. The T50% was calculated for each of the geneotypes. The T50% of the homerR102 flies was significantly different from the T50% of the w(CS10) and c155-GAL4;homerR102,P{UAS-homer-myc}/homerR102 flies as measured by a one-factor ANOVA and post hoc Bonferroni/Dunn comparisons (n = 6; *p < 0.0167). B, Mutant homerR102 flies carrying the c155-GAL4 driver alone showed ethanol sensitivity indistinguishable from homerR102 mutant flies. The T50% of the homerR102 flies was not significantly different from the T50% of the c155-GAL4 flies as measured by a one-factor ANOVA and post hoc Bonferroni comparisons (n = 6; *p < 0.0167). C, Mutant homerR102 flies carrying the UAS-homer transgene alone showed ethanol sensitivity indistinguishable from homerR102 mutant flies. The T50% of the homerR102 flies was not significantly different from the T50% of the UAS-homer flies as measured by a one-factor ANOVA and post hoc Bonferroni comparisons (n = 5; *p < 0.0167). D, Pan-neuronal expression of P{UAS-homer-myc} by the c155-GAL4 driver rescued the homerR102 rapid tolerance phenotype. Because flies with the different genotypes exhibited differences in sensitivity, the ethanol vapor concentration was adjusted to achieve 80% percentage sedation on the first treatment to normalize among groups. The asterisk indicates significant differences as determined by one-factor ANOVA and post hoc Bonferroni/Dunn comparisons (n = 5; *p < 0.0083). E, F, The rescue of the homerR102 rapid tolerance phenotype by pan-neuronal expression of P{UAS-homer-myc} was independent of the ethanol vapor concentration used to induce rapid tolerance. Asterisks indicate significant differences as determined by a one-factor ANOVA and post hoc Bonferroni/Dunn comparisons (n = 4; *p < 0.0083). Error bars indicate SEM. ns, Not significant.
To determine whether increased expression of Homer in the nervous system alters ethanol-induced behaviors, c155-GAL4; P{UAS-homer-myc} flies were also tested for ethanol sensitivity and rapid tolerance. The overexpression of Homer in the nervous system did not alter ethanol sensitivity (Fig. 4 A) nor did it significantly alter rapid ethanol tolerance (Fig. 4 C). Neither the c155-GAL4 driver nor the P{UAS-homer-myc} transgene alone altered the ethanol sensitivity (Fig. 4 B) or the development of rapid tolerance (Fig. 4 D) of w(CS10) flies.
Figure 4.

Flies overexpressing Homer develop normal sensitivity and rapid ethanol tolerance. A, The ethanol sensitivity of w(CS10) flies carrying the pan-neuronal driver c155-GAL4 and the P{UAS-homer-myc} transgene was not significantly different from w(CS10) flies. The T50% of the c155-GAL4;P{UAS-homer-myc} flies was not significantly different from the T50% of the w(CS10) flies but was significantly different from the T50% of the homerR102 flies, as measured by one-factor ANOVA and post hoc Bonferroni/Dunn comparisons (n = 4; *p < 0.0167). B, The ethanol sensitivity of w(CS10) flies carrying the c155-GAL4 driver or the P{UAS-homer-myc) transgene alone was not significantly different from the w(CS10) flies. No significant differences were observed between the T50% of the w(CS10), c155-GAL4, and P{UAS-homer-myc} flies as determined by a one-factor ANOVA and Bonferroni/Dunn comparisons (n = 4). C, The w(CS10) flies carrying the pan-neuronal driver c155-GAL4 and the P{UAS-homer-myc} transgene displayed intermediate rapid tolerance compared with w(CS10) and homerR102 control flies. The asterisk indicates significant differences as determined by a one-factor ANOVA and post hoc Bonferroni/Dunn comparisons (n = 5; *p = 0.0167). D, No significant differences in the development of rapid tolerance were observed between the w(CS10), c155-GAL4, and P{UAS-homer-myc} flies as determined by a one-factor ANOVA and post hoc Bonferroni/Dunn comparisons (n = 4). Error bars indicate SEM. ns, Not significant.
Homer expression in the Drosophila adult brain
Previous studies have reported that homer is expressed throughout the peripheral and central nervous systems of Drosophila (Diagana et al., 2002). To characterize the expression pattern of Homer in the adult brain, we examined its expression by immunofluorescence on frozen sections using a primary antibody against the N terminus of Homer. In frontal brain sections, a moderate level of staining was apparent in most neuropil areas (Fig. 5 A), including the ellipsoid body and fan-shaped body of the central complex (Fig. 5 E) and the antennal lobes (Fig. 5 F). This staining was specific to the homer gene product because no staining was observed in sections from homerR102 flies (Fig. 5 B,D). The most intense staining was observed in the optic lobes and protocerebral bridge of the central complex (Fig. 5 C). The level of staining approached background levels in the calyces, peduncles, and lobes of the mushroom bodies (Fig. 5 A,C and data not shown). Therefore, homer is broadly expressed in the adult brain with an interesting and conspicuous reduction or absence in the mushroom bodies. It remains unknown from these experiments whether the Homer protein is localized postsynaptically within neurons or whether there exists a broader subcellular distribution pattern.
Figure 5.

A–F, Expression of Homer in Drosophila adult brain. Immunofluorescence staining using an anti-Homer antibody on frozen head sections of w(CS10) (A, C, E, F) and homerR102 (B, D) is shown. A, Drosophila Homer was expressed in the optic lobes (OL) and most central brain neuropil but not at detectable levels in the peduncles (P) of the mushroom bodies. C, Intense staining was observed in the protocerebral bridge (PB). Ca, Calyx. E, Magnified view of A. Staining in the central complex included the ellipsoid body (EB) and fan-shaped body (FB). F, Staining was also observed in the antennal lobes (AL). The failure to observe staining in homerR102 sections B and D at levels approximating those shown in A and C provide evidence for the specificity of the antisera.
Expression of homer in the ellipsoid body rescues the ethanol sensitivity and rapid tolerance phenotypes of homerR102 mutants
To map the brain regions that require homer expression for normal ethanol sensitivity and rapid tolerance, GAL4 enhancer trap lines with limited spatial expression in the brain were selected for rescue experiments. P{GAL4} drivers were placed in the homerR102 mutant background and crossed to homerR102,P{UAS-homer-myc}/homerR102 flies. The ethanol sensitivity of male progeny from these crosses was then tested. Of the 16 P{GAL4} lines tested for rescue of homerR102 mutant flies, 10 displayed indistinguishable ethanol sensitivity from the homerR102 mutant flies (data not shown). These included lines with expression in the antennal lobes (c522), median bundle (c522), mushroom bodies (121Y, 247, 103Y, c522), optic lobes (c107), suboesophageal ganglion (c522), the pars intercerebralis (dilp2, 121Y), and the central complex (121Y, 078Y, c232, c105, c522, c107, 103Y, c481) (Table 2). An additional three lines (189Y, c481, c302) showed altered ethanol sensitivity in the absence of the P{UAS-homer-myc} transgene (data not shown). Most importantly, however, the P{GAL4} driver line c819-GAL4, which has been reported to drive expression specifically in the R2 and R4m Ring neurons of the ellipsoid body (Renn et al., 1999), showed significant rescue of the ethanol sensitivity phenotype (Table 2; Fig. 6 A). The rescue of the homerR102 ethanol sensitivity required the presence of both the c819-GAL4 driver and the P{UAS-homer-myc} transgenes, because homerR102;c819-GAL4/+ flies displayed similar ethanol sensitivity to the homerR102 flies (Fig. 6 B).
Table 2.
GAL4 lines used to drive UAS-homer expression
| Brain region | GAL4 line |
|---|---|
| GAL4 drivers that did not rescue the homerR102 ethanol phenotypes | |
| Antennal lobes | c522 |
| Central complex | |
| Ellipsoid body | c232,c105,c522,078Y,c107,c481 |
| Fan-shaped body | 121y,103y,c522 |
| Median bundle | c522 |
| Mushroom bodies | 121y,247,103y,c522 |
| Optic lobes | c107 |
| Suboesophageal ganglion | c522 |
| Dorsal giant interneuron | c107 |
| Pars intercerebralis | dilp2, 121y |
| GAL4 drivers that rescued the homerR102 ethanol phenotypes | |
| Central complex | |
| Ellipsoid body | c819 |
| Pan-neuronal | c155 |
Figure 6.

Spatially restricted expression of Homer in the brain with c819-GAL4 rescued sensitivity and rapid tolerance. A, Expression of P{UAS-homer-myc} with the c819-GAL4 driver rescued the homerR102 ethanol sensitivity phenotype. The T50% of the homerR102 flies was significantly different from the T50% of the w(CS10) and homerR102,P{UAS-homer-myc}/homerR102;c819-GAL4 flies as measured by a one-factor ANOVA and post hoc Bonferroni/Dunn comparisons (n = 5; *p < 0.0167). B, Mutant homerR102 flies carrying the c819-GAL4 driver alone showed ethanol sensitivity indistinguishable from homerR102 mutant flies. The T50% of the homerR102 flies was not significantly different from the T50% of the c819-GAL4;homerR102 flies as measured by a one-factor ANOVA and post hoc Bonferroni/Dunn comparisons (n = 5; *p < 0.0167). C, D, The expression of P{UAS-homer-myc} with the c819-GAL4 driver rescued the homerR102 rapid tolerance phenotype to w(CS10) control levels at two different ethanol vapor concentrations. Asterisks indicate significant differences as determined by a one-factor ANOVA and post hoc Bonferroni/Dunn comparisons (n = 5; *p < 0.0083). E, Overexpression of P{UAS-homer-myc} with the c819-GAL4 driver did not alter the ethanol sensitivity of w(CS10) flies. The ethanol sensitivity of w(CS10) flies carrying the c819-GAL4 driver and the P{UAS-homer-myc) transgene was not significantly different from flies carrying the c819-Gal4 driver or P{UAS-homer-myc} transgene alone. No significant differences were observed between the T50% of the c819-GAL4, the P{UAS-homer-myc}, and the P{UAS-homer-myc};c819-GAL4 flies as determined by a one-factor ANOVA and Bonferroni/Dunn comparisons (n = 4). F, The overexpression of P{UAS-homer-myc} in w(CS10) males with the c819-GAL4 driver did not change the development of rapid tolerance of w(CS10) flies. No significant differences in the development of rapid tolerance were observed between the P{UAS-homer};c819-GAL4, c819-GAL4, and P{UAS-homer-myc} flies as determined by a one-factor ANOVA and post hoc Bonferroni/Dunn comparisons (n = 4). Error bars indicate SEM. ns, Not significant.
We then tested the c819-GAL4 line for rescue of the rapid tolerance phenotype in the homerR102 mutant flies. Expression of homer in the homerR102 mutant flies using the c819-GAL4 driver rescued the tolerance phenotype at two distinct ethanol tolerance concentrations (Fig. 6 C,D). The homerR102 flies carrying the c819-GAL4 driver and the UAS-homer transgene exhibited rapid tolerance that was not significantly different from w(CS10) flies (Fig. 6 C,D). No rescue of the rapid tolerance phenotype was observed in homerR102 flies carrying the driver or the UAS-homer transgene alone. These experiments show that the c819-GAL4 driver defines the subset of brain neurons in which expression of wild type homer is sufficient for conferring normal ethanol sensitivity and rapid tolerance.
To further validate these results, we tested a second GAL4 line reported to drive expression in the same subset of ellipsoid body neurons as the c819-GAL4 line (Renn et al., 1999). Expression of the P{UAS-homer-myc} transgene with the c42-GAL4 driver in homerR102 flies rescued both the ethanol sensitivity (Fig. 7 A) and rapid tolerance phenotype (Fig. 7 C). The c42-GAL4 driver alone did not alter the homer mutant phenotypes (Fig. 7 B,C).
Figure 7.
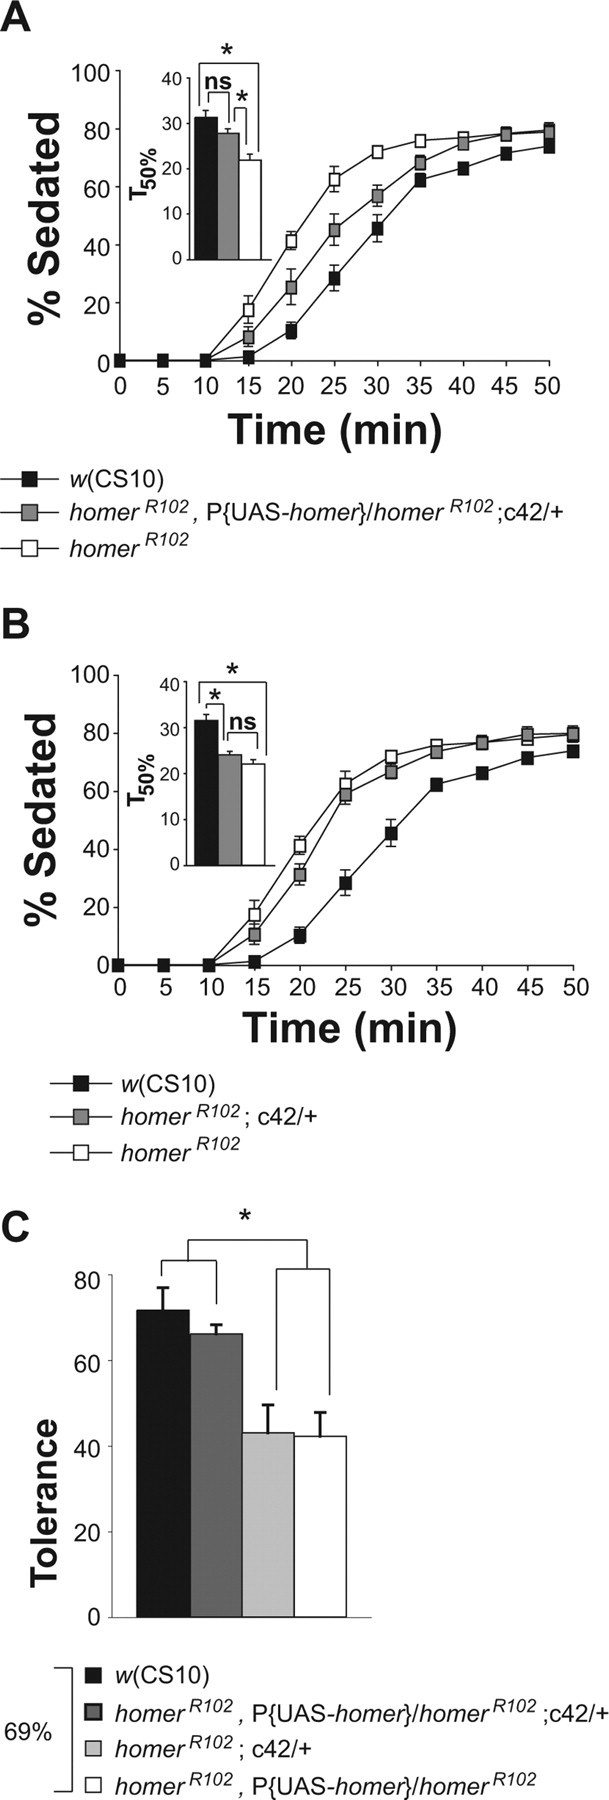
Spatially restricted expression of Homer in the brain with c42-GAL4 rescued sensitivity and rapid tolerance. A, Expression of P{UAS-homer-myc} by the c42-GAL4 driver rescued the homerR102 ethanol sensitivity phenotype. The T50% of the homerR102 flies was significantly different from the T50% of the w(CS10) and homerR102,P{UAS-homer}/homerR102;c42-GAL4 flies as measured by a one-factor ANOVA and post hoc Bonferroni/Dunn comparisons (n = 7; *p < 0.0167). B, Mutant homerR102 flies carrying the c42-GAL4 driver alone showed ethanol sensitivity indistinguishable from homerR102 mutant flies. The T50% of the homerR102 flies was not significantly different from the T50% of the c42-GAL4; homerR102 flies as measured by a one-factor ANOVA and post hoc Bonferroni/Dunn comparisons (n = 7; *p < 0.0167). C, The expression of P{UAS-homer-myc} by the c42-GAL4 driver rescued the homerR102 rapid tolerance phenotype to w(CS10) control levels. The asterisk indicates significant differences as determined by a one-factor ANOVA and post hoc Bonferroni/Dunn comparisons (n = 5; *p < 0.0083). Error bars indicate SEM. ns, Not significant.
We also studied the effects of overexpression of Homer in w(CS10) flies with the c819-GAL4 driver on sensitivity and on rapid tolerance. Overexpression of Homer with the c819-GAL4 driver did not alter ethanol sensitivity (Fig. 6 E), nor did it significantly alter rapid ethanol tolerance (Fig. 6 F).
The c819-GAL4 and c42-GAL4 lines drive UAS-homer expression in Ring neurons of the ellipsoid body
We carefully examined the expression of Homer in the brains of homerR102,P{UAS-homer}/homerR102;c819-GAL4 and of homerR102,P{UAS-homer}/homerR102;c42-GAL4 flies by immunofluorescence. As illustrated in Figure 8, Homer expression was observed in the Ring neurons of the ellipsoid body. Specifically, the expression was observed in the R2 and R4 morphological subtypes of these neurons. Homer expression was observed in the cell bodies (Fig. 8 A,C, CB) of the R2 and R4 neurons and in the neurites that split to send dendrites into the lateral triangle (Fig. 8 B,D, LT) and axons into the ellipsoid body (Fig. 8 B,D, EB). Although c819-GAL4 and c42-GAL4 drive expression in a few other cells in the adult brain (Fig. 8), the ellipsoid body is the major site of common expression, and this brain region has been implicated in ethanol sensitivity through studies of the involvement of protein kinase A (Rodan et al., 2002) and brain structural mutants (Scholz et al., 2000). The c819 and c42 lines have also been reported to drive expression in the pars intercerebralis using a reporter gene assay (Renn et al., 1999). However, we did not observe Homer expression in the pars intercerebralis of homerR102,P{UAS-homer}/homerR102;c819-GAL4 or of the homerR102,P{UAS-homer}/homerR102;c42-GAL4 flies. This discrepancy could be attributable to differences in the responsiveness of different UAS transgenes and/or the instability of Homer protein in the pars intercerebralis. In addition, two lines (dilp2 and 121y) that drive expression in the pars intercerebralis did not rescue the ethanol sensitivity phenotype of the homer mutant flies. Thus, we attribute rescue of the sensitivity and tolerance phenotypes observed in the homerR102,P{UAS-homer}/homerR102;c819-GAL4 and the homerR102,P{UAS-homer}/homerR102;c42-GAL4 flies to the expression of Homer in the R2 and R4 neurons of the ellipsoid body.
Figure 8.

A–D, Expression of P{UAS-homer-myc} by the c819-GAL4 driver and the c42-GAL4 driver. Confocal images of either the homerR102,P{UAS-homer}/homerR102;c819-GAL4 (A, B) or the homerR102,P{UAS-homer}/homerR102;c42-GAL4 (C, D) whole-mount adult brains stained with an anti-Homer antibody are shown. Drosophila Homer expression was observed in the cell bodies (CB) (A, C) of the R2 and R4 neurons and in the neurites that split to send dendrites into the lateral triangle (LT) (B, D) and axons into the EB (B, D). AL, Antennal lobe.
Discussion
To obtain a better understanding of the molecular mechanisms underlying ethanol action in the CNS, we established three independent assays to measure sensitivity and tolerance to the sedative effects of ethanol in Drosophila. Using these assays, we performed microarray experiments to define the changes in gene expression that occur when animals are in the state of rapid or chronic tolerance. Many changes were observed. We hypothesized that the function of the genes sensitive to ethanol exposure may be required for normal behavioral responses to ethanol and therefore tested this hypothesis directly by examining mutant responses. Our studies focusing on Drosophila homer showed that the gene product is involved in both sensitivity and rapid tolerance. Because expression of homer in the CNS rescued these phenotypes, we attributed these phenotypes to the loss of homer expression in the homer mutant flies. Thus, our studies support the hypothesis that Drosophila Homer regulates ethanol sensitivity and tolerance through functions in the CNS. Our findings are supported by the observation that Homer2 KO mice also exhibit an ethanol sensitivity phenotype. This evolutionary conservation of function between Drosophila and mammalian Homer proteins confirm the importance of Homer function in the regulation of ethanol-induced behaviors. Additionally, we have mapped both sensitivity and the development of rapid tolerance to ethanol to the same population of neurons of the ellipsoid body, suggesting that the neuronal circuits controlling these two ethanol-related behaviors are shared.
Homer regulates ethanol sensitivity and tolerance in Drosophila
Members of the Homer family of proteins interact directly with group 1 metabotropic glutamate receptors (mGluR1/5), InsP3Rs, transient receptor potential cation channels, and the postsynaptic protein Shank that functions as part of the NMDA receptor-associated postsynaptic density-95 (PSD-95) complex (Tu et al., 1998, 1999; Xiao et al., 1998; Naisbitt et al., 1999). Although group 1 metabotropic glutamate receptors have not been identified in Drosophila, a direct interaction between Drosophila Homer and Drosophila Shank has been shown in vitro (Diagana et al., 2002). The evolutionary conservation of the Homer–Shank interaction suggests a crucial role for these proteins at the PSD. It is likely that the Drosophila Homer–Shank complex plays an important role in the neuroadaptations underlying ethanol sensitivity and tolerance. For instance, loss of Homer function at the PSD could result in the disruption of signaling complexes important for mediating the effects of ethanol. Of particular interest is the NMDA receptor-signaling complex. Studies in Homer2 KO mice reported a significant reduction in the membrane content of NMDA receptor subunit 2a but not of mGluR5 (Szumlinski et al., 2005), supporting the hypothesis that the Homer–Shank–NMDA receptor interaction may play an important role in conferring normal ethanol sensitivity and tolerance in Drosophila. A prediction of this model is that Shank and NMDA receptor mutants will also exhibit changes in ethanol sensitivity and tolerance.
Ellipsoid body regulates ethanol sensitivity and tolerance
Previous studies showed that mutants with structural abnormalities in the central complex and mushroom bodies display a significantly reduced ability to develop tolerance (Scholz et al., 2000). In addition, two P{GAL4} lines with expression in a subset of central complex neurons show decreased ethanol tolerance in the presence of the P{UAS-TeTxLC} transgene (Scholz et al., 2000). Moreover, lines c107 and c522, both with expression in the central complex, display altered ethanol sensitivity in the presence of P{UAS-PKAinh} (Rodan et al., 2002). Because chemical ablation of the mushroom bodies does not change ethanol sensitivity and because Homer does not appear to be expressed in the mushroom bodies, we focused rescue experiments using GAL4 lines with expression in the central complex. The Drosophila central complex is made up of four neuropilar bodies: the protocerebral bridge, the fan-shaped body, the paired noduli, and the ellipsoid body. Studies indicate that the central complex is important for higher control of locomotor activity (Martin et al., 1999). Although the thoracic and abdominal ganglia are believed to harbor the basic motor programs of walking, the central complex is an important site for fine tuning of behavior, such as walking activity, speed, and leg coordination (Strauss et al., 1992; Strauss and Heisenberg, 1993; Martin et al., 1999).
Our studies have mapped the ethanol sensitivity and tolerance phenotypes of homerR102 mutant flies to the R2 and R4m large-field neurons of the ellipsoid body. Whereas expression of homer in the ellipsoid body with P{GAL4} lines c232, c105, c522, 078Y, c107, and c481 did not rescue the ethanol phenotypes of the homerR102 flies, none of these lines expressed homer in the same set of Ring neurons as the c819 and c42 lines. Thus, our studies suggest that homer expression in the R2 and R4m neurons of the ellipsoid body mediates the rescue of the sensitivity and tolerance phenotypes observed in the homerR102 mutant flies. These results are consistent with previous studies that implicated the central complex in the regulation of ethanol-induced behaviors (Rodan et al., 2002).
Although it is known that the R2 and R4m cell bodies send postsynaptic terminals to the lateral triangle, the neuronal circuits that interact with the dendrites of the R2 and R4m neurons at the lateral triangle have not yet been identified. Based on the functional role of Homer at the PSD, we predict that loss of Homer function in the lateral triangle may disrupt synaptic signaling in the Ring neurons that is required for normal ethanol sensitivity and tolerance.
Homer expression and behavioral responses to ethanol
Whether the downregulation of homer expression attributable to ethanol exposure contributes to ethanol sensitivity and/or tolerance remains unclear. Our data only argue that Homer is required functionally and make no statements as to whether the changes in expression are important. However, because our microarray studies revealed that the expression of many genes is altered by ethanol exposure, it seems probable that if the expression changes are meaningful to the observed behavioral changes, then this is a property of changing the expression of many genes in a response network.
Footnotes
This work was supported by Integrative Neuroscience Initiative on Alcoholism Grants U01AA13476 and U01AA13518. R.L.D. is the recipient of the R. P. Doherty-Welch Chair in Science at the Baylor College of Medicine. Microarray experiments were performed using the facilities of the Center for Medical Genomics at Indiana University School of Medicine, which is supported in part by the Indiana Genomics Initiative and by the Lilly Endowment, Inc. We thank Shaefali Rogers for help in establishing Drosophila behavioral assays; Dr. Scott Pletcher for microarray data analysis help; Drs. Gregg Roman and David D. Moore for advice; and Hanifa Dzidic, Lin Zong, and Curtis Wilson for technical assistance.
References
- Berger KH, Heberlein U, Moore MS. Rapid and chronic: two distinct forms of ethanol tolerance in Drosophila . Alcohol Clin Exp Res. 2004;28:1469–1480. doi: 10.1097/01.alc.0000141817.15993.98. [DOI] [PubMed] [Google Scholar]
- Crabbe JC, Rigter H, Uijlen J, Strijbos Rapid development of tolerance to the hypothermic effect of ethanol in mice. J Pharmacol Exp Ther. 1979;208:128–133. [PubMed] [Google Scholar]
- Diagana TT, Thomas U, Prokopenko SN, Xiao B, Worley PF, Thomas JB. Mutation of Drosophila homer disrupts control of locomotor activity and behavioral plasticity. J Neurosci. 2002;22:428–436. doi: 10.1523/JNEUROSCI.22-02-00428.2002. [DOI] [PMC free article] [PubMed] [Google Scholar]
- Ihaka R, Gentleman R. R: a language for data analysis and graphics. J Comp Graph Stat. 1996;5:299–314. [Google Scholar]
- Li C, Wong WH. Model-based analysis of oligonucleotide arrays: expression index computation and outlier detection. Proc Natl Acad Sci USA. 2001;98:31–36. doi: 10.1073/pnas.011404098. [DOI] [PMC free article] [PubMed] [Google Scholar]
- Lominac KD, Oleson EB, Pava M, Klugmann M, Schwarz MK, Seeburg PH, During MJ, Worley PF, Kalivas PW, Szumlinski KK. Distinct roles for different Homer1 isoforms in behaviors and associated prefrontal cortex function. J Neurosci. 2005;15:11586–11594. doi: 10.1523/JNEUROSCI.3764-05.2005. [DOI] [PMC free article] [PubMed] [Google Scholar]
- Martin JR, Raabe T, Heisenberg M. Central complex substructures are required for the maintenance of locomotor activity in Drosophila melanogaster . J Comp Physiol A Neuroethol Sens Neural Behav Physiol. 1999;185:277–288. doi: 10.1007/s003590050387. [DOI] [PubMed] [Google Scholar]
- McKillop IH, Schrum LW. Alcohol and liver cancer. Alcohol. 2005;35:195–203. doi: 10.1016/j.alcohol.2005.04.004. [DOI] [PubMed] [Google Scholar]
- Naisbitt S, Kim E, Tu JC, Xiao B, Sala C, Valtschanoff J, Weinberg RJ, Worley PF, Sheng M. Shank, a novel family of postsynaptic density proteins that binds to the NMDA receptor/PSD-95/GKAP complex and cortactin. Neuron. 1999;23:569–582. doi: 10.1016/s0896-6273(00)80809-0. [DOI] [PubMed] [Google Scholar]
- Renn SC, Armstrong JD, Yang M, Wang Z, An X, Kaiser K, Taghert PH. Genetic analysis of the Drosophila ellipsoid body neuropil: organization and development of the central complex. J Neurobiol. 1999;41:189–207. [PubMed] [Google Scholar]
- Rodan AR, Kiger JA, Heberlein U. Functional dissection of neuroanatomical loci regulating ethanol sensitivity in Drosophila . J Neurosci. 2002;22:9490–9501. doi: 10.1523/JNEUROSCI.22-21-09490.2002. [DOI] [PMC free article] [PubMed] [Google Scholar]
- Scholz H, Ramond J, Singh CM, Heberlein U. Functional ethanol tolerance in Drosophila . Neuron. 2000;28:261–271. doi: 10.1016/s0896-6273(00)00101-x. [DOI] [PubMed] [Google Scholar]
- Strauss R, Heisenberg M. A higher control center of locomotor behavior in the Drosophila brain. J Neurosci. 1993;13:1852–1861. doi: 10.1523/JNEUROSCI.13-05-01852.1993. [DOI] [PMC free article] [PubMed] [Google Scholar]
- Strauss R, Hanesch U, Kinkelin M, Wolf R, Heisenberg M. No-bridge of Drosophila melanogaster: portrait of a structural brain mutant of the central complex. J Neurogenet. 1992;8:125–155. doi: 10.3109/01677069209083444. [DOI] [PubMed] [Google Scholar]
- Szumlinski KK, Toda S, Middaugh LD, Worley PF, Kalivas PW. Evidence for a relationship between group 1 mGluR hypofunction and increased cocaine and ethanol sensitivity in Homer2 null mutant mice. Ann NY Acad Sci. 2003;1003:468–471. doi: 10.1196/annals.1300.055. [DOI] [PubMed] [Google Scholar]
- Szumlinski KK, Lominac KD, Oleson EB, Walker JK, Mason A, Dehoff MH, Klugman M, Cagle S, Welt K, During M, Worley PF, Middaugh LD, Kalivas PW. Homer2 is necessary for EtOH-induced neuroplasticity. J Neurosci. 2005;25:7054–7061. doi: 10.1523/JNEUROSCI.1529-05.2005. [DOI] [PMC free article] [PubMed] [Google Scholar]
- Szumlinski KK, Kalivas PW, Worley PF. Homer proteins: implications for neuropsychiatric disorders. Curr Opin Neurobiol. 2006;16:251–257. doi: 10.1016/j.conb.2006.05.002. [DOI] [PubMed] [Google Scholar]
- Tu JC, Xiao B, Yuan JP, Lanahan AA, Leoffert K, Li M, Linden DJ, Worley PF. Homer binds a novel proline-rich motif and links group 1 metabotropic glutamate receptors with IP3 receptors. Neuron. 1998;21:717–726. doi: 10.1016/s0896-6273(00)80589-9. [DOI] [PubMed] [Google Scholar]
- Tu JC, Xiao B, Naisbitt S, Yuan JP, Petralia RS, Brakeman P, Doan A, Aakalu VK, Lanahan AA, Sheng M, Worley PF. Coupling of mGluR/Homer and PSD-95 complexes by the Shank family of postsynaptic density proteins. Neuron. 1999;23:583–592. doi: 10.1016/s0896-6273(00)80810-7. [DOI] [PubMed] [Google Scholar]
- Xiao B, Tu JC, Petralia RS, Yuan JP, Doan A, Breder CD, Ruggiero A, Lanahan AA, Wenthold RJ, Worley PF. Homer regulates the association of group 1 metabotropic glutamate receptors with multivalent complexes of homer-related, synaptic proteins. Neuron. 1998;21:707–716. doi: 10.1016/s0896-6273(00)80588-7. [DOI] [PubMed] [Google Scholar]