

Abstract
Intrinsic signal optical imaging with red illumination (ISOI) is used extensively to provide high spatial resolution maps of stimulus-evoked hemodynamic-related signals as an indirect means to map evoked neuronal activity. This evoked signal is generally described as beginning with an undershoot or “dip” in signal that is faster, more transient, and weaker compared with the subsequent signal overshoot. In contrast, the evoked signal detected with blood oxygen level-dependent (BOLD) functional magnetic resonance imaging (fMRI) is generally described as containing an undershoot after the initial dip and overshoot, even though it, too, detects hemodynamic-related signals and its first two phases appear complementary to those of ISOI. Here, we used ISOI with 635 nm illumination to image over 13.5 s after a 1 s stimulus delivery to detect and successfully use the ISOI undershoot phase for functional mapping. Eight spatiotemporal attributes were assessed per signal phase including maximum areal extent and peak magnitude, both of which were largest for the ISOI overshoot, followed by the undershoot and then the initial dip. Peak activity location did not colocalize well between the three phases; furthermore, we found mostly modest correlations between attributes within each phase and sparse correlations between phases. Extended (13.5 s) electrophysiology recordings did not exhibit a reoccurrence of evoked suprathreshold or subthreshold neuronal responses that could be associated with the undershoot. Beyond the undershoot, additional overshoot/undershoot fluctuations were also mapped, but were typically less spatiotemporally specific to stimulus delivery. Implications for ISOI and BOLD fMRI are discussed.
Keywords: intrinsic signal optical imaging, fMRI, rat, whisker, barrel, primary somatosensory cortex
Introduction
Intrinsic signal optical imaging with red illumination (ISOI) (Grinvald et al., 1986; Frostig et al., 1990; Ts'o et al., 1990) is widely used for studying fine details of cortical functional organization. It detects changes in multicomponent intrinsic signals, consisting of both hemodynamic- [including deoxygenated hemoglobin (Hbr), oxygenated hemoglobin (HbO2), blood volume and flow] and, to a lesser extent, light scattering-related signals, as an indirect means to map evoked neuronal activity. ISOI signal is predominantly described as beginning with an initial undershoot or “dip” that is more rapid (<1 s after stimulus onset), transient (∼2 s), and weaker compared with the subsequent stronger (more than two times) and longer (several seconds) overshoot. The ISOI initial dip is thought to be dominated by a rapid Hbr increase and HbO2 decrease, localizes best with activated neurons, and is routinely mapped in ISOI studies (Frostig et al., 1990; Malonek and Grinvald, 1996; Malonek et al., 1997; Ances et al., 2001; Mayhew et al., 2001; Devor et al., 2003; Thompson et al., 2003, 2004; Kasischke et al., 2004; Offenhauser et al., 2005). In contrast, the ISOI overshoot is thought to be dominated by HbO2 increase and Hbr decrease (Frostig et al., 1990; Ogawa et al., 1990a,b; Malonek and Grinvald, 1996; Malonek et al., 1997; Vanzetta and Grinvald, 1999; Shtoyerman et al., 2000; Jones et al., 2001) and less localized to activated neurons. Blood oxygen level-dependent (BOLD) functional magnetic resonance imaging (fMRI) also detects hemodynamic-related signals for localizing evoked neurons and, although challenging, it too can sometimes detect an initial dip, but routinely relies on the overshoot. The BOLD fMRI overshoot is followed by an undershoot, a phase which has yet to be explored for ISOI although both signals share similar properties and some underlying mechanisms, and at least for BOLD fMRI the undershoot is stronger than the initial dip (Frahm et al., 1996; Buxton et al., 1998; Chen et al., 1998; Mandeville et al., 1998, 1999; Jasdzewski et al., 2003; Lu et al., 2004; Schroeter et al., 2006; Yacoub et al., 2006).
Our aim was to attempt, for the first time, to derive and compare functional maps from all three signal phases. Here, we report that a strong ISOI undershoot can be reliably mapped. Based on a set of 60 rats, each functional map was comprehensively characterized by assessing eight spatiotemporal attributes, and comparisons between attributes made within and between maps. Imaging trials were extended (28.5 s) in a subset of rats, where additional fluctuations were observed beyond the undershoot and were compared with the triphasic signal and to fluctuations in control trials. Because of the ISOI initial dip relationship to neuronal activation, in another subset of rats we investigated whether the ISOI undershoot indicated poststimulus reoccurrence of neuronal activation by recording 13.5 s of both action potentials and local field potentials (LFPs). Last, in an additional set of animals, imaging was performed with 605 nm illumination (contains less light scattering contribution than 635 nm). Our results provide a comprehensive description of the presence, nature, and properties of the maps generated from all three ISOI signal phases, which should be informative for those pursuing more targeted questions about the hemodynamic mechanisms underlying the three phases and for the functional imaging community in general.
Materials and Methods
Subjects and surgical preparation.
Data were pooled from several projects all of which contained imaging data that followed activity up to 13.5 s after stimulus onset and that shared other experiment details. At the start of an experiment, each of the 60 adult (255–462 g; mean ± SE, 330.7 ± 4.4 g) male Sprague Dawley rats (Charles River Laboratories, Wilmington, MA) received an initial intraperitoneal injection of Nembutal (55 mg/kg, b.w.) followed by an intramuscular injection of atropine (0.05 mg/kg, b.w.) into the hind leg. Supplemental intraperitoneal injections of Nembutal (27.5 mg/kg, b.w.) were administered as necessary to maintain mild corneal reflexes, and additional intramuscular atropine injections were administered every 6 h. Body temperature was monitored with a rectal thermometer and maintained at 37°C with a self-regulating electric heating blanket (model 50–7053-F; Harvard Apparatus, Holliston, MA), with breathing unassisted. After removal of overlying skin and muscle tissue, ∼8 × 6 mm of the left skull centered above the subregion of the primary somatosensory cortex responsive to mystacial whiskers (rostromedial corner ∼1 mm rostral and ∼2 mm lateral to bregma) was thinned to ∼150 μm thickness with a bit driven by a dental drill handpiece (model 3610N1) and motor (model K9 Install “E” Coupler; KaVo America, Lake Zurich, IL). A wall of petroleum jelly was built around the periphery of the thinned skull region, filled with saline, and capped with a 20 × 20 mm glass coverslip, keeping the thinned skull moist and thus permitting a clear visualization of the underlying surface vasculature throughout the entire day (for a more detailed description of the thinned skull preparation, see Masino et al., 1993). All performed procedures were in compliance with National Institutes of Health guidelines and approved by the University of California Animal Care and Use Committee.
Intrinsic signal optical imaging.
A CCD camera (Quantix 0206; Photometrics, Tucson, AZ) controlled by V++ Precision Digital Imaging System (Digital Optics, Auckland, New Zealand) was used along with an inverted 50 mm AF Nikon (Tokyo, Japan) lens (1:1.8) combined with an extender (model PK-13). Each rat was placed under the CCD camera such that most of the thinned skull region was contained within the camera's field of view and that the optical axis of the camera lens was perpendicular to the center of the imaged region. The CCD chip of the camera collected light reflectance with a 191 × 144 pixel array (after 2 × 2 binning), where 1 binned pixel equaled 34 × 34 μm area and, thus, the imaged cortical region was ∼6.5 × 4.9 mm. Before imaging, a picture of the surface vasculature was captured for later use (Fig. 1) before the CCD camera was defocused to 600 μm below the cortical surface to maximize signal contribution from the upper cortical layers while minimizing contribution from surface vasculature. The imaged region was continuously illuminated with a red light-emitting diode (LED; part RL5-R8030; Super Bright LEDs, St. Louis, MO) connected directly in serial to a resistor (1/2 watt, 100∼500 Ohm) and 6 V battery. The red LED was housed within a reflector of 10 mm inner diameter combined with a ground glass optical diffuser (part NT45–651; Edmund Industrial Optics, Barrington, NJ), and the output spectral properties of this illumination source was confirmed to be 635 nm max wavelength with full width at half height of 15 nm. Data were collected in 100 ms frames with one imaging trial consisting of either 150 frames spanning 15 s (n = 44 rats) or 300 frames spanning 30 s (n = 16 rats). In stimulation trials, stimulus onset occurred 1.5 s into the start of the trial, thus allowing the collection of imaging signal up to 13.5 s after stimulus onset for the 15 s trials versus up to 28.5 s after stimulus onset for the 30 s trials. During stimulus delivery, only the C2 whisker was deflected five times for 1 s at 5 Hz in the rostral-caudal axis with a copper wire probe attached to a stepping motor enslaved to a computer-controlled pulse generator (Master 8; A.M.P.I., Jerusalem, Israel), where for each deflection the C2 whisker was displaced 0.8 mm at a distance of 5 mm from the C2 follicle for a duration of 100 ms. An equal number of control and stimulation trials was collected, randomly interlaced, with the interval between trials ranging randomly between 1 and 11 s for an average of 6 s. A final set of either 64 (n = 24) or 128 (n = 36) stimulation trials (plus equal number of control trials) was collected per rat. Before analysis, data were collapsed to 500 ms frames as a means to increase signal-to-noise without requiring an increase in the total number of trials.
Figure 1.
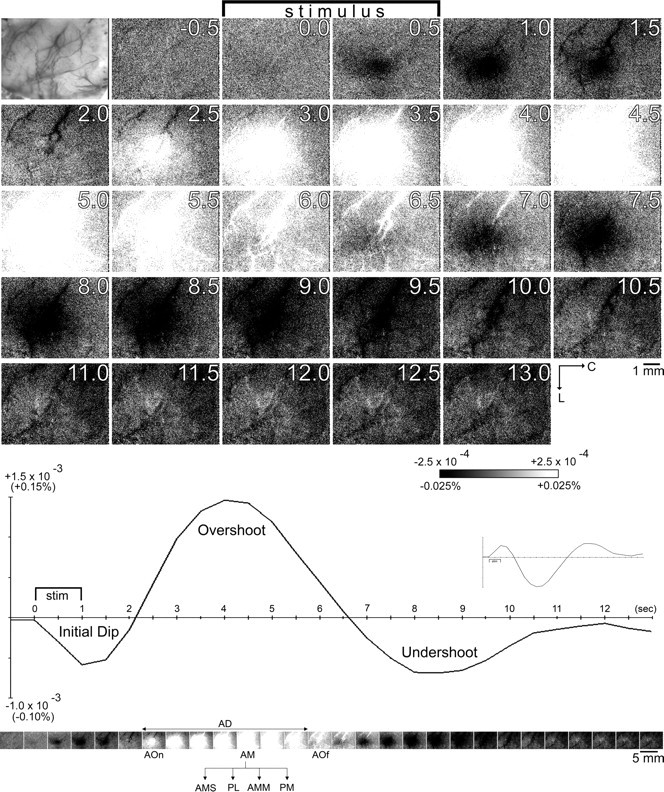
Visualization of evoked intrinsic signal and the eight spatiotemporal parameters assessed for signal phase characterization. Data from a representative rat is provided to illustrate that high-spatial resolution images of intrinsic signal activity was obtained in 500 ms frames for an extended time epoch after stimulus onset (up to 13.5 s). Top, A photograph is provided of the vasculature present on the surface of the imaged cortical region. Images of poststimulus data were created by first converting data into fractional change values relative to the 500 ms frame collected immediately before stimulus onset on a pixel-by-pixel basis before applying an eight-bit linear grayscale to the processed data such that middle gray equals no change relative to prestimulus data, darker gray values equal larger undershoots, lighter gray values equal larger overshoots, and darkest (black) and lightest (white) values were thresholded at ±2.5 × 10⁻⁴ or ±0.025% (for details, see Materials and Methods). Prestimulus data can be visualized by creating an image in a similar manner, where the 500 ms frame immediately preceding stimulus onset (−0.5 s time point) is converted relative to the −1.0 s time point. The stimulus bar indicates when the 1 s stimulus delivery occurred. The 1 mm scale bar and neuroaxis apply to all images. Bottom, Line plot of the fractional change values was obtained from a single binned pixel located centrally within the imaged cortex, with the inset containing the same data points plotted upside down as is traditionally done in ISOI studies. The same images seen above were reduced in size and redisplayed below the line plot for easier comparison along the temporal domain. The five millimeter scale bar applies to all images; the neuroaxis remains the same. The same processing of data and application of the grayscale to the processed data are applicable to all subsequent figures containing high-spatial visualization of intrinsic signals. Note that after stimulating a single whisker for 1 s, a triphasic intrinsic signal was evoked starting with an initial dip followed by an overshoot and then an undershoot. For a comprehensive characterization of the intrinsic signal, eight spatiotemporal parameters were assessed for each signal phase: area-onset time (AOn), area-max time (AM), area-offset time (AOf), area duration (AD), area-max size (AMS), peak location (PL), area-max magnitude (AMM), and peak-max time (PM). For details, see Materials and Methods.
Imaging data analysis: eight spatiotemporal parameters per signal phase.
All processing and analysis of imaging data were performed using V++. First, high spatial visualization of intrinsic signal activity in 500 ms resolution was used to map the various phases of the evoked intrinsic signal (Fig. 1). A two-step intratrial analysis was used (Chen-Bee et al., 1996). For each 500 ms frame (frame X) collected after stimulus onset, the fractional value was calculated relative to the 500 ms frame collected immediately before stimulus onset (baseline frame or frame B) on a pixel-by-pixel basis according to the following formula: [frame X − frame B]/frame B, where the range of fractional change (FC) values was in the order of 10−4 or 0.01%, an FC value of 0 denoted no change in imaging signal before versus after stimulus onset, decreasing FC values below 0 denoted increasingly larger undershoots, and increasing FC values above 0 denoted increasingly larger overshoots in imaging signal (Fig. 1, top). Then, an eight-bit grayscale mapping function was applied to the fractional change values to generate images that visualized maps of ISOI undershoot or overshoot as described by Ts'o et al. (1990). Here, an FC value of 0 (no change in imaging signal relative to no change in imaging signal relative to prestimulus baseline) was mapped to the middle shade of gray, and an arbitrary threshold of ±2.5 × 10⁻⁴ FC (or 0.025%) from 0 was chosen such that values between −2.5 × 10⁻⁴ and +2.5 × 10⁻⁴ FC were linearly distributed across the 256 shades of gray, undershoots larger than −2.5 × 10⁻⁴ FC would appear as black, and overshoots larger than + 2.5 × 10⁻⁴ FC would appear as white on images (see Figs. 1, 2, 4). Because of the large difference in signal amplitude between the initial dip versus the overshoot phase (Fig. 1), this arbitrary threshold was chosen because it was neither too high of a threshold for successful quantification of the weaker initial dip, nor too low for the stronger overshoot. Control trials were visualized in the exact same manner (see Figs. 5, 6).
Figure 2.
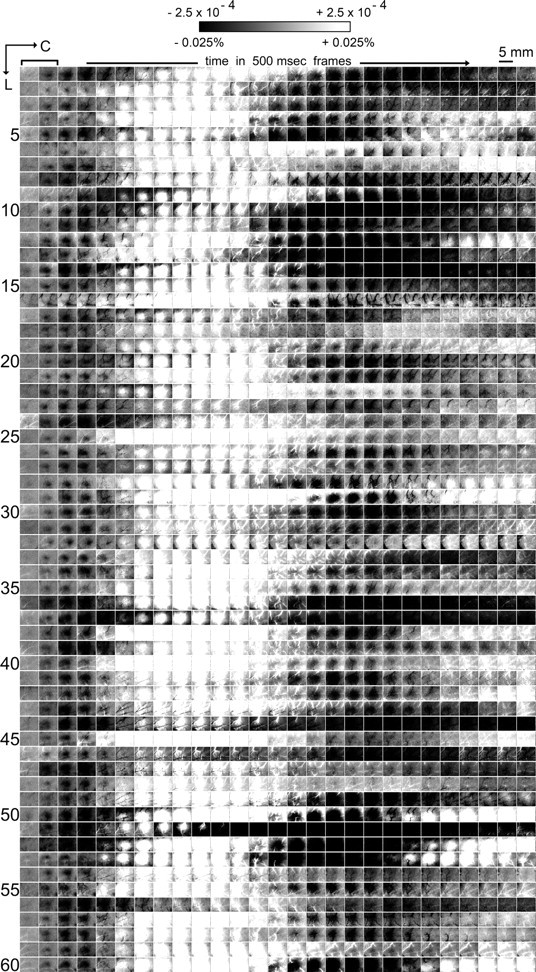
Visualization of the evoked intrinsic signal across 60 rats. Images of evoked intrinsic signal in 500 ms frames are provided through 13.5 s after the onset of a 1 s stimulus delivery to a single whisker (one row per rat). A total of 64 stimulation trials were collected per rat for the first 24 rats, whereas 128 trials were collected for the remaining 36 rats. Stimulus bar in the top left corner indicates that the 1 s stimulus delivery occurs during the first two frames and applies to all rows. Grayscale, 5 mm scale bar, and neuroaxis apply to all images. Across all rats, the evoked intrinsic signal is reliably triphasic, consisting of an initial dip (first prolonged presence of a black activity area) followed by an overshoot (first prolonged white activity area) and then an undershoot (second prolonged black activity area). Although some variability existed across rats, consistent differences between the three signal phases were apparent including time after stimulus onset when an activity area first appeared (area-onset time), total duration of activity area presence (area duration), and spatial extent size of the maximum activity area (area-max size). Note that by the end of the 13.5 s poststimulus time epoch, an additional overshoot and/or undershoot was observed in the majority of rats.
Figure 4.
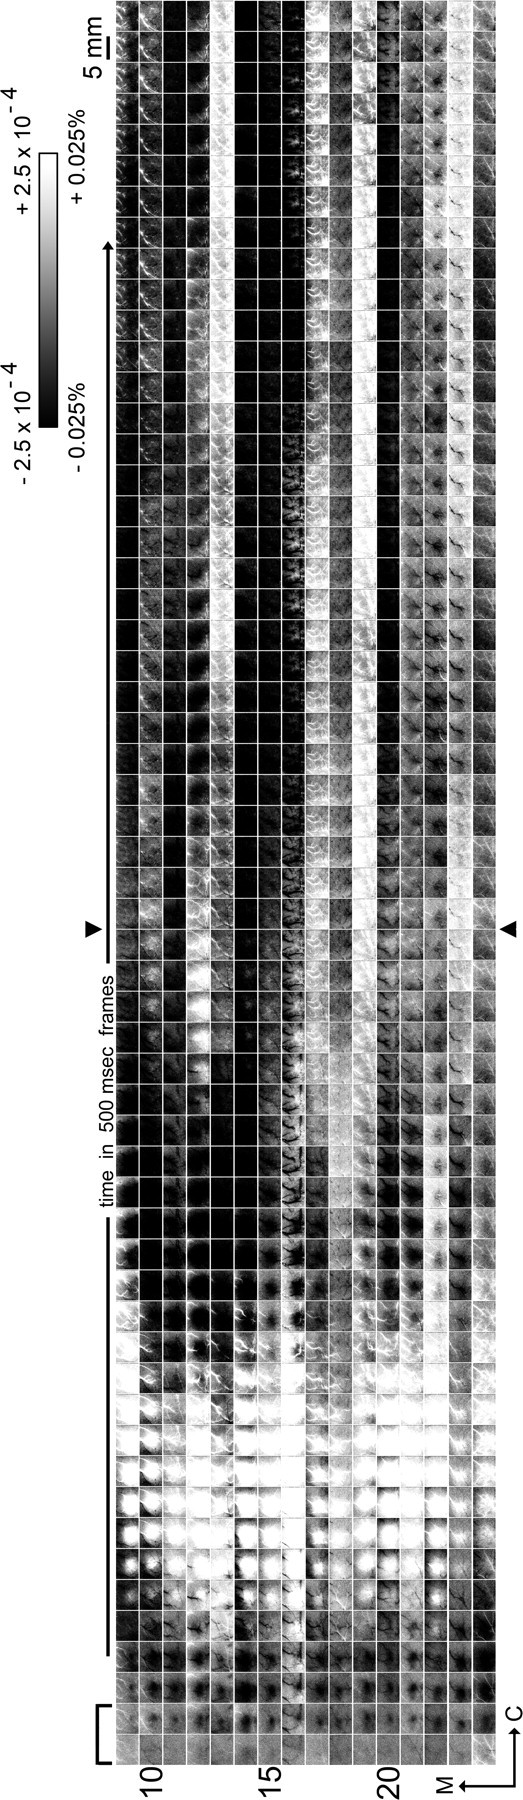
Visualization of the evoked intrinsic signal extended through 28.5 s after stimulus onset. In a subset of cases (16 rats; first 13.5 s of poststimulus data are also presented in Fig. 2, rows 9 through 24), evoked intrinsic signal was followed in 500 ms frames up to 13.5 s after the 1 s stimulus delivery, plus an additional 15 s for a total of up to 28.5 s after stimulus onset. Trial duration was extended farther to determine whether other reliable signal phases exist beyond the undershoot of the triphasic signal (second prolonged presence of a black activity area). Images are rotated 90° counterclockwise such that medial is toward the left of the panel and rostral is toward the bottom, time after stimulus onset increases from bottom to top, and one column summarizes data from one rat. The stimulus bar in the bottom left corner indicates that the 1 s stimulus delivery occurs during the first two frames and applies to all columns. Grayscale, 5 mm scale bar, and neuroaxis apply to all images; arrowheads separate the first 13.5 s of poststimulus data from the subsequent additional 15 s of data. As illustrated previously in Figure 2, the evoked intrinsic signal is triphasic within 13.5 s after stimulus onset. Note that beyond the undershoot (second prolonged presence of a dark activity area), additional undershoots and/or overshoots can occur up to 28.5 s after stimulus onset. However, these additional undershoots/overshoots did not exhibit stereotypical characteristics such as time of area onset, area max, or area offset, and will be referred to hereafter as fluctuations.
Figure 5.
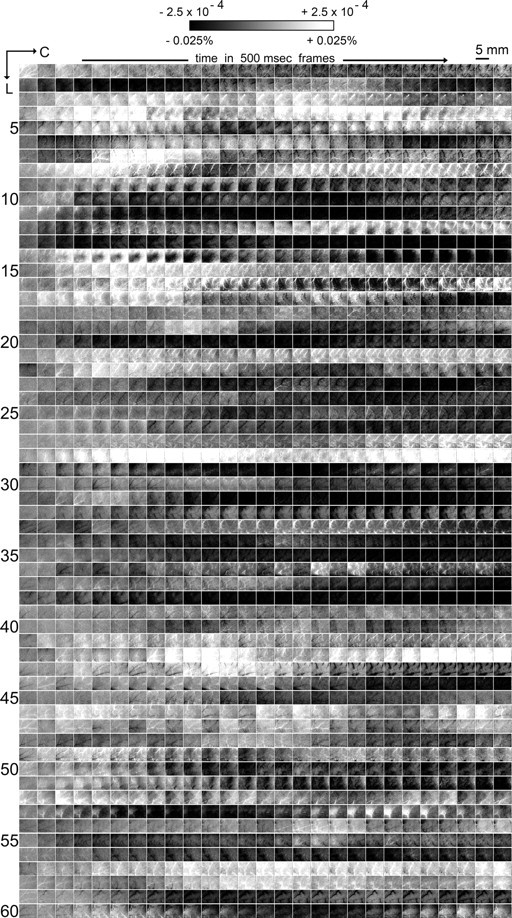
Visualizing 13.5 s of control data across 60 rats. Images of intrinsic signal in 500 ms frames are provided for control trials (one row per rat) that were randomly interlaced with stimulation trials. A total of 64 control trials were collected per rat for the first 24 rats, whereas 128 trials were collected for the remaining 36 rats. Grayscale, 5 mm scale bar, and neuroaxis apply to all images. Similarly to the latter half of the 30 s stimulation trials presented in Figure 4, overshoot and/or undershoot fluctuations in intrinsic signal area were observed in control trials that were collected randomly with stimulation trials, although again these fluctuations did not exhibit stereotypical characteristics such as time of area onset, area max, or area offset.
Figure 6.
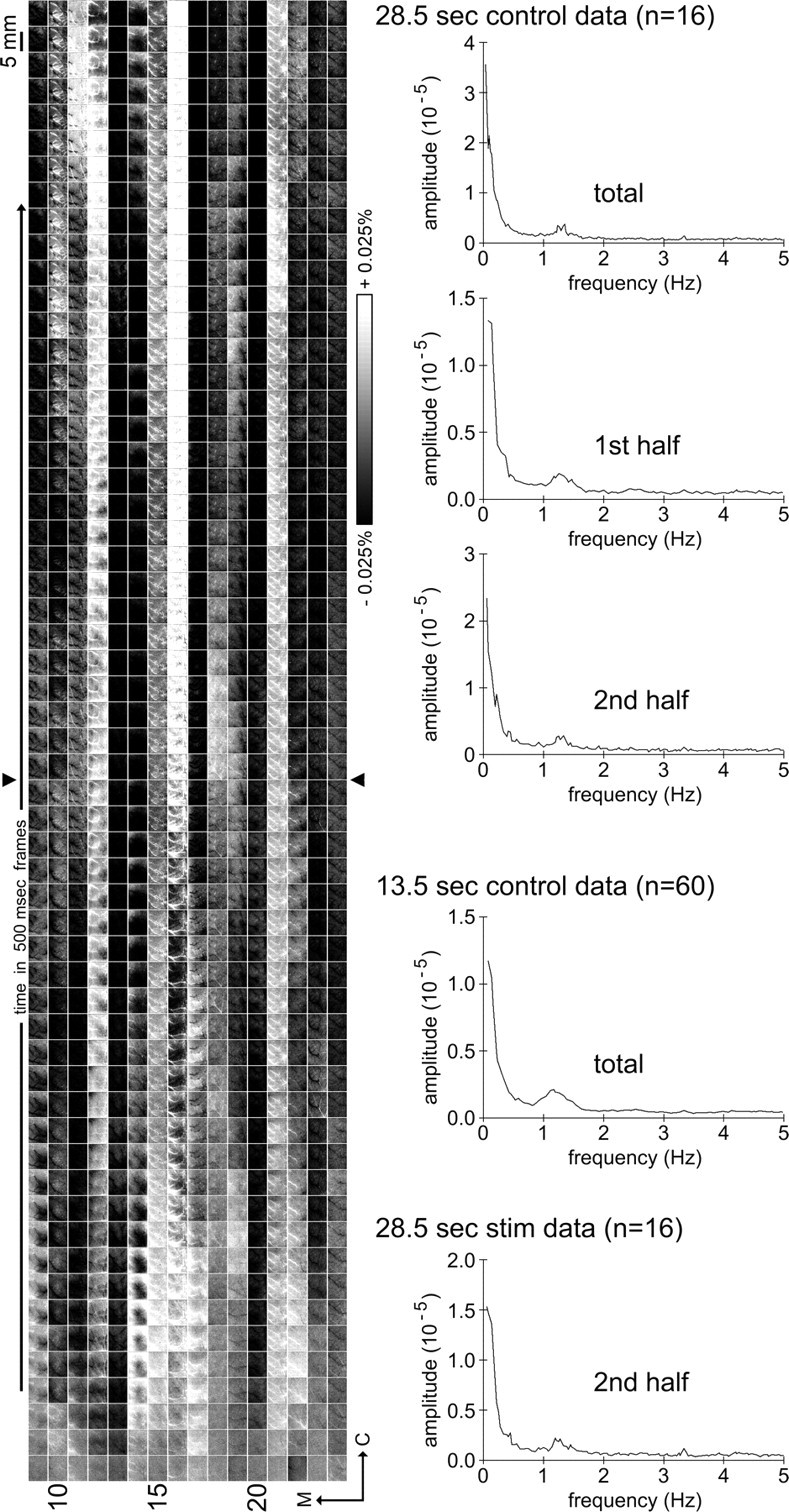
Visualizing 28.5 s of control data across 16 rats and power spectral analysis of control data. Left, Images of intrinsic signal in 500 ms frames are provided for 30 s control trials randomly collected with 30 s stimulation trials (one row per rat; same subset of rats whose 30 s stimulation trials were presented in Fig. 4). Images are rotated 90° counterclockwise such that medial is toward the left of the panel, rostral is toward the bottom, time increases from bottom to top, and one column summarizes data from one rat. Grayscale, 5 mm scale bar, and neuroaxis apply to all images; arrowheads separate the first 13.5 s of data collection from the additional 15 s of data. Note that overshoot and/or undershoot fluctuations in intrinsic signal area were observed, but, as with the latter half of the 30 s stimulation trials in Figure 4, these overshoot/undershoot fluctuations did not exhibit stereotypical characteristics. Also note that these nonspecific overshoot/undershoot fluctuations occurred similarly between the first half versus the latter half of the 30 s control trials. Right, To characterize the oscillation frequencies of these nonspecific fluctuations, power spectral analysis was performed and the average spectrum density plots were generated for the 28.5 s control data (entire 28.5 s, first half, or second half; n = 16), the entire duration of the 13.5 s control data (n = 60), and the second half of the 28.5 s stimulation data (n = 16). Note that a strong primary peak in the ∼0.1 Hz range and a weak secondary peak in the ∼1–1.5 Hz range are observed in all spectrum density plots.
After the various evoked signal phases were identified, eight spatiotemporal parameters were measured for the map of each signal phase (Fig. 1). Four of them addressed the temporal features of evoked area presence as determined by visualizing individual 500 ms frames: (1) area-onset time, as defined by the first 500 ms frame observed to contain an evoked activity area; (2) area-max time, as defined by the first 500 ms frame observed to contain the maximum spatial extent for the evoked area; (3) area-offset time, as defined by the first 500 ms frame observed to no longer contain the evoked area; and (4) area duration, as defined by the total number of consecutive 500 ms frames observed to contain the evoked area. Then, three more parameters were measured to characterize in detail the maximum area of evoked activity by analyzing specifically the 500 ms area-max frame: (5) area-max size is the areal extent as quantified using an arbitrary threshold of 2.5 × 10⁻⁴ FC away, either in the negative or positive direction, depending on whether an undershoot or an overshoot area was being quantified, respectively; (6) peak location of the pixel containing the peak activity within the maximum evoked area; and (7) area-max magnitude, as defined by the absolute magnitude at the peak location within the maximum evoked area. The eighth parameter, (8) the peak-max time, was defined as the 500 ms time point at which the maximum was achieved at the peak location coordinate. Note that parameters 1–4 as well as 8 contained ordinal (ordered categorical) data whereas parameters 5 and 6 contained numerical data.
It is relevant to note that peak location of the initial dip map evoked by single-whisker stimulation has been found previously to overlie the correct anatomical whisker representation (or barrel) (Masino et al., 1993; Brett-Green et al., 2001) and is thus useful for studies interested in targeting a specific whisker barrel. However, our past determinations of the initial dip peak location entailed the analysis of the 1 s time epoch at 0.5 up to 1.5 s poststimulus onset, whereas in the present study we were interested in characterizing the peak location obtained from the area-max frame for all signal phases. To determine whether the initial dip peak location derived from analyzing the area-max frame can still be successful in targeting the appropriate barrel, we compared the peak location of the initial dip as determined from that 1 s poststimulus time epoch versus the area-max frame (n = 37 rats for 1.5 s poststimulus frame; n = 23 rats for 2.0 s poststimulus frame), and found that in 53 of 60 cases (88%), the difference in initial dip peak location derived from the two different methods was negligible (∼0.2 mm or approximately the half-width of a large whisker barrel), indicating that the initial dip peak location obtained from the area-max frame should also be successful in targeting the appropriate whisker barrel. The remaining seven cases exhibited a marked difference ranging between 0.34 and 1.50 mm, all of whose area-max frames were 2.0 s poststimulus onset, suggesting that analyzing the latter part of the initial dip may lead to peak locations that are less successful in targeting the appropriate whisker barrel, presumably because of the delayed influence of signals dominated by large surface vasculature. But in those seven cases, an additional local peak was available and, when used, increased the success rate to 57 of 60 or 95% of cases exhibiting negligible difference in peak locations between the 1 s time epoch versus the area-max frame. Thus, for each of the three signal phases, in the event where multiple local peaks were present in the area-max frame, the final peak location was chosen whose coordinates were closest to those derived from the 1 s poststimulus time epoch of the initial dip, which did not correspond to the largest peak in a minority of cases for the initial dip (10%), but corresponded to almost half of the cases for the overshoot (48%) and undershoot (43%). Hereafter, presentation and discussion of initial dip peak-location results refer to those locations derived from the area-max frame, unless specifically noted otherwise.
Before quantifying parameters 5–8, data that were converted to FC values as described above were processed with a two-pass Gaussian filter (half-width, 5) on a pixel-by-pixel basis to remove high-frequency noise (for more details on areal extent quantification using absolute thresholds, see Chen-Bee et al., 2000). Because poststimulus activity was followed over tens of seconds, thresholding from an absolute 0 was used in the present project as opposed to thresholding from a prestimulus baseline because of the uncertainty in using prestimulus data to extrapolate the trend in baseline activity beyond a few seconds.
Last, because a normalized threshold (e.g., 50% peak magnitude) is commonly used for quantifying activity areas, we also quantified the size of the maximum evoked area using 50% of the area-max magnitude.
Imaging Data Statistics.
All statistics were performed using Systat 11 (Systat Software, Richmond, CA). To validate that data from rats with a final set of 64 stimulation trials (see Fig. 2, first 24 cases) could be pooled together with those of 128 trials (see Fig. 2, latter 36 cases), we first compared the visualization of individual 500 ms frames across all 60 rats to confirm a lack of any obvious qualitative differences between 64- versus 128-trial rats. One-way repeated-measures ANOVAs with the within-subjects variable “signal phase” (initial dip vs overshoot vs undershoot) and the between-subjects variable “total trial number” (64, n = 24 vs 128, n = 36) were also performed to confirm that neither the main effect total trial number nor the interaction between total trial number and signal phase was significant for either area-max size (p values > 0.340255) or area-max magnitude (p values > 0.322914). Therefore, descriptive and inferential statistics reported hereafter were obtained while treating all 60 rats as one data set.
Percent distributions were used to describe each ordinal parameter (see Fig. 3) whereas minimums, maximums, medians, means, and SEs were used to describe each numerical parameter (Table 1). For ordinal parameters, interphase comparison was achieved by comparing respective percent distributions (see Fig. 3). For the two numerical parameters (area-max size; area-max magnitude), interphase comparison was achieved by performing a one-way repeated-measures ANOVA for each numerical parameter, with the α level set to 0.01 to account for the large sample size (n = 60 rats) (see Fig. 7). Before the ANOVA, data were transformed with a square root function to better satisfy the assumptions of a repeated-measures ANOVA (normal distribution for each subgroup of values, homogeneity of variance across means, independence between variance and means) and inferential statistics were performed on the transformed data. After a one-way repeated-measures ANOVA, specific contrasts were performed to identify which pairs of signal phases were significantly different. Last, to determine how successful the peak location of a particular signal phase (excluding initial dip) (see Materials and Methods, Imaging Data Analysis) would be in overlying the appropriate whisker barrel, the interphase comparison of peak location was achieved by re-expressing the peak-location coordinates of either the overshoot (see Fig. 8A) or undershoot (see Fig. 8B) relative to those of the initial dip. Thus, a relative coordinate of (0,0) would indicate perfect colocalization with the peak activity of the initial dip, shifts from the origin along the x-axis would indicate shifts along the rostral–caudal axis, and shifts from 0 along the y-axis would indicate shifts along the medial–lateral axis. For anatomical reference, the half-width of a large whisker barrel is ∼0.2 mm and the distance between the centers of adjacent whisker barrels is ∼0.5 mm. A similar re-expressing of the undershoot peak-location coordinates relative to those of the overshoot was performed to determine whether peak-location coordinates for the undershoot colocalized better with those of the overshoot (see Fig. 8C).
Figure 3.

Temporal profile of the evoked activity area per signal phase. Regarding the entire period that an evoked activity area is present, the following temporal characteristics were assessed per signal phase: area-onset time (AOn), area-max time (AM), area-offset time (AOf), area duration (AD), and peak-max time (PM). For details, see Materials and Methods. Occurrence of the 1 s stimulus delivery to a single whisker is indicated in all but the fourth panel with a vertical gray bar. Although some variability existed across rats, note that the initial dip, overshoot, and undershoot phases of the evoked intrinsic signal exhibited stereotypical time points with respect to when the area onset, area max, and area offset occurred, as well as when peak max occurred. Also, the total duration that the evoked activity area was present (area duration) was about twice as long for the overshoot and undershoot compared with the initial dip, and that area max and peak max occurred at similar time points.
Table 1.
Size and peak magnitude of maximum evoked area by signal phase
| Initial dip | Overshoot | Undershoot | |
|---|---|---|---|
| Area max size (mm2) | |||
| Min–max | 0–22.70 | 1.90–28.04 | 0–28.04 |
| Median | 2.90 | 20.51 | 8.84 |
| Mean | 5.57 | 19.26 | 11.42 |
| SE | 0.83 | 0.89 | 1.27 |
| Area max magnitude (|10−4| FC) | |||
| Min–max | 2.20–7.71 | 5.39–29.30 | 0.38–22.28 |
| Median | 4.29 | 12.44 | 6.20 |
| Mean | 4.54 | 14.11 | 7.36 |
| SE | 0.16 | 0.76 | 0.64 |
After a 1 s stimulus delivery to a single whisker, the 500 ms poststimulus onset frame containing the maximum evoked area was identified for each of the three signal phases and the spatial extent size of the maximum evoked area (area-max size) obtained from this frame as well as the peak magnitude within the quantified area (area-max magnitude) was determined. For details, see Materials and Methods. Note that on average across 60 rats, the largest spatial extent and strongest peak magnitude was observed for the overshoot, followed by the undershoot and then the initial dip.
Figure 7.

A, B, Interphase comparison of area-max size (AMS) and area-max magnitude (AMM). The spatial extent size of the maximum activity area (AMS) and the magnitude of peak activity within the quantified area (AMM) were assessed for all three signal phases. Means and SEs of the quantified data are provided for 60 rats. One-way repeated-measures ANOVAs followed by specific contrasts were performed on the transformed AMS and AMM data. Statistically significant differences between all possible pairs of signal phases were found for both AMS and AMM (indicated by asterisks). For details, see Results. A, Inset, The maximum activity area was also quantified using a normalized threshold of 50% AMM. In striking contrast to all other data of the present study, note that the smallest maximum activity area is actually observed for the overshoot signal phase and, thus, the 50% AMM threshold was not used any further.
Figure 8.
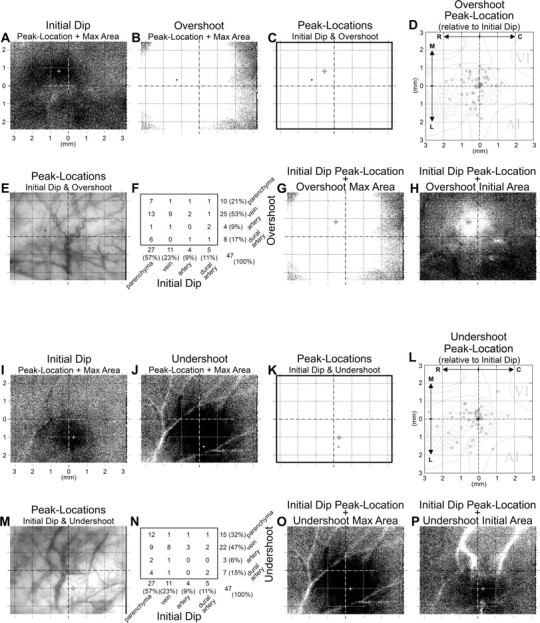
Interphase comparison of peak activity location. Interphase comparison of peak location is meaningful, especially relative to the initial dip given that the initial dip peak response to stimulation used in the present study (single whisker C2 stimulation) has been shown previously to localize above the appropriate anatomical location (whisker C2 anatomical representation in layer IV of primary somatosensory cortex). Top half, Initial versus overshoot signal phase. A, B, The peak location superimposed on an image of the maximum activity area for the initial dip from a representative rat is provided here (A, 1 mm scale grid applies to all images and is the same scale as for the grid used in the scatterplot), along with those of the overshoot in the same animal (B). C, The initial dip (+) and overshoot (black circle) peak locations are superimposed together on the same grid background to illustrate the spatial registry between the two. Note the ∼1 mm distance between the two peak locations. D, To summarize the spatial registry between the initial dip and overshoot peak locations across all 60 rats, the overshoot peak location was first converted to relative coordinates with respect to those of the initial dip such that a relative coordinate of (0,0) would indicate a perfect match in peak location for the two phases. Thus, a single rat can be plotted with a single point and a total of 60 rats can be summarized in a scatterplot. To better appreciate the anatomical significance of the variability in the plotted relative coordinates, the scatterplot is superimposed on an appropriately scaled schematic of tangential cortical layer IV cytochrome oxidase labeling that includes portions of primary somatosensory, visual (VI), and auditory (AI) cortex, with the relative origin centered above whisker C2 anatomical representation. Note that the overshoot peak location did not colocalize well with that of the initial dip; only 22% of the cases exhibited a margin of error that would still be considered to successfully lie above whisker C2 anatomical representation. E, The variability in the overshoot peak locations relative to the initial dip was further investigated relative to the large surface vessels by superimposing peak locations on a photograph of the imaged cortex for each rat. F, A summary is provided of the initial dip and overshoot peak locations categorized according to whether they fell on parenchyma, vein, artery, or dural artery. Note that the majority of the initial dip peak locations fell on parenchyma (57%) whereas the majority for the overshoot fell on a vein (53%), although examples from all of the different types of vasculature were observed for both signal phases. G, Despite the challenges associated with defining the centroid of an irregularly shaped activity area, an attempt was made to determine whether the center of the overshoot maximum activity area may colocalize better with the initial dip peak location. Note that in this particular example the center of the overshoot maximum area did not provide an obvious improvement in coregistering with the initial dip peak location (+). H, However, the center of the overshoot activity area when it initially appears may better coregister with the initial dip peak location, although in this particular example the margin of error (∼200 μm) is still approximately half the width of a large anatomical whisker representation. I–P, Initial versus undershoot signal phase. The overall findings were the same when comparing peak locations for the initial dip versus the undershoot signal phase.
We also performed correlative characterization within each phase (intraphase) as well as between two phases (interphase) as a means to determine whether the variability of a particular parameter was related to that of another parameter. For the intraphase characterization, simple correlative descriptive and inferential statistics were obtained between all possible pairs of all parameters for a given phase except peak location, for a total of 21 intraphase correlations per signal phase (Table 2). When at least one of the two parameters for a given pair was numerical, a simple linear Pearson's r coefficient and its associated p value were calculated. When both parameters were ordinal, Spearman's rho coefficient and the number of SEs that its coefficient was away from 0 were calculated. The α level was set to 0.01 to account for the large sample size, and Bonferroni adjustment was applied to account for the large number (21) of correlations being investigated; thus, Pearson's r coefficients with p values < 0.000476 (or 0.01/21) and Spearman's rho coefficients that were >3.7 SEs from 0 (based on Student's t distribution with df = 59) were deemed significant. Between a given pair of signal phases (e.g., initial dip vs overshoot; interphase characterization), the same calculations as described above were performed except for the following differences: for a given pair, the two parameters belonged to different signal phases; a total of 49 correlations were possible; and thus Pearson's r coefficients with p values <0.000204 (or 0.01/49) and Spearman's rho coefficients that were >3.96 SEs away from 0 were deemed significant (Table 3).
Table 2.
Intraphase association between pairs of signal traits for each signal phase
| AOn | AM | AOf | AD | PM | AMS | |
|---|---|---|---|---|---|---|
| Initial dip | ||||||
| AM | rho = −0.03 | |||||
| AOf | rho = −0.03 | rho = 0.56* | ||||
| AD | rho = −0.58* | rho = 0.48* | rho = 0.81* | |||
| PM | rho = −0.06 | rho = 0.77* | rho = 0.38 | rho = 0.36 | ||
| AMS | r = 0.15 | r = 0.41 | r = 0.51* | r = 0.39 | r = 0.43 | |
| AMM | r = −0.03 | r = 0.33 | r = 0.44* | r = 0.40 | r = 0.34 | r = 0.77* |
| Overshoot | ||||||
| AM | rho = 0.33 | |||||
| AOf | rho = −0.14 | rho = 0.28 | ||||
| AD | rho = −0.45* | rho = 0.14 | rho = 0.93* | |||
| PM | rho = 0.45* | rho = 0.59* | rho = 0.32 | rho = 0.14 | ||
| AMS | r = −0.48* | r = 0.08 | r = 0.39 | r = 0.47* | r = 0.02 | |
| AMM | r = −0.47* | r = 0.02 | r = 0.23 | r = 0.31 | r = −0.03 | r = 0.67* |
| Undershoot | ||||||
| AM | rho = 0.61* | |||||
| AOf | rho = 0.10 | rho = 0.45* | ||||
| AD | rho = −0.25 | rho = 0.23 | rho = 0.93* | |||
| PM | rho = 0.56* | rho = 0.91* | rho = 0.48* | rho = 0.27 | ||
| AMS | r = −0.41 | r = −0.09 | r = 0.35 | r = 0.51* | r = −0.04 | |
| AMM | r = −0.54* | r = −0.24 | r = 0.12 | r = 0.37 | r = −0.16 | r = 0.79* |
For each signal phase, eight spatiotemporal parameters were characterized: area-onset time (AOn), area-max time (AM), area-offset time (AOf), area duration (AD), peak-max time (PM), area-max size (AMS), area-max magnitude (AMM), and peak location (PL). Excluding PL (it contains coordinate data), within each phase the degree of correlation was assessed between all possible pairs of signal parameters such that when both parameters for a given pair contained ordinal data, Spearman's rho coefficient was obtained; otherwise, when at least one parameter out of a given pair contained numerical data, a simple linear Pearson's r coefficient was obtained. Asterisks indicate correlations found to be statistically significant (>3.7 SEs away from 0 for Spearman's rho coefficient; p < 0.000476 for Pearson's r coefficient). Bold indicates those associations found significant for all phases. See Materials and Methods for details.
Table 3.
Interphase association between pairs of signal traits
| AOn | AM | AOf | AD | PM | AMS | AMM | |
|---|---|---|---|---|---|---|---|
| Initial dip versus overshoot | |||||||
| AOn | rho = 0.00 | rho = 0.60* | rho = 0.64* | rho = 0.49* | rho = 0.53* | r = 0.50* | r = 0.49* |
| AM | rho = −0.14 | rho = 0.30 | rho = 0.47* | rho = 0.46* | rho = 0.16 | r = 0.33 | r = 0.31 |
| AOf | rho = 0.01 | rho = 0.12 | rho = −0.03 | rho = −0.02 | rho = 0.00 | r = −0.20 | r = −0.38 |
| AD | rho = 0.03 | rho = −0.08 | rho = −0.23 | rho = −0.18 | rho = −0.18 | r = −0.30 | r = −0.46 |
| PM | rho = −0.16 | rho = 0.42 | rho = 0.47* | rho = 0.46* | rho = 0.34 | r = 0.17 | r = 0.04 |
| AMS | r = −0.04 | r = −0.28 | r = −0.27 | r = −0.22 | r = −0.30 | r = −0.21 | r = −0.31 |
| AMM | r = −0.12 | r = −0.22 | r = −0.14 | r = −0.07 | r = −0.15 | r = −0.06 | r = −0.13 |
| Initial dip versus undershoot | |||||||
| AOn | rho = 0.04 | rho = 0.37 | rho = 0.35 | rho = 0.27 | rho = 0.18 | r = −0.08 | r = −0.15 |
| AM | rho = 0.10 | rho = 0.40 | rho = 0.35 | rho = 0.21 | rho = 0.21 | r = 0.22 | r = 0.19 |
| AOf | rho = 0.20 | rho = 0.27 | rho = 0.40 | rho = 0.21 | rho = 0.19 | r = 0.43 | r = 0.26 |
| AD | rho = 0.17 | rho = 0.13 | rho = 0.29 | rho = 0.13 | rho = 0.12 | r = 0.43 | r = 0.31 |
| PM | rho = 0.15 | rho = 0.37 | rho = 0.31 | rho = 0.15 | rho = 0.23 | r = 0.29 | r = 0.22 |
| AMS | r = −0.02 | r = 0.02 | r = 0.34 | r = 0.31 | r = 0.09 | r = 0.35 | r = 0.37 |
| AMM | r = −0.09 | r = −0.12 | r = 0.11 | r = 0.13 | r = −0.02 | r = 0.30 | r = 0.32 |
| Overshoot versus undershoot | |||||||
| AOn | rho = 0.31 | rho = 0.50* | rho = 0.53* | rho = 0.39 | rho = 0.71* | r = 0.13 | r = −0.11 |
| AM | rho = 0.32 | rho = 0.44* | rho = 0.39 | rho = 0.23 | rho = 0.49* | r = 0.02 | r = −0.15 |
| AOf | rho = 0.33 | rho = 0.28 | rho = −0.12 | rho = −0.21 | rho = 0.16 | r = −0.19 | r = −0.18 |
| AD | rho = 0.22 | rho = 0.11 | rho = −0.31 | rho = −0.35 | rho = −0.09 | r = −0.24 | r = −0.11 |
| PM | rho = 0.35 | rho = 0.38 | rho = 0.35 | rho = 0.20 | rho = 0.47* | r = −0.09 | r = −0.18 |
| AMS | r = 0.16 | r = −0.07 | r = −0.51* | r = −0.50* | r = −0.07 | r = −0.19 | r = 0.22 |
| AMM | r = −0.06 | r = −0.11 | r = −0.36 | r = −0.32 | r = −0.22 | r = 0.00 | r = 0.50* |
For each signal phase, eight spatiotemporal parameters were characterized: area-onset time (AOn), area-max time (AM), area-offset time (AOf), area duration (AD), peak-max time (PM), area-max size (AMS), area-max magnitude (AMM), and peak location (PL). Excluding PL (it contains coordinate data), between two signal phases the degree of correlation was assessed for all possible pairs of signal parameters such that a parameter from one phase was compared with a parameter from a different phase. When both parameters for a given pair contained categorical data, Spearman's rho coefficient was obtained. Otherwise, when at least one parameter out of a given pair contained numerical data, a simple linear Pearson's r coefficient was obtained. Asterisks indicate correlations found to be statistically significant (>3.96 SEs away from 0 for Spearman's rho coefficient; p < 0.000204 for Pearson's r coefficient). For details, see Materials and Methods.
Electrophysiology recording in both the supragranular and granular layers.
Imaging was followed by electrophysiology recording in a subset of rats (n = 5) from which 128 stimulation-imaging trials were collected and with each trial containing data up to 13.5 s after stimulus onset. After imaging, the thinned skull region was removed, the exposed dura retracted, and the wall of petroleum jelly rebuilt and filled with silicon oil to preserve the moisture of the cortex. Then, to record stimulus-evoked single-unit activity and LFPs as a means to assess suprathreshold and subthreshold neuronal activity, respectively, a linear array of eight Tungsten microelectrodes (∼1.5 MΩ impedance; Micro Probe, Potomac, MD) spaced 0.5 mm apart was inserted into the exposed cortex such that the first electrode entered perpendicular to the location of peak activity derived from analyzing the 0.5 up to 1.5 s poststimulus time epoch of the initial dip (presumably above whisker C2 barrel) and the remaining electrodes directed posterolaterally relative to the first electrode (i.e., toward primary auditory cortex). Using a multielectrode micropositioner recording system (Alpha EPS GII; Alpha Omega, Nazareth, Israel), the final depth into the cortex was determined independently for each electrode and simultaneous recordings from all electrodes were obtained first from the supragranular layer (300–400 μm) before advancing to the granular layer (600–700 μm) for a second recording session. One complete recording session consisted of 128 stimulation trials using the same whisker stimulation parameters as those used during imaging. Each trial contained 0.5 s of baseline activity followed by 13.5 s of poststimulus onset activity. During data collection, recordings were amplified (100×) and filtered with a broad frequency range (1–2000 Hz) to allow simultaneous capture of single-unit discharges and LFPs from each electrode (Alpha-Map data acquisition software; Alpha Omega). Waveform analysis software (Spike2; Cambridge Electronic Design, Cambridge, UK) was used for the off-line separation of single-unit discharges from LFPs by the refiltering of the collected data in either the 300–2000 Hz range or 1–300 Hz range, respectively, and for the subsequent analysis. Often, more than one single-unit waveform was isolated per single electrode per recording session. Peristimulus time histograms (PSTHs) from the 128 collected trials were generated for each recorded neuron using a 1 ms bin width and expressed in units of spikes/second/trial, and line plots of the average LFPs per electrode per layer per recording session generated.
Results
Evoked intrinsic signal of ISOI is reliably triphasic within ∼13.5 s after stimulus onset, with nonspecific additional overshoot and undershoot areas occurring beyond the triphasic signal. Figure 2 illustrates the mapping of evoked imaging signal collected up to 13.5 s after onset of brief whisker C2 stimulation for all 60 rats. In every case, the evoked imaging signal within that 13.5 s time epoch was reliably triphasic: a map of the initial dip was observed, followed by a map of the overshoot and then the undershoot. Figure 3 summarizes the temporal features of the evoked area presence for the three signal phases. On average, the initial dip area-onset frame occurred by 0.5 s after stimulus onset (100% of cases), the area-max frame occurred at 1–1.5 s (100%), the area-offset frame occurred at 2–2.5 s (87%), and the area duration lasted 1.5–2.5 s (89%). In contrast, the overshoot area-onset frame occurred at 2–3 s (95%), the area-max frame occurred at 3.5–4.5 s (83%), the area-offset frame occurred at 6–9 s (87%), and area duration lasted 3.5–5 s (63%), whereas the undershoot area-onset frame occurred at 6–7.5 s (90%), the area-max frame occurred at 7.5–9.5 s (88%), the area-offset frame occurred at 10–12 s (62%), and area duration lasted 3–7.5 s (97%). For all three signal phases, in general the occurrence of the area-max frame roughly coincided with that of the peak-max frame (time point at which maximum activity was reached at the peak-location coordinate), suggesting that the area-max size and area-max magnitude both reached a maximum at about the same time. Area-max size and area-max magnitude descriptive statistics for each signal phase are summarized in Table 1.
In 38 of 60 cases (63%), an additional undershoot and/or overshoot area beyond the triphasic signal was observed up to 13.5 s after stimulus onset, and in only a handful of cases (5 of 60 or 8%) this 13.5 s time epoch was observed to end with several consecutive frames without activity area present (Fig. 2), thus introducing the possibility that additional phases could be discovered if imaging was extended much more beyond the triphasic signal. In a subset of cases (16 of 60), the trial duration was doubled to 30 s, which permitted us to map evoked intrinsic signal up to 28.5 s after stimulus onset (equal number of 30 s control trials were also collected). A summary of these 16 cases is provided in Figure 4, illustrating that in all cases more additional undershoot and/or overshoot areas continued to occur past 13.5 s poststimulus onset. Although additional undershoot and overshoot areas could continue to occur for an extensive period of time (up to 28.5 s after stimulus onset), there were three qualitative differences in the spatiotemporal characteristics of the triphasic signal versus the additional overshoot and undershoot areas. First, after the triphasic signal pattern, additional undershoot and/or overshoot areas no longer exhibited a reproducible pattern with respect to either the number or chronological order of undershoots or overshoots (e.g., several undershoots only, overshoot followed by two undershoots, etc.). Second, additional undershoot and overshoot areas did not exhibit any particular temporal profile: they did not appear time-locked to stimulus onset with respect to the area-onset frame, area-max frame, area-offset frame, or area duration, and at times were observed to last longer than 10 s. Third and last, the spatial extent and central location of the evoked area for each of the three signal phases was coherent and specific, whereas this was not reliably observed for the additional undershoot and overshoot areas. Undershoot and overshoot areas were also present in the 15 s (Fig. 5) and 30 s (Fig. 6) control trials, and these were also observed to be temporally and spatially nonspecific to stimulus delivery. Note that nonspecific undershoot and overshoot areas were similarly present during the second half of the 30s control trials compared with the first half (Fig. 6), and in only one of 16 cases (6%) was it observed to end with several consecutive frames without any undershoot/overshoot areas, suggesting that fluctuations between spatially and temporally nonspecific undershoot and overshoot areas can continue indefinitely. These additional, nonspecific undershoots and overshoots beyond the triphasic signal are referred to hereafter simply as additional fluctuations. Power spectral analysis performed over a centralized region (0.12 mm2) within the imaged cortex revealed that, although unrelated to stimulus delivery, these fluctuations did exhibit some oscillatory behavior. The profile of the spectrum was the same (in all cases, peak power present in the ∼0.1 Hz range; in >88% of cases, secondary peak present in the ∼1–1.5 Hz range), regardless of whether it was obtained from the 15 s control trials, the entire duration of the 30 s trials, the first versus the second half of the 30 s control trials, or even the second half of the 30 s stimulation trials.
Interphase comparison
Overshoot signal phase lasts the longest, is spatially the largest, and is the strongest in peak magnitude, followed by the undershoot and then the initial dip, with the location of initial dip peak activity coinciding best with neuronal activity, but poor colocalization of peak activity between the three signal phases. As illustrated in Figure 3, the evoked activity area for each of the three signal phases had characteristic temporal features such as different onset, time to peak, and offset times. Along with Table 1 and Figures 7 and 8, Figure 3 also illustrates the similarities and differences between the signal phases. Area duration lasted about twice as long for the overshoot and undershoot compared with the initial dip (Fig. 3). Relative to the initial dip, the mean area-max size was approximately three times larger for the overshoot and approximately two times larger for the undershoot (Table 1). A one-way repeated-measures ANOVA performed on the transformed area-max size data found the main effect signal phase significant (F(2,118) = 44.67; p = 0.000000), and subsequent specific contrasts found the area-max size to be significantly different between the initial dip versus the overshoot (F(1,59) = 106.33; p = 0.000000), the initial dip versus the undershoot (F(1,59) = 14.77; p = 0.000299), and the overshoot versus the undershoot (F(1,59) = 25.71; p = 0.000004) (Fig. 7A). The size of the evoked activity area in the area-max frame was also quantified using a common thresholding method of 50% peak magnitude (Fig. 7A, inset). We found that the results were strikingly different from all other data presented thus far, in addition to being incongruent with what is currently known about the relationship between the three signal phases: the area for the three phases appeared quite similar. With the α level set at 0.01 to account for the large sample size, a one-way repeated-measures ANOVA performed on the transformed data did not find the main effect signal phase to be significant (F(2,118) = 4.35; p = 0.014985). Because of the unexpectedness of these results, specific contrasts were performed to confirm that indeed no significant difference was found between the initial dip versus overshoot (F(1,59) = 1.940262; p = 0.168867) or between the initial dip versus undershoot (F(1,59) = 2.374785; p = 0.128655), and that only the overshoot versus undershoot was found to be significantly different, but with the overshoot being the smallest (F(1,59) = 8.859845; p = 0.004222). These puzzling results would suggest that the relative relationship between peak magnitude versus signal decay over distance need not remain similar (i.e., 50% threshold of a stronger/larger activity area need not identify a similarly sized area as a 50% threshold of a weaker/smaller activity area) when one peak magnitude is very different from another (as observed in the present study for the overshoot vs the initial dip) (see end of this paragraph). Future research is needed to better understand the implications of our results obtained while thresholding at 50% peak magnitude, but is beyond the scope of the present project and, thus, not further pursued. Relative to the initial dip, the mean area-max magnitude was approximately three times stronger for the overshoot and approximately 1.5 times larger for the undershoot (Table 1). A one-way repeated-measures ANOVA performed on the transformed area-max magnitude data found the main effect signal phase significant (F(2,118) = 110.63; p = 0.000000), and specific contrasts found the area-max magnitude to be significantly different between the initial dip versus the overshoot (F(1,59) = 201.95; p = 0.000000), the initial dip versus the undershoot (F(1,59) = 18.97; p = 0.000054), and the overshoot versus the undershoot (F(1,59) = 103.26; p = 0.000000) (see Fig. 7B).
Defining whether the location of peak activity successfully coregisters between two activity areas is dependent on the research question, animal, and brain region under study. When there is an interest in targeting the appropriate whisker barrel in the rat posteromedial barrel subfield (PMBSF) of the primary somatosensory cortex, a separation between peak locations that is within 0.2 mm, or approximately half the width of a large whisker barrel, is an acceptable margin of error in defining a successful coregistry of location. Although the peak location of the overshoot can indeed coregister within 0.2 mm of the initial dip peak location, the percentage of such cases was small (22% or 13 of 60 cases), with the remaining cases being as much as >1 mm away (Fig. 8D). Similarly, only 22% of the peak locations for the undershoot were observed to be within 0.2 mm away and some cases were observed to be >1 mm away (Fig. 8L). There was a slight improvement in the coregistering of peak locations between the overshoot and undershoot (20 of 60 cases or 33% within 0.2 mm), but still almost half of the cases were observed to have a separation >1 mm (data not shown). To determine whether the surface vasculature may somehow be relevant to the observed lack of coregistry between the initial dip versus the overshoot (Fig. 8E,F) or versus the undershoot (Fig. 8M,N), peak locations were superimposed on a photograph of the large surface vasculature and categorized according to whether they were lying on top of parenchyma, a vein, an artery, or a dural artery. The majority of initial dip peak locations were observed to fall on top of parenchyma (57%) (Fig. 8F,N) whereas the majority fell on veins for the overshoot (53%) (Fig. 8F) and undershoot (47%) (Fig. 8N). However, note that there were cases in which the initial dip peak location fell on some type of blood vessel (Fig. 8F,N), and cases in which the overshoot (Fig. 8F) and undershoot (Fig. 8N) peak locations fell on something other than a vein (including parenchyma), suggesting that the relationship may not be straightforward between large surface vasculature and peak locations of the different signal phases. Another relevant question is whether the center of maximum activity area for either the overshoot or undershoot, rather than peak location, may better coregister with the initial dip peak location, especially in light of the fact that the peak location can be substantially off-centered within an activity area (Fig. 8B,J). Despite the limitations inherent in defining the center of an irregularly shaped activity area, we made an attempt to address this question by superimposing the initial dip peak location on top of an image of either the overshoot (Fig. 8G) or undershoot (Fig. 8O) maximum activity area and looked for obvious improvements in coregistry with the initial dip peak location. We observed only a slight improvement in the percentage of cases observed to have coregistry (within ∼0.5 mm) between initial dip peak location versus the center of maximum activity area for the overshoot (30%) or undershoot (28%); in the majority of cases, a lack of coregistry was still observed (Fig. 8G,O). However, if we considered the center of the activity area when it first appeared (Fig. 8H,P), rather than that of the maximum activity area (Fig. 8G,O), the percentage of cases in which the initial dip peak locations coregistered (within ∼0.5 mm) with the activity center increased substantially for the overshoot (78%) and undershoot (73%). Still, a systematic degree of error in the half-millimeter range (Fig. 8H,P) is enough to target an adjacent anatomical whisker representation rather than the appropriate one.
Given not only that the undershoot signal phase was reliably present, but also that its area-max size and area-max magnitude were larger than those of the initial dip, in combination with evidence supporting the existence of evoked neuronal activity underlying the initial dip, we wondered whether a brief whisker stimulus delivery could also evoke a second round of neuronal activity a few seconds or so before the area-max time point of the undershoot. Thus, in five rats, single-unit activity and LFPs were recorded up to 13.5 s after stimulus onset from eight electrodes spaced 0.5 mm apart in both the supragranular and granular layers, including within the peak location derived from the 0.5 up to 1.5 s poststimulus time epoch of the initial dip. Other than the evoked single-unit and LFP responses expected during delivery of the 1 s whisker stimulus (largest amplitude and shortest latency occurring at the electrode inserted into the peak location of initial dip, and decaying at increasing distances away from the peak along the tangential plane), no other occurrences of either evoked single-unit or evoked LFPs were observed up to 13.5 s after stimulus onset, regardless of electrode location or cortical layer (for representative PSTH and LFP data obtained at the initial dip peak location, see Fig. 9, top half). Furthermore, unlike the strong additional fluctuations observed in the control imaging trials, single-unit or LFP activity from the control electrophysiology trials did not exhibit any occurrences of spontaneous activity with magnitudes similar to that of the strong evoked activity observed within milliseconds after stimulus onset (Fig. 9, bottom half).
Figure 9.

Suprathreshold and subthreshold neuronal activity recorded through 13.5 s after onset of 1 s stimulus. Top half, Data from the supragranular layer at the initial dip peak location of a representative rat are provided to illustrate that suprathreshold (PSTH) and subthreshold (LFP) neuronal activity was followed for many seconds after stimulus delivery. Stimulus bars indicate the 1 s delivery of 5 Hz whisker C2 stimulation, and arrows indicate the approximate time after stimulus onset when area max is achieved for the intrinsic signal undershoot phase. Other than the obvious round of evoked suprathreshold and subthreshold neuronal activity occurring during stimulus delivery, note the lack of a second round of increased activity for both the PSTH and LFP for the interval between stimulus offset and up to 13.5 s after stimulus onset, including within a few seconds before the undershoot area-max time point. Bottom half, Control data from the same recording location in the same rat are provided to illustrate that no occurrences of spontaneous activity were observed with similar magnitudes as those of evoked activity for either the suprathreshold (PSTH) or subthreshold (LFP) recordings.
In three additional animals, 128 stimulation trials imaged with 635 nm illumination were randomly interlaced and collected with an equal number of trials imaged with 605 nm illumination (LED part RL5-O5015; Super Bright LEDS), a wavelength whose light reflectance signal should contain less contribution from light scattering. As illustrated in Figure 10, imaged intrinsic signals up to 13.5 s after stimulus onset is also observed to be triphasic when using 605 nm illumination.
Figure 10.

Comparing intrinsic signal imaged with 635 nm versus 605 nm illumination. Data from a representative rat is provided containing a total of 128 stimulation trials. Each were randomly interlaced and imaged within the same rat. As in Figure 1, images of poststimulus data shown here were created by first converting data into fractional change values relative to the baseline frame collected just before stimulus onset before applying a linear grayscale to the converted data. Also, an image of the prestimulus data were generated in a similar manner. Grayscale, 5 mm scale bar, and neuroaxis apply to all images. Line plot of the fractional change values was obtained from a single binned pixel located centrally within the imaged cortex, with the inset containing the same data points plotted upside down as is traditionally done in ISOI studies. Images have been scaled and displayed below the line plot for easier comparison along the time axis. Note that the triphasic nature of the evoked intrinsic signal is present when imaging with 605 nm as well as 635 nm illumination.
Intraphase correlative characterization
As described in Materials and Methods, eight spatiotemporal parameters were measured to comprehensively characterize each signal phase (Fig. 1). Four parameters focused on the temporal features of the evoked area across the entire time that the area was present (area-onset frame, area-max frame, area-offset frame, and area duration) whereas three parameters characterized more fully the evoked area at the 500 ms time epoch in which the area achieved its maximum spatial extent (area-max size, area-max magnitude, and peak-max frame). Peak location was excluded from the correlative characterization because it contained coordinate data. As can be observed in Figures 2, 3, and 7 and Table 1, these seven parameters exhibited some degree of variability across the 60 rats. Simple linear correlations were obtained between all possible parameter pairs for each signal phase (total of 21 correlations per phase) (Table 2) to identify whether the variability observed for a particular signal parameter was somehow related to that of another parameter. After applying the Bonferroni adjustment to our statistical testing, the smallest Pearson's and Spearman's coefficient values to achieve statistical significance across all signal phases were |r| = 0.44 and |rho| = 0.45, respectively. The majority of significant correlations obtained across all phases were moderate (r or rho absolute values ranging from 0.44 to 0.61), although some stronger correlations in the range of 0.67–0.93 were found.
Summary: correlation attributes shared by all three phases
Regardless of the signal phase, it appeared that larger maximum spatial extents correlated with stronger peak magnitudes (area-max size vs area-max magnitude), longer total duration of evoked area presence correlated with later disappearance of the evoked area (area duration vs area-offset frame), and later time to reach the maximum area of evoked activity correlated with later time to reach maximum magnitude of activity at the peak location (area-max frame vs peak-max frame). Overall, the earlier the activity area first appeared or the later the activity area disappeared, the greater the evoked signal (spatial extent or peak magnitude) and the later the evoked signal reached its maximum (spatial extent or peak magnitude). Specific details are provided below for each phase.
Initial dip
Between the four temporal features of the evoked area presence, the set of significant correlations was relatively straightforward: longer area durations were found to correlate with both earlier area-onset frames (rho = −0.58; 6.61 SEs) and later area-offset frames (rho = 0.81; 22.72 SEs); later area-max frames correlated with later area-offset frames (rho = 0.56; 5.91 SEs) and longer area durations (rho = 0.48; 4.89 SEs), but not with earlier area-onset frames; and earlier area-onset frames did not correlate with either area-offset frames or area-max frames. With respect to the three parameters specific to the maximum area of evoked activity, larger area-max sizes correlated with stronger area-max magnitudes (r = 0.77; p = 0.00000), but neither correlated with peak-max frames. Last, only a few temporal features of the evoked area presence correlated with the maximum evoked area: later area-offset frames with larger area-max sizes (r = 0.51; p = 0.00003) and stronger area-max magnitudes (r = 0.44; p = 0.00039); later area-max frames with later peak-max frames (rho = 0.77; 10.08 SEs).
Overshoot
Compared with the initial dip, not as many significant correlations were found between the various features of the evoked area presence: longer area durations correlated with both earlier area-onset frames (rho = −0.45; 4.19 SEs) and later area-offset frames (rho = 0.93; 43.79 SEs). With respect to the parameters specific to the maximum evoked area, again the only significant correlation found was larger area-max sizes with stronger area-max magnitudes (r = 0.67; p = 0.00000). Relative to the initial dip, the various features of the evoked area presence appeared more related to the maximum evoked area: earlier area-onset frames correlated with larger area-max sizes (r = −0.48; p = 0.00010), stronger area-max magnitudes (r = −0.47; p = 0.00017), and earlier peak-max frames (rho = 0.45; 4.45 SEs); later area-max frames correlated with later peak-max frames (rho = 0.59; 6.63 SEs); and longer area durations correlated with larger area-max sizes (r = 0.47; p = 0.00017).
Undershoot
For the features of the evoked area presence, the number of significant correlations was almost as many as the initial dip, but the types of correlations were somewhat different from the initial dip or the overshoot: longer area durations correlated with later area-offset frames (rho = 0.93; 47.54 SEs), but not with area-onset frames; later area-max frames correlated with both later area-onset frames (rho = 0.61; 6.41 SEs) and later area-offset frames (rho = 0.45; 3.78 SEs). For the maximum evoked area, again only one significant correlation was found: larger area-max sizes with stronger area-max magnitudes (r = 0.79; p = 0.00000). Compared with the overshoot, a similar degree of relationship existed between features of the evoked area presence and features of the maximum evoked area, although the exact set of correlations was different: later peak-max frames correlated with later area-onset frames (rho = 0.56; 5.24 SEs), later area-max frames (rho = 0.91; 39.21 SEs), and later area-offset frames (rho = 0.48; 3.89 SEs); longer area durations correlated with larger area-max sizes (r = 0.51; p = 0.00003); earlier area-onset frames correlated with stronger area-max magnitudes (r = −0.54; p = 0.00001).
Interphase correlative characterization
We were also interested in determining whether a spatiotemporal parameter for one phase correlated with a parameter from a different phase (Figs. 2–3, 7, Table 1, compare between phases). A total of 49 simple linear correlations were possible when characterizing thus between two signal phases (e.g., initial dip vs overshoot, initial dip vs undershoot, overshoot vs undershoot) (Table 3). After applying the Bonferroni adjustment to our statistical testing, the smallest Pearson's and Spearman's coefficient values to achieve statistical significance across all three interphase comparisons were |r| = 0.49 and |rho| = 0.44, respectively. In summary, correlations between signal phases were sparse: all but one signal parameter of the initial dip, including the area-max size and area-max magnitude, correlated primarily with area-onset frame of the overshoot; the initial dip did not correlate at all with the undershoot; and the overshoot fared a bit better in correlating with the undershoot. Specific details are provided below.
With one exception, the significant correlations obtained across all interphase comparisons were moderate (r or rho absolute values ranging from 0.44 to 0.64). In addition, the number of significant correlations was few, suggesting that spatiotemporal characteristics of one phase did not correlate much with those of another phase. In fact, despite the large number of correlations investigated, we did not find any significant correlations between the initial dip and the undershoot. Between the initial dip and the subsequent overshoot, all but one signal characteristic of the initial dip were correlated with the onset of the overshoot: later area-max frames (rho = 0.60; 9.08 SEs), later area-offset frames (rho = 0.64; 7.81 SEs), longer area durations (rho = 0.49; 5.06 SEs), later peak-max frames (rho = 0.53; 5.97 SEs), larger area-max sizes (r = 0.50; p = 0.00004), and stronger area-max magnitudes (r = 0.49; p = 0.00007) of the initial dip all correlated with later area-onset frames of the overshoot. When the area of the initial dip disappeared and how long the initial dip area was present also appeared correlated with when the signal reached a maximum for the overshoot: later initial dip area-offset frames with later area-max frames (rho = 0.47; 4.74 SEs) and later peak-max frames (rho = 0.47; 4.04 SEs) of the overshoot; longer initial dip area durations with later area-max frames (rho = 0.46; 4.65 SEs) and later peak-max frames (rho = 0.46; 4.50 SEs) of the overshoot. In contrast to the initial dip, some of the overshoot signal characteristics were able to correlate with those of the undershoot. Similarly to the initial dip versus the overshoot, several signal characteristics of the overshoot correlated with the onset of the subsequent undershoot: later area-max frames (rho = 0.50; 4.98 SEs), later area-offset frames (rho = 0.53; 5.75 SEs), and later peak-max frames (rho = 0.71; 11.02 SEs) of the overshoot all correlated with later area-onset frames of the undershoot. Later peak-max frames of the overshoot also correlated with later area-max frames (rho = 0.49; 4.72 SEs) and later peak-max frames (rho = 0.47; 4.36 SEs) of the undershoot. Earlier area-offset frames (r = −0.51; p = 0.00003) and shorter area durations (r = −0.50; p = 0.00004) of the overshoot correlated with larger area-max sizes of the undershoot. Last, later overshoot area-max frames correlated with later undershoot area-max frames (rho = 0.44; 4.92 SEs) and stronger overshoot area-max magnitudes correlated with stronger undershoot area-max magnitudes (r = 0.50; p = 0.00005).
Discussion
Our findings were obtained using red light illumination and 1 s of 5 Hz single-whisker stimulation, and imaging analysis was performed with an arbitrary threshold of 2.5 × 10⁻⁴ away from 0. Therefore, interpretation of these findings might be constrained by this specific parameter space. Nevertheless, because the three ISOI signal phases studied here (Fig. 1) are very similar to those of BOLD fMRI after a short stimulation, implications of our triphasic signal findings should transcend many of the limitations potentially imposed by our specific parameter space.
Although it was not our aim to elucidate underlying physiological mechanisms, a discussion of the evoked ISOI signal along those lines should still be of interest. As demonstrated previously for ISOI and BOLD fMRI, Overshoot area and magnitude are much larger than the initial dip (Malonek and Grinvald, 1996; Polley et al., 1999; Kim et al., 2000; Shtoyerman et al., 2000; Cannestra et al., 2001; Duong et al., 2000; Yacoub and Hu, 2001; Yacoub et al., 2001; Sheth et al., 2003, 2004, 2005; Nemoto et al., 2004), suggesting substantial “overspill” of overshoot blood flow/volume change beyond that occupied by initial dip Hbr increase and HbO2 decrease (see Introduction). Here, we also report that overshoot area and magnitude are larger and expand these findings by demonstrating the undershoot occupies a middle ground. We should note that fMRI initial dip is not always detectable, specifically in rats (Silva et al., 2000) (for potential reasons and review, see Ances, 2004). Interestingly, the initial dip and undershoot seemed unrelated, although both likely share some underlying signals (Hbr increase) and are consistent with the notion, drawn from both ISOI and BOLD fMRI, that these two phases probably differ in how their respective Hbr increases occur: initial dip Hbr increase caused by oxygen consumption in surrounding capillaries (Frostig et al., 1990; Malonek and Grinvald, 1996; Malonek et al., 1997; Mayhew et al., 2000, 2001; Jones et al., 2001; Devor et al., 2003, 2005; Kasischke et al., 2004; Offenhauser et al., 2005) that is short-lived because of inflow of HbO2-rich blood, versus undershoot Hbr increase caused by more rapid decrease of blood flow than volume, or alternatively to long, continued oxygen consumption after return to baseline of both blood volume and flow (reported so far for only BOLD fMRI) (Buxton et al., 1998; Chen et al., 1998; Mandeville et al., 1998, 1999; Jasdzewski et al., 2003; Lu et al., 2004; Schroeter et al., 2006; Yacoub et al., 2006). Our findings rule out involvement of reoccurring evoked neuronal activity, either suprathreshold (spikes) or subthreshold (LFP), in whatever mechanisms underlie the ISOI undershoot. Different underlying dynamics are also a possible explanation for our modest relationship between initial dip and overshoot because the overshoot is dominated by HbO2 increase and Hbr decrease caused by increased oxygenated blood flow/volume (Frostig et al., 1990; Ogawa et al., 1990a,b; Malonek and Grinvald, 1996; Malonek et al., 1997; Mayhew et al., 1999, 2000, 2001; Shtoyerman et al., 2000; Jones et al., 2001; Devor et al., 2003, 2005; Sheth et al., 2003, 2004, 2005; Nemoto et al., 2004).
Interestingly, we found that neither overshoot spatial extent nor peak magnitude correlated with those of the initial dip, extending previous findings supporting the independence between these two phases by showing that changing stimulus frequency or other parameters affects only the overshoot (Polley et al., 1999; Nemoto et al., 2004). This independence would suggest localized Hbr increase need not play a major role in defining characteristics of increased blood flow or volume to the oxygen-depleted area (for recent reviews on alternative neurovascular coupling mechanisms, see Iadecola, 2004; Logothetis and Wandell, 2004; Lauritzen, 2005; Haydon and Carmignoto, 2006; Raichle and Mintun, 2006). A positive correlation between the peak magnitude of the initial dip versus overshoot was reported after electrical stimulation to the rat hindpaw (Nemoto et al., 2004). However, no correlation was found on a single-trial basis and, furthermore, a weak negative correlation existed when subdividing trials by stimulus type (experiment paradigm most similar to ours); indeed, we found a trend toward weak negative correlation (r = −0.12). No other overshoot parameter correlated with the initial dip spatial extent or peak magnitude except one: later overshoot area onset correlated with larger initial dip spatial extent and peak magnitude, possibly because of the need of the overshoot to gain enough signal strength to “overcome” a stronger and spatially larger initial dip that would evidence itself as a later overshoot area onset.
We were surprised by the results obtained when thresholding at 50% peak magnitude (Fig. 7a), which contrasted sharply with the known overshoot largeness compared with the initial dip for both ISOI and BOLD fMRI. Furthermore, reports of BOLD fMRI undershoot amplitude being weaker than the overshoot, in combination with our finding that peak magnitude and areal extent size are positively correlated for all three ISOI phases, suggest that undershoot areal extent should be smaller, not larger, than the overshoot. Previously, we described the effects on areal extent quantification when using a threshold normalized to peak magnitude (Chen-Bee et al., 2000); briefly, when subgroups of data differ in peak magnitude, then a smaller areal extent is potentially quantified for the subgroup with the stronger peak because a higher threshold value is applied to this subgroup. We posit that our surprising results obtained from thresholding at 50% peak magnitude are such an example, because the overshoot and undershoot peak amplitudes were 3.1 and 1.6 times larger, respectively, than the initial dip.
Because the initial dip is weakest and most transient, imaging the overshoot (Frostig et al., 1990; Duong et al., 2001; Vanzetta et al., 2004; Fukuda et al., 2005) or even the undershoot may be advantageous if temporal resolution and/or signal-to-noise is limited. However, given the error of peak-localization between the three phases, the usefulness of such imaging may be compromised depending on the level of precision needed. It remains to be seen whether our absolute (∼2 mm radius) versus relative (approximately one-third of the entire rat PMBSF) error margin is upheld across larger species and/or cortical regions, which would be considered rather good for the former (Kim et al., 2004), but poor for the latter. Deviation in peak location between ISOI initial dip versus overshoot was also reported previously by Nemoto et al. (2004), and likely arises from strong blood vessel activity that can influence both overshoot and undershoot signal by distorting activity caused by neuronal activation. Our random scatter of overshoot and undershoot peak locations relative to initial dip supports this interpretation because we also observed a randomness in which blood vessels would exhibit the strongest activity (Fig. 8). The poor coregistering of peak locations also suggests that hemodynamic-based functional imaging may not be able to use either the overshoot or undershoot peak location to target peak neuronal activity. The center of either the overshoot or undershoot activity area may prove more useful, although the activity area when it first appears might be more optimal than maximum activity area (Fig. 8).
Additional undershoot/overshoot fluctuations were observed that in most cases appeared unrelated to stimulus delivery and were also present in control trials despite data collection using a long interval between stimulus deliveries (>10 s), a random interval between trials (1–11 s, average of 6 s), and random interlacing of stimulation and control trials. They oscillated primarily in the ∼0.1 Hz range, with a secondary weak oscillation in the ∼1–1.5 Hz range. Spontaneous 0.1 Hz oscillations thought to be related to spontaneous flow oscillations have been reported previously for ISOI (Mayhew et al., 1996, 1999; Jones et al., 2001; Nemoto et al., 2004) and BOLD fMRI (Biswal et al., 1995) (for review, see Fox et al., 2005). Using optical imaging of voltage-sensitive dyes, slow (∼1 Hz) neuronal oscillations were also observed in the cat visual cortex (Arieli et al., 1995) and in both anesthetized and awake rodent somatosensory cortex (Petersen et al., 2003; Ferezou et al., 2006). Even slowly oscillating LFPs (<0.1 Hz) were demonstrated in awake or light-sleeping monkey cortex (Leopold et al., 2003). These findings suggest that both hemodynamic and neuronal activity oscillations can potentially underlie the spontaneous fluctuations reported here. However, we are unable to rule out contribution of rodent respiration rate (50–115 breaths per minute) to our observed weak oscillation in the ∼1–1.5 Hz range and, furthermore, such oscillations were not obvious in our PSTH and LFP control data. More research is needed to clarify the conditions under which one and/or the other source of 0.1 Hz oscillations is dominant, and under what conditions spontaneous activity can even appear as functional columns such as orientation columns in the cat visual cortex (Kenet et al., 2003). The prevailing presence of spontaneous fluctuations has two implications for hemodynamic-based imaging: (1) collecting control trials to confirm a return to stable baseline, and (2) using the reference frame for normalization purposes (used here and in imaging studies in general). Our results would suggest that collecting control trials need not succeed in such a confirmation at the expense of prolonging experiments if fluctuations in spontaneous activity are ongoing and inherent. With regards to using a prestimulus reference frame, although our highly reproducible triphasic signal obtained across rats would suggest otherwise, it is possible the reference frame can contain either large (both magnitude and spatial) spontaneous activity and/or residual signal from the previous stimulus delivery, particularly when the interval between stimulus deliveries is short, that may have implications for analysis of data when normalized to the prestimulus frame. These issues will be addressed in a separate publication.
Footnotes
This work was supported by National Institutes of Health–National Institute of Neurological Disorders and Stroke Grants NS-43165 and NS-48350. We thank Sylvia Soo and Duy Phan for assistance with data analysis, Drs. Bernard Choi and David Abookasis for advice on spectral analysis, and current laboratory members for helpful discussions.
References
- Ances BM. Coupling of changes in cerebral blood flow with neural activity: what must initially dip must come back up. J Cereb Blood Flow Metab. 2004;24:1–6. doi: 10.1097/01.WCB.0000103920.96801.12. [DOI] [PubMed] [Google Scholar]
- Ances BM, Buerk DG, Greenberg JH, Detre JA. Temporal dynamics of the partial pressure of brain tissue oxygen during functional forepaw stimulation in rats. Neurosci Lett. 2001;306:106–110. doi: 10.1016/s0304-3940(01)01868-7. [DOI] [PubMed] [Google Scholar]
- Arieli A, Shoham D, Hildesheim R, Grinvald A. Coherent spatiotemporal patterns of ongoing activity revealed by real-time optical imaging coupled with single-unit recording in the cat visual cortex. J Neurophysiol. 1995;73:2072–2093. doi: 10.1152/jn.1995.73.5.2072. [DOI] [PubMed] [Google Scholar]
- Biswal B, Yetkin FZ, Haughton VM, Hyde JS. Functional connectivity in the motor cortex of resting human brain using echo-planar MRI. Magn Reson Med. 1995;34:537–541. doi: 10.1002/mrm.1910340409. [DOI] [PubMed] [Google Scholar]
- Brett-Green BA, Chen-Bee CH, Frostig RD. Comparing the functional representations of central and border whiskers in rat primary somatosensory cortex. J Neurosci. 2001;21:9944–9954. doi: 10.1523/JNEUROSCI.21-24-09944.2001. [DOI] [PMC free article] [PubMed] [Google Scholar]
- Buxton RB, Frank LR, Wong EC, Siewert B, Warach S, Edelman RR. A general kinetic model for quantitative perfusion imaging with arterial spin labeling. Magn Reson Med. 1998;40:383–396. doi: 10.1002/mrm.1910400308. [DOI] [PubMed] [Google Scholar]
- Cannestra AF, Pouratian N, Bookheimer SY, Martin NA, Beckerand DP, Toga AW. Temporal spatial differences observed by functional MRI and human intraoperative optical imaging. Cereb Cortex. 2001;11:773–782. doi: 10.1093/cercor/11.8.773. [DOI] [PubMed] [Google Scholar]
- Chen W, Zhu XH, Kato T, Andersen P, Ugurbil K. Spatial and temporal differentiation of fMRI BOLD response in primary visual cortex of human brain during sustained visual simulation. Magn Reson Med. 1998;39:520–527. doi: 10.1002/mrm.1910390404. [DOI] [PubMed] [Google Scholar]
- Chen-Bee CH, Kwon MC, Masino SA, Frostig RD. Areal extent quantification of functional representations using intrinsic signal optical imaging. J Neurosci Methods. 1996;68:27–37. [PubMed] [Google Scholar]
- Chen-Bee CH, Polley DB, Brett-Green B, Prakash N, Kwon MC, Frostig RD. Visualizing and quantifying evoked cortical activity assessed with intrinsic signal imaging. J Neurosci Methods. 2000;97:157–173. doi: 10.1016/s0165-0270(00)00180-1. [DOI] [PubMed] [Google Scholar]
- Devor A, Dunn AK, Andermann ML, Ulbert I, Boas DA, Dale AM. Coupling of total hemoglobin concentration, oxygenation, and neural activity in rat somatosensory cortex. Neuron. 2003;39:353–359. doi: 10.1016/s0896-6273(03)00403-3. [DOI] [PubMed] [Google Scholar]
- Devor A, Ulbert I, Dunn AK, Narayanan SN, Jones SR, Andermann ML, Boas DA, Dale AM. Coupling of the cortical hemodynamic response to cortical and thalamic neuronal activity. Proc Natl Acad Sci USA. 2005;102:3822–3827. doi: 10.1073/pnas.0407789102. [DOI] [PMC free article] [PubMed] [Google Scholar]
- Duong TQ, Kim DS, Ugurbil K, Kim SG. Spatiotemporal dynamics of the BOLD fMRI signals: toward mapping submillimeter cortical columns using the early negative response. Magn Reson Med. 2000;44:231–242. doi: 10.1002/1522-2594(200008)44:2<231::aid-mrm10>3.0.co;2-t. [DOI] [PubMed] [Google Scholar]
- Duong TQ, Kim DS, Ugurbil K, Kim SG. Localized cerebral blood flow response at submillimeter columnar resolution. Proc Natl Acad Sci USA. 2001;98:10904–10909. doi: 10.1073/pnas.191101098. [DOI] [PMC free article] [PubMed] [Google Scholar]
- Ferezou I, Bolea S, Petersen CC. Visualizing the cortical representation of whisker touch: voltage-sensitive dye imaging in freely moving mice. Neuron. 2006;50:617–629. doi: 10.1016/j.neuron.2006.03.043. [DOI] [PubMed] [Google Scholar]
- Fox MD, Snyder AZ, Vincent JL, Corbetta M, Van Essen DC, Raichle ME. The human brain is intrinsically organized into dynamic, anticorrelated functional networks. Proc Natl Acad Sci USA. 2005;102:9673–9678. doi: 10.1073/pnas.0504136102. [DOI] [PMC free article] [PubMed] [Google Scholar]
- Frahm J, Kruger G, Merboldt KD, Kleinschmidt A. Dynamic uncoupling and recoupling of perfusion and oxidative metabolism during focal brain activation in man. Magn Reson Med. 1996;35:143–148. doi: 10.1002/mrm.1910350202. [DOI] [PubMed] [Google Scholar]
- Frostig RD, Lieke EE, Ts'o DY, Grinvald A. Cortical functional architecture and local coupling between neuronal activity and the microcirculation revealed by in vivo high-resolution optical imaging of intrinsic signals. Proc Natl Acad Sci USA. 1990;87:6082–6086. doi: 10.1073/pnas.87.16.6082. [DOI] [PMC free article] [PubMed] [Google Scholar]
- Fukuda M, Rajagopalan UM, Homma R, Matsumoto M, Nishizaki M, Tanifuji M. Localization of activity-dependent changes in blood volume to submillimeter-scale functional domains in cat visual cortex. Cereb Cortex. 2005;15:823–833. doi: 10.1093/cercor/bhh183. [DOI] [PubMed] [Google Scholar]
- Grinvald A, Lieke E, Frostig RD, Gilbert CD, Wiesel TN. Functional architecture of cortex revealed by optical imaging of intrinsic signals. Nature. 1986;324:361–364. doi: 10.1038/324361a0. [DOI] [PubMed] [Google Scholar]
- Haydon PG, Carmignoto G. Astrocyte control of synaptic transmission and neurovascular coupling. Physiol Rev. 2006;86:1009–1031. doi: 10.1152/physrev.00049.2005. [DOI] [PubMed] [Google Scholar]
- Iadecola C. Neurovascular regulation in the normal brain and in Alzheimer's disease. Nat Rev Neurosci. 2004;5:347–360. doi: 10.1038/nrn1387. [DOI] [PubMed] [Google Scholar]
- Jasdzewski G, Strangman G, Wagner J, Kwong KK, Poldrack RA, Boas DA. Differences in the hemodynamic response to event-related motor and visual paradigms as measured by near-infrared spectroscopy. NeuroImage. 2003;20:479–488. doi: 10.1016/s1053-8119(03)00311-2. [DOI] [PubMed] [Google Scholar]
- Jones M, Berwick J, Johnston D, Mayhew J. Concurrent optical imaging spectroscopy and laser-Doppler flowmetry: the relationship between blood flow, oxygenation, and volume in rodent barrel cortex. NeuroImage. 2001;13:1002–1015. doi: 10.1006/nimg.2001.0808. [DOI] [PubMed] [Google Scholar]
- Kasischke KA, Vishwasrao HD, Fisher PJ, Zipfel WR, Webb WW. Neural activity triggers neuronal oxidative metabolism followed by astrocytic glycolysis. Science. 2004;305:99–103. doi: 10.1126/science.1096485. [DOI] [PubMed] [Google Scholar]
- Kenet T, Bibitchkov D, Tsodyks M, Grinvald A, Arieli A. Spontaneously emerging cortical representations of visual attributes. Nature. 2003;425:954–956. doi: 10.1038/nature02078. [DOI] [PubMed] [Google Scholar]
- Kim DS, Duong TQ, Kim SG. High-resolution mapping of iso-orientation columns by fMRI. Nat Neurosci. 2000;3:164–169. doi: 10.1038/72109. [DOI] [PubMed] [Google Scholar]
- Kim DS, Ronen I, Olman C, Kim SG, Ugurbil K, Toth LJ. Spatial relationship between neuronal activity and BOLD functional MRI. NeuroImage. 2004;21:876–885. doi: 10.1016/j.neuroimage.2003.10.018. [DOI] [PubMed] [Google Scholar]
- Lauritzen M. Reading vascular changes in brain imaging: is dendritic calcium the key? Nat Rev Neurosci. 2005;6:77–85. doi: 10.1038/nrn1589. [DOI] [PubMed] [Google Scholar]
- Leopold DA, Murayama Y, Logothetis NK. Very slow activity fluctuations in monkey visual cortex: implications for functional brain imaging. Cereb Cortex. 2003;13:422–433. doi: 10.1093/cercor/13.4.422. [DOI] [PubMed] [Google Scholar]
- Logothetis NK, Wandell BA. Interpreting the BOLD signal. Annu Rev Physiol. 2004;66:735–769. doi: 10.1146/annurev.physiol.66.082602.092845. [DOI] [PubMed] [Google Scholar]
- Lu H, Golay X, Pekar JJ, Van Zijl PC. Sustained poststimulus elevation in cerebral oxygen utilization after vascular recovery. J Cereb Blood Flow Metab. 2004;24:764–770. doi: 10.1097/01.WCB.0000124322.60992.5C. [DOI] [PubMed] [Google Scholar]
- Malonek D, Grinvald A. Interactions between electrical activity and cortical microcirculation revealed by imaging spectroscopy: implications for functional brain mapping. Science. 1996;272:551–554. doi: 10.1126/science.272.5261.551. [DOI] [PubMed] [Google Scholar]
- Malonek D, Dirnagl U, Lindauer U, Yamada K, Kanno I, Grinvald A. Vascular imprints of neuronal activity: relationships between the dynamics of cortical blood flow, oxygenation, and volume changes following sensory stimulation. Proc Natl Acad Sci USA. 1997;94:14826–14831. doi: 10.1073/pnas.94.26.14826. [DOI] [PMC free article] [PubMed] [Google Scholar]
- Mandeville JB, Marota JJ, Kosofsky BE, Keltner JR, Weissleder R, Rosen BR, Weisskoff RM. Dynamic functional imaging of relative cerebral blood volume during rat forepaw stimulation. Magn Reson Med. 1998;39:615–624. doi: 10.1002/mrm.1910390415. [DOI] [PubMed] [Google Scholar]
- Mandeville JB, Marota JJ, Ayata C, Zaharchuk G, Moskowitz MA, Rosen BR, Weisskoff RM. Evidence of a cerebrovascular postarteriole windkessel with delayed compliance. J Cereb Blood Flow Metab. 1999;19:679–689. doi: 10.1097/00004647-199906000-00012. [DOI] [PubMed] [Google Scholar]
- Masino SA, Kwon MC, Dory Y, Frostig RD. Characterization of functional organization within rat barrel cortex using intrinsic signal optical imaging through a thinned skull. Proc Natl Acad Sci USA. 1993;90:9998–10002. doi: 10.1073/pnas.90.21.9998. [DOI] [PMC free article] [PubMed] [Google Scholar]
- Mayhew J, Zheng Y, Hou Y, Vuksanovic B, Berwick J, Askew S, Coffey P. Spectroscopic analysis of changes in remitted illumination: the response to increased neural activity in brain. NeuroImage. 1999;10:304–326. doi: 10.1006/nimg.1999.0460. [DOI] [PubMed] [Google Scholar]
- Mayhew J, Johnston D, Berwick J, Jones M, Coffey P, Zheng Y. Spectroscopic analysis of neural activity in brain: increased oxygen consumption following activation of barrel cortex. NeuroImage. 2000;12:664–675. doi: 10.1006/nimg.2000.0656. [DOI] [PubMed] [Google Scholar]
- Mayhew J, Johnston D, Martindale J, Jones M, Berwick J, Zheng Y. Increased oxygen consumption following activation of brain: theoretical footnotes using spectroscopic data from barrel cortex. NeuroImage. 2001;13:975–987. doi: 10.1006/nimg.2001.0807. [DOI] [PubMed] [Google Scholar]
- Mayhew JE, Askew S, Zheng Y, Porrill J, Westby GW, Redgrave P, Rector DM, Harper RM. Cerebral vasomotion: a 0.1-Hz oscillation in reflected light imaging of neural activity. NeuroImage. 1996;4:183–193. doi: 10.1006/nimg.1996.0069. [DOI] [PubMed] [Google Scholar]
- Nemoto M, Sheth S, Guiou M, Pouratian N, Chen JW, Toga AW. Functional signal- and paradigm-dependent linear relationships between synaptic activity and hemodynamic responses in rat somatosensory cortex. J Neurosci. 2004;24:3850–3861. doi: 10.1523/JNEUROSCI.4870-03.2004. [DOI] [PMC free article] [PubMed] [Google Scholar]
- Offenhauser N, Thomsen K, Caesar K, Lauritzen M. Activity-induced tissue oxygenation changes in rat cerebellar cortex: interplay of postsynaptic activation and blood flow. J Physiol (Lond) 2005;565:279–294. doi: 10.1113/jphysiol.2005.082776. [DOI] [PMC free article] [PubMed] [Google Scholar]
- Ogawa S, Lee TM, Nayak AS, Glynn P. Oxygenation-sensitive contrast in magnetic resonance image of rodent brain at high magnetic fields. Magn Reson Med. 1990a;14:68–78. doi: 10.1002/mrm.1910140108. [DOI] [PubMed] [Google Scholar]
- Ogawa S, Lee TM, Kay AR, Tank DW. Brain magnetic resonance imaging with contrast dependent on blood oxygenation. Proc Natl Acad Sci USA. 1990b;87:9868–9872. doi: 10.1073/pnas.87.24.9868. [DOI] [PMC free article] [PubMed] [Google Scholar]
- Petersen CC, Hahn TT, Mehta M, Grinvald A, Sakmann B. Interaction of sensory responses with spontaneous depolarization in layer 2/3 barrel cortex. Proc Natl Acad Sci USA. 2003;100:13638–13643. doi: 10.1073/pnas.2235811100. [DOI] [PMC free article] [PubMed] [Google Scholar]
- Polley DB, Chen-Bee CH, Frostig RD. Varying the degree of single-whisker stimulation differentially affects phases of intrinsic signals in rat barrel cortex. J Neurophysiol. 1999;81:692–701. doi: 10.1152/jn.1999.81.2.692. [DOI] [PubMed] [Google Scholar]
- Raichle ME, Mintun MA. Brain work and brain imaging. Annu Rev Neurosci. 2006;29:449–476. doi: 10.1146/annurev.neuro.29.051605.112819. [DOI] [PubMed] [Google Scholar]
- Schroeter ML, Kupka T, Mildner T, Uludag K, von Cramon DY. Investigating the poststimulus undershoot of the BOLD signal–a simultaneous fMRI and fNIRS study. NeuroImage. 2006;30:349–358. doi: 10.1016/j.neuroimage.2005.09.048. [DOI] [PubMed] [Google Scholar]
- Sheth S, Nemoto M, Guiou M, Walker M, Pouratian N, Toga AW. Evaluation of coupling between optical intrinsic signals and neuronal activity in rat somatosensory cortex. NeuroImage. 2003;19:884–894. doi: 10.1016/s1053-8119(03)00086-7. [DOI] [PubMed] [Google Scholar]
- Sheth SA, Nemoto M, Guiou M, Walker M, Pouratian N, Hageman N, Toga AW. Columnar specificity of microvascular oxygenation and volume responses: implications for functional brain mapping. J Neurosci. 2004;24:634–641. doi: 10.1523/JNEUROSCI.4526-03.2004. [DOI] [PMC free article] [PubMed] [Google Scholar]
- Sheth SA, Nemoto M, Guiou MW, Walker MA, Toga AW. Spatiotemporal evolution of functional hemodynamic changes and their relationship to neuronal activity. J Cereb Blood Flow Metab. 2005;25:830–841. doi: 10.1038/sj.jcbfm.9600091. [DOI] [PubMed] [Google Scholar]
- Shtoyerman E, Arieli A, Slovin H, Vanzetta I, Grinvald A. Long-term optical imaging and spectroscopy reveal mechanisms underlying the intrinsic signal and stability of cortical maps in V1 of behaving monkeys. J Neurosci. 2000;20:8111–8121. doi: 10.1523/JNEUROSCI.20-21-08111.2000. [DOI] [PMC free article] [PubMed] [Google Scholar]
- Silva AC, Lee SP, Iadecola C, Kim SG. Early temporal characteristics of cerebral blood flow and deoxyhemoglobin changes during somatosensory stimulation. J Cereb Blood Flow Metab. 2000;20:201–206. doi: 10.1097/00004647-200001000-00025. [DOI] [PubMed] [Google Scholar]
- Thompson JK, Peterson MR, Freeman RD. Single-neuron activity and tissue oxygenation in the cerebral cortex. Science. 2003;299:1070–1072. doi: 10.1126/science.1079220. [DOI] [PubMed] [Google Scholar]
- Thompson JK, Peterson MR, Freeman RD. High-resolution neurometabolic coupling revealed by focal activation of visual neurons. Nat Neurosci. 2004;7:919–920. doi: 10.1038/nn1308. [DOI] [PubMed] [Google Scholar]
- Ts'o DY, Frostig RD, Lieke EE, Grinvald A. Functional organization of primate visual cortex revealed by high resolution optical imaging. Science. 1990;249:417–420. doi: 10.1126/science.2165630. [DOI] [PubMed] [Google Scholar]
- Vanzetta I, Grinvald A. Increased cortical oxidative metabolism due to sensory stimulation: implications for functional brain imaging. Science. 1999;286:1555–1558. doi: 10.1126/science.286.5444.1555. [DOI] [PubMed] [Google Scholar]
- Vanzetta I, Slovin H, Omer DB, Grinvald A. Columnar resolution of blood volume and oximetry functional maps in the behaving monkey; implications for FMRI. Neuron. 2004;42:843–854. doi: 10.1016/j.neuron.2004.04.004. [DOI] [PubMed] [Google Scholar]
- Yacoub E, Hu X. Detection of the early decrease in fMRI signal in the motor area. Magn Reson Med. 2001;45:184–190. doi: 10.1002/1522-2594(200102)45:2<184::aid-mrm1024>3.0.co;2-c. [DOI] [PubMed] [Google Scholar]
- Yacoub E, Shmuel A, Pfeuffer J, Van De Moortele PF, Adriany G, Ugurbil K, Hu X. Investigation of the initial dip in fMRI at 7 Tesla. NMR Biomed. 2001;14:408–412. doi: 10.1002/nbm.715. [DOI] [PubMed] [Google Scholar]
- Yacoub E, Ugurbil K, Harel N. The spatial dependence of the poststimulus undershoot as revealed by high-resolution BOLD- and CBV-weighted fMRI. J Cereb Blood Flow Metab. 2006;26:634–644. doi: 10.1038/sj.jcbfm.9600239. [DOI] [PubMed] [Google Scholar]