Abstract
In taste bud cells, two different T1R heteromeric taste receptors mediate signal transduction of sugars (the canonical “sweet” taste receptor, T1R2 + T1R3) and l-amino acids (the T1R1 + T1R3 receptor). The T1R1 + T1R3 receptor is thought to mediate what is considered the fifth basic taste quality “umami.” However, a subset of l-amino acids is “sweet tasting” to humans and appears to possess a “sucrose-like” taste quality to nonhuman mammals. This suggests, to varying degrees, that all of these compounds activate a single neural channel that leads to the perception of sweetness.
The experiments detailed here were designed to test the ability of mice to distinguish between sucrose and various others sugars and l-amino acids in operant taste discrimination tasks. Mice had at least some difficulty discriminating sucrose from l-serine, l-threonine, maltose, fructose, and glucose. For example, when concentration effects are taken into consideration, mice discriminated poorly, if at all, sucrose from glucose or fructose and, to a lesser extent maltose, suggesting that sugars generate a unitary perceptual quality. However, mice were able to reliably discriminate sucrose from l-serine and l-threonine. Data gathered using a conditioned taste aversion assay also suggest that, although qualitatively similar to the taste of sucrose, l-serine and l-threonine generate distinctive percepts.
In conclusion, it appears that some signals from taste receptor proteins binding with sugars and some l-amino acids converge somewhere along the gustatory neuraxis. However, the results of these experiments also imply that sweet-tasting l-amino acids may possess qualitative taste characteristics that are distinguishable from the prototypical sweetener sucrose.
Keywords: taste, sweeteners, mice, perception, coding, behavior
Introduction
One of nature's greatest gifts is the sensation of sweetness. The rewarding experience of sweet taste appears to have evolved to promote the ingestion of caloric substances by animals. Accordingly, understanding the neural mechanisms responsible for sweet taste perception and its rewarding effects has been a focus of intense study by researchers.
Recently, an understanding of the neural basis of “sweetener” perception has been propelled by remarkable discoveries regarding tastant detection in the oral cavity. A gene family has been identified that encodes for three receptor proteins (T1R1, T1R2, and T1R3) that are expressed in a subset of taste bud cells (TBCs) (Hoon et al., 1999; Bachmanov et al., 2001b; Kitagawa et al., 2001; Max et al., 2001; Montmayeur et al., 2001; Nelson et al., 2001; Sainz et al., 2001; Li et al., 2002b). The T1R3 protein has been shown to combine with T1R1 or T1R2 to form functional receptor complexes. The T1R2 and T1R3 subunits combine to form a receptor (T1R2 + T1R3) postulated to mediate “sweet” taste. It is activated by sugars, artificial sweeteners, a subset of d-amino acids, and glycine (Nelson et al., 2001; Li et al., 2002a; Zhao et al., 2003). The T1R1 and T1R3 subunits combine to form a receptor (T1R1 + T1R3), thought not to participate in sweet taste perception but instead is thought to mediate what is considered the fifth basic taste quality “umami.” In the mouse, this complex is activated by all 20 common l-amino acids (Nelson et al., 2002). However, some of these stimuli only activate the receptor in the presence of the umami taste potentiator inosine monophosphate.
These heteromeric receptors were reported to be expressed in mostly nonoverlapping sets of TBCs (Hoon et al., 1999; Nelson et al., 2001) potentially providing the receptor segregation necessary for independent perceptual processing of the signals generated by their ligands (i.e., sweet vs umami taste). However, even if compounds bind with different receptors, their signals can converge downstream, leading to a loss of perceptual discriminability. Indeed, despite the reported receptor complex segregation, a subset of d- and l-amino acids, in addition to sugars, are “sweet tasting” to humans (Schiffman and Dackis, 1975; Schiffman et al., 1981; Shallenberger, 1993) and, based on the results from conditioned taste aversion (CTA) tests, appear to possess a “sucrose-like” taste quality to rodents (Ninomiya et al., 1984b; Kasahara et al., 1987; Yamamoto et al., 1988; Danilova et al., 1998). These data suggest that at least some of the afferent neural input from TBCs that express different T1R heteromers may actual converge somewhere along the gustatory neuraxis.
Perceptions, of any sensory modality, are difficult to study because these experiences cannot be directly measured and must be inferred from behavior. In animals, the systematic study of these perceptions is accomplished by the use of behavioral procedures that are designed to characterize the relationship between physical stimuli and sensation. Our objective was to determine the degree to which receptor selectivity predicts the relative discriminability of various sweeteners, by testing whether C57BL/6J (B6) mice can discriminate between a variety of sugars and putative sweeteners using an operant discrimination paradigm. These tasks were designed to assess whether pairs of putative sweeteners would be treated by animals as perceptually identical. In addition, CTA generalization tests were conducted to assess the relative similarity of these sweeteners, as well as to provide information to aid in the interpretation of the discrimination data.
Materials and Methods
Subjects
Adult B6 mice (The Jackson Laboratory, Bar Harbor, ME), ∼8–10 weeks of age on arrival, served as subjects for both the discrimination (n = 6) and CTA generalization (n = 44) experiments. The B6 strain was chosen because it (1) is the most common mouse strain used in taste research, (2) has been characterized previously as a “taster” strain (Capretta, 1970; Pelz et al., 1973; Fuller, 1974; Lush, 1989; Capeless and Whitney, 1995; Bachmanov et al., 1996), and (3) serves as a background strain in many knock-out, congenic, and transgenic manipulations (Damak et al., 2003; Zhao et al., 2003). Six to 7 d after arrival, mice were put on a restricted water-access schedule with fluid available during testing only. For the discrimination experiment, purified water (Elix 10; Millipore, Billerica, MA) was freely available on the home cage when the animals were not being tested (e.g., weekends). All mice that dropped below 85% of hydrated weight while on the water-restriction schedule received 1 ml of supplemental water ∼2 h after the end of the testing session. All procedures were approved by the Institutional Animal Care and Use Committee at the University of Florida.
Discrimination experiment
Taste stimuli
All solutions were prepared daily with purified water and reagent grade chemicals and were presented at room temperature. For the discrimination experiment, stimuli consisted of various concentrations of sucrose, glucose, maltose, fructose, (Fisher Scientific, Atlanta, GA), l-serine, and l-threonine (Sigma, St. Louis, MO). In addition, sodium chloride (NaCl) (Fisher Scientific) was used as a stimulus to provide a contrast that could be easily discriminated from the standard stimulus during training (see below, Experimental design).
Sucrose, fructose, and glucose were chosen because (1) they are prototypical sweeteners that are commonly used in taste experiments, (2) with the exception of fructose, they have been used to differentiate taster (e.g., B6) from nontaster mice in two-bottle preference and intake tests (Stockton and Whitney, 1974; Ramirez and Fuller, 1976; Lush, 1989; Bachmanov et al., 1996, 1997, 2001a), as well as in an operant discrimination task (Eylam and Spector, 2004), and (3) they are thought to exclusively bind with the T1R2 + T1R3, but not the T1R1 + T1R3, receptor complex (Nelson et al., 2001, 2002; Zhao et al., 2003). l-Serine was chosen because (1) there is evidence that at least in some rodents this compound shares a perceptual quality with sucrose (Kasahara et al., 1987), (2) it is preferred by some strains of mice at midrange concentrations in two-bottle preference tests (Iwasaki et al., 1985), and (3) it appears to bind primarily with the T1R1 + T1R3 but only poorly, if at all, with the T11R2 + T1R3 receptor complex (Nelson et al., 2002; Zhao et al., 2003). The choice of l-threonine was based on the fact that, like l-serine, it (1) reportedly gives rise to a sweet taste in humans (Schiffman and Dackis, 1975; Schiffman et al., 1981; Shallenberger, 1993), (2) is preferred, at certain concentrations, by rodents (Pritchard and Scott, 1982; Iwasaki et al., 1985), and (3) appears to bind primarily with the T1R1 + T1R3, but not with the T1R2 + T1R3, receptor complex (Nelson et al., 2002).
Concentrations of each stimulus tested are listed in Table 1. These were chosen on the basis of the available behavioral and electrophysiological data and with the intent of representing the dynamic range of responsiveness for B6 mice. The concentrations of sucrose and fructose selected encompass the dynamic range of behavioral responsiveness for B6 mice, as measured in a brief-access taste test (Dotson and Spector, 2004; Dotson et al., 2005; Glendinning et al., 2005a,b). Glucose concentrations were chosen based on the diminished neural and behavioral sensitivity of B6 mice to glucose relative to sucrose (Ninomiya et al., 1984a; Eylam and Spector, 2004). The maltose concentrations encompassed the range of behavioral preference for C57BL/6ByJ mice, as measured using a two-bottle intake taste test (Bachmanov et al., 2001a).
Table 1.
Stimulus concentrations
| Concentrations | |
|---|---|
| Sucrose | 0.2, 0.4, 0.6 m |
| Glucose | 0.5, 1.0, 2.0 m |
| Maltose | 0.2, 0.4, 0.6 m |
| Fructose | 0.3, 0.6, 1.0 m |
| l-Serine | 0.4, 0.6, 1.0 m |
| l-Threonine | 0.175, 0.35, 0.7 m |
| NaCl | 0.2, 0.4, 0.6 m |
Very little data have been gathered on the behavioral responsiveness of mice to l-amino acids. Thus, the choice of l-amino acid concentrations was based on the available neural data for the various rodent species tested with these compounds. Whole-nerve responses of the chorda tympani (CT) in ddy mice monotonically increase as the concentration of l-serine applied to the anterior tongue is raised (0.01–1 m; neural threshold, 0.003–0.01 m) (Iwasaki et al., 1985). A similar concentration–response relationship is observed for the CT in Sprague Dawley rats when l-threonine is the stimulus (0.003–0.7 m; neural threshold, 0.02 m) (Pritchard and Scott, 1982). Inoue et al. (2001) reported the CT response threshold for l-threonine in C57BL/6ByJ mice was at 0.1 m. Thus, the concentrations chosen for the l-amino acids stimuli are assumed to be within the dynamic range of responsiveness for rodents. NaCl concentrations represented the range of behavioral responsiveness for C57BL/6J mice as measured in an operant conditioning-based taste detection threshold paradigm (Eylam and Spector, 2002, 2003) and for C57BL/6ByJ mice as measured in a brief-access taste test (Dotson et al., 2005) and were also thought to be within the dynamic range of responsiveness for the substrain of B6 mice used here.
It is important to stress that the broad range of concentrations chosen helps guarantee that the intensity and other physical properties of the stimuli will vary, rendering these signals less reliable cues while promoting quality as the consistent discriminable feature.
Apparatus
In the discrimination experiment, mice were trained and tested in a specially designed computer-controlled gustometer modified for use with mice (Spector et al., 1990; Eylam and Spector, 2002, 2003, 2004, 2005) (for details, see supplemental data, available at www.jneurosci.org as supplemental material).
Experimental design
Trial structure and stimulus presentation.
Session length was 25 min. During this time, each mouse was allowed to complete as many trials as possible. Each trial comprised four phases: (1) the sample phase, (2) the decision phase, (3) the reinforcement phase, and (4) the intertrial interval. The sample phase began when the mouse licked from the dry sample spout when it was available in front of the slot twice within 250 ms to receive the sample. The mouse was allowed five licks or 2 s of stimulus access, whichever came first, before the sample spout was rotated away from the slot. When the sample spout rotated away from the slot, the decision phase began. During this phase, the mouse was required to choose from which reinforcement spout to lick. The reinforcement phase began as soon as contact was made with one of the side spouts. If a correct choice was made, the mouse was allowed 15 licks or 4 s access to water (i.e., reinforcement). If an incorrect choice was made or no response was initiated within 10 s, the mouse received a 30 s timeout, during which no fluid was delivered (i.e., punishment). The intertrial interval lasted ∼6 s. Presentation order was randomized without replacement in blocks so that each concentration of the test compounds was presented exactly once before the initiation of the subsequent block. The procedures used to train the mice to perform in the discrimination task have been described in detail previously (Eylam and Spector, 2004) (for details, see supplemental data, available at www.jneurosci.org as supplemental material).
Testing.
After training, mice were initially tested on their ability to discriminate sucrose (standard stimulus) from sodium chloride (comparison stimulus). After successful completion of this discrimination test, the comparison stimulus was changed from NaCl to one of the other compounds listed in Table 2. When this discrimination was completed, the comparison stimulus was changed for a second time. To measure and maintain stimulus control, a series of sessions was interposed between each “test” discrimination, during which the animals were retested on the NaCl versus sucrose (standard stimulus) discrimination task. These were referred to as “stimulus-control” (SC) sessions. This process was continued until all comparison stimuli had been tested versus sucrose (Table 2). On average, mice completed ∼40 trials per session during testing. A water control session was conducted at the end of the experiment in which all reservoirs were filled with purified water; half were assigned to the reinforcement spout associated with the comparison stimuli, and the other half were assigned to the spout associated with the standard stimulus. If the performance of the animals in the discrimination task relied on chemical cues alone, then mice should be unable to discriminate the stimuli because all reservoirs were filled with the same solution, which served as the solvent (i.e., water). This manipulation helps us determine whether extraneous cues unrelated to the chemical nature of the stimulus could have guided performance during testing.
Table 2.
Order of stimulus discrimination pairings
| Standard stimulus |
Comparison stimuli |
||||||
|---|---|---|---|---|---|---|---|
| Sucrose | NaCl | l-Serine | Glucose | Maltose | l-Serine | Fructose | l-Threonine |
Data analysis
Discriminability was evaluated using the overall proportion of correct responses as the primary dependent measure. Overall performance was assessed by collapsing all trials across both stimuli and concentrations. Concentration effects were analyzed within each stimulus. These effects, as well as overall performance, were tested against chance using one-sample t tests. Performance across weeks was statistically analyzed using ANOVAs. Only trials in which a response was made were used in the analyses. Although this happened infrequently, when technical problems with the gustometer occurred during an animal's session, the data were discarded from the analyses (including the last 2 weeks of sucrose vs NaCl testing; 432 individual sessions were run over the course of the discrimination experiment; 16 sessions were removed). Overall discriminability at 50% correct equals chance performance. Performance approaching this value indicated a failure to discriminate.
CTA experiment
Taste stimuli
For the CTA experiment, the compounds that served as conditioned stimuli (CSs) were sucrose, l-serine, and l-threonine. The panel of test stimuli (TSs) was composed of various concentrations of sucrose, l-serine, l-threonine, NaCl, citric acid (Fisher Scientific), and quinine hydrochloride (QHCl) (Sigma). Sucrose, NaCl, citric acid, and QHCl were chosen as TSs because they are frequently used as prototypical representatives of compounds that elicit a sweet, salty, sour, and bitter taste, respectively, in humans, and they are thought to represent similar qualitative categories in rodents (Schiffman and Erickson, 1980; Hettinger and Frank, 1985; Frank, 1989). l-Serine, l-threonine, and sucrose were also used as TSs to allow for the assessment of any generalization asymmetries. Asymmetrical relationships can arise when the conditioning and test stimuli, albeit similar, are not qualitatively identical. Yet generalization, or the lack thereof, can also occur based on stimulus characteristics other than quality (e.g., stimulus intensity) (Nowlis, 1974). As a result, if the conditioning and test stimuli evoke a qualitatively identical percept but the TS is of a low intensity relative to the CS, then expression of the learned aversion may be weak or nonexistent (Spector and Grill, 1988; Spector, 2000). Thus, the use of more than one concentration increases the confidence that a learned aversion toward a CS will generalize to at least one of the concentrations of a qualitatively similar TS. In view of this, two concentrations of each compound were included in the test stimulus arrays. These concentrations are listed in Table 3. The concentrations chosen for l-serine, l-threonine, and sucrose were the same as those used in the discrimination experiment. For QHCl, citric acid, and NaCl, an attempt was made to choose concentrations that would produce comparable sensation magnitudes. Stimulus concentrations that produced approximately equivalent degrees of lick avoidance (tastant/water lick ratio: taste stimulus licks/water licks) were chosen from the dynamic range of behavioral responsiveness for C57BL/By6J mice, as measured in a brief-access taste test (Dotson et al., 2005). For the high concentration, stimuli that produced an ∼50% decrease in the lick rate of animals, relative to water, were chosen. For the low concentration, those that produced an ∼25% decrease were used. These values were chosen so that avoidance in conditioned mice relative to unconditioned mice would be evident; if the concentrations were higher, then the natural, unconditioned avoidance of these compounds by the mice might obscure the ability to discern the conditioned responses to the stimuli.
Table 3.
Test stimulus arrays for the three conditioning groups
| Test stimuli |
|||||||||||||||
|---|---|---|---|---|---|---|---|---|---|---|---|---|---|---|---|
| Sucrose |
l-Threonine |
l-Serine |
QHCla |
Citric acida |
NaCla |
||||||||||
| CSb | High | Low | CSb | High | Low | CSb | High | Low | High | Low | High | Low | High | Low | |
| Group 1 | 0.4 m | 0.6 m | 0.2 m | 0.7 m | 0.175 m | 1.0 m | 0.4 m | 0.625 mm | 0.325 mm | 13.25 mm | 6.25 mm | 0.375 m | 0.175 m | ||
| Group 2 | 0.6 m | 0.2 m | 0.7 m | 0.175 m | 0.6 m | 1.0 m | 0.4 m | 0.625 mm | 0.325 Mm | 13.25 mm | 6.25 mm | 0.375 m | 0.175 m | ||
| Group 3 | 0.6 m | 0.2 m | 0.35 m | 0.7 m | 0.175 m | 1.0 m | 0.4 m | 0.625 mm | 0.325 mm | 13.25 mm | 6.25 mm | 0.375 m | 0.175 m | ||
aHigh, Approximately 50% of the lick rate relative to water; low, ∼75% of the lick rate relative to water. For more details, see Materials and Methods.
bThese were concentrations used in the discrimination experiment.
Apparatus
Lickometer training and testing during the CTA experiment took place in an apparatus commonly referred to as the Davis rig (Davis MS-160; DiLog Instruments, Tallahassee, FL) (Smith, 2001).
Experimental design
Conditioning phase.
Water bottles were removed the day before the start of the conditioning phase (supplemental Table 1, available at www.jneurosci.org as supplemental material). During this phase, each mouse received water from a drinking spout in its home cage for 15 min at the same time each day. Approximately 5 h after the start of each animal's morning session, mice were given access to purified water for 1 h to allow for rehydration. After 3 d of one-bottle water testing, the animals were divided into six groups (n = 8 mice per group) according to the CS (l-serine, l -threonine, or sucrose) and unconditioned stimulus (US) (LiCl or NaCl) they would receive. Mice were assigned to groups on the basis of their body weight, mean water intake during the first 3 d of the conditioning phase, mean licks/trial, and mean number of trials during the last 3 d of Davis rig training. There were no significant differences between the groups regarding these parameters.
Subsequently, five conditioning trials followed in which mice were presented with the appropriate CS for 15 min, immediately followed by an intraperitoneal injection (3.0 mEq/kg body weight) of either 0.15 m LiCla or 0.15 m NaCl. Mice that drank <0.1 ml of their respective CS had ∼0.1 ml infused in their oral cavity with a syringe before receiving the US injection. Water bottles were returned to the home cages ∼5 h after the conditioning trial. The following day, water bottles were removed from the cages for 15 min on the same schedule used on the previous conditioning phase day. Approximately 5 h after the removal of each animal's water bottle, the mice were again given access to purified water for 1 h to reestablish the 18 h schedule of water restriction. The next conditioning trial was separated by 1 more day of the restricted water-access schedule. After the fifth conditioning trial, water bottles were replaced on the home cages for 1 d.
Davis rig testing phase.
Water bottles were removed ∼23.5 h before each animal's brief-access testing phase began. On the first day of testing, the mice were presented with 5 s water trials from 14 sipper tubes, analogous to brief-access training (for details, see supplemental data, available at www.jneurosci.org as supplemental material). This water testing was intended to reacquaint the mice to the task in the Davis rig and to increase their motivation for licking on the following test day. On the next day, the mice were presented with 5 s trials of their specific “test stimulus” array. A water rinse (five-lick maximum) presentation was interposed between the test trials for all stimuli to help control for potential carryover effects (St. John et al., 1994; Boughter et al., 2002). Presentation order was randomized without replacement in blocks so that every stimulus (including water) was presented exactly once before the initiation of the subsequent block. The mice were allowed to complete as many trials as possible within the 25 min session.
Data analysis
A CS-suppression ratio was derived by dividing the CS intake before the first conditioning trial by the CS intake before the fifth (final) trial for each mouse. A ratio of 1.0 signifies equal intake between the first and last conditioning trials, whereas a ratio less than or more than 1.0 signifies decreased or increased intake, respectively, in the last conditioning trial relative to the first trial.
In the brief-access test, tastant/water lick ratios were calculated for each mouse representing the mean number of test stimulus licks per trial divided by the mean number of water stimulus licks per trial (water rinse trials were not included in the analysis). All of these data were statistically examined with ANOVAs and t tests. The statistical rejection criterion was set at the conventional value of 0.05. In addition, Bonferroni's adjustments were also performed to control for the use of multiple comparison on the same dataset. This extremely conservative standard is reported for the benefit of the reader (see Figs. 10–12). However, the design was based on testing the response of the control and experimental mice to each stimulus. Thus, we chose to base our interpretation on the unadjusted values, which are also detailed.
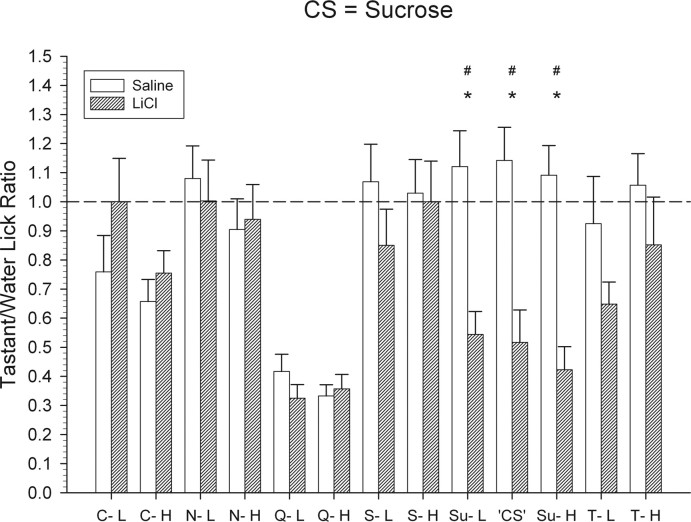
Figure 10.
Mean ± SEM tastant/water lick ratios for the sucrose CS group for all test stimuli. The tastant/water lick ratio was calculated by dividing an animal's average licks to a given taste stimulus across trials by the average licks to water. The dashed line on the graph represents a tastant/water lick ratio of 1.0, which indicates licking to the taste stimulus was equivalent to licking to water. *Significant difference between the tastant/water lick ratios of the control and the conditioned groups.#Significant difference that survives the Bonferroni's α adjustment. C-L, 6.25 mm citric acid; C-H, 13.25 mm citric acid; N-L, 0.175 m NaCl; N-H, 0.375 m NaCl; Q-L, 0.325 mm QHCl; Q-H, 0.625 mm QHCl; S-L, 0.4 m l-serine; S-H, 1.0 m l-serine; Su-L, 0.2 m sucrose; Su-H, 0.6 m sucrose; T-L, 0.175 m l-threonine; T-H, 0.7 m l-threonine; CS, 0.4 m sucrose.
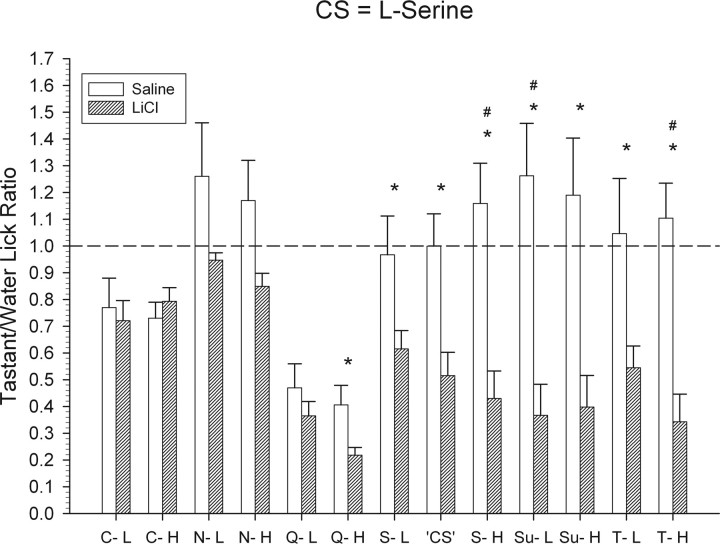
Figure 11.
Mean ± SEM tastant/water lick ratios for the l-serine CS group for all test stimuli. All details are the same as that described for Figure 10.
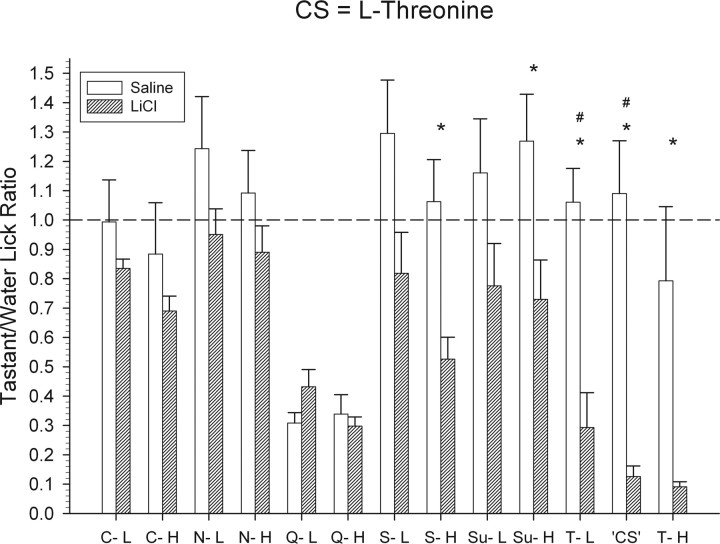
Figure 12.
Mean ± SEM tastant/water lick ratios for the l-threonine CS group for all test stimuli. All details are the same as that described for Figure 10.
Results
Discrimination testing
Sucrose versus NaCl
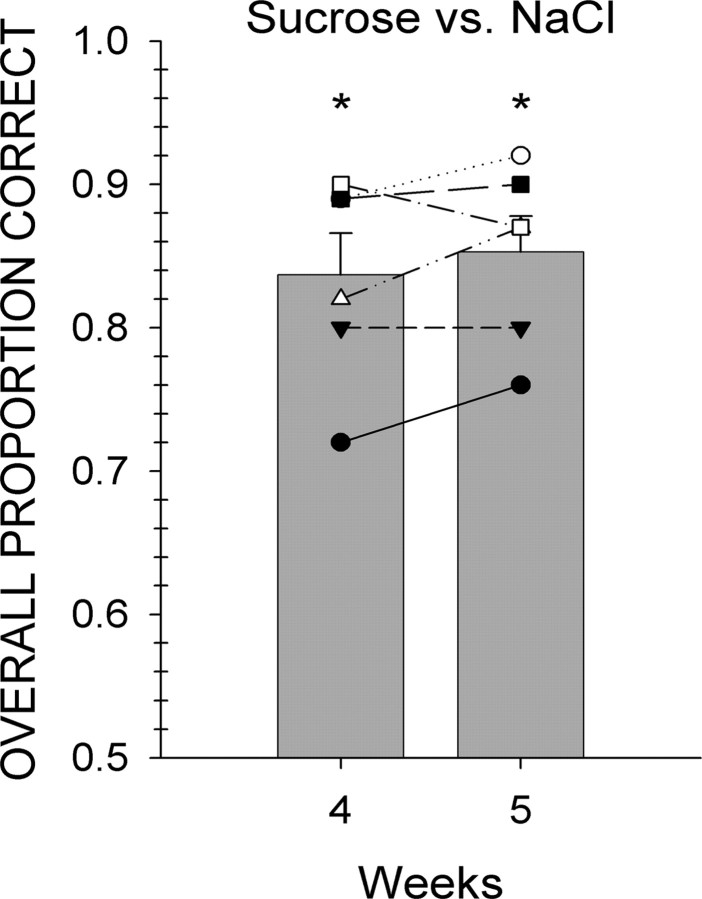
As shown in Figure 1, mice that were trained to discriminate a standard stimulus (i.e., sucrose) from NaCl learned the task. This initial phase of discrimination testing lasted for 5 weeks. During the last 2 weeks of this phase, mice performed, on average, at ∼85% accuracy.
Figure 1.
Individual animal (symbols) and group mean ± SEM (gray bars) data for mice trained to discriminate sucrose from NaCl. Performance on all trials with a response is depicted collapsed across all stimuli during 1 week. *Statistically significant deviation from chance performance.
Sucrose versus l-serine
The results from the second discrimination pairing, detailed below, suggest that, although potentially discriminable, sucrose and l-serine are, to some degree, qualitatively similar.
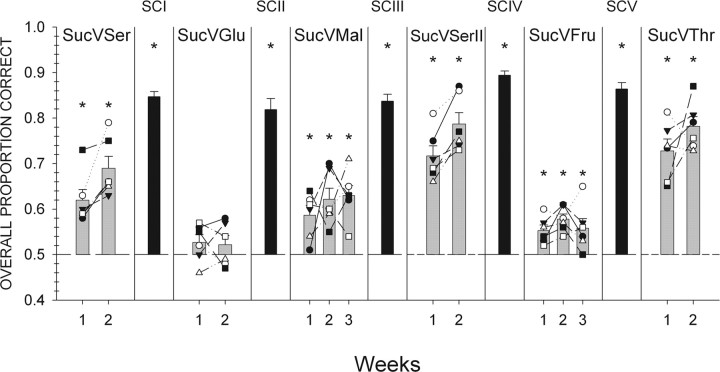
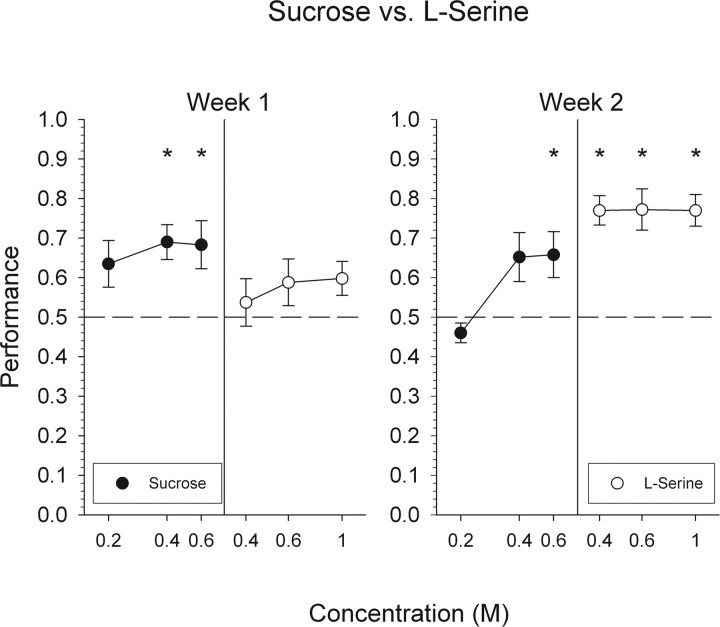
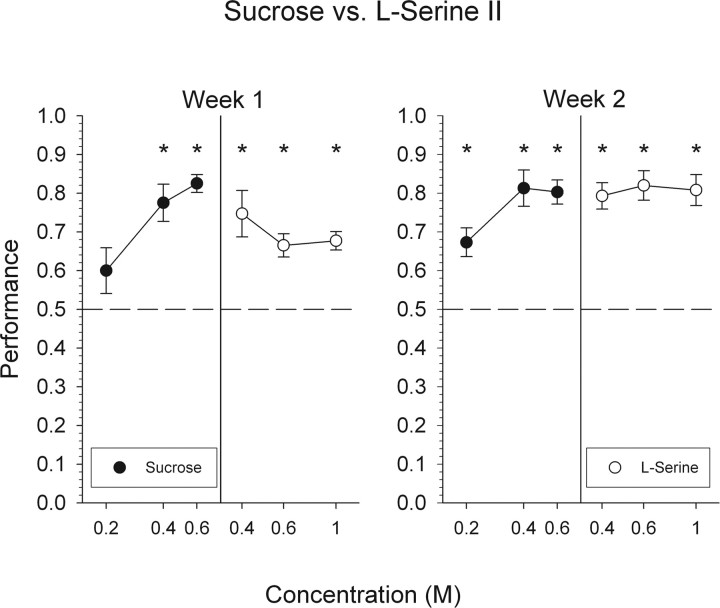
When compared with the last week of sucrose versus NaCl testing (Fig. 1), overall performance dropped precipitously during the first week of testing with l-serine. These data demonstrate that changing one of the taste compounds in this discrimination task has the potential to substantially disrupt performance. However, mice did perform, albeit poorly, at levels above chance (Fig. 2). When looking at performance across all of the individual concentrations of the two stimuli, mice were able to discriminate 0.4 and 0.6 m sucrose. However, these mice did not reliably discriminate 0.2 m sucrose, as well as all three concentrations of l-serine (Fig. 3).
Figure 2.
Individual animal (symbols) and group mean ± SEM (gray bars) data are plotted across all test phases for mice initially trained to discriminate sucrose from NaCl. Black bars denote mean ± SEM performance during the last week of a stimulus control session (±SEM). Performance on all trials with a response is depicted collapsed across all stimuli during 1 week. *Statistically significant deviation from chance performance. Suc, Sucrose; Ser, l-serine; Glu, glucose; Mal, maltose; Fru, fructose; Thr, l-threonine.
Figure 3.
Mean ± SEM data for mice attempting to discriminate l-serine from sucrose. Performance, by concentration, on all trials with a response is depicted collapsed across 1 week. *Statistically significant deviation from chance performance.
During the second week of testing, overall performance did significantly improve relative to that measured during the first week (Fig. 2) (F(1,5) = 11.9; p < 0.05). Animals were able to discriminate all concentrations of l-serine. Although these mice were able to discriminate 0.6 m sucrose from l-serine, they were unable to discriminate 0.2 and 0.4 m sucrose. Their performance toward 0.4 m sucrose, however, did approach significance (p = 0.058). As discussed below, performance on this discrimination improved substantially during a second phase of testing.
Sucrose versus glucose
As expected, mice had great difficulty discriminating sucrose from glucose (Fig. 2). Overall performance never differed significantly from chance. In addition, overall performance levels observed during week 2 did not significantly differ from that measured during week 1 (F(1,5) = 0.05; p = 0.832). These data are consistent with the notion that sucrose and glucose activate the same transduction pathways (Zhao et al., 2003) (for elaboration, see discussion below). We did not test these mice on this discrimination for a third week for fear of losing stimulus control.
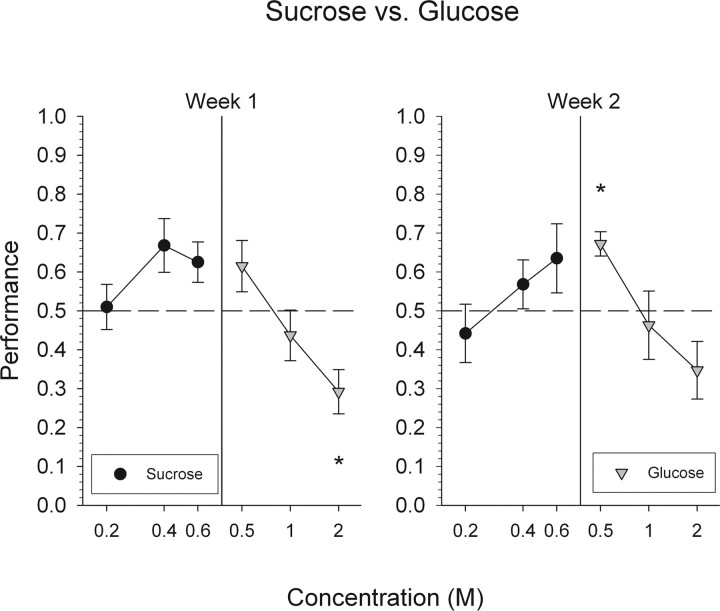
Interestingly, mice tended to respond best to sucrose at its highest concentration (0.6 m) and best to glucose at its lowest concentration (0.5 m). Although this pattern did not reach statistical significance (Fig. 4), it is consistent with the tendency to use intensity cues to guide performance.
Figure 4.
Mean ± SEM data for mice attempting to discriminate glucose from sucrose. Performance, by concentration, on all trials with a response is depicted collapsed across 1 week. *Statistically significant deviation from chance performance.
Sucrose versus maltose
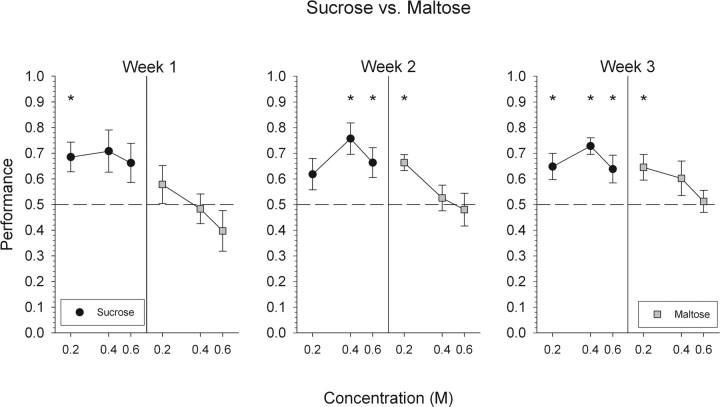
Unlike the failure of mice to discriminate sucrose from glucose, they did display some reliable ability to discriminate between sucrose and maltose, but clearly the task was difficult (Fig. 2). During the first week of testing, mice were able to discriminate 0.2 m sucrose. However, mice were unable to reliably discriminate 0.4 and 0.6 m sucrose, as well as all three concentrations of maltose (Fig. 5).
Figure 5.
Mean ± SEM data for mice attempting to discriminate maltose from sucrose. Performance, by concentration, on all trials with a response is depicted collapsed across 1 week. *Statistically significant deviation from chance performance.
Overall performance did not significantly improve during weeks 2 or 3. However, by week 3, mice were able to discriminate 0.2 m maltose and all concentrations of sucrose.
The ability of mice to discriminate sucrose from maltose, albeit limited, suggests that maltose is qualitatively distinctive, to at least some extent, from sucrose. The pattern of responsiveness across concentrations suggests that 0.2 m maltose is more distinguishable from sucrose relative to the higher maltose concentrations tested (i.e., 0.4 and 0.6 m maltose).
Sucrose versus l-serine II
Overall performance during the first week of sucrose versus l-serine II testing did not significantly differ from the last week of the first phase of sucrose versus l-serine testing (69 and 72% group performance, respectively). Mice were able to discriminate 0.4 and 0.6 m sucrose and all three concentrations of l-serine. As in the first phase of sucrose versus serine testing, mice were unable to reliably discriminate 0.2 m sucrose (Fig. 6).
Figure 6.
Mean ± SEM data for mice attempting to discriminate l-serine from sucrose for a second time. Performance, by concentration, on all trials with a response is depicted collapsed across 1 week. *Statistically significant deviation from chance performance.
Overall performance significantly improved during week 2 when compared with that seen during week 1 (Fig. 2) (F(3,36) = 23.7; p < 0.01). During this week, mice were able to discriminate all concentrations of both stimuli, including, for the first time, 0.2 m sucrose.
Performance appeared to reach asymptotic levels during week 2. Overall performance levels, by session, did not significantly improve during week 2 (sessions 6–10: 0.79, 0.83, 0.77, 0.77, 0.75, respectively; F(4,8) = 0.336; p = 0.85). Consequently, mice were not tested for a third week.
Sucrose versus fructose
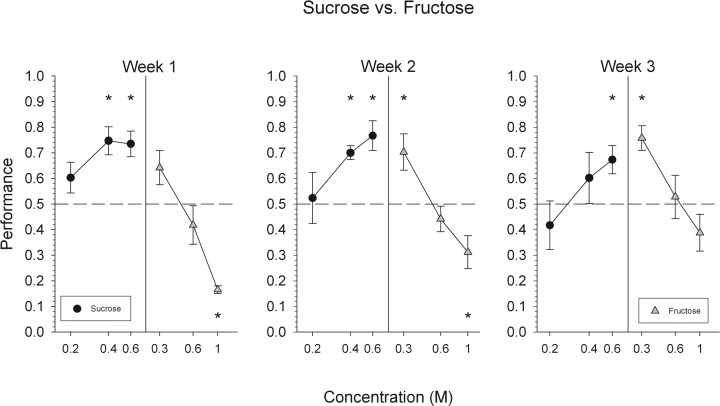
Although mice were able to reliably discriminate sucrose from fructose, overall performance was poor, and there is strong evidence that this discrimination was guided by intensity rather than quality cues (Fig. 2). During the first week of sucrose versus fructose testing, mice were able to discriminate the high concentrations of sucrose (0.4 and 0.6 m) (Fig. 7). Mice, however, were unable to reliably discriminate 0.3 and 0.6 m fructose. Interestingly, mice responded to 1.0 m fructose at levels significantly below chance.
Figure 7.
Mean ± SEM data for mice attempting to discriminate fructose from sucrose. Performance, by concentration, on all trials with a response is depicted collapsed across 1 week. *Statistically significant deviation from chance performance.
During weeks 2 and 3, overall performance did not significantly differ from performance levels measured during week 1. Although no significant changes in the overall percentage of correct responses were observed over the 3 weeks of testing, the pattern of responsiveness toward the various concentrations of the two stimuli did differ slightly from week 1 to week 3. By week 3, the mice only responded to the highest concentration of sucrose and the lowest concentration of fructose at above chance levels. This pattern of responsiveness is consistent with animals using “intensity” cues to guide the discrimination (Fig. 7) (see Discussion).
In summary, when mice were tested on the ability to discriminate sucrose from fructose, these animals showed that they could do so at levels significantly greater than chance. However, as can be seen in Figure 2, this ability was very limited (∼55% correct during the last week of testing) and appeared to result from mice responding on the basis of intensity and not to taste quality, per se.
Sucrose versus l-threonine
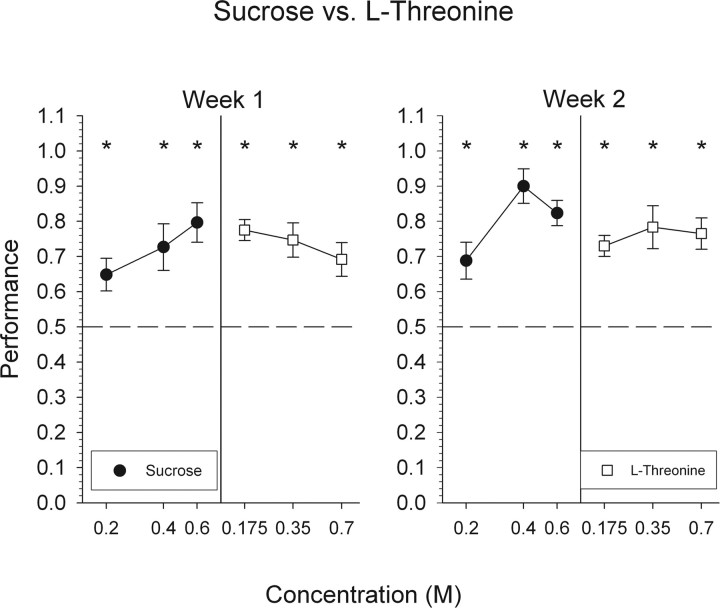
During this last phase of discrimination testing, mice were able to reliably discriminate sucrose from another l-amino acid, l-threonine, demonstrating that the ability to discriminate sucrose from putative sweet-tasting l-amino acids is not limited to l-serine (Fig. 2). During both weeks of testing, mice were able to discriminate all concentrations of both stimuli at levels above chance (Fig. 8).
Figure 8.
Mean ± SEM data for mice attempting to discriminate l-threonine from sucrose. Performance, by concentration, on all trials with a response is depicted collapsed across 1 week. *Statistically significant deviation from chance performance.
Stimulus control sessions
The number of stimulus-control sessions required to reach criterion performance (i.e., 85% group performance for 1 week or for two consecutive sessions at the end of a week and individual performance ≥75%) dropped dramatically after the first stimulus control session (SCI, 15 sessions; SCII, 5 sessions; SCIII, 5 sessions; SCIV, 5 session). These data demonstrate that stimulus control can be quickly reestablished in experienced mice even after a substantial period in which animals are presented with difficult discrimination tasks.
Water control test
Mice performed at chances levels during the water control test (mean ± SD, 0.484 ± 0.057; t(5) = −0.70319; p = 0.513; null hypothesis; probability = 0.5), which indicates that mice were responding to the chemical properties of the stimulus and not to extraneous cues (supplemental Fig. 1, available at www.jneurosci.org as supplemental material).
CTA testing
CTA conditioning phase
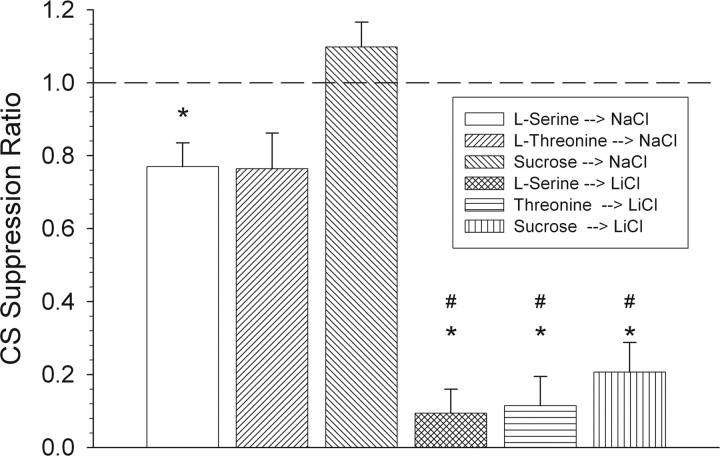
All of the LiCl-injected groups demonstrated convincing evidence of an aversion acquired to their respective CS during the conditioning phase. t tests revealed a significant difference from a value of 1.0 in the CS suppression ratio for all three LiCl-injected groups (Fig. 9) (all t values ≤ −8.4; p < 0.001). This indicates that there was a significant decrease in CS intake between the first and fifth conditioning trial for these groups. There was also a significant decrease in CS intake for the saline-injected “serine” group on the fifth conditioning day relative to the first (t(6) = 3.0; p < 0.05). However, this decrease was slight and therefore interpretively insignificant. Indeed, the CS suppression ratio for each LiCl-injected group was significantly lower than its corresponding control group (Fig. 9) (all t values ≤ 5.0; p < 0.001). Collectively, these data confirm the effectiveness of the conditioning procedures. However, it is known that, relative to rats, mice are more refractory to CTA acquisition procedures (Ninomiya et al., 1984b; Kasahara et al., 1987; Welzl et al., 2001). Thus, of mice in the three LiCl conditioning groups, only those that consumed <0.5 ml during the fifth and final conditioning session were included in the subsequent brief-access testing phase. Only two mice (of eight in the sucrose conditioning group) consumed >0.5 ml and thus were discarded from all subsequent analyses reported here.
Figure 9.
Mean ± SEM of the CS suppression ratio for each conditioned stimulus. A ratio of 1.0 signifies equal intake between the first and last conditioning trials, whereas a ratio less than or more than 1.0 signifies decreased or increased intake, respectively, in the last (fifth) conditioning trial relative to the first trial. *Significant difference from a ratio value of 1.0. #CS suppression ratio for each LiCl-injected group that was significantly lower than its corresponding control group.
Brief-access testing phase
Sucrose CS group.
t tests indicted that, relative to controls, mice conditioned to avoid 0.4 m sucrose showed strong suppression to all three concentrations of sucrose relative to NaCl-injected control mice (Fig. 10) (all t values ≥ 3.6; p values < 0.01). A one-way ANOVA indicated that the tastant/water lick ratios of these concentrations did not significantly differ. Relative to controls, sucrose conditioned mice did not significantly avoid any other stimulus in the test stimulus array.
l-Serine CS group.
t tests revealed that, relative to controls, mice conditioned to avoid 0.6 m l-serine showed strong suppression to all three concentrations of l-serine relative to NaCl-injected control mice (Fig. 11) (all t values ≥ 2.3; p values < 0.05). A one-way ANOVA indicated that the tastant/water lick ratios of these concentrations did not significantly differ. Relative to controls, these mice also avoided both concentrations of sucrose (Fig. 11) (both t values ≥ 3.4; p values < 0.01) and l-threonine (both t values ≥ 2.4; p values < 0.05). The tastant/water lick ratios of the two sucrose concentrations did not significantly differ. However, a paired t test revealed that the conditioned mice avoided 0.7 m l-threonine significantly more than 0.175 m l-threonine (t(7) = 4.0; p < 0.01). Surprisingly, in addition to sucrose and l-threonine, l-serine conditioned mice also avoided 0.625 mm QHCl to a significantly greater degree than did control mice (Fig. 11) (t(13) = 2.5; p < 0.05). These animals did not avoid any other stimulus in the test stimulus array.
l-Threonine CS group.
Relative to animals in the control group, mice conditioned to avoid 0.35 m l-threonine, similar to the other two conditioned groups, showed strong suppression to all three concentrations of their CS (Fig. 12) (all t values ≥ 2.5; p values < 0.05). A one-way ANOVA indicated that the tastant/water lick ratios of these concentrations did not significantly differ. Relative to controls, these mice also avoided 0.6 m sucrose (Fig. 12) (t(11) = 2.5; p < 0.05) and 1.0 m l-serine (t(11) = 3.2; p < 0.01). These animals did not avoid any other stimulus in the test stimulus array.
Discussion
In the first set of experiments, we examined the ability of mice to distinguish between an assortment of putative sweeteners. Finally, CTA generalization tests were conducted to make inferences regarding the taste quality (or qualities) evoked by some putative sweet-tasting l-amino acids. The results of these studies were consistent with the notion that all of these compounds share some qualitative similarities. Mice appeared, however, to possess a limited ability to distinguish between sucrose and the l-amino acids tested.
Our results strongly suggest that B6 mice are unable to discriminate sucrose from either glucose or fructose. Overall performance on the sucrose versus glucose discrimination, collapsed across stimuli, did not significantly differ from chance. Although mice did appear to discriminate sucrose from fructose better than chance, the overall performance was very poor, and the pattern of responses suggested that intensity or some other concentration-dependent feature of the stimulus rather than quality cues were guiding the behavior. Despite our efforts to minimize the possibility, it appears as though the mice were making a strong versus weak stimulus discrimination. This conclusion is based on the opposite trajectories of the concentration–response curves for sucrose and fructose. Thus, as the concentration of fructose increased, it became more difficult for the mice to discriminate it from sucrose, suggesting that the intensity of fructose was approaching the range of intensities for the sucrose concentrations. Conversely, as the concentration of sucrose increased, it became easier to discriminate it from fructose, suggesting that the intensity of sucrose was departing from the range of intensities associated with the fructose concentrations. This is exactly the profile one would expect if the two compounds had very similar taste qualities but differed in their stimulation efficacy, and thus differed in their perceived intensity, at isomolar concentrations.
There was some evidence that mice could discriminate sucrose from maltose, but the degree of discriminability was not particularly impressive. Although mice could only discriminate the lowest concentration of maltose at levels above chance, they were able to discriminate all three concentrations of sucrose successfully during the last week of testing. Therefore, these data suggest that, although qualitatively similar, sucrose and maltose generate a discriminable neural signal in the periphery. Although intensity effects could have been operating here, the shapes of the concentration–response functions do not obviously imply that intensity was the sole cue. The ability of rodents to discriminate maltose from sucrose has been demonstrated in several other studies (Ninomiya et al., 1984b; Spector and Grill, 1988; Spector et al., 1997). The basis of this limited discriminability remains to be determined. Nissenbaum and Sclafani (1987) hypothesized that maltose may stimulate a separate “polysaccharide” taste receptor in addition to a receptor(s) binding with sucrose, glucose, and fructose (e.g., T1R2 + T1R3).
The phenomenon of a class of compounds generating a unitary qualitative percept has been termed “monogeusia” (Breslin et al., 1996). Monogeusia has been demonstrated in humans with some natural sweeteners (Breslin et al., 1996) and in rats with some “bitter” tastants (Spector and Kopka, 2002). To our knowledge, monogeusia for natural sweeteners had never been explicitly tested in a rodent model until the present study.
Monogeusia can result from the stimulation of a single taste receptor or from the convergence of independent peripheral signals anywhere along the gustatory neuraxis. In the case of sugars, it is likely that monogeusia results from an indiscriminable neural signal emanating from the periphery that originates from the stimulation of a common receptor(s). Indeed, sucrose, glucose, and fructose were shown, in vitro, to activate the T1R2 + T1R3 receptor complex (Nelson et al., 2001; Li et al., 2002a).
In stark contrast to the inability of these animals to discriminate sucrose from glucose or fructose, all mice learned to discriminate sucrose from l-serine and l-threonine. It is possible, as in the sucrose versus fructose discrimination task, that intensity or some other concentration-dependent feature of the stimuli (e.g., viscosity), not quality, per se, provided reliably discriminable cues. Again, however, the shapes of the concentration–response functions do not imply that intensity was the sole cue. Moreover, data from the CTA experiments suggest that taste quality differences between these stimuli do indeed exist.
In the CTA experiment, the generalization seen toward sucrose by mice trained to avoid l-serine or those trained to avoid l-threonine was not symmetrical. The fact that mice did not generalize a sucrose aversion to either high or low concentrations of these l-amino acids suggests that qualitative distinctiveness, not insufficient stimulus intensity, accounts for the generalization asymmetries. However, we cannot entirely rule out that intensity differences may have played some role. If the lowest concentration of sucrose had a stronger intensity than the highest concentration of either l-amino acid, then such an outcome would be possible. For example, when 0.4 m sucrose served as a CS, the intensity of the sucrose-like taste of the l-serine test stimuli, both the low and high concentrations, may have been too weak for the generalization to be expressed. In the animal learning literature, this is commonly referred to as an intensity generalization decrement (Brennan and Riccio, 1972; Nowlis, 1974). In contrast, when 0.6 m l-serine was used as the CS, the aversion to its weak sweet taste may have been expressed to the sucrose concentrations because of their stronger intensities. This is commonly referred to as stimulus intensity dynamism (Hull, 1943, 1949). Conversely, if an intensity generalization decrement was the sole explanation for the failure of the sucrose aversion to generalize to either concentration of l-threonine, then we would expect the l-threonine aversion to generalize to the low concentration of sucrose, an outcome that was not realized.
Together, results from both the discrimination and CTA experiments suggest that sweet-tasting l-amino acids, although more similar to sucrose than to other prototypical representatives of the basic taste qualities, possess discriminable taste characteristics. This conclusion is supported by the findings of Delay and colleagues who have shown that rats treat sucrose and monosodium glutamate as similar but discriminable (Chaudhari et al., 1996; Stapleton et al., 1999; Heyer et al., 2003, 2004).
The source of the discriminable cue may lie in the pattern of receptor expression. TBCs that express receptor(s) that respond to the l-amino acids (e.g., T1R1 + T1R3) may generate discrete neural signals that remain distinguishable as the information ascends through the nervous system. However, another possibility is suggested by the generalization pattern observed in the CTA experiments. The results from these experiments suggest that, to B6 mice, l-serine may be perceived as both sweet and bitter. At least one published study has reported that humans perceive the taste of l-serine crystals as sweet, with a bitter/sour aftertaste (Haefeli and Glaser, 1990). Although not detected in this current examination of taste perception in mice, evidence does exist that, in humans, l-threonine also gives rise to a bitter aftertaste (Shallenberger, 1993), a phenomenon known to occur with certain artificial sweeteners such as saccharin (i.e., sweet, with a bitter aftertaste) (Bartoshuk, 1979). The putative bitter taste evoked by l-serine could provide a plausible explanation for the apparent difference in the affective potency of l-serine and sucrose (Dotson and Spector, 2004). Another possibility is that, compared with sucrose, the l-amino acids may have a different temporal profile of interacting with their receptors that may lead to distinguishable differences in the rise and decay of the sensation (for more discussion, see Spector and Travers, 2005). Last, it should be pointed out that some of the concentrations of the amino acids tested, although within the range of those commonly used to assess the behavioral responsiveness of rodents in other experiments (Pritchard and Scott, 1982; Iwasaki et al., 1985; Zhang et al., 2003; Zhao et al., 2003), were relatively high. Thus, we cannot dismiss the possibility that these stimuli, in addition to eliciting responses from the gustatory system, may have also generated “nontaste” signals (e.g., olfactory, somatosensory) that could have provided the discriminable cue. This possibility highlights the fact that demonstrating an inability to perform competently in a taste discrimination task is more interpretively straightforward than the demonstration of a success, provided concentration and learning effects can be dismissed (Spector and Travers, 2005). In this light, the inability of mice to discriminate sucrose from glucose or fructose becomes even more meaningful.
Caveats notwithstanding, the results discussed above suggest that sucrose and the l-amino acids tested are qualitatively distinguishable to some extent. Conversely, our data also suggest that these stimuli share some qualitative features. Results from the CTA experiment demonstrated that mice trained to avoid 0.6 m l-serine subsequently avoided both concentrations of sucrose. Thus, l-serine appears to possess some qualitative component that is sucrose like to B6 mice. This finding is consistent with data gathered in the only other CTA experiment on the “taste” of l-serine in mice of which we are aware (Kasahara et al., 1987), as well as a variety of human psychophysical studies. Moreover, the taste quality of l-threonine, a stimulus that has never been, to our knowledge, explicitly tested in a CTA generalization experiment in rodents, also appears to possess a sucrose-like component to B6 mice.
During the first phase of sucrose versus l-serine discrimination testing, when experience with the stimuli was most limited, mice were unable to discriminate 0.2 m sucrose from l-serine. It took until the second week of the second phase before they were able to learn the discrimination. These findings imply that 0.2 m sucrose tastes more similar to l-serine than do the higher concentrations of sucrose. Accordingly, l-serine, across the range of concentrations tested, likely evokes a mild sweetness relative to that elicited by 0.4 and 0.6 m sucrose. As noted above, this might explain, in part, why when 0.4 m sucrose served as a CS in the CTA experiments, no generalization to l-serine was evident. The suggestion that the sweetness of l-serine is weak but possesses a quinine-like (i.e., bitter) taste component might explain its inability to stimulate licking by nondeprived mice in brief-access tests (Dotson and Spector, 2004). Based on data obtained from the sucrose versus l-serine discrimination experiments, at low concentrations (<0.2 m), this sweetness is likely more pure (i.e., l-serine is likely sweet at low concentrations, and sweet and bitter at higher concentrations). Collectively, data from both the discrimination and CTA procedures suggest that sucrose and the l-amino acids share at least some perceptual features. The neural basis of this perceptual similarity may arise from at least three possible mechanisms that are not mutually exclusive. First, some of the signals generated by the receptor(s) responsible for the transduction of these stimuli may converge somewhere along the gustatory neuraxis. Support for this notion comes from recent findings of Geran and Travers (2006) who reported that a subset of neurons in the nucleus of the solitary tract, the first CNS synapse for gustatory information, responded almost exclusively to sucrose and not to a variety of other compounds. Interestingly, the neurons that responded to the l-amino acids tested also responded to sucrose, providing neuronal evidence of converging input. It should be noted, however, that a subset of these “amino-acid/sucrose-best” neurons did respond approximately twice as well to glutamate relative to sucrose, perhaps providing a basis for a discriminable cue.
Second, it is possible that the perceptual similarity of these particular l-amino acids and sucrose results from simulation of the same population of TBCs. Contrary to previous studies, which suggested that the different T1R receptor complexes were expressed in mostly nonoverlapping sets of TBCs, Kim et al. (2003) reported that some TBCs coexpress all three T1R receptors. Perhaps these cells mediate the signals that are responsible for the qualitative similarity between these stimuli. It should be said, however, that, even if they do exist, it remains unclear what the response properties of such a cell would be. Moreover, this would not rule out the possibility of converging inputs onto branching single afferent fibers or synaptic convergence onto central gustatory neurons.
Third, sweet-tasting l-amino acids might evoke a perception similar to sucrose by stimulating a common receptor (e.g., T1R2 + T1R3 receptor). As detailed above, these compounds are thought to stimulate different heteromeric receptors. However, it should be noted that, to the best of our knowledge, the in vitro response of both of these receptors to higher concentrations of l-amino acids has yet to be established.
In summary, the findings presented above suggest that all of the putative sweet-tasting l-amino acids and sugars tested in the current report share some qualitative features. However, the results of these experiments also imply that sweet-tasting l-amino acids, such as l-serine, possess distinguishable taste characteristics. To our knowledge, the qualitative complexity elicited by l-serine, which includes a bitter taste, has never been demonstrated previously in rodents. In addition, monogeusia for sucrose, glucose, fructose, and, to a lesser extent, maltose has been demonstrated here for the first time in rodents, suggesting that the peripheral input evoked by these sugars forms a single perceptual channel in the neural circuitry of the central gustatory system that is manifest as the qualitative sensation of sweetness.
Footnotes
This work was supported in part by National Institutes of Health Grants F31-DC007358 (C.D.D.) and R01-DC04574 (A.C.S.). We thank Angela Newth for her assistance in testing the animals.
The first US injections for all three experimental groups was performed with LiC1 dissolved in 0.15 m NaCl. All subsequent injections were completed with LiCl dissolved in purified water. Four mice (two saline-injected and two LiCl-injected mice) died after the first injection for unknown reasons. As a result, n = 6–8 mice per group. Nevertheless, the groups remained balanced on the aforementioned variables.
References
- Bachmanov AA, Reed DR, Tordoff MG, Price RA, Beauchamp GK. Intake of ethanol, sodium chloride, sucrose, citric acid, and quinine hydrochloride solutions by mice: a genetic analysis. Behav Genet. 1996;26:563–573. doi: 10.1007/BF02361229. [DOI] [PMC free article] [PubMed] [Google Scholar]
- Bachmanov AA, Reed DR, Ninomiya Y, Inoue M, Tordoff MG, Price RA, Beauchamp GK. Sucrose consumption in mice: major influence of two genetic loci affecting peripheral sensory responses. Mamm Genome. 1997;8:545–548. doi: 10.1007/s003359900500. [DOI] [PMC free article] [PubMed] [Google Scholar]
- Bachmanov AA, Tordoff MG, Beauchamp GK. Sweetener preference of C57BL/6ByJ and 129P3/J mice. Chem Senses. 2001a;26:905–913. doi: 10.1093/chemse/26.7.905. [DOI] [PMC free article] [PubMed] [Google Scholar]
- Bachmanov AA, Li X, Reed DR, Ohmen JD, Li S, Chen Z, Tordoff MG, de Jong PJ, Wu C, West DB, Chatterjee A, Ross DA, Beauchamp GK. Positional cloning of the mouse saccharin preference (Sac) locus. Chem Senses. 2001b;26:925–933. doi: 10.1093/chemse/26.7.925. [DOI] [PMC free article] [PubMed] [Google Scholar]
- Bartoshuk LM. Bitter taste of saccharin related to the genetic ability to taste the bitter substance 6-n-propylthiouracil. Science. 1979;205:934–935. doi: 10.1126/science.472717. [DOI] [PubMed] [Google Scholar]
- Boughter JD, Jr, St. John SJ, Noel DT, Ndubuizu O, Smith DV. A brief-access test for bitter taste in mice. Chem Senses. 2002;27:133–142. doi: 10.1093/chemse/27.2.133. [DOI] [PubMed] [Google Scholar]
- Brennan JF, Riccio DC. Stimulus generalization along dimensions of an active avoidance CS in young rats. Psychon Sci. 1972;29:170. [Google Scholar]
- Breslin PA, Beauchamp GK, Pugh EN., Jr Monogeusia for fructose, glucose, sucrose, and maltose. Percept Psychophys. 1996;58:327–341. doi: 10.3758/bf03206809. [DOI] [PubMed] [Google Scholar]
- Capeless CG, Whitney G. The genetic basis of preference for sweet substances among inbred strains of mice: preference ratio phenotypes and the alleles of the Sac and dpa loci. Chem Senses. 1995;20:291–298. doi: 10.1093/chemse/20.3.291. [DOI] [PubMed] [Google Scholar]
- Capretta PJ. Saccharin and saccharin-glucose ingestion in 2 inbred strains of Mus musculus. Psychon Sci. 1970;21:133–135. [Google Scholar]
- Chaudhari N, Yang H, Lamp C, Delay E, Cartford C, Than T, Roper S. The taste of monosodium glutamate: membrane receptors in taste buds. J Neurosci. 1996;16:3817–3826. doi: 10.1523/JNEUROSCI.16-12-03817.1996. [DOI] [PMC free article] [PubMed] [Google Scholar]
- Damak S, Rong M, Yasumatsu K, Kokrashvili Z, Varadarajan V, Zou S, Jiang P, Ninomiya Y, Margolskee RF. Detection of sweet and umami taste in the absence of taste receptor T1r3. Science. 2003;301:850–853. doi: 10.1126/science.1087155. [DOI] [PubMed] [Google Scholar]
- Danilova V, Hellekant G, Tinti JM, Nofre C. Gustatory responses of the hamster Mesocricetus auratus to various compounds considered sweet by humans. J Neurophysiol. 1998;80:2102–2112. doi: 10.1152/jn.1998.80.4.2102. [DOI] [PubMed] [Google Scholar]
- Dotson CD, Spector AC. The relative affective potency of glycine, l-serine and sucrose as assessed by a brief-access taste test in inbred strains of mice. Chem Senses. 2004;29:489–498. doi: 10.1093/chemse/bjh051. [DOI] [PubMed] [Google Scholar]
- Dotson CD, Roper SD, Spector AC. PLCbeta2-independent behavioral avoidance of prototypical bitter-tasting ligands. Chem Senses. 2005;30:593–600. doi: 10.1093/chemse/bji053. [DOI] [PMC free article] [PubMed] [Google Scholar]
- Eylam S, Spector AC. The effect of amiloride on operantly conditioned performance in an NaCl taste detection task and NaCl preference in C57BL/6J mice. Behav Neurosci. 2002;116:149–159. [PubMed] [Google Scholar]
- Eylam S, Spector AC. Oral amiloride treatment decreases taste sensitivity to sodium salts in C57BL/6J and DBA/2J mice. Chem Senses. 2003;28:447–458. doi: 10.1093/chemse/28.5.447. [DOI] [PubMed] [Google Scholar]
- Eylam S, Spector AC. Stimulus processing of glycine is dissociable from that of sucrose and glucose based on behaviorally measured taste signal detection in Sac “taster” and “non-taster” mice. Chem Senses. 2004;29:639–649. doi: 10.1093/chemse/bjh068. [DOI] [PubMed] [Google Scholar]
- Eylam S, Spector AC. Taste discrimination between NaCl and KCl is disrupted by amiloride in inbred mice with amiloride-insensitive chorda tympani nerves. Am J Physiol Regul Integr Comp Physiol. 2005;288:R1361–R1368. doi: 10.1152/ajpregu.00796.2004. [DOI] [PubMed] [Google Scholar]
- Frank ME. Processing of mixtures of stimuli with different tastes by primary mammalian taste neurons. In: Laing DG, Cain W, McBride R, Ache B, editors. Perception of complex smells and tastes. San Diego: Academic; 1989. pp. 127–147. [Google Scholar]
- Fuller JL. Single-locus control of saccharin preference in mice. J Hered. 1974;65:33–36. doi: 10.1093/oxfordjournals.jhered.a108452. [DOI] [PubMed] [Google Scholar]
- Geran LC, Travers SP. Single neurons in the nucleus of the solitary tract respond selectively to bitter taste stimuli. J Neurophysiol. 2006;96:2513–2527. doi: 10.1152/jn.00607.2006. [DOI] [PubMed] [Google Scholar]
- Glendinning JI, Bloom LD, Onishi M, Zheng KH, Damak S, Margolskee RF, Spector AC. Contribution of alpha-gustducin to taste-guided licking responses of mice. Chem Senses. 2005a;30:299–316. doi: 10.1093/chemse/bji025. [DOI] [PubMed] [Google Scholar]
- Glendinning JI, Chyou S, Lin I, Onishi M, Patel P, Zheng KH. Initial licking responses of mice to sweeteners: effects of Tas1r3 polymorphisms. Chem Senses. 2005b;30:601–614. doi: 10.1093/chemse/bji054. [DOI] [PubMed] [Google Scholar]
- Haefeli RJ, Glaser D. Taste responses and thresholds obtained with the primary amino-acids in humans. LWT Food Sci Technol. 1990;23:523–527. [Google Scholar]
- Hettinger TP, Frank ME. Preferences of hamsters for solutions of chemicals with sweet, salty, sour, bitter, sulfurous, soapy alkaline or combined flavors: analytic hedonic processing. Chem Senses. 1985;10:451–452. [Google Scholar]
- Heyer BR, Taylor-Burds CC, Tran LH, Delay ER. Monosodium glutamate and sweet taste: generalization of conditioned taste aversion between glutamate and sweet stimuli in rats. Chem Senses. 2003;28:631–641. doi: 10.1093/chemse/bjg056. [DOI] [PubMed] [Google Scholar]
- Heyer BR, Taylor-Burds CC, Mitzelfelt JD, Delay ER. Monosodium glutamate and sweet taste: discrimination between the tastes of sweet stimuli and glutamate in rats. Chem Senses. 2004;29:721–729. doi: 10.1093/chemse/bjh081. [DOI] [PubMed] [Google Scholar]
- Hoon MA, Adler E, Lindemeier J, Battey JF, Ryba NJ, Zuker CS. Putative mammalian taste receptors: a class of taste-specific GPCRs with distinct topographic selectivity. Cell. 1999;96:541–551. doi: 10.1016/s0092-8674(00)80658-3. [DOI] [PubMed] [Google Scholar]
- Hull CL. New York: Appleton-Century; 1943. Principles of behavior, an introduction to behavior theory. [Google Scholar]
- Hull CL. Stimulus intensity dynamism (V) and stimulus generalization. Psychol Rev. 1949;56:67. doi: 10.1037/h0058051. [DOI] [PubMed] [Google Scholar]
- Inoue M, McCaughey SA, Bachmanov AA, Beauchamp GK. Whole nerve chorda tympani responses to sweeteners in C57BL/6ByJ and 129P3/J mice. Chem Senses. 2001;26:915–923. doi: 10.1093/chemse/26.7.915. [DOI] [PMC free article] [PubMed] [Google Scholar]
- Iwasaki K, Kasahara T, Sato M. Gustatory effectiveness of amino acids in mice: behavioral and neurophysiological studies. Physiol Behav. 1985;34:531–542. doi: 10.1016/0031-9384(85)90045-9. [DOI] [PubMed] [Google Scholar]
- Kasahara T, Iwasaki K, Sato M. Taste effectiveness of some d- and l-amino acids in mice. Physiol Behav. 1987;39:619–624. doi: 10.1016/0031-9384(87)90162-4. [DOI] [PubMed] [Google Scholar]
- Kim MR, Kusakabe Y, Miura H, Shindo Y, Ninomiya Y, Hino A. Regional expression patterns of taste receptors and gustducin in the mouse tongue. Biochem Biophys Res Commun. 2003;312:500–506. doi: 10.1016/j.bbrc.2003.10.137. [DOI] [PubMed] [Google Scholar]
- Kitagawa M, Kusakabe Y, Miura H, Ninomiya Y, Hino A. Molecular genetic identification of a candidate receptor gene for sweet taste. Biochem Biophys Res Commun. 2001;283:236–242. doi: 10.1006/bbrc.2001.4760. [DOI] [PubMed] [Google Scholar]
- Li X, Staszewski L, Xu H, Durick K, Zoller M, Adler E. Human receptors for sweet and umami taste. Proc Natl Acad Sci USA. 2002a;99:4692–4696. doi: 10.1073/pnas.072090199. [DOI] [PMC free article] [PubMed] [Google Scholar]
- Li X, Bachmanov AA, Li S, Chen Z, Tordoff MG, Beauchamp GK, de Jong PJ, Wu C, Chen L, West DB, Ross DA, Ohmen JD, Reed DR. Genetic, physical, and comparative map of the subtelomeric region of mouse Chromosome 4. Mamm Genome. 2002b;13:5–19. doi: 10.1007/s0033501-2109-8. [DOI] [PMC free article] [PubMed] [Google Scholar]
- Lush IE. The genetics of tasting in mice. VI. Saccharin, acesulfame, dulcin and sucrose. Genet Res. 1989;53:95–99. doi: 10.1017/s0016672300027968. [DOI] [PubMed] [Google Scholar]
- Max M, Shanker YG, Huang L, Rong M, Liu Z, Campagne F, Weinstein H, Damak S, Margolskee RF. Tas1r3, encoding a new candidate taste receptor, is allelic to the sweet responsiveness locus Sac. Nat Genet. 2001;28:58–63. doi: 10.1038/ng0501-58. [DOI] [PubMed] [Google Scholar]
- Montmayeur JP, Liberles SD, Matsunami H, Buck LB. A candidate taste receptor gene near a sweet taste locus. Nat Neurosci. 2001;4:492–498. doi: 10.1038/87440. [DOI] [PubMed] [Google Scholar]
- Nelson G, Hoon MA, Chandrashekar J, Zhang Y, Ryba NJ, Zuker CS. Mammalian sweet taste receptors. Cell. 2001;106:381–390. doi: 10.1016/s0092-8674(01)00451-2. [DOI] [PubMed] [Google Scholar]
- Nelson G, Chandrashekar J, Hoon MA, Feng L, Zhao G, Ryba NJ, Zuker CS. An amino-acid taste receptor. Nature. 2002;416:199–202. doi: 10.1038/nature726. [DOI] [PubMed] [Google Scholar]
- Ninomiya Y, Mizukoshi T, Higashi T, Katsukawa H, Funakoshi M. Gustatory neural responses in three different strains of mice. Brain Res. 1984a;302:305–314. doi: 10.1016/0006-8993(84)90244-0. [DOI] [PubMed] [Google Scholar]
- Ninomiya Y, Higashi T, Katsukawa H, Mizukoshi T, Funakoshi M. Qualitative discrimination of gustatory stimuli in three different strains of mice. Brain Res. 1984b;322:83–92. doi: 10.1016/0006-8993(84)91183-1. [DOI] [PubMed] [Google Scholar]
- Nissenbaum JW, Sclafani A. Qualitative differences in polysaccharide and sugar tastes in the rat: a two-carbohydrate taste model. Neurosci Biobehav Rev. 1987;11:187–196. doi: 10.1016/s0149-7634(87)80025-8. [DOI] [PubMed] [Google Scholar]
- Nowlis GH. Conditioned stimulus intensity and acquired alimentary aversions in the rat. J Comp Physiol Psychol. 1974;86:1173–1184. doi: 10.1037/h0037644. [DOI] [PubMed] [Google Scholar]
- Pelz WE, Whitney G, Smith JC. Genetic influences on saccharin preference of mice. Physiol Behav. 1973;10:263–265. doi: 10.1016/0031-9384(73)90308-9. [DOI] [PubMed] [Google Scholar]
- Pritchard TC, Scott TR. Amino acids as taste stimuli. I. Neural and behavioral attributes. Brain Res. 1982;253:81–92. doi: 10.1016/0006-8993(82)90675-8. [DOI] [PubMed] [Google Scholar]
- Ramirez I, Fuller JL. Genetic influence on water and sweetened water consumption in mice. Physiol Behav. 1976;16:163–168. doi: 10.1016/0031-9384(76)90300-0. [DOI] [PubMed] [Google Scholar]
- Sainz E, Korley JN, Battey JF, Sullivan SL. Identification of a novel member of the T1R family of putative taste receptors. J Neurochem. 2001;77:896–903. doi: 10.1046/j.1471-4159.2001.00292.x. [DOI] [PubMed] [Google Scholar]
- Schiffman SS, Dackis C. Taste of nutrients: amino acids, vitamins, and fatty acids. Percept Psychophys. 1975;17:140–146. [Google Scholar]
- Schiffman SS, Erickson RP. The issue of primary tastes versus a taste continuum. Neurosci Biobehav Rev. 1980;4:109–117. doi: 10.1016/0149-7634(80)90009-3. [DOI] [PubMed] [Google Scholar]
- Schiffman SS, Sennewald K, Gagnon J. Comparison of taste qualities and thresholds of d- and l-amino acids. Physiol Behav. 1981;27:51–59. doi: 10.1016/0031-9384(81)90298-5. [DOI] [PubMed] [Google Scholar]
- Shallenberger RS. London: Blackie Academic and Professional; 1993. Taste chemistry, Ed 1. [Google Scholar]
- Smith JC. The history of the “Davis Rig.”. Appetite. 2001;36:93–98. doi: 10.1006/appe.2000.0372. [DOI] [PubMed] [Google Scholar]
- Spector AC. Linking gustatory neurobiology to behavior in vertebrates. Neurosci Biobehav Rev. 2000;24:391–416. doi: 10.1016/s0149-7634(00)00013-0. [DOI] [PubMed] [Google Scholar]
- Spector AC, Grill HJ. Differences in the taste quality of maltose and sucrose in rats: issues involving the generalization of conditioned taste aversions. Chem Senses. 1988;13:95–113. [Google Scholar]
- Spector AC, Kopka SL. Rats fail to discriminate quinine from denatonium: implications for the neural coding of bitter-tasting compounds. J Neurosci. 2002;22:1937–1941. doi: 10.1523/JNEUROSCI.22-05-01937.2002. [DOI] [PMC free article] [PubMed] [Google Scholar]
- Spector AC, Travers SP. The representation of taste quality in the mammalian nervous system. Behav Cogn Neurosci Rev. 2005;4:143–191. doi: 10.1177/1534582305280031. [DOI] [PubMed] [Google Scholar]
- Spector AC, Andrews-Labenski J, Letterio FC. A new gustometer for psychophysical taste testing in the rat. Physiol Behav. 1990;47:795–803. doi: 10.1016/0031-9384(90)90099-p. [DOI] [PubMed] [Google Scholar]
- Spector AC, Markison S, St. John SJ, Garcea M. Sucrose vs. maltose taste discrimination by rats depends on the input of the seventh cranial nerve. Am J Physiol. 1997;272:R1210–R1218. doi: 10.1152/ajpregu.1997.272.4.R1210. [DOI] [PubMed] [Google Scholar]
- St. John SJ, Garcea M, Spector AC. Combined, but not single, gustatory nerve transection substantially alters taste-guided licking behavior to quinine in rats. Behav Neurosci. 1994;108:131–140. doi: 10.1037//0735-7044.108.1.131. [DOI] [PubMed] [Google Scholar]
- Stapleton JR, Roper SD, Delay ER. The taste of monosodium glutamate (MSG), l-aspartic acid, and N-methyl-d-aspartate (NMDA) in rats: are NMDA receptors involved in MSG taste? Chem Senses. 1999;24:449–457. doi: 10.1093/chemse/24.4.449. [DOI] [PubMed] [Google Scholar]
- Stockton MD, Whitney G. Effects of genotype, sugar, and concentration on sugar preference of laboratory mice (Mus musculus). J Comp Physiol Psychol. 1974;86:62–68. doi: 10.1037/h0035929. [DOI] [PubMed] [Google Scholar]
- Welzl H, D'Adamo P, Lipp HP. Conditioned taste aversion as a learning and memory paradigm. Behav Brain Res. 2001;125:205–213. doi: 10.1016/s0166-4328(01)00302-3. [DOI] [PubMed] [Google Scholar]
- Yamamoto T, Matsuo R, Kiyomitsu Y, Kitamura R. Taste effects of “umami” substances in hamsters as studied by electrophysiological and conditioned taste aversion techniques. Brain Res. 1988;451:147–162. doi: 10.1016/0006-8993(88)90759-7. [DOI] [PubMed] [Google Scholar]
- Zhang Y, Hoon MA, Chandrashekar J, Mueller KL, Cook B, Wu D, Zuker CS, Ryba NJ. Coding of sweet, bitter, and umami tastes: different receptor cells sharing similar signaling pathways. Cell. 2003;112:293–301. doi: 10.1016/s0092-8674(03)00071-0. [DOI] [PubMed] [Google Scholar]
- Zhao GQ, Zhang Y, Hoon MA, Chandrashekar J, Erlenbach I, Ryba NJ, Zuker CS. The receptors for mammalian sweet and umami taste. Cell. 2003;115:255–266. doi: 10.1016/s0092-8674(03)00844-4. [DOI] [PubMed] [Google Scholar]


