

Abstract
Transcallosal excitation and inhibition have been theorized based on the effect of callosotomy on intractable epilepsy and dichotic listening research, respectively. We studied bilateral interaction of cortical auditory neurons and found that this interaction consisted of focused facilitation and widespread lateral inhibition. The frequency modulated (FM)–FM area of the auditory cortex of the mustached bat is composed of delay-tuned neurons tuned to the combination of the emitted biosonar pulse and its echo with a specific echo delay [best delay (BD)] and consists of three subdivisions in terms of the combination sensitivity of neurons. We found that focal electric stimulation of one of these three subdivisions evoked BD shifts of delay-tuned neurons in all three subdivisions of the contralateral FM–FM area, presumably via the corpus callosum. The effect of electric stimulation of the delay-tuned neurons on the contralateral delay-tuned neurons was different depending on whether the BD of a recorded neuron was matched or unmatched in BD with that of the stimulated neurons. BD-matched neurons did not change their BDs and increased the responses at their BDs, whereas BD-unmatched neurons shifted their BDs away from the BD of the stimulated neurons and reduced their responses. The ipsilateral and contralateral BD shifts evoked by the electric stimulation were identical to each other. The contralateral modulation, in addition to the ipsilateral modulation, increases the contrast in the neural representation of the echo delay to which the stimulated neurons are tuned.
Keywords: bat, corpus callosum, echolocation, hearing, plasticity, combination sensitivity
Introduction
Homologous cortical areas on both sides are mostly bilaterally connected through the corpus callosum. Callosal fibers originating from cortical pyramidal cells are excitatory and glutamatergic (Mountcastle, 1998). Excitation and inhibition theories exist as to the function of the corpus callosum. The excitation theory describes that the callosal function is the integration of information processed in the two cerebral hemispheres through transcallosal excitation. The inhibition theory describes that it is the separation of information processed in the two hemispheres by transcallosal inhibition (for review, see Bloom and Hynd, 2005). To explore the neural mechanisms for transcallosal inhibition or excitation, electrophysiological studies of single cortical neurons influenced by focal electric stimulation of the contralateral cortex are needed.
Focal electrical stimulation of the auditory cortex (AC) evokes the shift of the frequency-tuning curves of cortical auditory neurons. The shift is always accompanied with a shift of their best frequencies (BFs). There are two types of BF shifts: centripetal and centrifugal. Centripetal BF shifts are the shifts toward the BF of electrically stimulated neurons, and centrifugal BF shifts are the shifts away from it. The centripetal BF shifts result in the expanded representation of the BF of stimulated neurons and have been found in the ACs of different species of mammals. In contrast, the centrifugal BF shifts result in the compressed representation of the BF of stimulated neurons and have been found in the Doppler-shifted constant frequency (DSCF) area of the AC of the mustached bat (see Fig. 1A, 1) which is highly specialized for processing biosonar information in the frequency domain. The centripetal and centrifugal shifts are also found in neurons tuned in the time domain. For cortical electric stimulation, collicular duration-tuned neurons show centripetal shifts of their duration-tuning curves, whereas cortical and collicular delay-tuned neurons show centrifugal shifts of their delay-tuning curves. These changes were first studied in the central auditory system ipsilateral to the stimulated AC (for review, see Suga and Ma, 2003).
Figure 1.

Cortical auditory areas and the responses of a delay-tuned neuron. A, Dorsolateral view of the left cerebral cortex of the mustached bat. 1–6 are the DSCF, AIa (anterior division of the primary auditory cortex), Alp (posterior division of the AI), FM–FM, CF/CF, and DF (dorsal fringe) areas, respectively. B, The FM–FM area consists of three subdivisions in terms of combination sensitivity: FM1-FM2, FM1-FM3, and FM1-FM4. The subscripts 1–4 indicate the first through fourth harmonics of FM components of biosonar pulses and echoes. C, The array of PST histograms displaying the responses of a delay-tuned FM1-FM2 neuron to pulse FM1 (P) alone, echo FM2 (E) alone, and P-E pairs with different echo (E) delays ranging from 0 to 19 ms. The best delay for the facilitatory response of the neuron was 6 ms. An identical stimulus was delivered 50 times. FM1, 28.5–22.5 kHz sweep at 40 dB SPL. FM2, 58.0–46.0 kHz sweep at 20 dB SPL.
The effect of electric stimulation of the AC on the contralateral AC has been studied recently in the big brown bat (Ma and Suga, 2001) and the mustached bat (Xiao and Suga, 2005). In the big brown bat, contralateral BF shifts are centripetal and basically the same as ipsilateral BF shifts. In the DSCF area of the mustached bat, unlike ipsilateral BF shifts, contralateral BF shifts are centripetal or centrifugal depending on the place where the electric stimulation is delivered (Xiao and Suga, 2005).
The frequency modulated (FM)–FM area of the mustached bat AC is composed of delay-tuned neurons specialized for processing biosonar information in the time domain and consists of three subdivisions in terms of the combination sensitivity of the delay-tuned neurons (see Fig. 1B). Focal electric stimulation of the FM–FM area evokes centrifugal shifts of the best delays (BDs) of ipsilateral FM–FM neurons (Xiao and Suga, 2004). In our current study, we found that focal electric stimulation of the FM–FM area evoked facilitation, inhibition, and centrifugal BD shifts of the contralateral FM–FM neurons located in the different FM–FM subdivisions.
Materials and Methods
General.
Surgery, acoustic and electric stimulation, and recording of neural activity were the same as those described previously (Yan and Suga, 1998; Xiao and Suga, 2004). Therefore, only the essential portions of the methods are summarized below. The Animal Studies Committee (Washington University, St. Louis, MO) approved the protocol for the present research.
Eleven adult mustached bats (Pteronotus parnellii rubiginosus) from Trinidad were used. Under neuroleptanalgesia (Innovar, 4.08 mg/kg, body weight), a 1.5-cm-long metal post was glued on the dorsal surface of the bat's skull. A local anesthetic (lidocaine HCl) and antibiotic ointment (Furacin) were applied to the surgical wound. Three to four days after surgery, the awake animal was placed in a polyethylene-foam body mold, which was hung with an elastic band at the center of a 31°C soundproof room. The metal post glued on the skull was attached to a metal rod with set screws to immobilize the animal's head, which was adjusted directly toward the loudspeakers located 74 cm away. A few holes (50–100 μm in diameter) were made in the skull covering the FM–FM areas of the right and left auditory cortices. A pair of tungsten wire electrodes (∼7 μm in tip diameter, ∼35 μm apart, one proximal to the other) was orthogonally inserted through one of the holes, 500–700 μm deep into the FM–FM area on one side. The responses (action potentials) of delay-tuned neurons to pairs of FM sounds were recorded, and the BD for excitation of the neurons was measured. Then, this electrode pair was used to electrically stimulate the neurons. A single glass micropipette electrode (∼1 μm in tip diameter) was inserted into the FM–FM area on the other side to examine the effect of the electrical stimulation of the contralateral delay-tuned neurons.
Acoustic stimulation.
The mustached bat emits orientation sounds (biosonar pulses, or simply pulses). Each pulse consists of a constant frequency (CF) and FM components, which contain four harmonics. Therefore, each pulse contains eight components (CF1–4, FM1–4). FM–FM neurons are tuned to a combination of the FM1 of the pulse stimulus and FMn (n = 2, 3, or 4) of an echo stimulus with a specific time delay from the pulse stimulus. Different types of FM–FM neurons (FM1-FM2, FM1-FM3, and FM1-FM4) are separately clustered in the FM–FM area (see Fig. 1B) (Suga and O'Neill, 1979; O'Neill and Suga, 1982). Therefore, acoustic stimuli delivered to the animal were FM1-FMn pairs. Each FM sound was 3 ms long with a 0.5 ms rise-delay time.
To generate an FM sound, a voltage-controlled oscillator (Wavetek 134, San Diego, CA) was frequency modulated with a linear voltage-ramp generator to mimic the FM components in the species-specific biosonar pulse. The frequency modulation and the amplitude of each FM sound and the time interval (echo delay) between paired FM sounds were first manually varied to identify the best combination of two FM sounds (FM1-FMn) and the BD to excite a given neuron. Then, the FM1 sound (pulse stimulus) was fixed at the frequency sweep and amplitude to evoke the largest facilitation. The FMn sound (echo stimulus) was also fixed at the frequency sweep to evoke the largest facilitation and at 10 dB above the minimum threshold (i.e., the threshold of the response at the best FMn). Then, the FMn delay from FM1 was varied with a computer and other hardware (Tucker-Davis Technologies, Gainesville, FL) to obtain delay-response curves. The computer-controlled delay scan consisted of 22 150-ms time blocks: pulse only, echo only, and 20 pulse-echo pairs in which the echo delay randomly varied from 0 to 19 ms in 1.0 ms steps. An identical delay scan was delivered 50 times to obtain an array of poststimulus time (PST) histograms or PST cumulative histograms displaying the responses of a single neuron (see Fig. 1C).
Electric stimulation of cortical FM–FM neurons.
Electric stimulation was a monophasic electric pulse (0.2 ms long; 100 nA) delivered at a rate of 5/s for 7 min with a constant current stimulator (WPI modified model A360; World Precision Instruments, Sarasota, FL). Such electric pulses delivered at a low rate evoke changes in the cortical, thalamic, and collicular FM–FM (Yan and Suga, 1996, 1998) and DSCF (Zhang et al., 1997; Xiao and Suga, 2002) neurons but do not evoke any noticeable change in the cochlear microphonic responses (Xiao and Suga, 2002). These electric pulses were estimated to activate neurons within a 60 μm radius in the plane orthogonal to the cortical columns (Yan and Suga, 1996).
Data acquisition.
Action potentials of a single cortical FM–FM neuron tuned to a pair of FM1-FMn sounds with a specific FMn delay from FM1 were selected with a time-amplitude-window discriminator software (Tucker-Davis Technologies). At the beginning of data acquisition, the waveform of an action potential was stored and displayed on the monitor screen. This action potential (i.e., template) was compared with other action potentials obtained during data acquisition. The response of the single cortical neuron to a delay scan delivered 50 times was recorded before and after electric stimulation and was displayed as an array of PST or PST cumulative histograms. The data were stored in the computer hard-drive and were used for off-line analysis. In a 1 d experiment, one or two neurons were studied for the effect of and recovery from electric stimulation.
Off-line data processing.
The magnitude of auditory responses of a neuron was expressed by the number of spikes per 50 identical stimuli and was plotted as a function of echo delays. The BD shift evoked by the cortical electric stimulation was considered significant if it shifted back (i.e., recovered) to the BD in the control condition and if the auditory responses changed by the electric stimulation recovered by >85%. A t test was used to examine the significance of the difference between the auditory responses obtained before and after the electric stimulation as well as the difference between the BD shift-difference curves obtained from the normal and lesioned animals.
Lesion of the commissure of the inferior colliculus.
The commissure of the inferior colliculus and the corpus callosum are the potential neural pathways that carry the signals for evoking the change in the delay tuning of contralateral delay-tuned neurons. In four animals, the commissure of the inferior colliculus was lesioned by three 10–15 s, 500 μA monophasic electric currents. These currents were applied at three locations that were slightly different in depth (1200–1500 μm) and in the rostrocaudal axis (500–1000 μm posterior from the λ point) along the midline. After the lesion, the effect of the electric stimulation of the FM–FM area was studied on the delay tuning of the contralateral delay-tuned neurons. After the completion of the electrophysiological studies, the animal was killed by pentobarbital sodium (100 mg/kg) and was perfused with a saline solution and then with a formalin-saline solution. Its brain was frozen-sectioned (50 μm in thickness) and stained with cresyl violet stain. The lesion was confirmed under a compound microscope.
Results
BD shifts evoked by electric stimulation of contralateral cortical neurons
In 11 bats, the delay–response curves of 56 cortical FM–FM neurons were studied before and after the electric stimulation of contralateral cortical FM–FM neurons. The combination sensitivity of the recorded and stimulated neurons was FM1-FM2 (54 neurons), FM1-FM3 (30 neurons), or FM1-FM4 (28 neurons) as shown in Table 1. They were tuned to echo delays ranging from 1 to 13 ms (mean ± SE, 5.6 ± 0.3 ms; n = 112).
Table 1.
The combinations of recorded and stimulated neurons
| Electrically stimulated neurons | Recorded contralateral neurons |
|||
|---|---|---|---|---|
| FM1-FM2 | FM1-FM3 | FM1-FM4 | Total | |
| FM1-FM2 | 13 of 15 (4 of 5) | 3 of 4(1 of 2) | 3 of 3 (2 of 2) | 19 of 22 (7 of 9) |
| FM1-FM3 | 8 of 8 (3 of 3) | 4 of 5 (2 of 2) | 4 of 6 (1 of 1) | 16 of 19 (6 of 6) |
| FM1-FM4 | 8 of 9 (0 of 1) | 1 of 2 (1 of 1) | 2 of 4 (0 of 0) | 11 of 15 (1 of 2) |
| Total | 29 of 32 (7 of 9) | 8 of 11 (4 of 5) | 9 of 13 (3 of 3) | 46 of 56 (14 of 17) |
The numbers in each box indicate the total number of BD-shifted neurons of the total number of neurons investigated. The numbers in parentheses indicate the same as above, but these neurons were studied after a lesion of the commissure of the inferior colliculus.
Of the 56 neurons studied, 39 were recorded from seven normal bats, and 17 were recorded from four bats with a lesion of the commissure of the inferior colliculus. Of the 39 neurons, 37 had a BD that was different by >0.5 ms from that of the stimulated neurons and thus are called BD-unmatched neurons. The remaining two neurons had a BD that was the same as that of the stimulated neurons and are called BD-matched neurons. For contralateral electric stimulation (cES), BD-unmatched neurons showed either a centrifugal (29 neurons), centripetal (three neurons), or no (five neurons) BD shift. The neurons that did not show a BD shift had a BD that differed by >6.0 ms from that of the stimulated neurons. The BD-matched neurons did not show a BD shift for electric stimulation. In the following, the auditory responses and delay–response curves of FM–FM neurons studied before and after electric stimulation of contralateral FM–FM neurons are described.
Figure 1C shows the responses of an FM1-FM2 neuron to single FM sounds and paired FM1-FM2 sounds that mimic pulse-echo pairs. The responses to FM1-FM2 pairs were much larger than the sum of the responses to FM1 (P) alone and FM2 (E) alone when FM2 in the pairs delayed from FM1 by 3–13 ms. Therefore, these responses were facilitatory responses. The BD for the facilitatory response of the neuron was 6 ms. The number of spikes in each PST histogram was counted and used to plot a delay–response curve (Fig. 2A, open circles).
Figure 2.

BD shifts of an FM1-FM2 (A) and an FM1-FM4 (B) neuron evoked by electric stimulation of contralateral FM1-FM4 (A) or FM1-FM3 (B) neurons. Aa and Ba show delay–response curves obtained before (open circles; control), 60 min (A) or 50 min (B) after (filled circles), and 190 min (A) or 170 min (B) after (open triangle; recovery) the electric stimulation of the contralateral FM–FM neurons. P, Pulse FM1; E, echo FM2 (for A) and echo FM4 (for B). The downward arrows indicate the BDs of the contralateral stimulated neurons. Each data point indicates a mean and SE. Ab, Ac, Bb, and Bc show PST histograms displaying the responses at the BDs of the given neurons in the control (BDc) and shifted (BDs) conditions. 1–3 show, respectively, the responses recorded before (control), 60 min (A) or 50 min (B) after, and 190 min (A) or 170 min (B) after (recovery) the electric stimulation. The dashed arrow in Aa indicates the delay width at 50% of the maximum response.
Electric stimulation of contralateral FM–FM neurons evoked delay-dependent changes in the facilitatory response. When the contralateral FM1-FM4 neurons tuned to a 7 ms delay were electrically stimulated (Fig. 2A, arrow), for example, the response of the FM1-FM2 neuron tuned to a 6 ms delay decreased at this delay (Fig. 2Ab) but increased at a 4 ms delay (Fig. 2Ac). Because of the delay-dependent inhibition and facilitation, the BD of the neuron became shorter, from 6 to 4 ms (Fig. 2Aa, filled circles). That is, the BD shifted away from that of the stimulated neurons. In addition to this BD shift, the delay–response curve of the neuron became sharper. These changes disappeared (i.e., the BD and tuning curve recovered to the control) ∼190 min after the electric stimulation (Fig. 2Aa, dashed line).
The BD of a recorded neuron could become shorter (Fig. 2A) or longer (Fig. 2B), depending on whether the BD of the stimulated contralateral neurons was longer or shorter than the BD of the recorded neuron. Figure 2B shows the delay–response curve of an FM1-FM4 neuron tuned to a 6 ms delay (a, open circles). When contralateral FM1-FM3 neurons tuned to a 3 ms delay were electrically stimulated, the response of the FM1-FM4 neuron decreased at a 6 ms delay (Fig. 2Bb), but increased at an 8 ms delay (Fig. 2Bc). Accordingly, the BD of the FM1-FM4 neuron became longer from 6 to 8 ms (Fig. 2Ba, filled circles). That is, the BD shifted away from that of the stimulated neurons. In addition to this BD lengthening, the delay–response curve of the neuron became broader. These changes disappeared ∼170 min after the electric stimulation. In the great majority of neurons studied (43 of the 56), the “recorded” BD shifted away from the “stimulated” BD. That is, the BD shift was centrifugal.
The sharpness of delay-tuning curves varies with the best delay: the shorter the best delay, the sharper the delay tuning. The sharpness of a delay-tuning curve is expressed by a “delay width,” which is defined as the width of the curve at a 50% maximum response (Suga and Horikawa, 1986) (Fig. 2Aa, dashed arrow). The BD shifts evoked by the contralateral electric stimulation were accompanied with changes in delay width, as shown in Figure 2. Figure 3 shows the distribution of changes in delay width as a function of the BD shifts evoked by the contralateral electric stimulation. When the BD shortened, the delay width became narrower; however, when the BD lengthened, it became broader. The BD shifts were clearly correlated with the changes in delay width (r = 0.6).
Figure 3.

The relationship between BD shifts and changes in 50% delay width. Each filled circle represents the datum obtained from a single neuron. r, Correlation coefficient.
The amount of BD shifts varied as a function of the differences in BD between the recorded and contralateral stimulated neurons (Fig. 4A). The BD shift became larger with a larger BD difference and became maximum (2.0 ms) when the BD difference was 2–3 ms. The slope of the BD shift-difference curve between −3 and +3 ms BD differences was 0.7 (r = 0.93; n = 37). Beyond a 3 ms BD difference, the BD shift became smaller with an increase in BD difference and became zero at and beyond a 6 ms BD difference. In two BD-matched neurons (×, at the origin of the coordinates), the BDs did not shift, and their responses at the BDs increased by 14 and 45%. The BDs of these matched neurons were 4.0 and 5.0 ms. The BD shift-difference curve for contralateral cortical electric stimulation was similar to that for ipsilateral cortical electric stimulation obtained by Xiao and Suga (2004) (Fig. 4B) (p > 0.1). The BD shifts of FM–FM neurons recorded in the right hemisphere (n = 26) were the same as those of FM–FM neurons recorded in the left hemisphere (n = 30). There was no sign of hemispheric asymmetry in the effect of the electric stimulation (p = 0.9).
Figure 4.

A, Distribution of BD shifts as a function of BD differences between the recorded FM–FM (Rec.) and electrically stimulated contralateral FM–FM neurons (cES). Open circles and triangles, Centrifugal (n = 29) and centripetal (n = 3) BD shifts measured in the normal bats, respectively. Filled circles, BD shifts (n = 17) measured in the bats with a lesioned collicular commissure. ×, No BD shifts (n = 7; 5 BD-unmatched neurons and 2 BD-matched neurons). The curve was obtained by averaging the data points at each BD difference and then two-point smoothing. B, The BD shifts of FM–FM neurons evoked by electric stimulation of ipsilateral (ipsi.; filled diamonds) and contralateral (contra.; open diamonds) FM–FM neurons. Each data point indicates a mean and SE. The numbers in the parentheses indicate the numbers of neurons from which the data were obtained. The data shown with the filled diamonds were obtained from the study by Xiao and Suga (2004).
The FM–FM area consists of three subdivisions (Fig. 1B), and each subdivision has an echo-delay axis (Suga and O'Neill, 1979; O'Neill and Suga, 1982). An important question is whether electric stimulation of one of the three subdivisions on one side evokes BD shifts in all three subdivisions on the other side. Electric stimulation of the contralateral FM1-FM2 neurons, for example, evoked the BD shifts of all three types of FM–FM neurons. This was also the case for the BD shifts evoked by the electric stimulation of the contralateral FM1-FM3 or FM1-FM4 neurons (Table 1). Figure 4A shows that the amount of the BD shift depended on the BD difference between the recorded and stimulated FM–FM neurons, not on the types of the recorded and stimulated FM–FM neurons. The electric stimulation perhaps evoked BD shifts equally along an iso-BD line crossing the three subdivisions of the FM–FM area.
Three FM–FM neurons showed a centripetal BD shift for contralateral electric stimulation (Fig. 4A, open triangles). They were located in the rostral portion of the FM–FM area and were FM1-FM2 neurons. Their BDs were 1, 4, and 5 ms, and their BD shifts ranged from 1 to 2 ms. The BD differences between the recorded and stimulated neurons for these three neurons ranged from 1 to 3 ms.
Changes in response magnitude accompanied with BD shifts
The centrifugal BD shift evoked by the contralateral electric stimulation was always associated with changes in response magnitude (Fig. 2). The responses of neurons at their BDs in the control condition decreased after electric stimulation of contralateral FM–FM neurons. The amount of decrease in response depended on the BD differences between the recorded and electrically stimulated neurons (Fig. 5A, open circles) and also on the BD shifts depending on the BD, as shown in Figure 4A. The responses at the new BDs in the shifted condition increased. The amount of the increase also depended on the BD differences (Fig. 5A, filled circles) and BD shifts. The absolute values of the increase in response at the new (shifted) BDs were smaller than those of the decrease in response at the original (control) BDs. However, the percentage increases at the shifted BDs were similar to those at the control BDs, and the SEMs at the shifted BDs were much larger that those at the control BDs, because the percentages were calculated referring to the small responses at the non-BDs (that changed into the shifted BDs after the electric stimulation) and the large responses at the control BDs before the electric stimulation.
Figure 5.
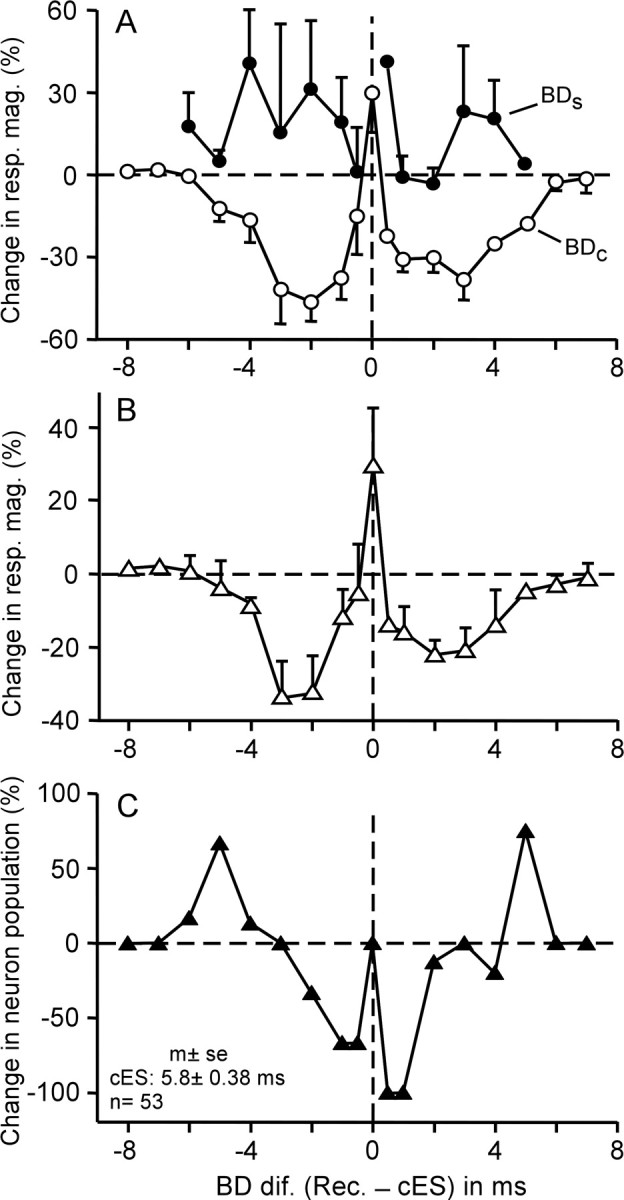
Changes in the response (A, B) and population (C) of FM–FM neurons evoked by electric stimulation of contralateral FM–FM neurons. A, Changes in the response magnitudes (mag.) of 53 FM–FM neurons at the BDs in the control (BDc; open circles) and shifted (BDs; filled circles) conditions evoked by electric stimulation of contralateral FM–FM neurons. Each data point indicates a mean and SE. B, Changes in the response magnitudes between the responses at the new (i.e., shifted) BD after electric stimulation and the original (i.e., control) BD before electric stimulation. The changes are expressed in percentage of the response of the control BD. C, Change in the population of FM–FM neurons tuned to different echo delays. The abscissa represents differences in BD between recorded (Rec.) and contralateral electrically stimulated (cES) FM–FM neurons.
The physiologically meaningful question was whether the increased responses at the shifted BDs were larger than the responses at the control BDs before the electric stimulation. Therefore, in the 43 neurons showing a centrifugal BD shift, the percentage change in the response at the shifted BD (BDs) was calculated referring to the response at the control BD (BDc) before the contralateral electric stimulation. In addition, the percentage change in the response at the BDc evoked by the electric stimulation was calculated for the 10 neurons showing no BD shift. The curve in Figure 5B shows these percentage changes in response along the delay axis. It clearly indicates that highly focused facilitation occurred at the site corresponding to the electrically stimulated location on the contralateral FM–FM area and that this facilitated site was sandwiched between widespread inhibited zones. Facilitation changed into inhibition at the point 0.4 ms away from the BD of the stimulated neurons. The BD changes at a rate of 0.58 ms/100 μm along the delay axis in the FM–FM area (Suga and O'Neill, 1979), so that facilitation occurred within a 69 μm distance from the point corresponding to the electrically stimulated location on the contralateral FM–FM area. In contrast, inhibition spread to ∼6–7 ms (∼1034–1207 μm away) from the above corresponding point along the delay axis.
When the BDs of neurons shifted, the population of neurons representing individual echo delays changed. Therefore, we calculated the change in the population of neurons per delay (Fig. 5C) with the curve in Figure 4A. In the condition in which BDs maximally shifted after the contralateral cortical electric stimulation, the number of BD-matched neurons did not change, but the number of BD-unmatched neurons decreased for 0.5–3.0 ms BD differences but increased for 4.0–6.0 ms BD differences. Figure 5, B and C, indicates that the site corresponding to the electrically stimulated location on the contralateral FM–FM area becomes more prominent by the facilitation of response and surrounding inhibition of response and by the reduction of the population of activated neurons.
Time course of BD shifts
The time course of a BD shift was studied in 11 neurons that showed 2 ms centrifugal BD shifts. The BD shifts started to develop 49 ± 4.3 min after the onset of the electric stimulation, became largest at ∼80 min after the onset of the electric stimulation, and disappeared 176 ± 5.9 min after it (Fig. 6A). They showed a small rebound BD shift, which lasted ∼40 min. Such a rebound in the BD shift (as well as in the BF shift) has never been reported. Different from the BD shift, the response at the control BD (BDc) showed a decrease in the first sample obtained in a period of 8–14 min after the onset of the contralateral electric stimulation. This decrease (inhibition at the BDc), being essential for evoking a BD shift, somehow occurred much earlier than the BD shift. The decrease in response became maximum at ∼90 min after that. It disappeared ∼210 min after (Fig. 6B, open circles). In contrast, the change in the response at the shifted BD (BDs) was small (Fig. 6B, filled circles).
Figure 6.

The mean time courses of the BD shifts (A) and changes in response magnitude (B) of 11 FM–FM neurons, which showed a 2 ms BD shift for electric stimulation of contralateral FM–FM neurons. Each symbol and a bar indicate a mean and SE, respectively. In B, the open and filled circles represent the changes in response magnitude at the control (original) and shifted (new) BDs, respectively.
BD shifts after the lesion of the commissure of the inferior colliculus
Two neural pathways are conceivable for evoking the contralateral BD shifts: the corpus callosum and the commissure of the inferior colliculus. In four bats, the commissure of the inferior colliculus was electrolytically lesioned (Fig. 7).
Figure 7.
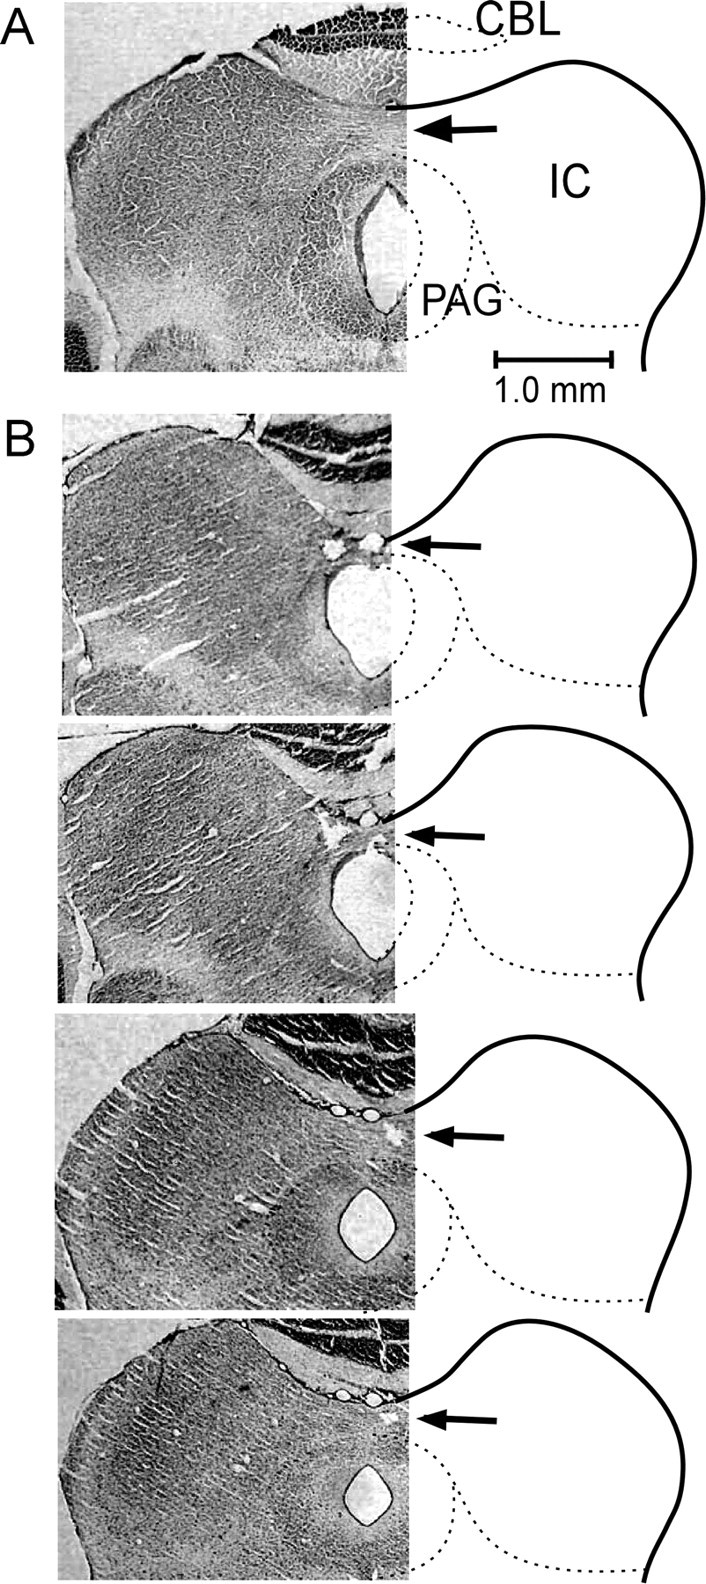
Frontal sections across the inferior colliculi. A, Normal brain. B, Brain with the 90% lesioned commissure of the inferior colliculus. Arrows indicate the commissure and electrolytic lesions. CBL, Cerebellum; IC, inferior colliculus; PAG, periaqueductal gray. Frozen sections of 50 μm are shown (cresyl violet stain).
The commissure is ∼300 μm thick and ∼500 μm wide along the median plane. The lesion of the commissure was ∼40% in one animal, ∼80% in two animals, and ∼90% in the remaining animal. In the 40, 80, and 90% lesioned animals, two, 13, and two FM–FM neurons were studied for BD shifts, respectively. These 17 neurons were BD-unmatched neurons located at 17 cortical loci. The BDs of the recorded and contralateral stimulated neurons ranged from 1.0 to 11 ms (6.3 ± 0.5 ms; n = 34). The BD differences between the recorded and stimulated neurons ranged from 0.5 to 7 ms (3.2 ± 0.5 ms; n = 17). Of the 17 recorded neurons, 14 FM–FM neurons shifted their BDs after electric stimulation of the contralateral FM–FM neurons (Fig. 4A, filled circles). The remaining three neurons did not shift their BDs, which were different by 0.5, 6, or 7 ms from those of the stimulated neurons.
Figure 8 shows a BD shift of a FM1-FM4 neuron evoked by electric stimulation of contralateral FM1-FM2 neurons in the bat with a ∼90% lesioned commissure of the inferior colliculus. The BD of the FM1-FM4 neuron shifted from 10 to 9 ms (i.e., shifted away from the BD of the stimulated neurons at 11 ms). All the data obtained from the 17 neurons are plotted in Figure 4A (filled circles). The maximum centrifugal BD shift was 2.0 ms, which occurred at BD differences of 2–3 ms. The distribution of the BD shifts observed in the four bats with the lesioned commissure did not differ from that of the BD shifts observed in the seven normal bats (p = 0.1). Therefore, the commissure of the inferior colliculus is not the pathway for evoking the contralateral BD shifts, but the corpus callosum is the most likely pathway.
Figure 8.

A BD shift evoked by focal electric stimulation of the contralateral FM–FM area in the bat with the ∼90% lesioned commissure of the inferior colliculus. a, Delay–response curves of an FM1-FM4 neuron obtained before (open circles; control), 50 min after (filled circles), and 150 min after (open triangles; recovery) the electric stimulation of contralateral FM1-FM2 neurons. P, Pulse FM1; E, echo FM4. The arrow indicates the BD of the stimulated contralateral neurons. Each data point indicates a mean and SE. b, c, PST histograms displaying the responses at the BDs of the FM1-FM4 neuron in the control (BDc) and shifted (BDs) conditions. 1–3 show, respectively, the responses recorded before (control), 50 min after, and 150 min after (recovery) the electric stimulation. CIC, Commissure of the inferior colliculus.
Discussion
Corpus callosum for bilateral cortical connections
In general, sensory association cortices are much more callosally connected than the primary sensory cortices (Gazzaniga, 1987). The AC has the callosal connection (Diamond et al., 1968; Nakamura and Kanaseki, 1989; Ruttgers et al., 1990; Clarke et al., 1995). In the primary auditory cortex (AI), there are two major types of binaural neurons: excitatory-excitatory (EE) and inhibitory-excitatory (IE). EE neurons show excitatory responses (E) to ipsilateral and contralateral monaural acoustic stimuli and stronger responses to binaural stimuli than to monaural stimuli. They are broadly sensitive to the auditory field in front of the animal. IE neurons show inhibitory responses (I) to ipsilateral stimuli, excitatory responses to contralateral stimuli, and weak or no excitatory responses to binaural stimuli. EE clusters are callosally connected, but IE clusters are not in cats (Imig and Brugge, 1978) and in mustached bats (Liu and Suga, 1997).
It has not yet been studied anatomically whether the cortical FM–FM area is callosally connected. As described previously, FM–FM neurons are sensitive to the combination of pulse FM1 and echo FMn (n = 2, 3, or 4). For FM1, they are very broadly sensitive to the auditory field in front of the animal and their best azimuths are front 2° on the average, despite those of peripheral neurons being lateral 25°. Therefore, they are EE. For FMn, however, they are broadly sensitive to the contralateral auditory field. Their best azimuths are similar to those of peripheral neurons (lateral 35° for FM2 and lateral 19° for FM3 and FM4). They must be 0E: ipsilaterally neither excited nor inhibited but contralaterally excited (Suga et al., 1990). In the primary visual (Innocenti, 1980; Segraves and Rosenquist, 1982a,b) and somatosensory (Ebner and Myers, 1965; Jones and Powell, 1968) cortices, the area representing the vertical visual meridian or body midline is callosally connected, whereas the area representing the peripheral visual field or distal limbs is not. This is also true in the auditory cortex. FM–FM neurons are EE in terms of their FM1 response, and the FM–FM area is a non-AI. Therefore, it is most likely that the FM–FM area is callosally connected.
In our current studies, the lesion of the commissure of the IC did not abolish the development of the BD shift evoked by electric stimulation of the contralateral FM–FM area. Therefore, we may conclude that the bilateral interaction of the cortical FM–FM area occurs via the corpus callosum.
Changes in the AC evoked by focal electric stimulation of the ipsilateral AC
The FM–FM area consists of three subdivisions in terms of combination sensitivity: FM1-FM2, FM1-FM3, and FM1-FM4 (Suga and O'Neill, 1979; O'Neill and Suga, 1982). In contrast, the DSCF area consists of two subdivisions in terms of binaural neurons: dorsal (DSCFd) and ventral (DSCFv). The DSCFd and DSCFv mostly consist of IE and EE neurons, respectively (Manabe et al., 1978). In the FM–FM and DSCF areas, focal ipsilateral electric stimulation evokes centrifugal BD or BF shifts regardless of the subdivisions. An antagonist of GABAA receptors applied to the FM–FM or DSCF area of the AC blocks cortical inhibition and changes these centrifugal shifts into centripetal shifts (Xiao and Suga, 2004, 2005). The directions of the shifts apparently depend on the balance between excitation and inhibition spreading within the AC from the site of the electrical stimulation. When inhibition is stronger than excitation, centrifugal shifts are evoked instead of centripetal shifts (Suga et al., 2000). Lateral inhibition is stronger in the highly specialized FM–FM and DSCF areas than in the nonspecialized or less-specialized ACs of rodents (Maldonado and Gerstein, 1996; Sakai and Suga, 2001, 2002; Weinberger and Bakin, 1998) and big brown bats (Chowdhury and Suga, 2000; Ma and Suga, 2001). In these nonspecialized or less-specialized ACs, the shift in tuning curve is centripetal. In the somatosensory (Buonomano and Merzenich, 1998; Rasmusson, 2000) and visual (Godde et al., 2002) cortices, the shift in receptive field is also centripetal.
Changes in the AC evoked by focal electric stimulation of the contralateral AC
Unlike the BF shifts in the ipsilateral DSCF area evoked by the electric stimulation, the BF shift in the contralateral DSCF area changes from centrifugal to centripetal or vice versa depending on the relationship in location between the recorded and stimulated contralateral neurons. That is, DSCFd neurons show centripetal BF shifts to the contralateral DSCFd stimulation but centrifugal BF shifts to the contralateral DSCFv stimulation, whereas DSCFv neurons show centrifugal BF shifts to the contralateral DSCFd stimulation and centripetal BF shifts to the contralateral DSCFv stimulation (Xiao and Suga, 2005).
Like the BD shifts in the ipsilateral FM–FM area, the BD shifts in the contralateral FM–FM area were predominantly centrifugal for electric stimulation of FM–FM neurons regardless of the combinations of the types of the recorded and contralateral stimulated FM–FM neurons. The three components of an echo (FM2, FM3, and FM4) always return to the bat at the same time from a target after an emission of a biosonar pulse. Therefore, it makes sense that all types of FM–FM neurons were simultaneously modulated in the amount and direction of BD shifts by the contralateral FM–FM neurons. Each of the three subdivisions of the FM–FM area has the delay (time) axis and iso-BD lines across it without interruptions (Suga and O'Neill, 1979; Misawa and Suga, 2001). Our current data indicate that focal electric stimulation of the FM–FM area causes the centrifugal shift of iso-BD lines in the contralateral FM–FM area, presumably via the corpus callosum.
In the big brown bat, which emits FM pulses for echolocation, the BF shifts in the ipsilateral and contralateral ACs are predominantly centripetal for focal electric stimulation of the AC (Ma and Suga, 2001).
The functional significance of the modulation of the AC by the contralateral AC
Focal electric stimulation of the FM–FM area evokes changes in the delay-tuning curves and responses to paired sounds of neurons in the ipsilateral (Xiao and Suga, 2004) and contralateral (our current paper) FM–FM areas. BD-matched neurons do not shift their BDs and increase the responses at their BDs, whereas BD-unmatched neurons shift their BDs away from the BD of the stimulated neurons and reduce their responses. Therefore, the overall changes, including those in the BD-matched and BD-unmatched neurons, increase the contrast in the neural representation of the BD of the stimulated cortical neurons.
Because excitation evoked by cortical electric stimulation is unnatural, one may consider that the changes observed in the AC are also unnatural. The BF shifts (i.e., the change in the frequency map) in the AC evoked by focal electric stimulation of the AC are basically the same as those caused by auditory fear conditioning or a long repetitive tonal stimulation, although the cortical BF shift is long term for the conditioning but short term for the cortical electric stimulation (Gao and Suga, 2000; Ma and Suga, 2003). This short-term cortical BF shift changes into a long-term BF shift when the cortical electric stimulation is accompanied with an application of acetylcholine to the AC (Ma and Suga, 2005) or with electric stimulation of the cholinergic basal forebrain (Ma and Suga, 2003). It has been hypothesized that the cortical short-term BF shift evoked by the cortical neural net and corticofugal feedback loop is augmented and changed into the long-term BF shift by activation of the cholinergic basal forebrain, which is activated by an acoustic stimulus becoming behaviorally relevant through conditioning (Gao and Suga, 1998; Suga and Ma, 2003). It is most likely that, as with the BF shift, the BD shift is amplified and stabilized by acetylcholine. Therefore, bilateral cortical interaction reported in our current paper presumably plays a role in the adaptation of the auditory cortex for the optimal processing of behaviorally relevant sounds and in keeping delay maps on the right and left hemispheres equal. The time courses of the BD shift and the change in response magnitude, however, indicate that these changes do not occur moment-to-moment during echolocation. Our experiments have revealed a fundamental function of the bilateral cortical interaction: the adaptation and maintenance of the functional organization of the central auditory system.
It has been reported that interhemispheric inhibition of the human motor cortex occurs via the corpus callosum (Ferbert et al., 1992; Netz et al., 1995). The most convincing transcallosal inhibition is demonstrated by callosotomy. In rhesus monkeys, the left dorsotemporal pole of the superior temporal gyrus is more active for species-specific calls than the right dorsotemporal pole. Callosotomy increases the activity of the right dorsotemporal pole and eliminates this hemispheric asymmetry (Poremba et al., 2004). All callosal fibers originating from pyramidal cells are excitatory. Therefore, transcallosal inhibition must be mediated by GABAergic neurons activated by callosal fibers. Our current data and the data presented by Xiao and Suga (2005) indicate that bilateral cortical interactions consist of focused facilitation and widespread lateral inhibition. These interactions must be the most fundamental mechanisms for bilateral cortical interactions.
Footnotes
This work was supported by National Institute on Deafness and Other Communicative Disorders Grant DC00175 and by National Natural Science Foundation in China Grants 30570571 and 30670665 (Z.X.). We thank Sally E. Miller for editing this manuscript.
References
- Bloom JS, Hynd GW. The role of the corpus callosum in interhemispheric transfer of information: excitation or inhibition? Neuropsychol Rev. 2005;15:59–71. doi: 10.1007/s11065-005-6252-y. [DOI] [PubMed] [Google Scholar]
- Buonomano DV, Merzenich MM. Cortical plasticity: from synapses to maps. Annu Rev Neurosci. 1998;21:149–186. doi: 10.1146/annurev.neuro.21.1.149. [DOI] [PubMed] [Google Scholar]
- Chowdhury SA, Suga N. Reorganization of the frequency map of the primary auditory cortex evoked by focal cortical electrical stimulation in the big brown bat. J Neurophysiol. 2000;83:1856–1863. doi: 10.1152/jn.2000.83.4.1856. [DOI] [PubMed] [Google Scholar]
- Clarke S, de Ribaupierre F, Bajo VM, Rouiller EM, Kraftsik R. The auditory pathway in cat corpus callosum. Exp Brain Res. 1995;104:534–540. doi: 10.1007/BF00231988. [DOI] [PubMed] [Google Scholar]
- Diamond IT, Jones EG, Powell TPS. Interhemispheric fiber connections of the auditory cortex of the cat. Brain Res. 1968;11:177–193. doi: 10.1016/0006-8993(68)90080-2. [DOI] [PubMed] [Google Scholar]
- Ebner FF, Myers RE. Distribution of corpus callosum and anterior commissure in cat and raccoon. J Comp Neurol. 1965;124:353–365. doi: 10.1002/cne.901240306. [DOI] [PubMed] [Google Scholar]
- Ferbert A, Priori A, Rothwell JC, Day BL, Colebatch JG, Marsden CD. Interhemispheric inhibition of the human motor cortex. J Physiol (Lond) 1992;453:525–546. doi: 10.1113/jphysiol.1992.sp019243. [DOI] [PMC free article] [PubMed] [Google Scholar]
- Gao E, Suga N. Experience-dependent corticofugal adjustment of midbrain frequency map in bat auditory system. Proc Natl Acad Sci USA. 1998;95:12663–12670. doi: 10.1073/pnas.95.21.12663. [DOI] [PMC free article] [PubMed] [Google Scholar]
- Gao E, Suga N. Experience-dependent plasticity in the auditory cortex and the inferior colliculus of bats: role of the corticofugal system. Proc Natl Acad Sci USA. 2000;97:8081–8086. doi: 10.1073/pnas.97.14.8081. [DOI] [PMC free article] [PubMed] [Google Scholar]
- Gazzaniga MS. Corpus callosum. In: Adelman G, editor. Encyclopedia of neuroscience. Boston: Birkhauser; 1987. pp. 280–281. [Google Scholar]
- Godde B, Leonhardt R, Cords SM, Dinse HR. Plasticity of orientation preference maps in the visual cortex of adult cats. Proc Natl Acad Sci USA. 2002;99:6352–6357. doi: 10.1073/pnas.082407499. [DOI] [PMC free article] [PubMed] [Google Scholar]
- Imig TJ, Brugge JF. Sources and terminations of callosal axons related to binaural and frequency maps in primary auditory cortex of the cat. J Comp Neurol. 1978;182:637–660. doi: 10.1002/cne.901820406. [DOI] [PubMed] [Google Scholar]
- Innocenti GM. The primary visual pathway through the corpus callosum: morphological and functional aspects in the cat. Arch Ital Biol. 1980;118:124–188. [PubMed] [Google Scholar]
- Jones EG, Powell TP. The commissural connexions of the somatic sensory cortex in the cat. J Anat. 1968;103:433–455. [PMC free article] [PubMed] [Google Scholar]
- Liu W, Suga N. Binaural and commissural organization of the primary auditory cortex of the mustached bat. J Comp Physiol A Neuroethol Sens Neural Behav Physiol. 1997;181:599–605. doi: 10.1007/s003590050143. [DOI] [PubMed] [Google Scholar]
- Ma X, Suga N. Plasticity of bat's central auditory system evoked by focal electric stimulation of auditory and/or somatosensory cortices. J Neurophysiol. 2001;85:1078–1087. doi: 10.1152/jn.2001.85.3.1078. [DOI] [PubMed] [Google Scholar]
- Ma X, Suga N. Augmentation of plasticity of the central auditory system by the basal forebrain and/or somatosensory cortex. J Neurophysiol. 2003;89:90–103. doi: 10.1152/jn.00968.2001. [DOI] [PubMed] [Google Scholar]
- Ma X, Suga N. Long-term plasticity evoked by electric stimulation and acetylcholine applied to the auditory cortex. Proc Natl Acad Sci USA. 2005;102:9335–9340. doi: 10.1073/pnas.0503851102. [DOI] [PMC free article] [PubMed] [Google Scholar]
- Maldonado PE, Gerstein GL. Neuronal assembly dynamics in the rat auditory cortex during reorganization induced by intracortical microstimulation. Exp Brain Res. 1996;112:431–441. doi: 10.1007/BF00227949. [DOI] [PubMed] [Google Scholar]
- Manabe T, Suga N, Ostwald J. Aural representation in the doppler-shifted-CF processing area of the primary auditory cortex of the mustached bat. Science. 1978;200:339–342. doi: 10.1126/science.635594. [DOI] [PubMed] [Google Scholar]
- Misawa H, Suga N. Multiple combination sensitive neurons in the auditory cortex of the mustached bat. Hear Res. 2001;151:15–29. doi: 10.1016/s0300-2977(00)00079-6. [DOI] [PubMed] [Google Scholar]
- Mountcastle VB. Perceptual neuroscience: the cerebral cortex. Cambridge, MA: Harvard UP; 1998. p. 72. [Google Scholar]
- Nakamura H, Kanaseki T. Topography of the corpus callosum in the cat. Brain Res. 1989;485:171–175. doi: 10.1016/0006-8993(89)90679-3. [DOI] [PubMed] [Google Scholar]
- Netz J, Ziemann U, Homberg V. Hemispheric asymmetry of transcallosal inhibition in man. Exp Brain Res. 1995;104:527–533. doi: 10.1007/BF00231987. [DOI] [PubMed] [Google Scholar]
- O'Neill WE, Suga N. Encoding of target-range information and its representation in the auditory cortex of the mustached bat. J Neurosci. 1982;2:17–31. doi: 10.1523/JNEUROSCI.02-01-00017.1982. [DOI] [PMC free article] [PubMed] [Google Scholar]
- Poremba A, Malloy M, Saunders RC, Carson RE, Herscovitch P, Mishkin M. Species-specific calls evoke asymmetric activity in the monkey's temporal poles. Nature. 2004;427:448–451. doi: 10.1038/nature02268. [DOI] [PubMed] [Google Scholar]
- Rasmusson DD. The role of acetylcholine in cortical synaptic plasticity. Behav Brain Res. 2000;115:205–218. doi: 10.1016/s0166-4328(00)00259-x. [DOI] [PubMed] [Google Scholar]
- Ruttgers K, Aschoff A, Friauf E. Commissural connections between the auditory cortices of the rat. Brain Res. 1990;509:71–79. doi: 10.1016/0006-8993(90)90310-8. [DOI] [PubMed] [Google Scholar]
- Sakai M, Suga N. Plasticity of the cochleotopic (frequency) map in specialized and nonspecialized auditory cortices. Proc Natl Acad Sci USA. 2001;98:3507–3512. doi: 10.1073/pnas.061021698. [DOI] [PMC free article] [PubMed] [Google Scholar]
- Sakai M, Suga N. Centripetal and centrifugal reorganizations of frequency map of auditory cortex in gerbils. Proc Natl Acad Sci USA. 2002;99:7108–7112. doi: 10.1073/pnas.102165399. [DOI] [PMC free article] [PubMed] [Google Scholar]
- Segraves MA, Rosenquist AC. The distribution of the cells of origin of callosal projections in cat visual cortex. J Neurosci. 1982a;2:1079–1089. doi: 10.1523/JNEUROSCI.02-08-01079.1982. [DOI] [PMC free article] [PubMed] [Google Scholar]
- Segraves MA, Rosenquist AC. The afferent and efferent callosal connections of retinotopically defined areas in cat cortex. J Neurosci. 1982b;2:1090–1107. doi: 10.1523/JNEUROSCI.02-08-01090.1982. [DOI] [PMC free article] [PubMed] [Google Scholar]
- Suga N, Horikawa J. Multiple time axes for representation of echo delays in the auditory cortex of the mustached bat. J Neurophysiol. 1986;55:776–805. doi: 10.1152/jn.1986.55.4.776. [DOI] [PubMed] [Google Scholar]
- Suga N, Ma X. Multiparametric corticofugal modulation and plasticity in the auditory system. Nat Rev Neurosci. 2003;4:783–794. doi: 10.1038/nrn1222. [DOI] [PubMed] [Google Scholar]
- Suga N, O'Neill WE. Neural axis representing target range in the auditory cortex of the mustached bat. Science. 1979;206:351–353. doi: 10.1126/science.482944. [DOI] [PubMed] [Google Scholar]
- Suga N, Kawasaki M, Burkard RF. Delay-tuned neurons in auditory cortex of mustached bat are not suited for processing directional information. J Neurophysiol. 1990;64:225–235. doi: 10.1152/jn.1990.64.1.225. [DOI] [PubMed] [Google Scholar]
- Suga N, Gao E, Zhang Y, Ma X, Olsen JF. The corticofugal system for hearing: recent progress. Proc Natl Acad Sci USA. 2000;97:11807–11814. doi: 10.1073/pnas.97.22.11807. [DOI] [PMC free article] [PubMed] [Google Scholar]
- Weinberger NM, Bakin JS. Learning-induced physiological memory in adult primary auditory cortex: receptive fields plasticity, model, and mechanisms. Audiol Neurootol. 1998;3:145–167. doi: 10.1159/000013787. [DOI] [PubMed] [Google Scholar]
- Xiao Z, Suga N. Reorganization of the cochleotopic map in the bat's auditory system by inhibition. Proc Natl Acad Sci USA. 2002;99:15743–15748. doi: 10.1073/pnas.242606699. [DOI] [PMC free article] [PubMed] [Google Scholar]
- Xiao Z, Suga N. Reorganization of the auditory cortex specialized forecho-delay processing in the mustached bat. Proc Natl Acad Sci USA. 2004;101:1769–1774. doi: 10.1073/pnas.0307296101. [DOI] [PMC free article] [PubMed] [Google Scholar]
- Xiao Z, Suga N. Asymmetry in corticofugal modulation of frequency-tuning in mustached bat auditory system. Proc Natl Acad Sci USA. 2005;102:19162–19167. doi: 10.1073/pnas.0509761102. [DOI] [PMC free article] [PubMed] [Google Scholar]
- Yan J, Suga N. Corticofugal modulation of time-domain processing of biosonar information in bats. Science. 1996;273:1100–1103. doi: 10.1126/science.273.5278.1100. [DOI] [PubMed] [Google Scholar]
- Yan W, Suga N. Corticofugal modulation of midbrain frequency map in bat auditory system. Nat Neurosci. 1998;1:54–58. doi: 10.1038/255. [DOI] [PubMed] [Google Scholar]
- Zhang Y, Suga N, Yan J. Corticofugal modulation of frequency processing in bat auditory system. Nature. 1997;387:900–903. doi: 10.1038/43180. [DOI] [PubMed] [Google Scholar]