

Abstract
Previous studies have shown that intracortical activity can be used to operate prosthetic devices such as an artificial limb. Previously used neuronal signals were either the activity of tens to hundreds of spiking neurons, which are difficult to record for long periods of time, or local field potentials, which are highly correlated with each other. Here, we show that by estimating multiunit activity (MUA), the superimposed activity of many neurons around a microelectrode, and using a small number of electrodes, an accurate prediction of the upcoming movement is obtained. Compared with single-unit spikes, single MUA recordings are obtained more easily and the recordings are more stable over time. Compared with local field potentials, pairs of MUA recordings are considerably less redundant. Compared with any other intracortical signal, single MUA recordings are more informative. MUA is informative even in the absence of spikes. By combining information from multielectrode recordings from the motor cortices of monkeys that performed either discrete prehension or continuous tracing movements, we demonstrate that predictions based on multichannel MUA are superior to those based on either spikes or local field potentials. These results demonstrate that considerable information is retained in the superimposed activity of multiple neurons, and therefore suggest that neurons within the same locality process similar information. They also illustrate that complex movements can be predicted using relatively simple signal processing without the detection of spikes and, thus, hold the potential to greatly expedite the development of motor-cortical prosthetic devices.
Keywords: decoding, extracellular recordings, local field potentials, macaque monkey, prehension, premotor cortex
Introduction
Considerable efforts are being made to decipher brain activity recorded with multiple electrodes, with an aim to replace malfunctioning organs (Wessberg et al., 2000; Serruya et al., 2002; Taylor et al., 2002; Carmena et al., 2003; Musallam et al., 2004; Hochberg et al., 2006). Research in this area has concentrated on operating a robotic arm in real time (Wessberg et al., 2000; Carmena et al., 2003; Hochberg et al., 2006), using closed-loop feedback to improve predictions (Serruya et al., 2002; Taylor et al., 2002; Carmena et al., 2003; Hochberg et al., 2006), devising efficient algorithms to extract information from neural activity (Shpigelman et al., 2005; Kim et al., 2006), and developing compact recording and signal-processing modules (Moxon et al., 2001; Schwartz et al., 2006).
The neuronal signal used in most studies was the simultaneous activity of spiking neurons [single units (SUs)]. Extracting spiking activity involves complex signal processing that, in turn, requires a high power supply and devices that are at present too large to be implanted (Hochberg et al., 2006). Moreover, it was estimated that tens to hundreds of SUs would be needed to enable accurate performance (Wessberg et al., 2000; Serruya et al., 2002; Taylor et al., 2002; Carmena et al., 2003; Hatsopoulos et al., 2004; Musallam et al., 2004; Hochberg et al., 2006; Kim et al., 2006). Local field potentials (LFPs) have also been used to predict movement (Pesaran et al., 2002; Mehring et al., 2003; Rickert et al., 2005; Scherberger et al., 2005). Compared with SUs, LFPs are easier to record and maintain a steadier flow of information over time, thus, potentially reducing the frequency of surgical operations required to relocate the electrodes that pick up the brain signals. However, nearby electrodes pick up highly correlated LFPs and, therefore, the number of independent measurements that can be obtained from a given brain area is low.
Figure 1A illustrates four different signals that can be extracted from a microelectrode recording. Sharp peaks (∼1 ms) represent multiple spikes (MSPs), which can be sorted by shape and size into several SUs, representing putative neurons (Abeles and Goldstein, 1977; Lewicki, 1998). By low-pass filtering the raw trace, typically below 100 Hz, the LFP is obtained (Mitzdorf, 1985). By computing the root mean square (RMS) in the frequency band of 300–6000 Hz, one obtains the MUA (see Fig. 1B), reflecting spiking activity on the order of 100 μm away from the recording electrode (Buchwald et al., 1965; Buchwald and Grover, 1970; Legatt et al., 1980). Here we show, for the first time, that the MUA computed without explicit spike detection can be used to predict arm movements. Using neural activity recorded from the premotor cortices of monkeys that performed prehension movements, we illustrate that MUA-based predictions of reach direction and grasp type are more accurate than predictions based on either spikes or LFPs. We then use neural activity recorded from the macaque primary motor or premotor cortex during tracing movements to demonstrate the potential of MUA to predict continuously changing parameters.
Figure 1.

Experimental procedures. A, Extracellular voltage measured by a single microelectrode yields several signals. MSPs are detected and sorted into SUs (different colors). LFPs and MUA are obtained by low- and high-pass filtering, respectively. Spikes are fast (∼1 ms) high amplitude (∼100 μV) events, LFPs capture slow fluctuations (<100 Hz), and MUA recordings reflect energy in high frequencies (300–6000 Hz). B, MUA is estimated by bandpass filtering and taking the RMS. For details, see Materials and Methods. C, Prehension task. The time sequence of a single trial is illustrated. Gray bar, Extent of analysis period (see Materials and Methods). In each trial, an object was briefly presented in one of six locations arranged in a virtual circle around the central button of a touch pad. Grasps were drawn from video recordings of monkeys performing the task. D, Tracing task. In each trial, a path was shown in gray. As the monkey moved the yellow cursor along the path, the green marker was advanced indicating the immediate path the monkey had to follow. This task yielded a rich sampling of movement parameters; histograms show data from one session.
Materials and Methods
Animals.
Three monkeys (female Macaca fascicularis; D, F, and J; 2.5, 3.5, and 3.2 kg, respectively) were used in this study. All animal-handling procedures were in accordance with the National Institutes of Health Guide for the Care and Use of Laboratory Animals (1996), complied with Israeli law, were approved by the Ethics Committee of the Hebrew University, and were supervised by a veterinarian.
Prehension task.
Two monkeys (D and J) were trained to perform unconstrained prehension movements with their right hand (Stark et al., 2007). A touch pad with three buttons arranged in a row, each with a tricolor light-emitting diode (LED), was located in front of the monkey at chest level (see Fig. 1C). A trial was initiated after the LED of the central button was illuminated in green and the monkey was required to press that button only (“Ready”). After a short period (500–1000 ms), a robotic arm transported an object to one of six locations, equally spaced in a circle around the central button. During each session, two objects were used for a total of 12 task conditions, ordered pseudorandomly. If the monkey continued pressing the button, illumination conditions changed so the target object was briefly visible through a half-mirror (“Cue”). After a delay, all LEDs were illuminated in orange (“Go Signal”) until the button was released (“Movement Onset”). Thus, during the delay and movement, the monkey could not see its hand or the object. A trial was considered successful if the monkey grasped the object in the intended manner for 580–1000 ms (“Correct Grasp” to “Hold End”); two microswitches were installed in each object to assure correct and continuous grasp. Successful trials were reinforced by a juice reward and only these trials were analyzed. Each session lasted ∼2 h (median, 109 min; range, 50–173 min; 41 sessions), during which monkeys completed 379 trials (median; range 164–585).
Tracing task.
A third monkey (F) was trained to perform continuous curved movements with its preferred left hand by operating a two-joint low-friction planar manipulandum (Stark et al., 2006). A horizontal opaque screen, mounted at chest level, blocked view of manipulandum and hand, and a yellow cursor indicating hand end-point was projected on the screen (see Fig. 1D). The monkey traced given paths at its own pace. During each session, 40 different paths were used, each generated by cubic spline interpolation of 10 randomly chosen points and consisting of 64–125 points (median, 90; 0.4 cm apart). At the beginning of a trial, one path was randomly selected and its origin was shown as a green circle. After the monkey placed the cursor inside the origin, the entire path was shown, path points as partially overlapping gray circles and the first eight points as green circles. As the monkey moved the cursor into the second green circle, the circle changed color to gray and the subsequent gray circle in the path turned green, a process repeated until the entire path was traced. A trial was considered successful and the monkey was rewarded if the entire path was traced without pausing for >800 ms between successive circles; otherwise, the trial was aborted. In this task, an ample range of speeds was covered and all directions were sampled (Rao's test of uniformity, p > 0.05 for all sessions). The monkey performing this task completed 392 trials per session (median; range, 218–487; 11 sessions), each 3.4 s long (median; 95% range, 2–5.9 s).
Recording procedures.
During prehension sessions, up to 16 glass-coated tungsten microelectrodes were used (exposed tip size, 15–20 μm; impedance, 0.2–2 MΩ at 1 kHz). Electrodes were arranged in two circular guide tubes lowered down to ∼1 mm above the dura mater (eight electrodes in each guide tube; minimal interelectrode spacing within tube, 250 μm; Double MT; Alpha-Omega, Nazareth, Israel). During each session, one set of electrodes was aimed toward arm-related (shoulder or elbow) regions of the dorsal premotor cortex (PMd) and another toward finger-related regions of the ventral premotor cortex (PMv). The border between PMd and PMv was defined as the arcuate spur, identified during magnetic resonance imaging (MRI) scans. Forelimb relations were determined using threshold intracortical microstimulation (ICMS; 0.2 ms biphasic pulses at 330 Hz for 90 ms at currents of 5–90 μA) at the end of each recording session (Stark et al., 2007). At the beginning of a session, each electrode was lowered through the dura independently (electrode positioning system 1.31; Alpha-Omega) until spiking activity was encountered, inserted an additional distance into the cortex (median, 0.58 mm), and left in position for the entire session. The signal from each electrode was amplified (10 k), bandpass filtered (300–6000 Hz), and fed to template-matching devices (multispike detector; Alpha-Omega) to isolate the activity of up to three SUs per electrode in real time. The amplified signal was also bandpass filtered (1–10,000 Hz), sampled at 25 kHz (Alpha-Map 5.4; Alpha-Omega), and stored on disk for off-line processing.
Recording procedures during tracing sessions differed from those described above in three ways. First, a single guide tube (eight microelectrodes) was used. Second, electrodes were inserted into arm-related regions of the right primary motor cortex (M1) or PMd. The border between M1 and PMd was estimated on the basis of sulcal landmarks obtained during MRI scans and verified by histology (regions where the density of large pyramidal cells changed) (Weinrich and Wise, 1982). Arm relations were assessed by passive limb manipulations and ICMS at the end of each session. Third, hand position was sampled at 100 Hz and low-pass filtered (8 Hz). Horizontal and vertical hand velocities were computed by numerical differentiation.
Signal processing.
Off-line, we detected spikes in the 25 kHz traces (Stark et al., 2007) and sorted them into SUs in the environment of Alpha-Sort (4.0; Alpha-Omega). LFP was computed by bandpass filtering the same traces (1–100 Hz; two-pole Butterworth) and down-sampling to 500 Hz. For frequency domain analyses of LFP, we estimated power in four frequency bands (Hanning window, 128 point fast Fourier transform): alpha (1–13 Hz), beta (13–30 Hz), gamma (30–60 Hz), and higher gamma (60–100 Hz). MUA was estimated by bandpass filtering (300–6000 Hz, three-pole Butterworth), clipping extreme values (larger or smaller than the mean ±2 SDs), and computing the sample-by-sample RMS (square, raising to the second power; mean, low-pass filtering at 100 Hz, down-sampling to 500 Hz; root, taking the square root) (see Fig. 1B).
Data analysis: general.
SUs were included in analyses if they were (1) well isolated (determined by the homogeneity of spike waveforms, separation of the projections of spike waveforms onto principal components during spike sorting, and clear refractory periods in interspike interval histograms), (2) fired at least 0.5 spikes/s during the period from Cue On until Correct Grasp (prehension) or during the entire movement period (tracing), and (3) recorded for at least 10 trials per task condition (prehension task) or a total of 50 trials (tracing task) exhibiting stationary activity (determined by visual inspection of mean firing rates and raster plots of individual trials). MSPs, LFPs, and MUA recordings were included in analyses if (1) the mean firing rate of MSP on the recording electrode was >1 spikes/s (although MSPs were included in analyses even if no SU fired >0.5 spikes/s, a higher firing rate threshold was set for MSPs than for SUs because typically more than one SU was isolated from each electrode) (see Results), and (2) the total number of trials was, as for SUs, at least 10 trials per prehension task condition or a total of 50 tracing trials. LFP and MUA outliers were detected and removed using moving average RMS (20 ms long, threshold of 2.58 SDs). When only task-modulated channels [determined using Kruskal–Wallis (KW) nonparametric one-way ANOVA] (Musallam et al., 2004; Sanchez et al., 2004) were analyzed, single-channel prediction accuracies were typically (and trivially) higher than those obtained for all channels that passed the above criteria. However, multichannel predictions were almost identical for the two sets and, thus, results reported below are based on channels that were not preselected according to any form of task dependency.
The signal-to-noise ratio (SNR) of each signal type was computed on a sample-to-sample basis (1 ms for SU and MSP, and 2 ms for LFP and MUA) in a 2000 ms window starting 1600 ms before movement onset (see Fig. 4C). Before this computation, the data in each trial were smoothed by a Gaussian kernel (SD, 15 ms) to avoid division by zero. The SNR is defined as the signal variance divided by the noise variance, SNR = σ2signal/σ2noise. In this definition, the signal is the mean neural activity over all trials of each of the 12 task conditions and the noise is the difference between the single trial activity and the signal (Gawne and Richmond, 1993) (see Fig. 4E). We also computed separate signals during the first and second chronological halves of available trials; the correlation coefficient (CC) between these two served as a stability measure (see Fig. 4D).
Figure 4.

Signal properties. A, Modulation of the MUA illustrated in Figure 1A (recorded from PMd) during prehension. The monkey was required to reach in six directions and grasp an object using a power (left) or a precision (right) grip. Data are shown from 1600 ms before movement onset (vertical red lines) until 400 ms after. Horizontal lines, 6 μV. Each panel shows the MUA obtained by smoothing single trials (Gaussian kernel, SD, 30 ms) and averaging over 15 trials (±1 SEM). Activity is strongest for reaches in the top right direction regardless of grip type and for a power grip regardless of reach direction. Bottom, The MUA was used to predict reach and grasp. B, Single-channel prediction accuracies. Averages are shown for 615 SUs, 471 MSPs, LFPs, and MUA recordings, and 69 spikeless MUA recordings. The accuracy of single-channel MUA is higher than the accuracy of any other signal. C, Single-channel SNRs. Vertical red line, Movement onset; bands around each line, SEM. Before movement, the SNR of MUA is highest. D, Single-channel stability. Error bars indicate SEM. The MUA is the most stable signal. E, Channel-pair noise-correlations. A total of 2866 simultaneously recorded MSP, LFP, and MUA pairs (and 5700 SU pairs) were divided into five distance bins, each containing 573–574 sample points (1140 for SUs), and correlations (mean ± SEM) were computed separately for each bin. MUA correlations are of the same order of magnitude as MSP correlations and an order of magnitude lower than LFP correlations.
Decoding analysis: prehension task.
To decode reach direction and grasp type, we first quantized neural activity in every trial to a compact representation. We used 11 bins, each 200 ms long, covering the period between 50 ms after cue onset and 400 ms after movement onset (see Fig. 1C, gray bar) (because event times varied between trials, each bin was anchored to an event: the first six bins were sequential and followed the Cue On event; the next two bins were anchored to the Go Signal event, starting 400 and 200 ms before it, respectively, and the last three bins were anchored to Movement Onset, the first starting 200 ms before it). For each channel separately we then counted the number of spikes (for SU and MSP) or estimated the mean activity (for LFP and MUA) in each bin, without any smoothing. For instance, for eight simultaneously recorded MUA recordings, we obtained one 88-element activity vector for every trial. Next, we trained a classifier using 10-fold cross-validation (Efron and Tibshirani, 1993). Available trials were randomly divided into 10 parts (“folds”): nine folds were used to train a support vector machine (SVM) with a radial basis function kernel (Vapnik, 1995; Hsu et al., 2003) and the 10th for testing the classifier. The procedure was repeated 10 times so that all trials were classified based on models learned from other trials. To test classifier performance, we built a confusion matrix where the i,jth element counts the number of times task condition i was classified as j. The fraction of trials for which i equaled j gives the prediction accuracy, and 1 minus this fraction is the prediction error. Using the same matrix, we also estimated prediction accuracies for reach direction and grasp type separately.
Because there were six reach directions and two grasp types, and because direction and object assignments to trials were randomized, theoretical chance levels were 16.7 and 50%, respectively. To determine empirical chance levels, considering actual data distributions and possible classifier bias, we repeated classification with random shuffling of task conditions between activity vectors. Using these data, the mean prediction accuracies for single/multiple channels were 15.4/14.4% (reach) and 50.4/50.5% (grasp), and there were no significant differences between signals (SU, MSP, LFP, MUA, and spikeless MUA; four KW tests, p > 0.05 in all cases), indicating that classification was essentially unbiased.
We also tested other standard classification algorithms, including Fisher's linear discriminant analysis, Poisson probability density estimation (Sanger, 1996) (assuming conditional independence between bins and channels), and two versions of artificial neural networks: learning vector quantization (Kohonen, 2000) (with two hidden units per task condition) and scaled conjugate gradient descent back-propagation (Moller, 1993) (with 24 hidden hyperbolic units and 12 output linear units). None of these algorithms performed consistently better than SVM. However, using all classifiers, MUA recordings gave the most accurate predictions.
In other runs, we varied the data used for classification and used a “perimovement” window (from 400 ms before until 400 ms after Movement Onset) (see Fig. 5A–C), a moving 400 ms window consisting of eight bins, each 50 ms (see Fig. 5D), or frequency domain LFPs in six 400 ms bins (see Fig. 3). MUA recordings consistently yielded the best classification in all cases.
Figure 5.

Sample size and temporal dependencies. Neural activity was recorded from PMd and PMv (monkey D) by 14 microelectrodes and 14 SUs during 283 trials. Prediction accuracy, combined for reach direction and grasp type, was estimated. MUA recordings provided the most accurate predictions at all tested numbers of trials, numbers of channels, bin sizes, and window locations. A, Number-of-trials dependency. For each sample size, 20 subsets of distinct trials were randomly sampled and the average predictions plotted with 99% Gaussian confidence limits (2.58 SEM). B, Number-of-channels dependency. Random subsets of distinct channels were sampled 20 times for each sample size. Predictions based on LFP were similar to those based on SU or MSP for up to six channels and then approached a plateau. C, Bin-size dependency. For each trial, neural activity in an 800 ms window centered on movement onset was divided into 1–200 bins (4–800 ms long) and prediction accuracies were estimated. D, Temporal window dependency. Predictions were based on neural activity in a 400 ms window, moved in 50 ms increments from 1600 ms before movement onset (vertical red line) until 400 ms after.
Figure 3.

Predictions based on LFPs in the frequency domain. A, Single-channel prediction accuracies were averaged over 471 channels. LFP multiband-based prediction accuracies (green) were higher than single-band predictions (here in red hues; significant only for reach direction, p ≪ 0.001), and time-domain LFP predictions were more accurate than frequency-domain predictions (significant only for grasp type, p < 0.001). MUA-based prediction accuracies were the highest. B, Multichannel prediction accuracies, averaged over 41 prehension sessions. Error bars indicate SEM. MUA-based predictions were the most accurate.
Decoding analysis: tracing task.
To reconstruct horizontal and vertical hand velocities during single tracing trials we first quantized neural activity and movement data into distinct 100 ms bins. Neural activity was subsequently expanded to account for possible time lags between neural activity and movement. For each trial and channel, we generated an activity matrix with five columns, corresponding to five lags (400, 300, 200, 100, and 0 ms before movement). Matrices of different channels were combined (Warland et al., 1997). For instance, eight MUA recordings, recorded simultaneously during a 3 s trial, yielded a combined activity matrix consisting of 26 rows (30 minus the four last bins) and 40 columns. We divided available trials into 10 folds and performed support vector (SV) regression (Smola and Scholkopf, 2004) of the horizontal and vertical velocities separately on training data consisting of tip-to-tail concatenated activity matrices of training trials. We then tested the regression model on each of the test trials separately using 10-fold cross-validation. Reconstruction quality was measured by the coefficient of determination (R2) between the actual and predicted velocities in each trial and averaging over all test trials.
To determine chance reconstruction, we reversed the temporal order of the sampled movement in each trial and repeated the regression. The R2 values obtained using this procedure ranged from 0.029 to 0.066 (four signals, 11 sessions; median, 0.042) and there were no significant differences between reversed signals (KW test, p > 0.05). R2 values obtained without reversing were 7.6 times higher (median; range, 2.4–14.6) than the corresponding reversed estimates.
We also tested other algorithms including Wiener filtering (least-squares linear regression) and artificial neural networks (a separate network for each parameter, each containing 10 hyperbolic hidden units and one linear output unit, with a scaled conjugate gradient descent back-propagation learning rule) (Moller, 1993). No algorithm performed consistently better than SV regression and MUA yielded the most accurate predictions regardless of the algorithm.
For detailed reconstruction of hand velocities (see Fig. 6A), we repeated the regression with 10 ms quantization.
Figure 6.
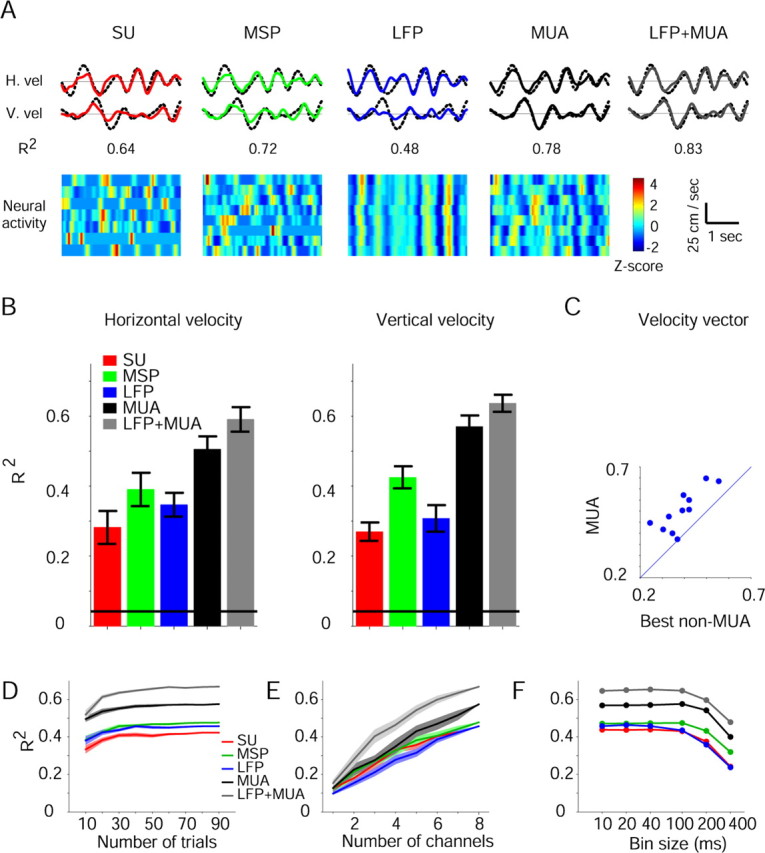
Multichannel predictions during tracing. A, Reconstructions of horizontal (top) and vertical (middle) hand velocities during a single tracing trial (colored lines). Dotted black lines show actual velocities and numbers below each trace measure reconstruction quality (R2). Reconstructions were based on the neural activity shown at the bottom (recorded from PMd during one trial and standardized for illustration purposes). B, Reconstruction quality, measured by the coefficient of determination (R2) between actual and predicted velocities, was averaged over 11 tracing sessions, separately for horizontal (left) and vertical (right) velocities. Horizontal lines, Chance R2 values (see Materials and Methods). Error bars indicate SEM. MUA was the best single predictor, although combined information from MUA and LFPs provided the most accurate predictions. C, The MUA-based R2 was plotted versus the highest non-MUA-based R2. Reconstructions based on MUA recordings were more accurate in all sessions. D–F, R2s between the actual and predicted velocity vector were estimated for a single tracing session in which neural activity was recorded by eight microelectrodes (and seven SUs) during the same 96 trials. In all cases, MUA recordings yielded more accurate predictions than the other signals, while combined LFP and MUA predictions were the most accurate. D, Number-of-trials dependency. Conventions are the same as in Figure 5A. E, Number-of-channels dependency. F, Bin-size dependency. For each tracing trial, neural activity in a 400 ms window immediately before movement was divided into 1–40 bins (10–400 ms long) and the R2 of each signal type estimated.
Results
Two monkeys were trained to perform unconstrained prehension movements (Fig. 1C). To initiate a trial, the monkey was required to press the central button of a touch pad (Ready). During each trial, one of three objects requiring distinct types of grasp was briefly shown (Cue) in one of six directions relative to the button; only two objects were used in each session. After a delay of at least 1 s, a go signal appeared and the monkey was required to reach and grasp the target object. Successful trials were reinforced by a juice reward. During each recording session, neural activity was recorded from PMd and PMv simultaneously, using up to 16 microelectrodes (median, 12; range 4–16; 41 sessions). Off-line, the signal recorded from each electrode was processed to yield LFPs, MUA recordings, and MSPs, which were subsequently sorted into SUs (mean, 1.3 SUs per electrode; range, 0–5; 471 electrodes).
Multiple MUA recordings provide an accurate prediction of reach and grasp
All four signals can be used to decipher the upcoming movement. When used to decode reach direction or grasp type, the MUA recorded from up to 16 electrodes was able to predict movement parameters with >90% accuracy (Fig. 2A), significantly higher than what could be obtained by any other intracortical signal (Fig. 2B) (41 sessions; two KW tests, for reach direction and for grasp type, each corrected for multiple comparisons, p < 0.001 for both cases).
Figure 2.

Multichannel predictions. A, Neural activity was recorded from PMd and PMv (monkey J) during 188 prehension trials using 13 microelectrodes and 18 SUs. Multichannel activity was used to predict reach direction and grasp type. In each confusion matrix, there are 12 rows and columns, corresponding to six directions per grasp type (1, right, power grip; 2, right, precision grip; 3, top right, power grip…). The i,jth element measures the probability that the ith behavior will be classified as j. Each row adds up to 1; correct predictions are on the diagonal. B, Multichannel prediction accuracies for reach direction (left) and grasp type (right) were averaged over 41 prehension sessions. Horizontal lines, Chance levels (17 and 50%); error bars indicate SEM. C, For each session, the MUA-based prediction accuracy, combined for reach direction and grasp type (chance, 8%), was plotted versus the best non-MUA-based prediction; these measures were correlated (R2 = 0.7). MUA-based predictions were more accurate in almost all sessions.
Combining information about reach and grasp, prediction errors using multichannel MUA recordings were 4.49 ± 0.75 times lower than when using LFPs recorded by the same electrodes (mean ± SEM of 41 sessions), 2.5 ± 0.24 times lower than SUs, and 2.15 ± 0.13 times lower than when using MSPs. Sessions for which MUA-based predictions tended to be particularly accurate also yielded accurate predictions based on other signals (Fig. 2C) (linear regression, R2 = 0.7; F test, p ≪ 0.001). However, MUA yielded the most accurate predictions in almost all (93%) tested sessions and MUA-based prediction errors were about two times lower than with using the best other prediction (1.92 ± 0.14, mean ± SEM of 41 sessions; Mann–Whitney U test, p < 0.001).
Previous studies suggested that LFPs may provide predictions as accurate as SUs (Pesaran et al., 2002; Mehring et al., 2003; Andersen et al., 2004; Rickert et al., 2005; Scherberger et al., 2005). We obtained similar results for multichannel predictions of grasp type (Fig. 2B) (median prediction accuracies of grasp type, SUs, 73%; LFPs, 73%; 41 sessions; post hoc U test, p = 0.81), but predictions of reach direction based on SUs were more accurate that those based on LFPs (SUs, 72%; LFPs, 56%; p = 0.0013). We found, however, that MUA recordings provide considerably more accurate predictions than LFPs in the time domain, as shown in Figure 2B. To further evaluate the properties of the two latter signals, we also estimated prediction accuracies using LFPs in the frequency domain (Fig. 3). Although single-channel alpha bands yielded predictions that were significantly more accurate than predictions based on any other LFP band (Fig. 3A) (471 LFPs; KW tests, corrected for multiple comparisons, p ≪ 0.001 for both reach direction and grasp type), this property disappeared for multiple channels (Fig. 3B) (post hoc U test comparing multichannel alpha to higher gamma; reach, p = 0.74; grasp, p = 0.53). Predictions using multichannel MUA recordings were consistently and significantly more accurate than those using LFPs, both for single frequency bands (alpha, beta, gamma, or higher gamma) and multiple bands (KW tests, corrected for multiple comparisons, p ≪ 0.001 for both reach direction and grasp type).
Properties of MUA during reach and grasp
The high prediction accuracy achieved by multiple MUA recordings can be attributed to several single-channel properties. First, the MUA recorded by a single electrode typically varied with reach direction, grasp type, or both. For instance, the MUA in Figure 4A enabled prediction of reach direction with 42% accuracy and grasp type with 75% accuracy. Over the entire sample of single MUA recordings, reach and grasp were predicted correctly in 42 and 62% of the cases, respectively (medians, 471 MUA recordings) (Fig. 4B). Predictions based on single MUA recordings were significantly more accurate than those based on any other signal (two KW tests, corrected for multiple comparisons, p ≪ 0.001). Moreover, the MUA was informative even when no spikes could be detected (Fig. 4B, rightmost bars) (69 spikeless MUA recordings; Jarque-Bera goodness-of-fit tests to Gaussian distributions, reach, p = 0.4; grasp, p = 0.34; one-tailed t tests comparing to chance levels, p ≪ 0.001). To compare the information content of MUA recordings based on neural activity with and without spikes, we analyzed data from four sessions as follows. For each raw record, we replaced all detected spikes with high-frequency noise (the difference between a spike and a five-point moving-average smoothed spike) and then repeated MUA estimation and predictions. For reach direction, the median single-channel prediction accuracy for the original MUA recordings was 40% (49 channels), whereas for the “despiked” MUA recordings it was 38%. Over the four sessions, the median multichannel prediction accuracy of reach direction was 92% for raw MUA recordings and 88.4% for the despiked MUA recordings. Similar results were obtained for grasp type predictions. Thus, undetected (distant) spikes clearly contributed to the information in MUA recordings.
Second, MUA recordings provided information before the actual movement. Before the onset of movement, the SNR (the signal variance divided by the noise variance) of MUA recordings was higher than the SNR of other signals (Fig. 4C) (KW test, corrected for multiple comparisons, p ≪ 0.001). From 106 ms until 400 ms after movement onset, SNRs of LFPs were significantly higher than the SNRs of all other signals, but SNRs of MUA recordings were higher than the SNRs of SUs or MSPs (KW test, corrected for multiple comparisons, p ≪ 0.001).
Third, MUA recordings retained encoding properties over the course of a single session to a higher degree than any other signal (Fig. 4D) (KW test, corrected for multiple comparisons, p ≪ 0.001). Thus, of the four intracortical signals examined, MUA recordings had the highest single-channel capacity, provided the highest information before movement, and retained encoding properties over time.
MUA recordings also had low interchannel redundancy. Pairs of MUA recordings recorded at the same time were essentially uncorrelated, as were MSPs (Fig. 4E) (median CCs of 2866 channel pairs, MUA, 0.0083; MSPs, 0.0101; U tests, p > 0.05 for four of five distance bins). This is in contrast to pairs of LFPs recorded by distinct electrodes, which were highly correlated (median CC, 0.28; U test comparing CCs of MUA recordings and LFPs, p ≪ 0.001).
Dependence of predictions on recording conditions and decoding specifics
We assessed the decoding potential of MUA recordings as a function of sample size and temporal specifics. For all signal types, predictions improved when more trials (Fig. 5A), or when more channels (Fig. 5B) were available, but MUA recordings yielded the most accurate predictions at all sample sizes (two-way KW tests, signal type by number of trials or channels, p ≪ 0.001 for both cases). MUA recordings provided more accurate predictions of movement parameters than any other signal regardless of the temporal resolution (Fig. 5C) (KW test, corrected for multiple comparisons, p < 0.005), both before and during movement (Fig. 5D) (KW test, corrected for multiple comparisons, p < 0.001 for both cases).
Prediction accuracies were higher when the recording electrode had higher impedance, but did not depend on the recording depth (Table 1, first two rows). MUA-based single-channel predictions varied little with anatomy: for reach direction, median prediction accuracies were 40 and 42% in PMd and PMv, respectively (U test, p = 0.02), whereas for grasp type the corresponding values were 62 and 63% (p = 0.4). Although a plateau was approached at ∼10 electrodes (Fig. 5B), multichannel predictions were influenced by the number of electrodes used (Table 1, third row). Prediction accuracy was uncorrelated with electrode separation within a region (PMd/PMv), but was negatively correlated with the distance between the sampled regions (Table 1, last two rows).
Table 1.
Influence of recording conditions on MUA-based prediction accuracy
| Parameter | Median | 95% range | Sample size | CCa | p value (t test) |
|---|---|---|---|---|---|
| Electrode depth | 0.58 mm | 0–4 mm | 471 | 0.044 | 0.17 |
| Electrode impedance | 0.9 MΩ | 0.35–1.8 MΩ | 471 | 0.13 | 0.003 |
| Electrodes per session | 12 | 4–16 | 41 | 0.39 | 0.008 |
| Within-region separationb | 0.81 mm | 0.35–1.1 mm | 82 | −0.004 | 0.49 |
| Inter-region separationc | 8.02 mm | 2.6–14.1 mm | 41 | −0.45 | 0.002 |
aCCs were computed between each parameter and the overall prediction accuracy.
bFor each session, prediction accuracies and mean pairwise interelectrode distances were computed separately for MUAs recorded by each guide tube, aimed toward PMd and PMv (see Materials and Methods).
cFor each session, distances were computed between the centers of each of the two sampled regions.
Regarding the decoding algorithm, all results reported above were obtained using SVM classification, which consistently yielded the best results (median MUA-based multichannel prediction accuracies of 90.9% and 85% for reach and grasp, respectively). However, a linear classifier (Fisher's linear discriminant analysis) yielded only slightly lower predictions (median prediction accuracies of 87.7% and 83.9% for reach and grasp, respectively; U tests comparing to SVM results, p = 0.43 and p = 0.38).
Prediction of continuously changing movement parameters
MUA recordings can also be used to predict continuously changing movement parameters. To this end, we trained a third monkey to trace complex planar paths (Fig. 1D) and recorded motor cortical activity using eight microelectrodes at the same time (see Materials and Methods). Based on neural activity that occurred in the 400 ms period before movement, we then reconstructed the hand's horizontal and vertical velocities on a trial-to-trial basis (Fig. 6A). As in the prehension task, MUA-based reconstructions were consistently more accurate than reconstructions based on any other signal (Fig. 6B). Reconstructions of the velocity vector using MUA recordings were 2.34 ± 0.53 (mean ± SEM of 11 sessions) times more accurate than when using LFPs recorded by the same electrodes, 2.5 ± 0.27 times higher than SUs, and 1.44 ± 0.11 times higher than when using MSPs. Moreover, MUA recordings yielded the most accurate predictions in all tested sessions (Fig. 6C) (1.32 ± 0.05 times higher than the next best prediction, mean ± SEM of 11 sessions; U test, p = 0.0035).
Combining information in MUA recordings with information in other intracortical signals may further improve predictions. To illustrate this, we reconstructed hand velocities based on LFP and MUA, obtaining predictions which were significantly more accurate than those based on any non-MUA single signal (Fig. 6B, rightmost bars) (11 sessions; KW tests corrected for multiple comparisons, p < 0.01 for horizontal and p < 0.005 for vertical velocities). Whereas CCs between actual and predicted horizontal and vertical velocities using only MUA recordings were 0.71 ± 0.026 and 0.75 ± 0.023, respectively (means ± SEMs over 11 sessions), the additional consideration of LFPs increased these values to 0.77 ± 0.023 and 0.8 ± 0.015 (post hoc U test comparing MUA-based to combined MUA- and LFP-based predictions, p = 0.045).
As in the prehension task, the pre-eminence of MUA-based predictions over other intracortical signals during tracing was independent of sample size and temporal specifics. For all sample sizes, MUA-based predictions were more accurate than those based on other signals (Fig. 6D, E) (two-way KW tests, signal type by number of trials or by number of channels; p ≪ 0.001 for both cases). Reconstruction improved without reaching a plateau for up to eight MUA recordings (Fig. 6E) (linear regression, R2 = 0.97; F test, p ≪ 0.001). Finally, MUA recordings yielded the most accurate predictions at all temporal resolutions (Fig. 6F) (KW test, p < 0.001).
Discussion
We have demonstrated that the superimposed activity of many neurons around the recording electrode (MUA) can be used to predict movement parameters with high accuracy. Multiple MUA recordings yielded predictions that were more accurate than those obtained using multiple SUs, MSPs, or LFPs recorded by the same microelectrodes. These findings were obtained for multiple data sets (brain regions and behavioral tasks), multiple parameters (reach, grasp, and horizontal and vertical hand velocities), using a wide variety of standard classification and reconstruction algorithms, and regardless of sample size or temporal specifics. Thus, MUA recordings appear to be considerably more informative signals than either spikes or LFPs.
All results were acquired by processing data off-line. Predictions may be improved by using more sophisticated algorithms, providing closed-loop feedback in real time (Serruya et al., 2002; Taylor et al., 2002; Carmena et al., 2003; Hochberg et al., 2006), or recording from more channels (Figs. 5B, 6E). Because any processing of the raw neuronal signal necessarily leads to information loss (data processing inequality) (Cover and Thomas, 1991), predictions made by an ideal observer based on other derivatives of the raw signal may be more accurate than those based purely on MUA. We tested the effect of combining information from LFPs and MUA recorded from the same electrode for reach and grasp, but because predictions based on MUA were already highly accurate, the gain from the additional consideration of LFP was negligible (median prediction accuracies for reach, 90.9 (MUA) and 90.2% (LFP+MUA); post hoc U test, p = 0.97; for grasp, 85 and 84.8%; U test, p = 0.95). However, we have shown that by combining information from different signals (LFPs and MUA) recorded from the same electrode during tracing, predictions were significantly improved (Fig. 6).
Obviously, the high information content of MUA recordings does not imply their use by the brain. The MUA may be considered a tool for the experimentalist, or for the engineer, to view brain activity, just like LFPs (Mitzdorf, 1985), functional MRI (Logothetis et al., 2001), or other indirect measures of spiking or synaptic activity. Nevertheless, the study of MUA may provide insights into brain mechanisms (Buchwald et al., 1965; Eckhorn et al., 1988; Bauer et al., 1995). MUA recordings represent a weighted average of neural activity around the electrode tip in a region smaller than LFP, but larger than SUs (Legatt et al., 1980; Mitzdorf, 1985) (Fig. 4E). The present finding showing that single MUA recordings retain movement-related information to a larger extent than any other intracortical signal suggests that motor cortical neurons within the specific range of MUA spatial averaging tend to process similar information.
SUs (and MSPs) are difficult to record, sort, and maintain over long durations, and are not very informative individually. However, they are practically uncorrelated when recorded from distant brain sites and, therefore, information from multiple SUs does accumulate. LFPs are relatively easy to measure and individually are as informative as SUs. In studies attempting to decode movement-related information from multiple LFPs, channels recorded on different occasions are often combined, making the assumption of interchannel independence (Mehring et al., 2003; Scherberger et al., 2005) and leading to the contention that the information in multiple LFPs may accumulate as in multiple SUs. However, because even distant LFP channels are highly correlated (Fig. 4E), the information in multiple LFP channels quickly reaches a plateau (Fig. 5B). In contrast, MUA recordings do not require the isolation of spikes, are easy to measure, stable over time (Buchwald and Grover, 1970; Super and Roelfsema, 2005) (Fig. 4D), individually informative, and essentially uncorrelated between distant sites. Therefore, MUA recordings obtained from multiple electrodes, when considered in unison, yield substantially more accurate predictions of movement parameters than any other intracortical signal considered.
The present study demonstrated that by using ∼12 MUA recordings from PMd and PMv, reach and grasp can be predicted with ∼90% accuracy, and by using only 8 motor cortical MUA recordings the correlation between actual and predicted hand velocities is ∼0.75. These values are similar to (or higher than) values reported using tens to hundreds simultaneously recorded neurons or LFPs (Wessberg et al., 2000; Serruya et al., 2002; Taylor et al., 2002; Carmena et al., 2003; Mehring et al., 2003; Hatsopoulos et al., 2004; Musallam et al., 2004; Shpigelman et al., 2005; Hochberg et al., 2006; Kim et al., 2006). In conclusion, if a single intracortical signal must be chosen for operating motor-cortical neuroprostheses, MUA appears to be the method of choice. Still, improved prediction can be obtained by combining signals (e.g., MUA with LFP). We therefore expect that motor-cortical neural prosthetic devices that use the MUA signal will perform better than devices that do not.
Footnotes
This work was supported in part by Center of Excellence Grant 1564/04, administered by the Israel Science Foundation and the Deutsch-Israelische Projectkooperation. We thank Itay Asher, Yoram Ben-Shaul, Gadi Goelman, Moshe Nakar, and Varda Sharkansky for help. We are grateful to Rotem Drori for providing continuous tracing data (monkey F), to Shua Amorai-Stark for art, and to Amir Globerson and Eilon Vaadia for critical comments and discussions.
References
- Abeles M, Goldstein MH. Multispike train analysis. Proc IEEE. 1977;65:762–773. [Google Scholar]
- Andersen RA, Musallam S, Pesaran B. Selecting the signals for a brain-machine interface. Curr Opin Neurobiol. 2004;14:720–726. doi: 10.1016/j.conb.2004.10.005. [DOI] [PubMed] [Google Scholar]
- Bauer R, Brosch M, Eckhorn R. Different rules of spatial summation from beyond the receptive field for spike rates and oscillation amplitudes in cat visual cortex. Brain Res. 1995;669:291–297. doi: 10.1016/0006-8993(94)01273-k. [DOI] [PubMed] [Google Scholar]
- Buchwald JS, Grover FS. Amplitudes of background fast activity characteristic of specific brain sites. J Neurophysiol. 1970;33:148–159. doi: 10.1152/jn.1970.33.1.148. [DOI] [PubMed] [Google Scholar]
- Buchwald JS, Halas ES, Schramm S. Comparison of multiple-unit and electro-encephalogram activity recorded from the same brain sites during behavioral conditioning. Nature. 1965;205:1012–1014. [Google Scholar]
- Carmena JM, Lebedev MA, Crist RE, O'Doherty JE, Santucci DM, Dimitrov DF, Patil PG, Henriquez CS, Nicolelis MA. Learning to control a brain-machine interface for reaching and grasping by primates. PLoS Biol. 2003;1:E42. doi: 10.1371/journal.pbio.0000042. [DOI] [PMC free article] [PubMed] [Google Scholar]
- Cover TM, Thomas JA. New York: Wiley; 1991. Elements of information theory. [Google Scholar]
- Eckhorn R, Bauer R, Jordan W, Brosch M, Kruse W, Munk M, Reitboeck HJ. Coherent oscillations: a mechanism of feature linking in the visual cortex? Multiple electrode and correlation analyses in the cat. Biol Cybern. 1988;60:121–130. doi: 10.1007/BF00202899. [DOI] [PubMed] [Google Scholar]
- Efron B, Tibshirani RJ. New York: Chapman and Hall; 1993. An introduction to the bootstrap. [Google Scholar]
- Gawne TJ, Richmond BJ. How independent are the messages carried by adjacent inferior temporal cortical neurons? J Neurosci. 1993;13:2758–2771. doi: 10.1523/JNEUROSCI.13-07-02758.1993. [DOI] [PMC free article] [PubMed] [Google Scholar]
- Hatsopoulos N, Joshi J, O'Leary JG. Decoding continuous and discrete motor behaviors using motor and premotor cortical ensembles. J Neurophysiol. 2004;92:1165–1174. doi: 10.1152/jn.01245.2003. [DOI] [PubMed] [Google Scholar]
- Hochberg LR, Serruya MD, Friehs GM, Mukand JA, Saleh M, Caplan AH, Branner A, Chen D, Penn RD, Donoghue JP. Neuronal ensemble control of prosthetic devices by a human with tetraplegia. Nature. 2006;442:164–171. doi: 10.1038/nature04970. [DOI] [PubMed] [Google Scholar]
- Hsu CW, Chang CC, Lin CJ. A practical guide to support vector classification. 2003. Retrieved July 16, 2007 from www.csie.ntu.edu.tw/∼cjlin/papers/guide/guide.pdf.
- Kim SP, Sanchez JC, Rao YN, Erdogmus D, Carmena JM, Lebedev MA, Nicolelis MA, Principe JC. A comparison of optimal MIMO linear and nonlinear models for brain-machine interfaces. J Neural Eng. 2006;3:145–161. doi: 10.1088/1741-2560/3/2/009. [DOI] [PubMed] [Google Scholar]
- Kohonen T. New York: Springer; 2000. Self-organizing maps. [Google Scholar]
- Legatt AD, Arezzo J, Vaughan HG., Jr Averaged multiple unit activity as an estimate of phasic changes in local neuronal activity: effects of volume-conducted potentials. J Neurosci Methods. 1980;2:203–217. doi: 10.1016/0165-0270(80)90061-8. [DOI] [PubMed] [Google Scholar]
- Lewicki MS. A review of methods for spike sorting: the detection and classification of neural action potentials. Network. 1998;9:R53–R78. [PubMed] [Google Scholar]
- Logothetis NK, Pauls J, Augath M, Trinath T, Oeltermann A. Neurophysiological investigation of the basis of the fMRI signal. Nature. 2001;412:150–157. doi: 10.1038/35084005. [DOI] [PubMed] [Google Scholar]
- Mehring C, Rickert J, Vaadia E, Cardosa de Oliveira S, Aertsen A, Rotter S. Inference of hand movements from local field potentials in monkey motor cortex. Nat Neurosci. 2003;6:1253–1254. doi: 10.1038/nn1158. [DOI] [PubMed] [Google Scholar]
- Mitzdorf U. Current source-density method and application in cat cerebral cortex: investigation of evoked potentials and EEG phenomena. Physiol Rev. 1985;65:37–100. doi: 10.1152/physrev.1985.65.1.37. [DOI] [PubMed] [Google Scholar]
- Moller MF. A scaled conjugate gradient algorithm for fast supervised learning. Neural Netw. 1993;6:525–533. [Google Scholar]
- Moxon KA, Morizio J, Chapin JK, Nicolelis MAL, Wolf PD. Designing a brain-machine interface for neuroprosthetic control. In: Moxon KA, Chapin JK, editors. Neural prostheses for restoration of sensory and motor function. Boca Raton, FL: CRC; 2001. pp. 179–219. [Google Scholar]
- Musallam S, Corneil BD, Greger B, Scherberger H, Andersen RA. Cognitive control signals for neural prosthetics. Science. 2004;305:258–262. doi: 10.1126/science.1097938. [DOI] [PubMed] [Google Scholar]
- Pesaran B, Pezaris JS, Sahani M, Mitra PP, Andersen RA. Temporal structure in neuronal activity during working memory in macaque parietal cortex. Nat Neurosci. 2002;5:805–811. doi: 10.1038/nn890. [DOI] [PubMed] [Google Scholar]
- Rickert J, Oliveira SC, Vaadia E, Aertsen A, Rotter S, Mehring C. Encoding of movement direction in different frequency ranges of motor cortical local field potentials. J Neurosci. 2005;25:8815–8824. doi: 10.1523/JNEUROSCI.0816-05.2005. [DOI] [PMC free article] [PubMed] [Google Scholar]
- Sanchez JC, Carmena JM, Lebedev MA, Nicolelis MA, Harris JG, Principe JC. Ascertaining the importance of neurons to develop better brain-machine interfaces. IEEE Trans Biomed Eng. 2004;51:943–953. doi: 10.1109/TBME.2004.827061. [DOI] [PubMed] [Google Scholar]
- Sanger TD. Probability density estimation for the interpretation of neural population codes. J Neurophysiol. 1996;76:2790–2793. doi: 10.1152/jn.1996.76.4.2790. [DOI] [PubMed] [Google Scholar]
- Scherberger H, Jarvis MR, Andersen RA. Cortical local field potential encodes movement intentions in the posterior parietal cortex. Neuron. 2005;46:347–354. doi: 10.1016/j.neuron.2005.03.004. [DOI] [PubMed] [Google Scholar]
- Schwartz AB, Cui XT, Weber DJ, Moran DW. Brain-controlled interfaces: movement restoration with neural prosthetics. Neuron. 2006;52:205–220. doi: 10.1016/j.neuron.2006.09.019. [DOI] [PubMed] [Google Scholar]
- Serruya MD, Hatsopoulos NG, Paninski L, Fellows MR, Donoghue JP. Instant neural control of a movement signal. Nature. 2002;416:141–142. doi: 10.1038/416141a. [DOI] [PubMed] [Google Scholar]
- Shpigelman L, Singer Y, Paz R, Vaadia E. Spikernels: predicting arm movements by embedding population spike rate patterns in inner-product spaces. Neural Comput. 2005;17:671–690. doi: 10.1162/0899766053019944. [DOI] [PubMed] [Google Scholar]
- Smola A, Scholkopf B. A tutorial on support vector regression. Stat Comput. 2004;14:199–222. [Google Scholar]
- Stark E, Drori R, Abeles M. Partial cross-correlation analysis resolves ambiguity in the encoding of multiple movement features. J Neurophysiol. 2006;95:1966–1975. doi: 10.1152/jn.00981.2005. [DOI] [PubMed] [Google Scholar]
- Stark E, Asher I, Abeles M. Encoding of reach and grasp by single neurons in premotor cortex is independent of recording site. J Neurophysiol. 2007;97:3351–3364. doi: 10.1152/jn.01328.2006. [DOI] [PubMed] [Google Scholar]
- Super H, Roelfsema PR. Chronic multiunit recordings in behaving animals: advantages and limitations. Prog Brain Res. 2005;147:263–283. doi: 10.1016/S0079-6123(04)47020-4. [DOI] [PubMed] [Google Scholar]
- Taylor DM, Tillery SI, Schwartz AB. Direct cortical control of 3D neuroprosthetic devices. Science. 2002;296:1829–1832. doi: 10.1126/science.1070291. [DOI] [PubMed] [Google Scholar]
- Vapnik V. The nature of statistical learning theory. New York: Springer; 1995. [Google Scholar]
- Warland DK, Reinagel P, Meister M. Decoding visual information from a population of retinal ganglion cells. J Neurophysiol. 1997;78:2336–2350. doi: 10.1152/jn.1997.78.5.2336. [DOI] [PubMed] [Google Scholar]
- Weinrich M, Wise SP. The premotor cortex of the monkey. J Neurosci. 1982;2:1329–1345. doi: 10.1523/JNEUROSCI.02-09-01329.1982. [DOI] [PMC free article] [PubMed] [Google Scholar]
- Wessberg J, Stambaugh CR, Kralik JD, Beck PD, Laubach M, Chapin JK, Kim J, Biggs SJ, Srinivasan MA, Nicolelis MA. Real-time prediction of hand trajectory by ensembles of cortical neurons in primates. Nature. 2000;408:361–365. doi: 10.1038/35042582. [DOI] [PubMed] [Google Scholar]