

Abstract
Many affective stimuli are hedonically complex mixtures containing both pleasant and unpleasant components. To investigate whether the brain represents the overall affective value of such complex stimuli, or the affective value of the different components simultaneously, we used functional magnetic resonance imaging to measure brain activations to a pleasant odor (jasmine), an unpleasant odor (indole), and a mixture of the two that was pleasant. In brain regions that represented the pleasantness of the odors such as the medial orbitofrontal cortex (as shown by activations that correlated with the pleasantness ratings), the mixture produced activations of similar magnitude to the pleasant jasmine, but very different from the unpleasant indole. These regions thus emphasize the pleasant aspects of the mixture. In contrast, in regions representing the unpleasantness of odors such as the dorsal anterior cingulate and midorbitofrontal cortex the mixture produced activations that were relatively further from the pleasant component jasmine and closer to the indole. These regions thus emphasize the unpleasant aspects of the mixture. Thus mixtures that are found pleasant can have components that are separately pleasant and unpleasant, and the brain can separately and simultaneously represent the positive and negative hedonic value of a complex affective stimulus that contains both pleasant and unpleasant olfactory components. This type of representation may be important for affective decision making in the brain in that separate representations of different affective components of the same sensory stimulus may provide the inputs for making a decision about whether to choose the stimulus or not.
Keywords: emotion, affect, odor, pleasant mixtures, unpleasant mixtures, decision making, fMRI, humans
Introduction
Given the close relationship between olfaction and emotion, odors play a central role in making many sensory stimuli pleasant and attractive, for example in food selection and social affiliative behavior (Rolls, 2005; Shepherd, 2006). Most odors we encounter are odor mixtures that are hedonically complex, that is they have affectively positive and negative components. However, it is unclear how the pleasant and unpleasant components of such mixtures are analyzed by the human brain, what the rules are for the neural representations of such mixtures, how the representations may be related to verbal reports on the affective value of the mixtures, and to affective decision making. When humans smell an odor mixture, to what extent does the brain represent separately the different affective components of the mixture? Interesting and complex interactions between the components are thought to occur, because if a small quantity of an odor that is unpleasant alone is added to a pleasant odor, the resulting mixture may remain pleasant, and some individuals find that the pleasantness or “body” of the odor is actually enhanced. A striking example is the sweet, floral scent of jasmine as it occurs naturally in Jasminum grandiflorum, which contains typically 2–3% of indole, a pure chemical which on its own at the same concentration is usually rated as unpleasant.
Research on the neural representation of odor mixtures in animals has shown that the interactions include suppression, and the formation of new representations that are different from the components (Giraudet et al., 2002; Shepherd, 2006; Wilson et al., 2006; Zou and Buck, 2006). The interactions may take place at various stages of the olfactory pathways including the olfactory bulb, and areas that receive inputs from the olfactory tract including the pyriform cortex (Wilson et al., 2006; Zou and Buck, 2006). However, these studies have not explicitly investigated interactions between pleasant and unpleasant odors in parts of the olfactory system where the affective value of odors is represented. Furthermore, although neuroimaging studies have provided important insights into the processing of olfactory information in the human brain (Zatorre et al., 1992; Zald and Pardo, 2000; Poellinger et al., 2001; Small et al., 2005; Gottfried et al., 2006; Li et al., 2006; Plailly et al., 2007), including the representation of the hedonic value of odors (Zatorre et al., 2000; Savic et al., 2001; Anderson et al., 2003; Rolls et al., 2003; Royet et al., 2003; de Araujo et al., 2005; Winston et al., 2005), we know of no previous neuroimaging studies in humans that have compared the effects of a mixture with those of its components. Overall, little is known about the interactions between the pleasant and unpleasant components of stimuli in any modality, and how these influence decision making, and olfaction provides a good model for investigation because it has been shown that affectively positive odors are represented in different brain subregions than affectively unpleasant odors (Anderson et al., 2003; Rolls et al., 2003).
Materials and Methods
Design.
In the experiment described here, we compared brain responses to a chemically well defined model jasmine odor with eight components that did not include indole and was pleasant, to the odor of indole (which was unpleasant), and to a mixture of the jasmine and indole (which was pleasant). The experimental design was to compare brain activations to the pleasant odor of a jasmine odor model, the unpleasant odor of indole, and a mixture containing both jasmine and indole (“jasind”). This design allowed investigation of how an unpleasant odor may, in a mixture, be part of what is overall a pleasant combination. By creating a jasmine model, to which we could add indole, we could investigate how in substances such as natural jasmine an unpleasant component can interact with other components to make a pleasant combination. By creating a precise and analytically defined version of jasmine without indole, we were able to test the effect of adding a defined unpleasant component to it.
We note that jasmine is just one example of many instances in which pleasant odor combinations may contain odor components that on their own may be unpleasant. Jasmine thus provides a useful model example for this functional neuroimaging study of what is a common effect. Other examples include most perfumes, which contain sulfur components that on their own are unpleasant (like cat urine), but give a lift to and may even impart a fruity component to complex odor mixtures including tropical fruits and even Sauternes wine. Another example is that adding a musk odor (such as civet glandular secretion, components of which include muscone and civetone) (Frater et al., 1998), unpleasant on its own, to a pleasant odor may, for at least some people, enhance the attractiveness of a perfume. Another example is that wintergreen contains methyl salicylate, which on its own is unpleasant. In the areas of flavor combinations, it is found that an odor which on its own is rather affectively neutral, such as vegetable odor, may as a component of a mixture with monosodium glutamate, become very pleasant (McCabe and Rolls, 2007).
We investigated how the components and the mixture were represented in brain areas such as the medial orbitofrontal cortex where the pleasantness of odors is represented, and in the mid-orbitofrontal cortex and dorsal part of the anterior cingulate cortex where the unpleasantness of odors is represented, as shown for example by correlations with subjective ratings (Anderson et al., 2003; Rolls et al., 2003; de Araujo et al., 2005). We also investigated how these three odors are represented in other areas with olfactory inputs, such as the pyriform cortex and related areas that receive inputs from the olfactory bulb via the olfactory tract. We set up previous hypotheses of brain areas, including the above areas, in which to compare the activations, based on their activation by olfactory stimuli in previous studies (Zald and Pardo, 2000; Gottfried et al., 2002; Anderson et al., 2003; Rolls et al., 2003; de Araujo et al., 2005; Li et al., 2006). Given the aims of the investigation, we selected in these brain areas the locations at which to investigate the relative effects of the three odours as locations where the activations were correlated with the pleasantness or unpleasantness ratings given to the stimuli on each trial throughout the experiment, using statistical parametric mapping (SPM) correlation analyses.
Participants.
Fourteen healthy volunteers (seven male and seven female, mean age 26) participated in the study. Ethical approval (Central Oxford Research Ethics Committee) and written informed consent from all subjects were obtained before the experiment. The participants were selected from the normal population, subject to their finding the indole unpleasant (which some people do not, perhaps related to the expression of different olfactory receptor genes in different people) (Dulac and Torello, 2003) and the mixture pleasant, and were given practice in the task and in making the ratings in a psychophysical session that preceded the scanning session. We note that perfumers with great expertise would probably be able to identify the indole in the jasmine with indole mixture, and would rate the mixture as pleasant. The participants in the present study typically could not identify the indole in the mixture, and found it similar to the jasmine without indole.
Stimuli.
A chemically defined jasmine-like model odor (“jasmine”) was made that contained the following: benzyl acetate, 20.0%; hexylcinnamic aldehyde, 24.0%; hedione, 15.4% (the natural parent unsaturated compound is methyl jasmonate); linalool, 24.8%; jasmone, 4.8%; eugenol, 2.4%; Z3-Hexenyl benzoate, 5.0%; and methyl anthranilate, 3.6%. The indole stimulus was 6% indole (“indole”). The mixture consisted of the same concentration of all the substances in the jasmine, but in addition 6% indole (“jasind”). (Natural jasmine also contains para-cresol, also judged unpleasant.) To simplify the experiment, we used only indole in jasind, but at a slightly higher level (6%) than in natural jasmine oil to compensate for the lack of para-cresol. We note that the components in the model jasmine we created are present in natural jasmine (Verzele et al., 1981; Toda et al., 1983; Kaiser, 1988) with the exception of hexylcinnamic aldehyde, which has been found to be a useful building block of jasmine odor, and that the components in the model are sufficient to capture many aspects of natural jasmine.) All stimuli were diluted 1:5 in dipropylene glycol in such a way that the eight components would be present at the same level in jasmine and jasind regardless of the presence of indole. The concentration of indole was chosen because it was unpleasant to the participants when presented alone, but did not make the jasmine mixture unpleasant (Fig. 1). (For four of the 14 participants, an indole concentration of 4% was used to satisfy these criteria.) Clean air was delivered whenever an odor was not being delivered. In the intertrial interval, limonene was delivered for 1 s, to help the olfactory system to be in a stable, nonadapted state, when one of the three test stimuli was presented at the start of each trial.
Figure 1.

a, b, The ratings of pleasantness (a) and intensity (b) for the stimuli (means ± SEM).
Stimulus delivery.
A purpose-designed (by C. Margot) continuous airflow six-channel computer-controlled olfactometer was used to allow odor stimuli to be delivered in the magnetic resonance imaging (MRI) scanner. The control and metal components of the system are kept outside the scanner room, and the system is free of any auditory, tactile or thermal shifts that could cue the subject to the onset of odor delivery. The flow of cleaned medical air is controlled using a pressure regulator and flow meter. The air is directed using solenoid-operated valves controlled by the stimulus computer using transistor-transistor logic pulses to one of the glass evaporation flasks containing one odor stimulus or air. The purpose of the flasks was to release an odor mixture by evaporation in a similar way to that in which an odor mixture would evaporate normally from a surface to which it had been applied. Each flask contained three filter papers held in glass flanges on each of which was spread 0.25 ml of the liquid odor stimulus less than 3 h before an experiment began. Each flask is connected by its own Teflon tube (to provide for low adhesion) to a single delivery nozzle placed within 1 cm of the nose to minimize dead space. The delivery nozzle provided two tubes, one for each nostril, to produce birhinal stimulation. The flow-rate of the air supply was kept constant at 6 L/min. The air line was on continuously by default, and was switched off only when the solenoid directed the clean air supply to another flask so that an odorant could be delivered. This resulted in a system with no perceptible pressure change when the air was replaced during stimulus delivery by an odor for 4 s. A similar system, although with the odorant dissolved in propylene glycol and air bubbling through the solution, was used in a previous fMRI study of human olfaction (Rolls et al., 2003; de Araujo et al., 2005).
Experimental protocol.
During the fMRI experiment, the subjects gave psychophysical ratings of pleasantness and intensity on every trial, so that correlation analyses between the ratings and the brain activations could be performed. The experimental protocol consisted of an event-related interleaved design presenting in random permuted sequence the three experimental conditions described above, and a clean air condition. Each trial started with a 4 s odor (or clean air) stimulus delivery, and an indication that a trial has started by a small white visual cue at the center of a visual display back-projection screen being observed through prisms to allow the subjects to sample the odor synchronized with its onset. We emphasize that the subjects did not know what each odor was nor of the number of odors in the experiment, and had to sniff at the start of each odor delivered in random sequence and then rate it for pleasantness and intensity. The clean air flow was on at all times that an odor stimulus was not being delivered. The subjects were not informed of the nature of the odors, nor of how many there were in the experiment. At t = 8 s after trial onset, the pleasantness rating scale appeared for 4 s, and the subject rated the stimulus for pleasantness (with +2 being very pleasant and −2 very unpleasant). At t = 12 s after trial onset, the intensity rating scale appeared for 4 s, and the subject rated the stimulus for intensity (0 to +4). The ratings were made with a visual analog rating scale in which the subject moved the bar to the appropriate point on the scale using a button box. Subjects were pretrained outside the scanner in the whole procedure and use of the rating scales and had thus experienced all the odors on a number of different trials before the imaging experiment. At t = 16 s the limonene was switched on for 1 s to act as a dishabituator, followed, as always, by clean air whenever an odor stimulus was not on. The whole trial duration was 26 s. Each of the four trial types (jasmine, indole, jasind, and clean air) was presented in random permuted sequence nine times. This general protocol and design has been used successfully in previous studies to investigate olfactory cortical areas (Rolls et al., 2003; de Araujo et al., 2005).
fMRI data acquisition.
Images were acquired with a 3.0-T Varian/Siemens (Erlangen, Germany) whole-body scanner at the FMRIB (Centre for Functional Magnetic Resonance Imaging of the Brain at Oxford), where 27 T2*-weighted echo-planar imaging EPI coronal slices with in-plane resolution of 3 × 3 mm and between plane spacing of 4 mm were acquired every 2 s (repetition time, 2). We used the techniques that we have developed over a number of years (O'Doherty et al., 2001; de Araujo et al., 2003a) and, as described in detail by Wilson et al. (2002), we carefully selected the imaging parameters to minimize susceptibility and distortion artifact in the orbitofrontal cortex. The relevant factors include imaging in the coronal plane, minimizing voxel size in the plane of the imaging, as high a gradient switching frequency as possible (960 Hz), a short echo time of 28 ms, and local shimming for the inferior frontal area. The matrix size was 64 × 64 and the field of view was 192 × 192 mm. Continuous coverage was obtained from + 62 [anteroposterior (AP)] to −46 (AP). A whole-brain T2*-weighted EPI volume of the above dimensions, and an anatomical T1 volume with coronal plane slice thickness 3 mm and in-plane resolution of 1 × 1 mm was also acquired.
fMRI data analysis.
The imaging data were analyzed using SPM5 (Wellcome Institute of Cognitive Neurology). Preprocessing of the data used SPM5 realignment, reslicing with sinc interpolation, normalization to the MNI (Montreal Neurological Institute) coordinate system (Collins et al., 1994), and spatial smoothing with a 6 mm full-width at half maximum isotropic Gaussian kernel. The time series at each voxel were low-pass filtered with a hemodynamic response kernel. Time series nonsphericity at each voxel was estimated and corrected for (Friston et al., 2002), and a high-pass filter with a cutoff period of 128 s was applied. In the single-event design, a general linear model was then applied to the time course of activation where stimulus onsets (t = 0 in each trial) were modeled as single impulse response functions and then convolved with the canonical hemodynamic response function (Friston et al., 1994). Linear contrasts were defined to test specific effects. Time derivatives were included in the basis functions set. After smoothness estimation (Kiebel et al., 1999), linear contrasts of parameter estimates were defined to test the specific effects of each condition with each individual dataset. Voxel values for each contrast resulted in a statistical parametric map of the corresponding t statistic, which was then transformed into the unit normal distribution (SPM Z). The statistical parametric maps from each individual dataset were then entered into second-level, random effects analyses accounting for both scan-to-scan and subject-to-subject variability. More precisely, the sets of individual statistical maps corresponding to a specific effect of interest were entered as covariates in multiple regression models as implemented in SPM5, and the corresponding group effects were assessed by applying linear contrasts (again after smoothness estimation) to the (second-level) parameter estimates generating a t statistics map for each group effect of interest. The correlation analyses of the fMRI blood oxygenation level-dependent (BOLD) signal with given parameters of interest (e.g., the pleasantness ratings) were performed at the second-level through applying one-sample t tests to the first-level statistical parametric maps resulting from performing linear parametric modulation as implemented in SPM5. We report results for brain regions where there were previous hypotheses as described in the Introduction, namely in the parts of the orbitofrontal and anterior cingulate cortex, pyriform cortex, and anterior insula, in which we and others have found activations in previous studies to olfactory stimuli (Zald and Pardo, 2000; Gottfried et al., 2002; Anderson et al., 2003; Rolls et al., 2003; de Araujo et al., 2005) and applied small volume corrections for multiple comparisons (Worsley et al., 1996) with a radius corresponding to the full-width at half maximum of the spatial smoothing filter used. Peaks are reported for which p < 0.05, although the exact corrected probability values (Worsley et al., 1996) are given in the text.
For the time-course plots, we located activations within the a priori regions of interest and extracted event-related responses from the peak voxel for each subject. These single-subject time courses were then averaged across subjects. Differences between the BOLD signals to the three stimuli were analyzed using a within subjects ANOVA, and the post hoc p values between pairs of stimuli calculated using the least significant difference (LSD) test are provided if the ANOVA was significant at p < 0.01.
For voxels where significant correlations were found between the percent BOLD signal and the ratings, we produced graphs to show how the ratings were related to the percent BOLD signal. These were produced for each subject by taking the average of the BOLD response in the three time bins at 4, 6, and 8 s poststimulus, on each trial, and the corresponding rating. For each subject the means were calculated in discretized ranges of the rating function (e.g., −2 to −1.75, −1.75 to −1.5 etc), and then these values were averaged across subjects.
Results
The ratings of pleasantness and intensity
The ratings of the pleasantness and intensity of the stimuli obtained during the neuroimaging are shown in Figure 1. A within-subjects ANOVA performed on the three olfactory stimuli (F(2,26) = 41.8; p ≪ 0.001) followed by post hoc LSD tests (accompanied by a Kolmogorov–Smirnov test for normality) showed that jasmine and jasind were both rated as more pleasant than the indole (both p ≪ 0.001), and that there was no significant difference (p > 0.3) between the jasmine and jasind. (The effects were even more significant if the air was included in the analysis.) In contrast, the ANOVA on the intensity ratings showed no significant differences (F(2,26) = 2.43; p > 0.1), indicating that the general design aim of producing stimuli that differed in pleasantness but not intensity had been achieved.
Medial orbitofrontal cortex
A correlation with the pleasantness ratings of the three stimuli was found in the medial orbitofrontal cortex (Fig. 2a) with coordinates [4, 46, −14] (Z = 2.41; p < 0.05). These coordinates were selected not only because of the correlation with the pleasantness ratings found in this study, but also because a very similar correlation with pleasantness was found in the same brain area in previous investigations (Rolls et al., 2003). Figure 2d shows that the pleasantness ratings of the subjects were very clearly related to the changes in the BOLD signal. To analyze the activations to each of the three stimuli in this region, we show in Figure 2b the time courses of the activations, and in Figure 2c the peak values averaged across subjects. Jasind produced significantly more activation than did jasmine (post hoc LSD, p = 0.031), which in turn produced more activation than indole (p = 0.014). The effects in the medial orbitofrontal cortex were especially interesting, as this was the only site with a positive correlation with pleasantness in which the jasind produced more activation than the jasmine. Two of the subjects did rate the jasind as being significantly more pleasant than the jasmine (p = 0.03 and 0.02), and the difference in the BOLD signal might be related to qualities captured better by other descriptors such as “full-bodied odor”.
Figure 2.
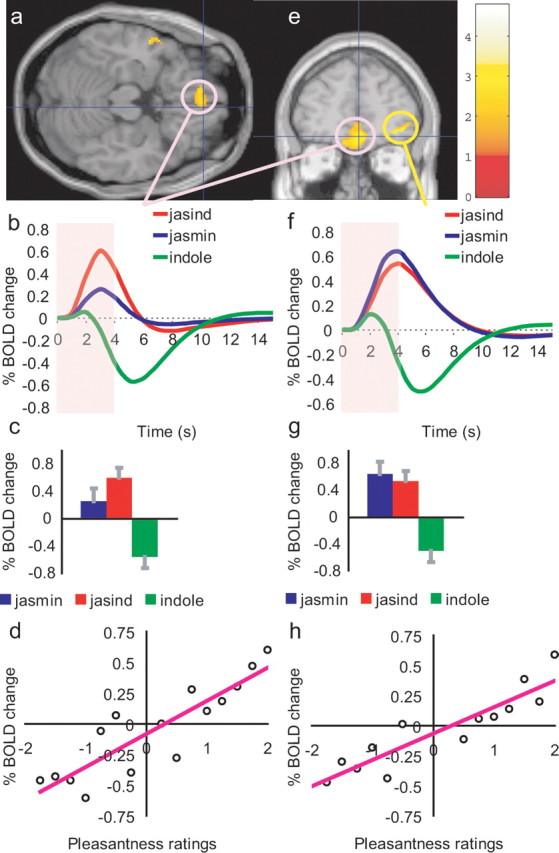
Activations correlating with pleasantness in the orbitofrontal cortex. a, e, SPM analysis showing a correlation in the medial orbitofrontal cortex (pink circles) at [4, 46, −14] between the BOLD signal and the pleasantness ratings of the three stimuli (jasmine, jasind, and indole). For this medial orbitofrontal cortex region, b shows the time courses averaged across subjects of the activations to each of the three odor stimuli, c shows the peak values (±SEM) of the data shown in b, and d shows the percentage change in the BOLD signal as a function of the different values of the pleasantness ratings given by the subjects to the three stimuli (r = 0.88; p ≪ 0.001). (The percent BOLD values in d were calculated by obtaining the average BOLD signal for pleasantness ratings binned at increments of 0.25 for each subject, and then averaging across subjects.) A more anterior and lateral part of the orbitofrontal cortex also had activations that were correlated with the pleasantness ratings (e; yellow circle, with peak at [40, 52, −6]). For this lateral orbitofrontal cortex region, f shows the time courses of the activations to each of the three stimuli, g shows the peak values (±SEM) averaged across subjects, and h shows the percent change in the BOLD signal as a function of the different values of the pleasantness ratings given by the subjects to the three stimuli (r = 0.91; p ≪ 0.001).
A more anterior and lateral part of the orbitofrontal cortex also had activations that were correlated with the pleasantness ratings (Fig. 2e) (with peak at [40, 52, −6]; Z = 2.69; p = 0.042). The activations here were similar in magnitude to the jasind and jasmine (not significantly different), with deactivations being produced to the indole (post hoc difference from both jasmine and jasind, p = 0.003), as shown in Figure 2e–h.
No correlations with intensity were found in either of these orbitofrontal cortex regions.
Posterior midorbitofrontal cortex
A different part of the orbitofrontal cortex had activations that were negatively correlated with pleasantness ratings to the three stimuli, with peak at [22, 28, −14] (Z = 3.39; p = 0.009) (Fig. 3e,h). As shown in Figure 3, f and g, the activations were larger to the indole than to the jasmine (post hoc, p = 0.001), and interestingly the activations to the jasind were intermediate between the indole and the jasmine. (The activation to the jasind was greater than to the jasmine (post hoc, p = 0.04) although not significantly different from the indole.)
Figure 3.
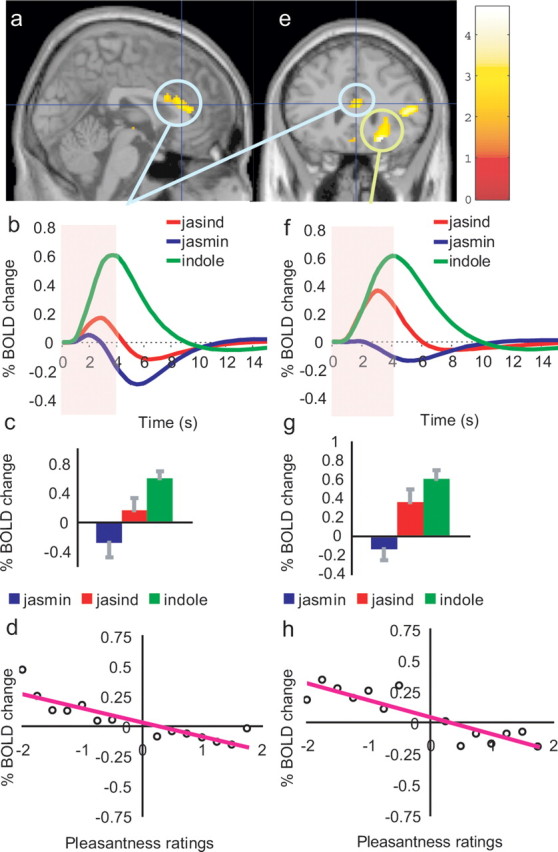
a, e, Activations correlating with unpleasantness in the posterior midorbitofrontal cortex (e, green circle) at [22, 28, −14], and a dorsal part of anterior cingulate cortex (a, e, blue circles) at [2, 28, 16]. b–d, For the dorsal anterior cingulate cortex, b shows the time courses of the activations to each of the three odor stimuli, c shows the peak values (±SEM) averaged across subjects, and d shows the percentage change in the BOLD signal as a function of the different values of the pleasantness ratings given by the subjects to the three stimuli (r = 0.87; p ≪ 0.001). f–h, For the posterior midorbitofrontal cortex, f shows the time courses of the activations to each of the three stimuli, g shows the peak values (±SEM) averaged across subjects, and h shows the percentage change in the BOLD signal as a function of the different values of the pleasantness ratings given by the subjects to the three stimuli (r = 0.87; p ≪ 0.001). The activations in both regions to the jasind were intermediate between the indole and the jasmine, as shown in (b, c, f, g) (see Results).
Dorsal anterior cingulate cortex
A dorsal part of anterior cingulate cortex at coordinates [2, 28, 16] (Z = 2.55; p = 0.044) also had activations that were negatively correlated with the pleasantness ratings to the three stimuli, as shown in Figure 3, a and d. Here also the activations to the jasind were intermediate between the indole and the jasmine. As shown in Figure 3, b and c, the activations were larger to the indole than to both the jasind (post hoc, p = 0.05) and the jasmine (post hoc, p = 0.01) (with the activations to the jasind and the jasmine not being significantly different from each other).
Agranular insula
The agranular insular cortex at [44, 30, 8] (Z = 3.20; p = 0.015) also had activations that were negatively correlated with the pleasantness ratings to the three stimuli, as shown in Figure 4, a and d. Here also the activations to the jasind were intermediate between the indole and the jasmine. As shown in Figure 4, b and c, the activations were larger to the indole than to both the jasind (post hoc, p < 0.05) and the jasmine (post hoc, p = 0.01) (with the activations to the jasind and the jasmine not being significantly different to each other). We note in the Discussion that this part of the insula receives inputs from the primary olfactory cortex, and is interconnected with the orbitofrontal cortex (Carmichael et al., 1994).
Figure 4.

a, Activations correlating with unpleasantness ratings to the three odor stimuli in the agranular insular cortex at [44, 30, 8]. b, c, The activations to the jasind were intermediate between the indole and the jasmine, as shown by the time courses of the activation produced by the odor stimuli (b) and the corresponding peak values (±SEM) averaged across subjects (c) (see Results). d, Percentage change in the BOLD signal as a function of the different values of the pleasantness ratings (r = 0.89; p ≪ 0.001).
Pyriform cortex
None of the above regions had correlations with the ratings of the intensity of the 3 odors. However, in the pyriform cortex (a primary olfactory area receiving directly from the olfactory tract) [−18, 4, −16], the activations were correlated with the intensity ratings (Z = 2.31; p < 0.05), which of course varied on a trial by trial basis as each subject was being tested, as shown in Figure 5, a, c, and d. This corresponds to what has been designated as posterior pyriform cortex in humans (with anterior pyriform cortex located close to y = 12) (Gottfried et al., 2002), although its exact correspondence to the posterior versus anterior pyriform cortex distinction made in rodents (Haberly, 2001) is not yet known. These coordinates were selected not only because of the correlation with the intensity ratings found in this study, but also because a very similar correlation with intensity was found in the same brain area in previous investigations (Anderson et al., 2003; Rolls et al., 2003). The time courses of the activations, and their peak magnitudes are shown in Figure 5, b and c, and were not significantly different from each other (ANOVA not significant p > 0.05; and all post hoc tests, p > 0.05). As shown in Figure 5e, the activations were not at all related to the pleasantness of the three stimuli, and indeed the SPM analysis showed no correlation in the olfactory cortex between the pleasantness ratings and the BOLD signal.
Figure 5.
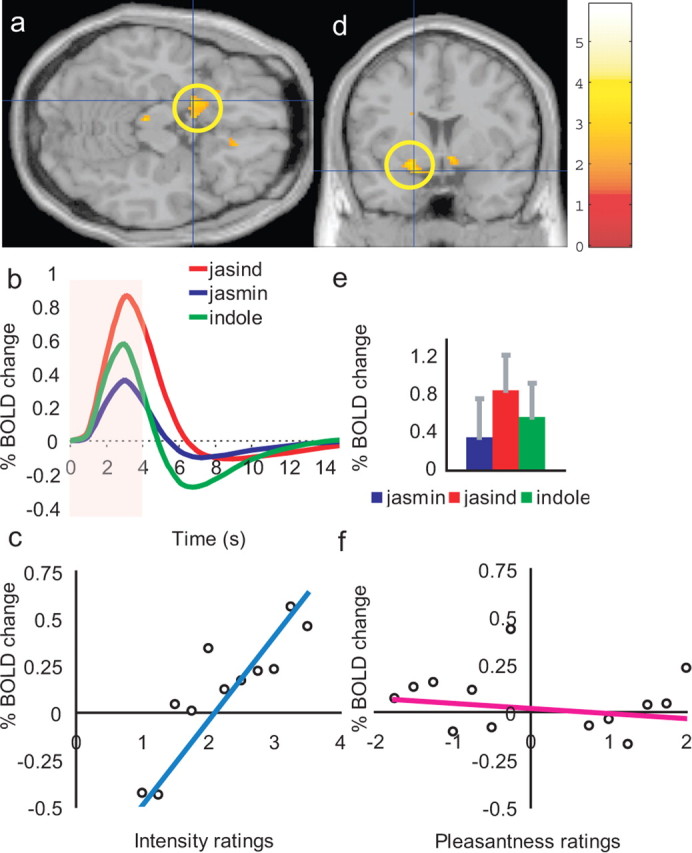
a, d, Activations correlating with the intensity ratings to the three odor stimuli in the pyriform cortex [−18, 4, −16]. b, e, The activations to the three stimuli were not on average significantly different, as shown by the time courses of the activation produced by the odor stimuli (b) and the corresponding peak values (±SEM) averaged across subjects (e) (see Results). c, The percentage change in the BOLD signal as a function of the different values of the intensity ratings (r = 0.86; p ≪ 0.001). f, No correlation was found with the pleasantness ratings (r = −0.15; p = 0.60).
Anterior insula
Activations that were negatively correlated with the intensity ratings of the three stimuli were found in the anterior part of the insula, with two main peaks, at [−30, 18, 14] (Z = 3.38; p = 0.007) (Fig. 6a,d) and [−48, 2, 10] (and contralaterally as shown in Fig. 6a) (Z = 3.02; p = 0.026) (Fig. 6e,h). There were no significant differences in the time courses or peaks of the BOLD activations in both sites (Fig. 6b,c,f,g). (The correlations arose in relation to the trial-by-trial variation, and reflect lower activations to stronger olfactory stimuli.) There were no correlations with the pleasantness of the 3 stimuli in this region. We show in the Discussion that these parts of the insula are in or close to the primary taste cortex.
Figure 6.
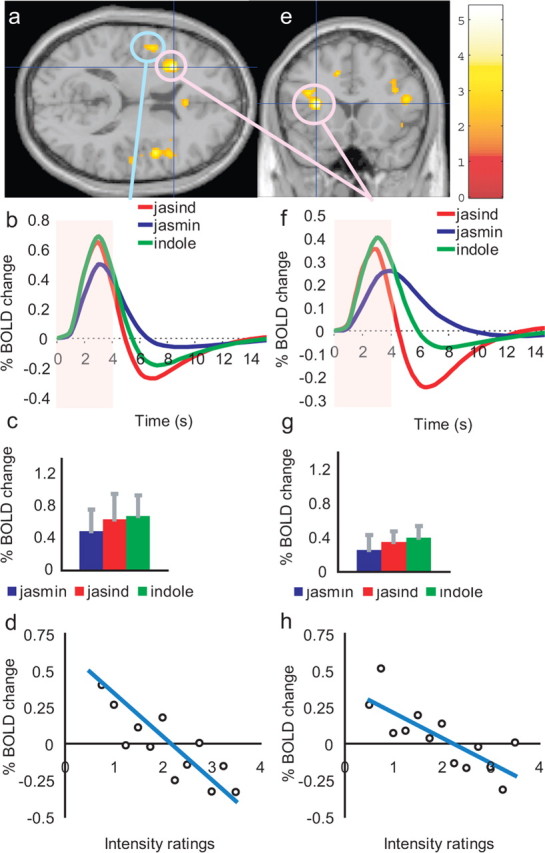
a, e, Activations that were negatively correlated with the intensity ratings of the three odor stimuli were found in the anterior part of the insula, with two main peaks at [−30, 18, 14] (pink circles in a and e) and [−48, 2, 10] (blue circle in a). There were no significant differences in the time courses or peaks of the BOLD activations in both sites (b, c, f, g). d and h show the percentage change in the BOLD signal as a function of the different values of the intensity ratings for the two regions (r = 0.77, p = 0.002; r = 0.83, p ≪ 0.001).
Differences in the patterns of activation of the mixture between areas
We have shown that in brain areas that represent the pleasantness of the odors as shown by SPM correlation analyses, the BOLD response to the jasind is closer to jasmine than to indole (Fig. 2, for orbitofrontal cortex). In contrast, in brain areas that represent the unpleasantness of odors, the BOLD response to the jasind is relatively closer to indole than jasmine (Figs. 3, for midorbitofrontal and dorsal cingulate cortex, 4, for the anterior insula). To test whether different areas have the magnitude of the response to the mixture at different relative distances from the jasmine and indole, we performed a two-factor ANOVA to compare two brain areas, with one factor the brain area, and the second factor the distance of the jasind from the jasmine vs the distance of the jasind from the indole. The distance measure was the absolute difference in the magnitude of the BOLD response to the jasind from either the jasmine or the indole (using peak responses in all cases). Significant interactions in this two-way ANOVA would indicate that the relative distances of the jasind from the jasmine and from the indole were different in the two areas.
Significant interactions were found for brain regions representing the pleasantness versus the unpleasantness of odors, including the medial orbitofrontal cortex versus posterior midorbitofrontal cortex (p = 0.013), anterior lateral orbitofrontal cortex versus posterior midorbitofrontal cortex (p = 0.012), anterior lateral orbitofrontal cortex versus dorsal anterior cingulate cortex (p = 0.009), and anterior lateral orbitofrontal cortex versus agranular insula (p = 0.036). Significant interactions were also found for brain regions representing the pleasantness versus the intensity of odors, including medial orbitofrontal cortex versus pyriform cortex (p = 0.010), anterior lateral orbitofrontal cortex versus pyriform cortex (p = 0.003), and anterior lateral orbitofrontal cortex versus taste insula (p = 0.009). A Fisher exact probability test (Fisher, 1932; Littell and Folks, 1971; Zaykin et al., 2002) showed that this pattern of results would have occurred by chance with p≪0.0001. The findings show that there are differences between brain areas in how they respond to the mixture relative to the pleasant and unpleasant anchor stimuli, jasmine, and indole that cannot be accounted for by any linear process, in that the mixture is placed at different relative distances from the pleasant and unpleasant anchors in different brain areas. Thus, the different brain areas respond with different nonlinearities to this hedonic mixture, thus emphasizing different aspects of the affective stimuli.
The patterns of activation for different brain areas can be visualized by the distance measures between the different pairs of odor stimuli shown in Figure 7 for different brain regions. Figure 7a shows that in brain areas where correlations with pleasantness were found, the jasind mixture was treated similarly to the jasmine odor as shown by the relatively small distance between these stimuli (jasind–jasmine). Figure 7b shows that in brain areas where correlations with unpleasantness were found, the jasind mixture was treated as intermediate between the jasmine and the indole (i.e., the values on the jasind–jasmine and jasind–indole axes are similar to each other, and smaller than those on the jasmine–indole axis). Figure 7c shows that in brain areas where correlations with intensity were found, all the distances between the stimuli are relatively small and similar to each other.
Figure 7.

Patterns of activation to the three odor stimuli for different brain regions as shown by the distances in activation between the odors. The distance measure was calculated as the absolute difference in the magnitude of the BOLD response between the odor pairs (jasind vs jasmine, jasind vs indole, jasmine vs indole) (see Results). a, The activation patterns in brain areas where correlations with pleasantness were found. The jasind mixture was treated similar to the jasmine odor as shown by the relatively small distance between these stimuli. b, The activation patterns in brain areas where correlations with unpleasantness were found. In these regions, the jasind mixture was treated as intermediate between the jasmine and the indole. c, The activation patterns in areas where correlations with intensity were found.
Discussion
The brain responses found to the odor mixture relative to its components can be divided into three main types. First, the activations in the primary olfactory areas were correlated with the intensity ratings and not the pleasantness ratings, and the BOLD responses to the three olfactory stimuli were overall quite similar (Fig. 5). Second, the responses in areas where the activations were correlated with the pleasantness of the stimuli (and not its intensity), such as the medial orbitofrontal cortex, had activations to the jasmine and the mixture that were relatively similar and large (Fig. 2). These large activations to the jasmine and the mixture were related to the pleasantness of the stimuli, as shown in Figure 2, d and h. Thus, in brain regions that represent the pleasantness of odors, the jasmine and jasind, rated as approximately equally pleasant (Fig. 1), are treated as being relatively similar in terms of the size of the activations produced. Third, in brain regions where the activations were correlated with the unpleasantness of the stimuli, such as the dorsal part of the anterior cingulate cortex and a caudal midorbitofrontal cortex region, the magnitude of the activations to the jasind was intermediate between those to the jasmine and the indole. In fact, whereas the jasmine on its own produced a deactivation or no response in these areas, the jasind resulted in a positive response (Figs. 3, 4). The implication is that in these brain regions potentially unpleasant aspects of the indole in the mixture are represented. In contrast, in the brain regions that represent the pleasantness of odors, the pleasant aspects of the mixture appear to be represented. Thus, the indication is that the brain can simultaneously and independently represent the positive and the negative hedonic value of an odor mixture that contains pleasant and unpleasant components. These findings were made with an odor that is known to most people and found pleasant, jasmine and, thus, the results are likely to be apply to many people. We emphasize that in its natural form jasmine contains indole in addition to its pleasant components, and that this study was made possible by formulating a model jasmine odor with only pleasant components, to which indole could be added as part of the experimental design.
The finding that the jasind mixture produced a larger activation in the medial orbitofrontal cortex (which represents the pleasantness of odors as shown here and previously) (Anderson et al., 2003; Rolls et al., 2003; de Araujo et al., 2005) than the jasmine (Fig. 2b,c) is of interest in relation to the fact that some individuals find that adding an unpleasant component to a pleasant odor may enhance its appeal, with verbal descriptions sometimes referring to enhanced attractiveness or body. Indeed in the present study, two of the participants did rate the mixture as being significantly more pleasant than the jasmine alone. A possibility is that even if in all subjects the mixture with different hedonic components does not lead to increased pleasantness ratings, the larger activations in the medial orbitofrontal cortex in this investigation might represent preferences that are not conscious, but can influence decision-making and behavior.
The finding that unpleasant odors activate a dorsal part of the anterior cingulate cortex, and indeed that the subjective pleasantness ratings are negatively correlated with activations in this region, is consistent with and confirms previous findings (Rolls et al., 2003; de Araujo et al., 2005). The interesting new finding is that in this brain region the unpleasant component of the jasind odor mixture resulted in a magnitude of activation by the mixture that was less like that evoked to jasmine, and was closer to that produced by indole. The same effect was quite general, in that in other brain regions where the activations were negatively correlated with the pleasantness ratings, such as a posterior and midpart of the orbitofrontal cortex (Fig. 3e–h), and the agranular insula (Fig. 4), a similar pattern of an intermediate response to the jasind between the indole and the jasmine was found. In fact, activation by unpleasant vs pleasant odors in a midpart of the orbitofrontal cortex has a precedent, with this contrast significant at [26, 28, −8] in the study by Rolls et al., (2003) and the corresponding region in the present study being at [22, 28, −14]. The agranular insular cortex, at the most anterior end of the insular cortex where it is topologically part of the orbitofrontal cortex, and which receives inputs from primary olfactory areas (Carmichael et al., 1994), showed similar patterns of activation. Part of the interest of the intermediate activation to the odor mixture in these regions is that the subjective ratings of the pleasantness of the stimuli by the subjects did not clearly reflect any difference in unpleasantness between the jasind and the jasmine. Thus, again it is possible that some aspects related to the unpleasantness of an odor (in this case, the addition of indole), although reflected in parts of the brain that represent the unpleasantness of odors, are not reflected in subjective conscious affective evaluations.
In the primary olfactory areas such as the pyriform cortex (Small et al., 2005; Li et al., 2006) (Fig. 5) (at [−16, 4, −16]) the subjective intensity ratings but not the pleasantness ratings were correlated with activations (see also Anderson et al., 2003; Rolls et al., 2003). In contrast to the areas where the pleasantness or unpleasantness of odors are represented, the activations in this primary olfactory area did not differ significantly in magnitude for the odor mixture stimulus and its components. Consistent with these points, when averaged over trials the mixture and its components were very similar in their subjective intensities (Fig. 1). An opposite correlation with the intensity but not pleasantness ratings, and again similar magnitudes of activations to the three olfactory stimuli, was found in the anterior insula with peaks at y = 2 and y = 18. These regions are at the posterior and anterior end respectively of the part of the anterior insula that represents taste and is probably the human primary taste cortex (de Araujo et al., 2003a,b). We do not know if neurons in the primary taste cortex were being activated by the odor stimuli, perhaps as part of some top-down modulatory effect, but in any case, the activations here were not related to the interesting differences in the affective value of the olfactory stimuli that were represented in other brain areas in the present investigation.
Previous research on odor mixtures has shown that the interactions include suppression, the formation of new representations that are different from the components (Giraudet et al., 2002; Shepherd, 2006; Wilson et al., 2006; Zou and Buck, 2006), and difficulty in identifying the chemical components of mixtures with more than a few components (Laing and Francis, 1989; Livermore and Laing, 1998; Jinks and Laing, 1999). The interactions may take place at various stages of the olfactory pathways including the olfactory bulb, and areas that receive inputs from the olfactory tract including the pyriform cortex (Wilson et al., 2006; Zou and Buck, 2006). However, these studies have not explicitly investigated interactions between pleasant and unpleasant odors in parts of the olfactory system where the affective value of odors is represented, and we know of no previous neuroimaging studies in humans that have compared the effects of a mixture with those of its components. In the present study, we found interesting evidence that an olfactory mixture can be represented in different ways in different cortical areas, providing an indication that the components in the mixture are still separable to some extent in secondary olfactory cortical areas and beyond, or that the different cortical areas represent the mixture in different nonlinear ways to represent different effects of the mixture. Indeed, the indication that the brain can simultaneously and independently represent the positive and the negative hedonic value of an odor mixture that contains pleasant and unpleasant components has interesting and new implications for our understanding of the brain processing involved in decision-making. An implication is that the orbitofrontal cortex and some connected regions represent separately the hedonically positive and the hedonically negative aspects of even a single stimulus such as an odor. These separate representations may provide important inputs to the decision-making process itself, which may have to make binary decisions about whether to choose the stimulus or not (Deco and Rolls, 2006), and which could be made in other brain areas.
Footnotes
This work was supported by the Gottlieb-Daimler and Karl Benz Foundation (F.G.). The investigation was performed at the Centre for Functional Magnetic Resonance Imaging of the Brain at Oxford University. We thank Peter Hobden for his help.
References
- Anderson AK, Christoff K, Stappen I, Panitz D, Ghahremani DG, Glover G, Gabrieli JD, Sobel N. Dissociated neural representations of intensity and valence in human olfaction. Nature Neuroscience. 2003;6:196–202. doi: 10.1038/nn1001. [DOI] [PubMed] [Google Scholar]
- Carmichael ST, Clugnet M-C, Price JL. Central olfactory connections in the macaque monkey. J Comp Neurol. 1994;346:403–434. doi: 10.1002/cne.903460306. [DOI] [PubMed] [Google Scholar]
- Collins DL, Neelin P, Peters TM, Evans AC. Automatic 3D intersubject registration of MR volumetric data in standardized Talairach space. J Comput Assist Tomogr. 1994;18:192–205. [PubMed] [Google Scholar]
- de Araujo IET, Kringelbach ML, Rolls ET, Hobden P. The representation of umami taste in the human brain. J Neurophysiol. 2003a;90:313–319. doi: 10.1152/jn.00669.2002. [DOI] [PubMed] [Google Scholar]
- de Araujo IET, Rolls ET, Kringelbach ML, McGlone F, Phillips N. Taste-olfactory convergence, and the representation of the pleasantness of flavour, in the human brain. Eur J Neurosci. 2003b;18:2374–2390. doi: 10.1046/j.1460-9568.2003.02915.x. [DOI] [PubMed] [Google Scholar]
- de Araujo IET, Rolls ET, Velazco MI, Margot C, Cayeux I. Cognitive modulation of olfactory processing. Neuron. 2005;46:671–679. doi: 10.1016/j.neuron.2005.04.021. [DOI] [PubMed] [Google Scholar]
- Deco G, Rolls ET. Decision-making and Weber's law: a neurophysiological model. Eur J Neurosci. 2006;24:901–916. doi: 10.1111/j.1460-9568.2006.04940.x. [DOI] [PubMed] [Google Scholar]
- Dulac C, Torello AT. Molecular detection of pheromone signals in mammals: from genes to behaviour. Nat Rev Neurosci. 2003;4:551–562. doi: 10.1038/nrn1140. [DOI] [PubMed] [Google Scholar]
- Fisher RA. Statistical methods for research workers. London: Oliver and Boyd; 1932. [Google Scholar]
- Frater G, Bajgrowicz JA, Kraft P. Fragrance chemistry. Tetrahedron. 1998;54:7633–7703. [Google Scholar]
- Friston KJ, Worsley KJ, Frackowiak RSJ, Mazziotta JC, Evans AC. Assessing the significance of focal activations using their spatial extent. Hum Brain Mapp. 1994;1:214–220. doi: 10.1002/hbm.460010306. [DOI] [PubMed] [Google Scholar]
- Friston KJ, Glaser DE, Henson RN, Kiebel S, Phillips C, Ashburner J. Classical and Bayesian inference in neuroimaging: applications. NeuroImage. 2002;16:484–512. doi: 10.1006/nimg.2002.1091. [DOI] [PubMed] [Google Scholar]
- Giraudet P, Berthommier F, Chaput M. Mitral cell temporal response patterns evoked by odor mixtures in the rat olfactory bulb. J Neurophysiol. 2002;88:829–838. doi: 10.1152/jn.2002.88.2.829. [DOI] [PubMed] [Google Scholar]
- Gottfried JA, Deichmann R, Winston JS, Dolan RJ. Functional heterogeneity in human olfactory cortex: an event-related functional magnetic resonance imaging study. J Neurosci. 2002;22:10819–10828. doi: 10.1523/JNEUROSCI.22-24-10819.2002. [DOI] [PMC free article] [PubMed] [Google Scholar]
- Gottfried JA, Winston JS, Dolan RJ. Dissociable codes of odor quality and odorant structure in human piriform cortex. Neuron. 2006;49:467–479. doi: 10.1016/j.neuron.2006.01.007. [DOI] [PubMed] [Google Scholar]
- Haberly LB. Parallel-distributed processing in olfactory cortex: new insights from morphological and physiological analysis of neuronal circuitry. Chem Senses. 2001;26:551–576. doi: 10.1093/chemse/26.5.551. [DOI] [PubMed] [Google Scholar]
- Jinks A, Laing DG. A limit in the processing of components in odour mixtures. Perception. 1999;28:395–404. doi: 10.1068/p2898. [DOI] [PubMed] [Google Scholar]
- Kaiser R. New volatile constituents of Jasminum sambac (L.). in flavors and fragrances: a world perspective. In: Lawrence BM, Mookherjee BD, Willis BJ, editors. Proceedings of the 10th international congress of essential oils, fragrances and flavors; Washington, DC: Elsevier; 1988. pp. 415–424. [Google Scholar]
- Kiebel SJ, Poline JB, Friston KJ, Holmes AP, Worsley KJ. Robust smoothness estimation in statistical parametric maps using standardized residuals from the general linear model. NeuroImage. 1999;10:756–766. doi: 10.1006/nimg.1999.0508. [DOI] [PubMed] [Google Scholar]
- Laing DG, Francis GW. The capacity of humans to identify odors in mixtures. Physiol Behav. 1989;46:809–814. doi: 10.1016/0031-9384(89)90041-3. [DOI] [PubMed] [Google Scholar]
- Li W, Luxenberg E, Parrish T, Gottfried JA. Learning to smell the roses: experience-dependent neural plasticity in human piriform and orbitofrontal cortices. Neuron. 2006;52:1097–1108. doi: 10.1016/j.neuron.2006.10.026. [DOI] [PMC free article] [PubMed] [Google Scholar]
- Littell RC, Folks JL. Asymptotic optimality of Fisher's method of combining independent tests. J Am Stat Assoc. 1971;66:802–806. [Google Scholar]
- Livermore A, Laing DG. The influence of chemical complexity on the perception of multicomponent odor mixtures. Percept Psychophys. 1998;60:650–661. doi: 10.3758/bf03206052. [DOI] [PubMed] [Google Scholar]
- McCabe C, Rolls ET. Umami: a delicious flavor formed by convergence of taste and olfactory pathways in the human brain. Eur J Neurosci. 2007;25:1855–1864. doi: 10.1111/j.1460-9568.2007.05445.x. [DOI] [PubMed] [Google Scholar]
- O'Doherty J, Rolls ET, Francis S, Bowtell R, McGlone F. The representation of pleasant and aversive taste in the human brain. J Neurophysiol. 2001;85:1315–1321. doi: 10.1152/jn.2001.85.3.1315. [DOI] [PubMed] [Google Scholar]
- Plailly J, Radnovich AJ, Sabri M, Royet JP, Kareken DA. Involvement of the left anterior insula and frontopolar gyrus in odor discrimination. Hum Brain Mapp. 2007;28:363–372. doi: 10.1002/hbm.20290. [DOI] [PMC free article] [PubMed] [Google Scholar]
- Poellinger A, Thomas R, Lio P, Lee A, Makris N, Rosen BR, Kwong KK. Activation and habituation in olfaction: an fMRI study. NeuroImage. 2001;13:547–560. doi: 10.1006/nimg.2000.0713. [DOI] [PubMed] [Google Scholar]
- Rolls ET. Emotion explained. Oxford: Oxford UP; 2005. [Google Scholar]
- Rolls ET, Kringelbach ML, de Araujo IET. Different representations of pleasant and unpleasant odors in the human brain. Eur J Neurosci. 2003;18:695–703. doi: 10.1046/j.1460-9568.2003.02779.x. [DOI] [PubMed] [Google Scholar]
- Royet JP, Plailly J, Delon-Martin C, Kareken DA, Segebarth C. fMRI of emotional responses to odors: influence of hedonic valence and judgment, handedness, and gender. NeuroImage. 2003;20:713–728. doi: 10.1016/S1053-8119(03)00388-4. [DOI] [PubMed] [Google Scholar]
- Savic I, Berglund H, Gulyas B, Roland P. Smelling of odorous sex hormone-like compounds causes sex-differentiated hypothalamic activations in humans. Neuron. 2001;31:661–668. doi: 10.1016/s0896-6273(01)00390-7. [DOI] [PubMed] [Google Scholar]
- Shepherd GM. Smell images and the flavour system in the human brain. Nature. 2006;444:316–321. doi: 10.1038/nature05405. [DOI] [PubMed] [Google Scholar]
- Small DM, Gerber JC, Mak YE, Hummel T. Differential neural responses evoked by orthonasal versus retronasal odorant perception in humans. Neuron. 2005;47:593–605. doi: 10.1016/j.neuron.2005.07.022. [DOI] [PubMed] [Google Scholar]
- Toda H, Mihara S, Umano K, Shibamoto T. Photochemical studies on Jasmine oil. J Agric Food Chem. 1983;31:554–558. [Google Scholar]
- Verzele M, Maes G, Vuye A, Godefroot M, Alboom VM, Vervisch J, Sandra P. Chromatographic investigation of jasmine absolutes. J Chromatogr. 1981;205:367–386. [Google Scholar]
- Wilson DA, Kadohisa M, Fletcher ML. Cortical contributions to olfaction: plasticity and perception. Semin Cell Dev Biol. 2006;17:462–470. doi: 10.1016/j.semcdb.2006.04.008. [DOI] [PubMed] [Google Scholar]
- Wilson JL, Jenkinson M, Araujo IET, Kringelbach ML, Rolls ET, Jezzard P. Fast, fully automated global and local magnetic field optimisation for fMRI of the human brain. NeuroImage. 2002;17:967–976. [PubMed] [Google Scholar]
- Winston JS, Gottfried JA, Kilner JM, Dolan RJ. Integrated neural representations of odor intensity and affective valence in human amygdala. J Neurosci. 2005;25:8903–8907. doi: 10.1523/JNEUROSCI.1569-05.2005. [DOI] [PMC free article] [PubMed] [Google Scholar]
- Worsley KJ, Marrett P, Neelin AC, Friston KJ, Evans AC. A unified statistical approach for determining significant signals in images of cerebral activation. Hum Brain Mapp. 1996;4:58–73. doi: 10.1002/(SICI)1097-0193(1996)4:1<58::AID-HBM4>3.0.CO;2-O. [DOI] [PubMed] [Google Scholar]
- Zald DH, Pardo JV. Functional neuroimaging of the olfactory system in humans. Int J Psychophysiol. 2000;36:165–181. doi: 10.1016/s0167-8760(99)00110-5. [DOI] [PubMed] [Google Scholar]
- Zatorre RJ, Jones-Gotman M, Evans AC, Meyer E. Functional localization of human olfactory cortex. Nature. 1992;360:339–340. doi: 10.1038/360339a0. [DOI] [PubMed] [Google Scholar]
- Zatorre RJ, Jones-Gotman M, Rouby C. Neural mechanisms involved in odour pleasantness and intensity judgements. NeuroReport. 2000;11:2711–2716. doi: 10.1097/00001756-200008210-00021. [DOI] [PubMed] [Google Scholar]
- Zaykin DV, Zhivotovsky LA, Westfall PH, Weir BS. Truncated product method for combining P-values. Genet Epidemiol. 2002;22:170–185. doi: 10.1002/gepi.0042. [DOI] [PubMed] [Google Scholar]
- Zou Z, Buck LB. Combinatorial effects of odorant mixes in olfactory cortex. Science. 2006;311:1477–1481. doi: 10.1126/science.1124755. [DOI] [PubMed] [Google Scholar]