

Abstract
A small number (<2%) of mammalian retinal ganglion cells express the photopigment melanopsin and are intrinsically photosensitive (ipRGCs). Light depolarizes ipRGCs and increases intracellular calcium levels ([Ca2+]i) but the signaling cascades underlying these responses have yet to be elucidated. To facilitate physiological studies on these rare photoreceptors, highly enriched ipRGC cultures from neonatal rats were generated using anti-melanopsin-mediated plate adhesion (immunopanning). This novel approach enabled experiments on isolated ipRGCs, eliminating the potential confounding influence of rod/cone-driven input. Light induced a rise in [Ca2+]i (monitored using fura-2 imaging) in the immunopanned ipRGCs and the source of this Ca2+ signal was investigated. The Ca2+ responses were inhibited by 2-aminoethoxydiphenyl borate, SKF-96365 (1–2-(4-methoxyphenyl)-2-[3-(4-methoxyphenyl)propoxy]ethyl-1H-imidazole), flufenamic acid, lanthanum, and gadolinium, consistent with the involvement of canonical transient receptor potential (TRP) channels in ipRGC phototransduction. However, the contribution of direct Ca2+ flux through a putative TRP channel to ipRGC [Ca2+]i was relatively small, as most (∼90%) of the light-induced Ca2+ responses could be blocked by preventing action potential firing with tetrodotoxin. The L-type voltage-gated Ca2+ channel (VGCC) blockers verapamil and (+)-cis-diltiazem significantly reduced the light-evoked Ca2+ responses, while the internal Ca2+ stores depleting agent thapsigargin had negligible effect. These results indicate that Ca2+ influx through VGCCs, activated after action potential firing, was the primary source for light-evoked elevations in ipRGC [Ca2+]i. Furthermore, concurrent Ca2+ imaging and cell-attached electrophysiological recordings demonstrated that the Ca2+ responses were highly correlated to spike frequency, thereby establishing a direct link between action potential firing and somatic [Ca2+]i in light-stimulated ipRGCs.
Keywords: retinal ganglion cell, melanopsin, calcium, TRP channel, voltage-gated calcium channels, circadian rhythms
Introduction
In addition to rod and cone photoreceptors, a third photoreceptor class in the mammalian retina has been revealed with the discovery of intrinsically photosensitive retinal ganglion cells (ipRGCs) that express the photopigment melanopsin (Berson et al., 2002; Hattar et al., 2002). These rare neurons, comprising <2% of the overall RGC population in mammals (Hattar et al., 2002; Morin et al., 2003; Sollars et al., 2003; Dacey et al., 2005), send axons to several retinorecipient structures with particularly dense innervation occurring in the hypothalamic suprachiasmatic nucleus (SCN) and the olivary pretectal nucleus (OPN) (Gooley et al., 2003; Hannibal and Fahrenkrug, 2004a; Hattar et al., 2006). The SCN is the primary circadian oscillator responsible for the generation of circadian rhythms and retinal input entrains the SCN clock to the day/night cycle; the OPN mediates the pupillary light reflex. Functional analyses have confirmed that ipRGCs contribute photic information to these nonvisual systems (Hattar et al., 2003; Panda et al., 2003).
Unlike the hyperpolarizing light responses of rods and cones, light depolarizes ipRGCs and induces action potential firing (Berson et al., 2002; Warren et al., 2003; Dacey et al., 2005). The membrane channel that carries the initial inward current has not been conclusively identified, although there is pharmacological evidence that supports the involvement of a canonical transient receptor potential (TRPC) channel (Warren et al., 2006; Sekaran et al., 2007). Because mammalian TRPC channels are homologous to the TRP and TRP-like channels that mediate the light-activated depolarizing responses of Drosophila photoreceptors (Minke and Parnas, 2006; Ramsey et al., 2006), these studies lend support to the hypothesis that melanopsin-related phototransduction may share a number of characteristics common to invertebrate light signaling pathways (Peirson and Foster, 2006; Berson, 2007). A hallmark of Drosophila TRP and TRP-like channels is a high permeability to Ca2+ (Reuss et al., 1997), and consistent with the putative similarities between mammalian ipRGCs and Drosophila photoreceptors, it has been reported that light stimulates an increase in the intracellular Ca2+ concentration ([Ca2+]i) in ipRGC somata (Sekaran et al., 2003, 2005).
However, it has yet to be determined whether ipRGC Ca2+ responses result primarily from the direct flux of this cation through the light-gated channel (such as a TRPC channel). Alternatively, the light-induced changes in ipRGC [Ca2+]i could also be influenced by either Ca2+ influx through voltage-gated Ca2+ channels (VGCCs) or the release of Ca2+ from internal stores. The goal of this work, therefore, was to characterize the source of the light-activated Ca2+ signals in ipRGCs and to determine the relationship of these responses to light-driven action potential firing. To address these questions, we successfully generated highly enriched cultures of melanopsin-expressing ipRGCs from neonatal rats and recorded light responses from these isolated neurons through Ca2+ imaging, both alone and in conjunction with cell-attached electrophysiological recordings.
Materials and Methods
Immunopanned RGC cultures.
All experiments were approved by the Colorado State University Animal Care and Use Committee. Unless noted otherwise, chemicals and reagents were obtained from Sigma (St. Louis, MO). Long–Evans rats (4–6 per session) were killed on postnatal day 5 (P5)–P7 by halothane overexposure and decapitation. At this neonatal age, rat (Hannibal and Fahrenkrug, 2004b) and mouse (Sekaran et al., 2005) ipRGCs have been shown previously to be light responsive. After enucleation, the retinas were dissected in Hibernate-A medium (BrainBits, Springfield, IL) with 2% B27 supplements (Invitrogen, Carlsbad, CA) and 10 μg/ml gentamicin. The retinas were then incubated for 30 min at 37°C in 10 ml Ca2+/Mg2+-free Dulbecco's PBS (DPBS; Invitrogen) containing 165 U of papain (Worthington Biochemicals, Lakewood, NJ), 1 mm l-cysteine, and 0.004% DNase, and then mechanically triturated in an enzyme inhibitor solution of DPBS (with Ca2+ and Mg2+) containing 1.5 mg/ml ovomucoid (Roche Diagnostics, Indianapolis, IN), 1.5 mg/ml bovine serum albumin (BSA), and 0.004% DNase. The suspension was centrifuged (200 g for 11 min) and washed in DPBS containing higher concentrations (10 mg/ml) of ovomucoid and BSA. After spinning down again, the cells were resuspended in a panning buffer of DPBS containing 0.2 mg/ml BSA and 5 μg/ml insulin and passed through a 20 μm Nitex mesh (Sefar Filtration, Depew, NY) to minimize cell clumping.
We used a melanopsin-antibody panning protocol that was modified from the Thy1-based RGC panning method originally developed by Barres et al. (1988). The dissociated cells were incubated sequentially for 20 min on two 150 mm Petri dishes precoated the night before with Griffonia (Bandeiraea) simplicifolia lectin I (0.2 mg in 24 ml 50 mm Tris HCl, pH 9.5; Vector Laboratories, Burlingame, CA). This lectin panning step helped to eliminate contaminating cells such as macrophages and microglia, which tend to bind nonspecifically to any antibody-coated panning plate. The remaining cell suspension was incubated for 20 min (at room temperature) with extra BSA (5–6 mg/ml final concentration) and rabbit anti-rat N terminus melanopsin antibodies (1:300 dilution; #JHU-71; ATCC, Manassas, VA; deposited by K. Yau, Johns Hopkins University, Baltimore, MD) (Hattar et al., 2002). The solution was then centrifuged at 200 g for 11 min and, after supernatant removal, the cells were resuspended in panning buffer, passed through the 20 μm Nitex mesh, and placed on a 100 mm Petri dish precoated with goat anti-rabbit IgG (heavy and light chains) antibodies (Jackson ImmunoResearch, West Grove, PA). After 30 min, the dish was repeatedly rinsed with DPBS and remaining adherent cells were incubated in 0.125% trypsin solution for 8 min at 37°C and then released from the plate by manually pipetting an enzyme inhibitor solution (30% fetal bovine serum in Neurobasal-A medium) along the dish surface. These melanopsin-panned cells were plated into one or two wells containing a poly-d-lysine/laminin-coated Biocoat glass coverslip (12 mm; BD Biosciences, San Diego, CA) and 750 μl of culture medium consisting of Neurobasal-A plus 2% B27 supplements, and 1 mm glutamine (all from Invitrogen), with 25 ng/ml BDNF, 10 ng/ml CNTF, 5 μm forskolin, and 10 μg/ml gentamicin. Each coverslip was cut into 6–12 pieces with a diamond-tipped knife to enable more experiments on cells cultured together in one well. Cultures were maintained in the dark at 37°C in a humidified 5% CO2-air atmosphere.
In some experiments, the suspension of nonadherent cells remaining after the melanopsin panning step were further incubated on another dish that had been first coated with goat anti-mouse IgM (μ chain) antibodies (Jackson ImmunoResearch) and second with anti-Thy1.1 monoclonal IgM antibodies (generated from T11D7e2 hybridoma cell line; ATCC). These Thy1-panned RGCs were released from the plate and cultured as described above. Additional details on the generation of conventional RGC cultures with Thy1-immunopanning are described previously (Barres et al., 1988; Meyer-Franke et al., 1995; Hartwick et al., 2004).
Immunocytochemistry.
The cultured cells were rinsed with 0.1 m PBS and fixed for 10 min in 4% paraformaldehyde in PBS. The cells were washed three times with PBS and then kept for 30 min in a serum blocking solution consisting of 50% goat serum, 50% buffer solution, and 0.1% Triton X-100. The buffer solution contained 150 mm NaCl, 50 mm Tris base, 1% BSA, 100 mm l-lysine, and 0.04% sodium azide in distilled water, pH 7.4. After the blocking step, the cells were incubated overnight at room temperature with rabbit anti-rat melanopsin (C terminus) antibodies diluted 1:10,000 in the buffer solution. The melanopsin antibodies were generously donated by R. Lane Brown (Washington State University, Pullman, WA) (Warren et al., 2006). In double-labeling experiments for melanopsin and Thy1, mouse anti-rat Thy1 (CD90) antibodies (1:1000; BD Biosciencs, San Diego, CA) were included for the overnight incubation. The following day, the cells were rinsed with PBS and incubated for 30 min in secondary antibodies (Alexa Fluor 594 goat anti-rabbit IgG and Alexa Fluor 488 goat anti-mouse IgG; Invitrogen) diluted 1:500 in the buffer solution, and then mounted in Vectashield (Vector Laboratories) on glass slides. In quantification experiments, the percentage of melanopsin-positive cells were counted on two to three coverslip pieces for a given culture. Slides were examined using a Leica (Wetzler, Germany) DMRA light microscope equipped with epifluorescence. The cells were illuminated using a dual-band filter set (catalog #51019, EGFP/dsRED; Chroma Technology, Rockingham, VT).
Reverse transcriptase-PCR.
Total RNA was extracted from melanopsin- and Thy1-panned cells using Trizol reagent (Invitrogen) according to manufacturer's instructions. After DNA digestion (RQ1 RNase-free DNase; Promega, Madison, WI), total RNA was reverse transcribed using random primers, oligo(dt)12–18 (GE Healthcare, Piscataway, NJ), and moloney murine leukemia virus reverse transcriptase (RT) (Promega).
Primers for amplification of melanopsin were 5′-GCTGTCTTTGGCATCGTTTC-3′ (sense) and 5′-AATGAGCAGAGGGAGGAAGAAG-3′ (antisense) (300 bp fragment), designed against the rat melanopsin sequence (GenBank accession number AY072689). TRPC channel primers were as follows: TRPC3, 5′-GCCCAACATCACCGTTATTG-3′ (sense) and 5′-GAAGGCAGCAATGAAGATGGAG-3′ (antisense) (211 bp fragment); TRPC6, 5′-GAAGTCACGAAGACCTTTC-3′ (sense) and 5′-TGGCTCTAACGACAGTCTC-3′ (antisense) (332 bp fragment); and TRPC7, 5′-ACCTGACAGCCAATAGCAC-3′ (sense) and 5′-TCCCAAACTTCTCGCTGAG-3′ (antisense) (240 bp fragment). GenBank accession numbers were NM_021771, NM_013838, and NM_012035 for TRPC3, C6, and C7, respectively.
For melanopsin, PCR conditions included initial denaturation at 94°C for 3 min, 35 cycles of denaturation at 94°C for 30 s, annealing at 59°C for 1 min, and extension at 72°C for 1 min, followed by final extension at 72°C for 10 min, run on a 1% gel. For TRPC, conditions included initial denaturation at 94°C for 1 min, 40 cycles of denaturation at 94°C for 30 s, annealing at 61.8°C (TRPC3) or 52.0°C (TRPC6 and C7) for 1 min, and extension at 72°C for 1 min, followed by final extension at 72°C for 10 min, run on a 1.5% gel. Cyclophilin conditions were initial denaturation at 94°C for 1 min, 26 cycles of denaturation at 94°C for 30 s, annealing at 50°C for 30 s, and extension at 72°C for 1 min, followed by final extension at 72°C for 10 min, run on a 1% gel. PCR products were visualized on agarose gel containing ethidium bromide using Edas 290 and 1D (Kodak, Rochester, NY) software and band optical density was quantified with Scion (Frederick, MD) Image software.
Calcium imaging.
After 1–3 d in culture, the coverslip-plated melanopsin-panned cells were removed from the incubator under dim red light and transferred to modified HBSS (15 mm HEPES, 2.6 mm CaCl2, Mg2+-free, pH 7.4) containing 0.1% pluronic acid F-127 and 5 μm fura-2 AM (Invitrogen) Ca2+ indicator dye for 30 min in the dark at 37°C. The fura-loaded cells were then transferred (under dim red light) to the microscope chamber (model RC-26GLP; Warner Instruments, Hamden, CT) that was constantly superfused with HBSS warmed to 33–35°C (using SF-28 inline heater; Warner Instruments) and bubbled with 100% oxygen. All tested drugs were dissolved in the HBSS and delivered to the chamber by a peristaltic pump at a rate of ∼1 ml/min. 2-aminoethoxydiphenyl borate, flufenamic acid, and thapsigargin were first dissolved in dimethyl sulfoxide (DMSO) as 1000× stock solutions, with control experiments confirming that 0.1% DMSO alone did not affect ipRGC light responses. To prevent precipitation of the lanthanides, potassium phosphate, and sodium phosphate was omitted from the HBSS used in imaging experiments testing La3+ and Gd3+.
The Ca2+ imaging methodology was similar to that in previous work on Thy1-panned RGCs (Hartwick et al., 2004). A 100 W mercury lamp and the appropriate filters (set 71000a, excitation 340 and 380 nm; emission 510 nm; Chroma Technology) were used to generate fura-2 fluorescence. A filter wheel (Empix Imaging, Cheektowaga, NY) alternated the 340 and 380 nm filters with excitation period for each wavelength set at 400 ms. Fluorescence images (12 bit) were captured with a cooled charged-coupled device camera (Sensicam; Cooke, Romulus, MI) fitted to the upright microscope (Axioskop 2 FS; Carl Zeiss, Oberkochen, Germany) using a water-immersion objective (numerical aperture, 0.80 W; Achroplan 40×; Zeiss). The images of RGC fluorescence at 340 and 380 nm excitation were calculated over a large area of the RGC soma and converted to ratiometric (340/380 nm) images by imaging software (Imaging Workbench 2.2; (Indec BioSystems, Santa Clara, CA). The background fluorescence was measured from an empty region on the coverslip and subtracted from each image.
To estimate the magnitude of the light-evoked Ca2+ responses, the fura-2 ratios (R) in some experiments were converted to [Ca2+]i using the formula [Ca2+]i = Kd (Fo/Fs)[(R − Rmin)/(Rmax − R)], with a Kd for fura-2 = 224 nm, and where Fo/Fs is the ratio of fluorescence intensity at 380 nm excitation in Ca2+-free solution over the intensity in solution with saturating Ca2+ levels (Kao, 1994). A sample (n = 9) of ipRGCs were superfused first with Ca2+-free HBSS (10 mm Mg2+, 2 mm BAPTA, 10 μm ionomycin) to determine the minimum value for the fura-2 ratio (Rmin), and then with saturating Ca2+ solution (0.9% saline with 20 mm Ca2+, 10 μm ionomycin) to determine the maximum fura-2 ratio (Rmax). Mean values for Fo/Fs, Rmin, and Rmax were calculated from these ipRGCs.
To minimize the intensity of the fura-2 excitation wavelengths (and reduce potential ipRGC stimulation), 8 × 8 pixel binned images were acquired. With this increased binning, adequate fluorescence was attained after reducing the 340 and 380 nm excitation intensities with −0.5 and −2.5 log neutral density filters, respectively. Light responses were calculated as the Δfura-2 ratio, the peak minus baseline fura-2 ratio. The baseline was calculated as the average fura-2 ratio of the three ratios acquired before light exposure, and the peak was the maximum fura-2 ratio observed in the 100 s after light offset. Light-responding cells were defined as those exhibiting a rise in the fura-2 ratio >20% from baseline.
The stimulating light consisted of broad-spectrum light from a 100 W halogen bulb that passed through the condenser underneath the microscope chamber. Before imaging, the coverslip-plated cells were dimly illuminated with this light source to locate and bring individual cells into focus. This also served as a useful selection strategy, as the dim light exposure increased [Ca2+]i in light-responding cells. For experiments involving 20 or 30 s light stimuli, fura-2 images were acquired immediately before and after (but not during) the light pulses. For 4 min light stimuli, the halogen light source was blocked every 10 s (unless otherwise indicated) to allow for the acquisition of fura-2 images. In initial experiments, light stimulation was controlled manually by uncovering and covering the light source with a black occluder, whereas in later experiments (including those using 4 min light exposures) it was remotely controlled by an electronic shutter (Uniblitz, Rochester, NY). To determine light intensity, the light stimulus was filtered through different narrow-band filters (420, 480, 540, and 600 nm) plus an infrared light cutoff filter (all filters from Edmund Optics, Barrington, NJ), and a light detector (VISD; World Precision Instruments, Sarasota, FL) was placed in the approximate plane of the microscope chamber. The standard light stimulus used was measured as 2.0 × 10¹³ photons/s/cm2 at 420 nm, 6.9 × 10¹³ photons/s/cm2 at 480 nm, 1.7 × 10¹⁴ photons/s/cm2 at 540 nm, and 3.3 × 10¹⁴ photons/s/cm2 at 600 nm.
Electrophysiology.
Patch electrodes were pulled (P-87 Flaming-Brown pipette puller; Sutter Instruments, Novato, CA) from borosilicate glass capillaries (1.65 mm outer diameter and 0.45 mm wall thickness; Garner Glass, Claremont, CA) and were fire polished to resistances of 4–5 MΩ. For perforated patch-clamp recordings (amphotericin B technique), the extracellular superfusing solution included (in mm) 130 NaCl, 2.5 KCl, 2 CaCl2, 1 MgCl2, 10 HEPES, and 10 glucose, with pH adjusted to 7.4 with NaOH, and the intrapipette solution consisted of (in mm) 80 K-gluconate, 50 KCl, 1 MgCl2, 10 HEPES, 9 NaCl, and 0.2 EGTA, pH 7.4. Amphotericin B was prepared as a stock solution in DMSO at a concentration of 60 mg/ml on each experimental day. The pipette tip was first filled with intrapipette solution and then back-filled with same internal solution plus 240 μg/ml of amphotericin B. Phase-bright neurons were identified under dim light. After tight-seal formation (>5 GΩ), the cell was maintained in the dark and the series resistance (Rs) was continuously monitored by the capacitance current generated by −5 mV voltage steps. Rs usually dropped to <20 MΩ in 15 min. Light stimulation, using broad-spectrum light from the microscope halogen light source, occurred at least 20 min after seal formation. The cells were recorded in the current-clamp configuration using a MultiClamp 700A amplifier (Molecular Devices, Sunnyvale, CA) and digitized at 10 kHz. For figure illustration, data intervals were reduced to 1 ms. Initial perforated patch-clamp recordings (see Fig. 7A) were performed using a microscope rig not equipped with an inline heater, and were therefore obtained at room temperature (∼25°C). Experiments involving concurrent Ca2+ imaging and perforated patch recordings (see Fig. 7B) were done using the microscope used for Ca2+ imaging described above, with the external solution warmed to 33–35°C.
Figure 7.

Light-induced depolarization and action potential firing in isolated ipRGCs. A, Perforated patch-clamp (current clamp mode) recording from ipRGC. Light (broad-spectrum, 2.9 × 10¹⁴ photons/s/cm2 at 480 nm) stimulated a slow depolarization (latency, 2 s; speed, 1.1 mV/s) that triggered spike firing (top trace). The initial spike is a stimulus artifact. The intrinsic electrophysiological properties of the cell (current steps, 500 ms; ranging from −60 pA to 40 pA in 6 steps) are displayed (inset). B, Concurrent perforated patch-clamp recording and Ca2+ imaging trace obtained from an isolated ipRGC stimulated by light (broad-spectrum, 6.9 × 10¹³ photons/s/cm2 at 480 nm) for 20 s. The recording in A was recorded at room temperature (∼25°C) whereas the external solution was warmed to ∼35°C for the recording in B.
For cell-attached patch recordings, the extracellular solution was HBSS (15 mm HEPES, 2.6 mm CaCl2, 2.0 mm MgCl2, pH 7.4, warmed to 33–35°C) and the pipette was filled with the same HBSS. The recordings were obtained with the acquisition software (pClamp 10; Molecular Devices) in voltage-clamp mode, although no holding potential was applied. The electrode tip was positioned above the target cell under dim light and then slowly lowered until a loose seal (100–500 MΩ) was formed. The cell was then maintained in the dark for 10–40 min, during which time the seal resistance would approach 1 GΩ. We found this approach to be much more successful than using suction to establish an immediate tight seal. Suction generally induced a rise in ipRGC [Ca2+]i. Cells that did not recover fully from this elevation in [Ca2+]i would not subsequently respond to light stimuli. By forming seals that were initially loose, using little to no suction, we found that the electrode-induced Ca2+ influx could be minimized and the cell-attached recordings of the ipRGC light responses were more successful. The cause of this Ca2+ influx is not yet known, but Leinders-Zufall et al. (1994) reported a similar phenomenon in their attempts to combine Ca2+ imaging with whole-cell patch-clamp recordings from nonphotosensitive RGCs cultured from neonatal rats.
Results
Isolation of melanopsin-expressing ipRGCs by immunopanning
It is well established that most, if not all, RGCs express the cell-surface protein Thy1 and that highly purified RGC cultures can be produced using a Thy1-antibody-mediated plate adhesion (immunopanning) technique (Barres et al., 1988; Meyer-Franke et al., 1995). Because melanopsin is membrane-bound (Provencio et al., 1998), we modified the immunopanning method and used antibodies (Hattar et al., 2002) targeting the extracellular N terminus of melanopsin to specifically isolate rare melanopsin-expressing RGCs from dissociated neonatal rat retinas. To validate this methodology, the panned cells were fixed on the first day in vitro (DIV) and processed for immunocytochemistry using antibodies (Warren et al., 2006) raised against the intracellular C terminus of melanopsin (Fig. 1A, top, red fluorescence). On average, two-thirds (range, 50–82%; n = 5 cultures) of the melanopsin-panned cells were immunoreactive for the intracellular melanopsin antigen (Fig. 1C). Omission of the melanopsin C terminus antibody resulted in no staining (Fig. 1A, middle, red fluorescence), controlling both for nonspecific fluorescence and for the possibility that the secondary antibodies were binding to residual N terminus antibodies remaining from the panning session. For comparison, melanopsin immunoreactivity was assessed on sibling cultures of Thy1-panned RGCs (Fig. 1A, bottom, red fluorescence) and a small number (0.9 ± 0.2% SEM) of these cells were melanopsin-positive (Fig. 1C). The Thy1-panning step was performed on nonadherent cells that remained after the melanopsin-panning step, indicating that not every melanopsin-expressing RGC had been captured by melanopsin immunopanning. Also, melanopsin-positive cells in both cultures were immunoreactive for Thy1 (Fig. 1A, green fluorescence), demonstrating that melanopsin-containing RGCs, like conventional RGCs, express Thy1.
Figure 1.
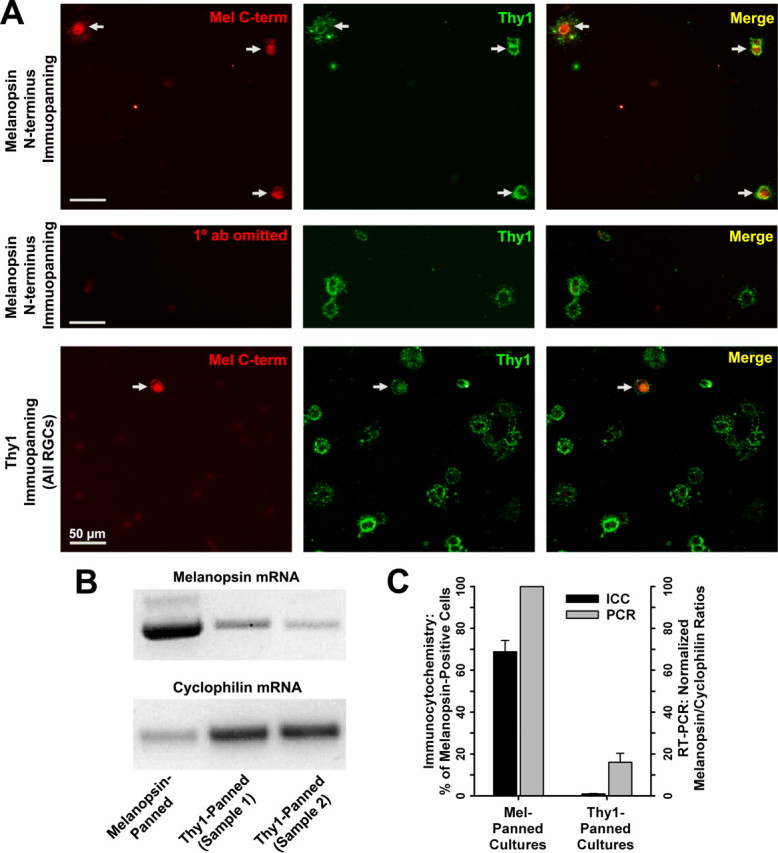
Enriched melanopsin-expressing RGC cultures. A, Top, Melanopsin-panned cells (denoted by arrows), paraformaldehyde-fixed on first day of culture, were labeled by antibodies targeting both the intracellular C terminus of melanopsin (red fluorescence) and the RGC cell-surface marker Thy1 (green fluorescence). Middle, To control for antibody specificity, melanopsin-panned cells from the same culture were processed identically except that primary melanopsin antibodies were omitted. Bottom, Thy1-panned cells obtained from the same rat litter (Thy1 panning followed melanopsin panning) and processed at the same time. Melanopsin-expressing RGCs were also present in Thy1-panned cultures (arrow) but were rare. B, RT-PCR confirmed the presence of melanopsin mRNA in both melanopsin- and Thy1-panned cultures, with increased message relative to internal control cyclophilin detected in melanopsin-panned cultures. C, Summary graph (means ± SEM) showing both the percentage of melanopsin-positive cells in melanopsin-panned and sibling Thy1-panned cultures from immunocytochemical cell counts (ICC; n = 5 cultures), and the melanopsin to cyclophilin product optical density ratios for Thy1-panned samples (n = 4) that were normalized within each PCR experiment (n = 3) to that for melanopsin-panned samples.
To corroborate the immunocytochemical analysis, the presence of melanopsin in the immunopanned cultures was also evaluated using RT-PCR. As expected from the paucity of melanopsin RGCs in the rat retina (Hattar et al., 2002), the average yield of cells isolated by melanopsin-based panning, of ∼250–2000 cells per dissociated retina, was much less than the yield of 25,000–40,000 cells per retina attained with Thy1-panning. Therefore, to obtain sufficient melanopsin-panned cell homogenate for RT-PCR, half of the cells from seven different panning sessions were pooled whereas the remainder were used for physiology experiments. “Thy1-panned” samples were prepared from cells obtained from individual panning sessions. Even with this pooling, the smaller number of cells in the “melanopsin-panned” homogenate is reflected in the reduced message for cyclophilin relative to Thy1-panned samples (Fig. 1B). Normalizing to the cyclophilin mRNA product for each sample, the message for melanopsin was higher in the melanopsin-panned cultures compared with the Thy1-panned cultures (Fig. 1B,C). Together with the immunocytochemical findings, these results indicate that the melanopsin-based panning technique generated enriched cultures of melanopsin-expressing RGCs.
The light sensitivity of the isolated melanopsin-panned RGCs was next assessed using fura-2 Ca2+ imaging. A melanopsin-panned cell, with typical bilobed morphology, that responded to consecutive light stimuli is shown in Figure 2A,B (cell 1). Fura-2 ratiometric images were acquired before and then immediately after the 20 s light stimulus. Photosensitivity was unique to the larger (soma diameter, ≥15 μm) “RGC-like” cells in the culture as light had no effect on the occasional smaller unidentified cell type (Fig. 2A,B, cell 2). These smaller cells served as negative controls, ruling out possible alterations in fura-2 dye fluorescence by the light stimulus itself. To determine the repeatability of the light-stimulated Ca2+ signals, the melanopsin-panned cells were exposed to multiple light pulses with different time intervals (5, 10, and 20 min) between consecutive pulses (Fig. 2C,D). Of tested light-responding cells, most (12 of 18 cells) continued to respond to the light stimuli regardless of the interstimulus interval. The remaining six cells exhibited negligible Ca2+ responses to light presented 5 min after the preceding pulse, with three of these recovering responsiveness after 10 min, and two more recovering after a 20 min interval. Consequently, light pulses were spaced >10 min apart in the subsequent pharmacological studies.
Figure 2.

Photosensitivity of melanopsin-panned RGCs. A, Differential interference contrast image of two cells from a melanopsin-panned culture and pseudocolored images of fura-2 fluorescence ratios for these cells before and after light stimulation. B, The full optical recording for these cells showing that the larger melanopsin-panned RGC (cell 1) exhibited an increased fura-2 ratio (indicative of increased [Ca2+]i) after each of two 20 s light pulses. The [Ca2+]i of the smaller “non-RGC-like” cell (cell 2) was unaffected by light. C, Multiple light responses could be elicited from the cultured cells (left trace), although some cells (6 of 18 cells) did not respond if the second stimulus was given 5 min after its preceding pulse (right trace; compare responses in two traces denoted by arrows). D, Data summary shows effect (mean Δfura-2 ratio ± SEM; n = 18 RGCs) of the interstimulus interval (5, 10, or 20 min) on the Ca2+ signals evoked by 30 s light pulses (normalized to each ipRGC's initial light response; dashed line). *p < 0.05, one-way repeated-measures ANOVA, Tukey's test, compared with responses elicited after 20 min intervals. E, Melanopsin-panned RGCs responded to both light and glutamate (30 s application) over the first few days in culture (recording on left from ipRGC on DIV 2), but their photosensitivity diminished with longer culture periods (recording on right from melanopsin-panned RGC on DIV 4). F, Representative melanopsin-panned RGCs on DIV 7 that were immunoreactive for Thy1 (green; bottom row) but not melanopsin (red; top row). These cells were from the same culture as the DIV 1 melanopsin-panned RGCs depicted in Figure 1A (top row; note that Thy1-positive cells also melanopsin-positive), indicating that melanopsin protein expression had decreased.
Although ipRGCs can directly respond to light stimulation, these photoreceptors also receive synaptic input from bipolar and amacrine cells within the retina (Belenky et al., 2003). The excitatory input is mediated by the neurotransmitter glutamate (Perez-Leon et al., 2006; Wong et al., 2007) and there is single-cell PCR data indicating that melanopsin-containing RGCs express NMDA-, kainate-, and AMPA-type glutamate receptor subunits (Jakobs et al., 2007). We confirmed the existence of functional glutamate receptors on ipRGCs as every light-responding cell that was challenged with glutamate (n = 24; 30 s application of 10–100 μm glutamate) exhibited a Ca2+ response (Fig. 2E) similar to that previously reported for cultured RGCs (Hartwick et al., 2004, 2005).
Although light-evoked Ca2+ responses could be elicited from most of the isolated cells on the first day after panning (DIV 1), the proportion of cells retaining their photosensitivity decreased with each additional day in culture. This conclusion was based on the qualitative observation that it was harder to find light-responding cells using the pre-experiment selection method (see Materials and Methods). We have recorded definitive light responses in cells up to DIV 5, but responding ipRGCs were rare in cultures maintained for four or more days. This loss of photosensitivity was not likely caused by reduced viability, as the large melanopsin-panned cells of this in vitro age still responded to glutamate (Fig. 2E). Immunocytochemistry conducted on melanopsin-panned cells after 5–7 DIV (n = 3 cultures) revealed large cells that were Thy1-positive but melanopsin-negative (Fig. 2F). Because the Thy-1-positive cells present in the melanopsin-panned cultures were also melanopsin-immunoreactive on the first day of culture (Fig. 1A), the most probable explanation for this finding is that there is a reduction in melanopsin protein expression as the cells are cultured for longer periods. For this reason, all experiments presented in this work were performed on melanopsin-panned cells during the first 3 d of culture.
Nature of light-evoked ipRGC Ca2+ responses
A number of compounds recognized as nonselective TRPC channel blockers reduce the light-driven depolarization (Warren et al., 2006) and Ca2+ responses (Sekaran et al., 2007) of ipRGCs in whole-retina preparations dissected from rats and mice, respectively. We therefore sought to determine whether the light-evoked Ca2+ signals elicited in the dissociated rat ipRGCs displayed a similar pharmacological profile.
The light-induced Ca2+ responses of the isolated ipRGCs were reversibly reduced by 2-aminoethoxydiphenyl borate (2-APB), 1–2-(4-methoxyphenyl)-2-[3-(4-methoxyphenyl)propoxy]ethyl-1H-imidazole (SKF-96365), and flufenamic acid (Fig. 3A,C), known blockers of many TRPC channels (Ramsey et al., 2006). The abrupt change in the fura-2 ratio after the addition and washout of flufenamic acid was caused by its quenching effect on the 340 nm excitation light. Using a spectrophotometer (path length, 1 cm), HBSS containing 100 μm flufenamic acid was shown to exhibit an absorbance at 340 nm that was 5.8 times that of HBSS alone. Because the flufenamic acid solution did not absorb appreciably at 380 nm (absorbance 1.1 times that of HBSS), the data for this compound were analyzed nonratiometrically using only the 380 nm excitation data (Fig. 3C). The flufenamic acid inhibition is consistent with TRPC3 or TRPC7, but not TRPC6 channels, as candidates, because this drug blocks TRPC3 and TRPC7 yet enhances TRPC6 activity (Inoue et al., 2001).
Figure 3.

Evidence for TRPC channel involvement in ipRGC phototransduction. A, Light-evoked Ca2+ signals were reversibly blocked by the TRPC blockers 2-APB, flufenamic acid (FFA), and SKF-96365 (SKF). The decrease in the baseline fura-2 ratio by FFA is attributable to its quenching effect on 340 nm excitation, and the data for this compound were analyzed nonratiometrically. B, Fura-2 ratio trace from a cultured ipRGC in which Gd3+ inhibited the light response. hν indicates 20 s pulse of broad-spectrum light, 6.9 × 10¹³ photons/s/cm2 at 480 nm. C, Summary (means ± SEM, normalized to each ipRGC's pretreatment response) showing effects of 2-APB, SKF, FFA, La3+, and Gd3+ on light-evoked Ca2+ influx. Except for the cell depicted in A, one drug was assessed per cell. *p < 0.05; **p < 0.01, one-way repeated-measures ANOVA, Tukey's test, compared with initial responses. All responses in the presence of drugs were also significantly reduced (p < 0.05) compared with recovery (drug washout) responses, except for 100 μm Gd3+. D, RT-PCR for TRPC3, TRPC6, and TRPC7 mRNA in samples prepared from melanopsin- and Thy-1-panned cells. The TRPC7-to-cyclophilin ratio was elevated in the melanopsin-panned sample.
Lanthanum (La3+) and gadolinium (Gd3+) inhibit TRPC3 (Halaszovich et al., 2000), TRPC6 (Inoue et al., 2001) and TRPC7 channels (Riccio et al., 2002). Their action on TRPC4 and TRPC5 channels is more complex; at micromolar levels, La3+ and Gd3+ enhance current flow through TRPC4 or TRPC5 whereas higher (millimolar) concentrations inhibit these two channels (Schaefer et al., 2000; Jung et al., 2003). Application of either La3+ and Gd3+, at either 10 or 100 μm, abolished the light-stimulated Ca2+ influx in cultured ipRGCs (Fig. 3B,C), suggesting that TRPC4/5 channels were not involved. The reduced light-induced responses after treatment with Gd3+ and 100 μm La3+ was likely the result of a slower wash out of these trivalent cations.
We used RT-PCR to determine whether the isolated cells in the melanopsin-panned cultures expressed mRNA for TRPC3, TRPC6 or TRPC7 channels (Fig. 3D). For comparison, RT-PCR was also performed on homogenate from conventional Thy1-panned RGC cultures. In two experiments, the TRPC-to-cyclophilin ratios for TRPC3 and TRPC6 were similar for both melanopsin- and Thy1-panned samples. As a semiquantitative analysis, the ratio for TRPC3 in the melanopsin-panned sample was 1.1 and 1.3 times that obtained for the Thy1-panned sample. Similarly, the ratio for TRPC6-to-cyclophilin in the melanopsin-panned sample was 0.9 and 1.1 times that obtained for the Thy1-panned sample. In contrast, TRPC7 was preferentially expressed in melanopsin-panned cultures, as its ratio was 2.8 and 5.7 times higher than that obtained for the Thy1-panned sample.
Both the RT-PCR results and the pharmacology of the light-evoked Ca2+ responses were consistent with the involvement of a TRPC channel, particularly TRPC7, in ipRGC phototransduction. However, rather than direct flux through a putative TRP channel, the source of the light-induced Ca2+ signal could instead be the result of Ca2+ release from intracellular stores, the activation of VGCCs, or a combination of these different mechanisms. Although the source of the Ca2+ signal was unknown in native ipRGCs, this issue has been investigated in human embryonic kidney (HEK) cells in which photosensitivity was conferred through melanopsin transfection (Kumbalasiri et al., 2007). In this heterologous expression system, the light-stimulated rise in [Ca2+]i was shown to be entirely attributable to Ca2+ release from intracellular stores because (1) removal of extracellular Ca2+ did not alter the Ca2+ responses, (2) application of the stores depleting agent thapsigargin blocked the responses, and, in contrast to our work (Fig. 3C) and that of others that have assessed the effect of La3+ on ipRGC light responses (Warren et al., 2006; Sekaran et al., 2007), (3) the cation channel blocker La3+ was without significant effect (Kumbalasiri et al., 2007).
In an attempt to define the overall contribution of Ca2+ influx from the extracellular milieu, we first assessed whether Ca2+ responses could still be elicited from isolated ipRGCs bathed in Ca2+-free external solution containing the Ca2+ chelator BAPTA. With extracellular Ca2+ absent, the Ca2+ responses were completely abolished (Fig. 4A), as the mean change in the fura-2 ratio (n = 14 ipRGCs) during light stimulation was only 1 ± 1% SEM (p < 0.01, one-way repeated-measures ANOVA, Tukey's test) of that first elicited from the ipRGCs during superfusion with Ca2+-containing HBSS. The light-evoked Ca2+ responses were recoverable after the cells' return to control HBSS (recovery responses were 90 ± 18% SEM that of the initial responses). However, perfusing the cells with the Ca2+-free solution induced an unexpected abrupt rise in [Ca2+]i before the expected decrease in [Ca2+]i occurred (Fig. 4A). With the replenishment of external Ca2+ to the chamber, there was another transient rise of [Ca2+]i that was reminiscent of store-operated Ca2+ entry, known to occur in many other cell types, in which stores depletion leads to the activation of plasma membrane Ca2+ channels to facilitate stores refilling (Lewis, 2007). Furthermore, application of 10 mm caffeine, a stimulator of Ca2+ release from endoplasmic reticulum (ER) Ca2+ stores (Verkhratsky, 2005), did not affect [Ca2+]i in cells that had been switched to the Ca2+-free solution (Fig. 4B) (representative of n = 3 ipRGCs), indicating that the internal stores had been depleted under these conditions. Thus, removal of external Ca2+ caused ipRGC internal stores to empty, and we could therefore not use this protocol to definitively distinguish between intracellular and extracellular sources for the light-evoked Ca2+ responses.
Figure 4.

ipRGC Ca2+ responses are not attributable to Ca2+ release from intracellular stores. A, ipRGC light responses were abolished in Ca2+-free external solution. However, note the rise in [Ca2+]i after exposure to Ca2+-free HBSS (with 2 mm BAPTA) and after the return to regular Ca2+-containing HBSS. B, Caffeine had no effect on [Ca2+]i in ipRGCs maintained in Ca2+-free HBSS, indicating that Ca2+ stores had been emptied after exposure to zero external Ca2+. C, D, The Ca2+ stores depleting agent thapsigargin did not inhibit light-evoked [Ca2+]i elevations (C), and ipRGC light responses persisted after emptying of stores by caffeine and thapsigargin (D). For all traces, hν indicates 20 s pulse of broad-spectrum light, 6.9 × 10¹³ photons/s/cm2 at 480 nm.
We next investigated the effect of thapsigargin, a compound that does not affect Ca2+ stores release directly but serves to gradually deplete Ca2+ stores by irreversibly inhibiting ER Ca2+ reuptake (Treiman et al., 1998). Thapsigargin itself did not alter ipRGC [Ca2+]i, consistent with a previous report that assessed this compound on [Ca2+]i of isolated nonphotosensitive rat RGCs (Leinders-Zufall et al., 1994), signifying that there is minimal Ca2+ leak from ipRGC ER stores under basal conditions (Fig. 4C). In ipRGCs (n = 11) treated with thapsigargin (1 μm; 5–30 min), there was no reduction (p > 0.05, one-way repeated-measures ANOVA, Tukey's test) in the Ca2+ responses either during treatment (response magnitude was 104 ± 19% SEM of that elicited before treatment) or after washout (131 ± 27% SEM, relative to pretreatment responses) as would be expected if the stores had been emptying without the capacity to refill (Fig. 4C). In addition, light-evoked Ca2+ responses persisted in thapsigargin-treated ipRGCs that were exposed to caffeine (Fig. 4D) (representative of n = 3 ipRGCs tested) to deplete stores more quickly. These results indicate that there was no significant contribution from internal Ca2+ stores to the light-stimulated Ca2+ responses of the isolated rat ipRGCs.
The lack of effect for thapsigargin on ipRGC Ca2+ dynamics differ from those (described above) reported by Kumbalasiri et al. (2007) using HEK cells transfected with melanopsin, suggesting that the mechanisms underlying phototransduction in heterologous systems may be different from that in native ipRGCs. Among the differences between HEK cells and ipRGCs is that the latter are excitable neurons. The depolarization associated with neuronal firing is known to activate VGCCs in neurons throughout the CNS, and so we subsequently probed the contribution of VGCCs to the light-induced rise in [Ca2+]i. Specifically, pharmacological agents targeting L-type (CaV1) and N-type (CaV2.2) VGCCs were assessed because these VGCC types have been shown to carry the majority of the Ca2+ current in conventional rat RGCs (Karschin and Lipton, 1989; Schmid and Guenther, 1999). L-type VGCCs can be pharmacologically inhibited by phenylalkylamines such as verapamil, benzothiazepines like diltiazem, and dihydropyridines including nifedipine (Catterall et al., 2005). In preliminary experiments with nifedipine, we found that this yellowish compound absorbs asymmetrically at both the 340 and 380 nm excitation wavelengths. The differential quenching action of this compound on the two excitation wavelengths made it difficult to definitively separate true inhibition from artifact and, thus, verapamil and (+)-cis-diltiazem (these compounds did not alter fura-2 fluorescence) were used instead. Verapamil and diltiazem both significantly reduced (mean reduction of 79 and 71%, respectively) the light-induced Ca2+ responses, and these effects were reversible with drug wash out (Fig. 5A,B,E). With the N-type VGCC blocker ω-conotoxin GVIA present, Ca2+ responses were slightly reduced, on average, relative to the pretreatment responses (Fig. 5C,E), but this effect was not statistically significant (p = 0.40; one-way repeated-measures ANOVA). Finally, to investigate a potential link between VGCC activation and action potential firing, we tested the effect of tetrodotoxin (TTX) which prevents action potential generation by blocking voltage-gated Na+ channels. In the presence of TTX, the Ca2+ responses were reduced by 88 ± 2% SEM (Fig. 5D,E), indicating that opening of the L-type VGCCs was mostly caused by the membrane depolarizations associated with action potential firing.
Figure 5.

Primary source for the light-evoked Ca2+ signal is influx through L-type VGCCs. A, B, The L-type VGCC blockers verapamil (A) and (+)-cis-diltiazem inhibited the ipRGC Ca2+ responses (B). C, The N-type VGCC blocker ω-conotoxin GVIA was without significant effect. D, Blockade of action potential firing with TTX also reversibly attenuated light-induced Ca2+ responses. For all traces, hν indicates 20 s pulse of broad-spectrum light, 6.9 × 10¹³ photons/s/cm2 at 480 nm. E, Data summary (means ± SEM, normalized to pretreatment responses). **p < 0.01, one-way repeated-measures ANOVA, Tukey's test, compared with initial and recovery responses.
ipRGC Ca2+ dynamics during prolonged light stimuli
The preceding data showed that most of the [Ca2+]i elevation caused by a 20 s pulse of bright broad-spectrum light was the result of Ca2+ influx that occurred after action potential firing. We hypothesized that with a longer light pulse, we might unmask a more robust TTX-insensitive Ca2+ signal directly attributable to the channel mediating the initial depolarizing current (before cell spiking). The light exposure, of the same intensity as the 20 s pulse experiments, was increased to 4 min and fura-2 fluorescence images were captured every 10 s. Instead of sustaining a stable [Ca2+]i throughout the 4 min light stimulus, the typical ipRGC showed a rise in [Ca2+]i that peaked during the initial 20 s and then decayed to near baseline levels (Fig. 6A, black trace). In a minority of cells, a second increase in [Ca2+]i, followed by another decay to baseline, was observed during the 4 min (Fig. 6A, gray trace). Figure 6B shows the mean data for 26 ipRGCs, for which the Ca2+ response at the 24 time points was normalized to each cell's peak response. The peak Ca2+ response occurred at the 10 s time point in 12 of the 26 ipRGCs, and at 20 s after light onset in 10 of the remaining 14 cells. The small increase in the mean data around the 3 min time point (Fig. 6B) was attributable to the fact that 5 of the 26 ipRGCs displayed a second rise in the fura-2 ratio (> 50% of the peak response) around this time. The two response patterns illustrated in Figure 6A likely do not represent distinct ipRGC subtypes, as both kinds of responses were sometimes elicited from individual cells (Fig. 6C, compare response 6 to responses 1 and 3).
Figure 6.

Ca2+ responses of ipRGCs exposed to light for 4 min. A, Recordings from two adjacent ipRGCs, exposed to the same light stimulus, exhibiting two distinct response patterns. For all traces (except second response in [C]) hν indicates broad-spectrum light, 6.9 × 10¹³ photons/s/cm2 at 480 nm. B, Data summary (mean ± 1 SD; n = 26) illustrating the average decay in Ca2+ responses during 4 min light stimuli. The light was turned on after the first image (0 s) and subsequent images were acquired every 10 s. The baseline-subtracted response (Δfura-2 ratio) at all time points was normalized to the each cell's peak response. C, Recording from an ipRGC exposed 6 times to 4 min light stimuli. During responses 1, 2, 3, and 6, fura-2 images were acquired every 10 s. For response 2, the standard stimulus intensity was reduced with a −1.5 log neutral density filter. During responses 4 and 5, fura-2 images were acquired every 40 and 80 s, respectively. The traces at far right represent response 3 replotted using the fura-2 ratios obtained every 40 or 80 s rather than 10 s. D, E, Example trace (D) and data summary (means ± SEM, normalized to pretreatment responses) showing effect of TTX alone and in combination with 2-APB on Ca2+ responses to the 4 min light stimuli (E). TTX was tested in 8 ipRGCs, with 2-APB plus TTX subsequently tested in five of the eight cells. **p < 0.01, one-way repeated-measures ANOVA, Tukey's test, compared with initial responses.
To perform fura-2 Ca2+ imaging during the 4 min light responses, it was necessary to periodically block off the halogen light stimulus to capture fura-2 images. Thus, at each 10 s interval, the broad-spectrum light was off for ∼1 s for fura-2 image acquisition. To test whether this on–off feature of the light stimulus was the cause for the response decay, we determined whether collecting fura-2 images every 40 or 80 s changed the characteristic pattern of the isolated ipRGC Ca2+ responses. As shown in Figure 6C, the interval between fura-2 images did not influence the responses. By imaging every 40 s (response 4) or 80 s (response 5), the large rise in the fura-2 ratio during the first 20 s of light onset (see responses 1, 3, 6) was missed but a similar pattern of response decay was observed as when a 10 s imaging strategy was used. Replotting a response that was obtained with 10 s interval imaging (response 3) using every fourth (40 s) or eighth (80 s) data point yielded traces (Fig. 6C, two traces at far right) that were indistinguishable from those obtained with actual 40 s (response 4) or 80 s (response 5) imaging intervals. A decay in the Ca2+ response was also observed when the light stimulus was reduced with a −1.5-log neutral density filter, although this stimulus resulted in a smaller peak Ca2+ response (Fig. 6C, response 2).
Using a 4 min light stimulus and imaging every 10 s, the vast majority of the response was still blocked by TTX (peak response reduced by 90.3 ± 2.5% SEM; n = 8 ipRGCs) (Fig. 6D,E). In five of these eight cells, the effect of a mixture containing both TTX and the TRPC channel blocker 2-APB was also assessed. Relative to the initial pretreatment response, TTX and 2-APB together abolished the light responses (peak response reduced by 99.2 ± 0.4% SEM) (Fig. 6E). In all five cells, the Ca2+ responses were further reduced by the TTX plus 2-APB mixture, compared with the responses obtained in the presence of TTX alone. Although these results suggest that Ca2+ flux through TRPC channels may contribute a small (∼10%) amount to light-evoked changes in somal Ca2+ levels, these data corroborate those obtained using 20 s light pulses (Fig. 5D,E) signifying that most (∼90%) of the light-stimulated rise in ipRGC somal [Ca2+]i occurs after action potential firing.
To estimate the magnitude of the light-induced [Ca2+]i elevations, the minimum and maximum fura-2 ratios were determined by exposing a separate group of ipRGCs (n = 9) to Ca2+-free and Ca2+-saturating conditions (see Materials and Methods). Calibration of the ratiometric data used to generate the normalized responses shown in Figure 6B (n = 26 ipRGCs) showed that the mean peak [Ca2+]i reached during the 4 min light exposures was 517 nm (±65 SEM), which was an increase of 435 nm from the mean baseline [Ca2+]i of 82 nm (±5 SEM). A similar conversion of the data in Figure 6E indicated that the rise (peak minus baseline) in [Ca2+]i that occurred with TTX present (n = 8 ipRGCs) was 39 nm (±8 SEM), whereas with TTX plus 2-APB present (n = 5) the change in [Ca2+]i was only 4 nm (±3 SEM).
Concurrent Ca2+ imaging and cell-attached electrophysiological recordings of isolated ipRGC light responses
With the pharmacological data supporting a link between ipRGC Ca2+ responses and action potential firing, we next investigated the relationship between ipRGC firing frequency and somatic [Ca2+]i directly. As a related question, we sought to determine whether the Ca2+ response decay commonly observed during a 4 min light stimulus was caused by a decrease in cell firing during the light response. Alternatively, the decay could be unique to the Ca2+ response if, for example, the cause was VGCC desensitization. To address these issues, we combined Ca2+ imaging with patch-clamp electrophysiology, obtaining concurrent recordings of light responses from the isolated ipRGCs using both techniques.
Perforated patch-clamp recordings, performed alone (Fig. 7) and in conjunction with Ca2+ imaging (Fig. 7B), confirmed that isolated ipRGCs depolarized and fired action potentials in response to light exposure. To best probe the relationship between spike firing frequency and the magnitude of the Ca2+ responses, however, we used cell-attached patch recordings. The advantage of recording in cell-attached mode, relative to whole-cell or perforated patch-clamp configurations, is that it enabled an assessment of spike frequency in ipRGCs with intact membranes. Thus, it minimized the potential for the Ca2+ responses to be altered by cell dialysis.
The Ca2+ imaging data and the associated cell spiking activity of an ipRGC responding to a 4 min light stimulus, with fura-2 images acquired every 10 s, is shown in Figure 8A. The peak fura-2 ratio (peak ratio, 1.92; baseline ratio, 0.72) occurred at 20 s after light onset. There were 102 spikes recorded in the 10 s interval before this peak Ca2+ response, and this was also the peak spike frequency recorded in the 24 different 10 s intervals during the 4 min light stimulus. Figure 8B shows an expanded view of the same cell-attached recording depicted in Figure 8A. The time points denoted by numbers 1–4 on the spike activity recording correspond to the time points denoted by matching numbers on the fura-2 optical trace. Note that as spike frequency increases (between points 1 and 2), there is a corresponding rise in the fura-2 ratio. Conversely, as spike frequency decreases (between points 3 and 4), ipRGC [Ca2+]i also falls. Plotting each of the 25 fura-2 ratios (24 ratios acquired during the 4 min light stimulation, plus 1 baseline ratio) for this cell against the number of spikes in the 10 s interval preceding each ratio (Fig. 8C) revealed a highly linear relationship between the magnitude of the Ca2+ response and the cell spiking rate (r2 = 0.93).
Figure 8.

Light-stimulated Ca2+ responses are highly correlated to action potential firing frequency. A, Concurrent Ca2+ imaging trace and cell-attached patch recording for ipRGC stimulated with light (broad-spectrum, 6.9 × 10¹³ photons/s/cm2 at 480 nm) for 4 min. Fura-2 images were acquired immediately before and then every 10 s during light stimulation. B, Expanded view of the same cell-attached recording shown in A. The fura-2 ratios numbered 1–4 in A were acquired at the time points denoted by matching numbers on the cell-attached recording (B). C, Relationship of fura-2 ratios to the number of spikes in 10 s interval preceding each ratio during the 4 min light exposure for the cell depicted in A and B. D, Plot of same relationship as in (C) using data from nine light-stimulated ipRGCs. Within-cell coefficients of determination (r2) for each of the nine cells are shown in inset box.
Using this experimental paradigm, dual Ca2+ imaging and cell-attached recordings of light responses were obtained from 8 additional ipRGCs. The linear relationship between the fura-2 ratio and the number of spikes in the 10 s interval that preceded each ratio was highly significant (p < 0.001 for each of the nine cells; ANOVA), with values for the coefficient of determination (r2) that ranged between 0.66 and 0.93 (Fig. 8D, inset). The mean r2 was 0.8, indicating that 80% of the variability in the fura-2 ratio over the 4 min light stimulus could, on average, be explained by the cell's spike frequency (based on 10 s bins of spike activity). In addition to the within-cell analyses, a significant linear relationship (p < 0.001, ANOVA; r2 = 0.76) between the Ca2+ imaging data and the cell-attached recordings also existed when the 225 data points from all 9 cells were pooled together (Fig. 8D). Therefore, these data show that, in general, the ipRGCs displaying the largest light-evoked Ca2+ responses were also the cells that fired the most action potentials during the light stimulus.
Discussion
As a novel approach to the study of ipRGCs, we isolated these neurons from dissociated neonatal rat retinas into enriched cultures using melanopsin antibody-based immunopanning. Using this methodology, we provide the first recordings of ipRGC light responses using both Ca2+ imaging and patch-clamp techniques and demonstrate a direct link between [Ca2+]i and action potential firing.
Source of light-induced rise in ipRGC [Ca2+]i
Three possibilities were considered for how increased [Ca2+]i and spike firing might be interconnected within the ipRGC phototransduction cascade. First, these two response types could represent the culmination of two divergent pathways. This is the case for HEK cells that have been converted into photoreceptors by melanopsin transfection. In this heterologous system, TRPC3 channel overexpression was required for light-evoked membrane depolarization (Qiu et al., 2005), but light stimulated Ca2+ release from intracellular stores regardless of TRPC3 expression (Kumbalasiri et al., 2007). Second, ipRGC Ca2+ responses could precede action potential firing, as might be expected if Ca2+-permeable channels, including TRPC channels, mediate the initial depolarizing current. Finally, ipRGC Ca2+ responses may be a consequence of action potential firing and attributable to the depolarization-induced opening of VGCCs. Consistent with the latter two hypotheses, a previous study using isolated retinas from retinal degenerate mice reported an inhibitory effect for cadmium (blocker of VGCCs and many TRP channels) on ipRGC Ca2+ responses (Sekaran et al., 2003).
Of these three scenarios, our data support the last one as the predominant pathway by which light increases [Ca2+]i in rat ipRGCs. Most (∼90%) of the light-stimulated rise in [Ca2+]i could be inhibited by blocking action potentials with TTX, and concurrent Ca2+ imaging and cell-attached patch recordings demonstrated a high correlation between light-induced spiking frequency and somatic [Ca2+]i. Furthermore, ipRGC Ca2+ responses were inhibited by the L-type VGCC blockers verapamil and diltiazem, but were unaffected by the internal Ca2+ stores depleting agent thapsigargin. Together, these results strongly support Ca2+ influx through L-type VGCCs as the primary source underlying light-evoked elevations in somatic [Ca2+]i, and indicate that VGCC activation follows action potential firing. The pathways underlying light-evoked Ca2+ influx in ipRGCs and their temporal relationship within the melanopsin phototransduction cascade is summarized in Figure 9.
Figure 9.

Schematic overview of light-evoked Ca2+ influx in mammalian ipRGCs. After light stimulation of melanopsin photopigment in the plasma membrane, a signaling cascade is initiated that leads to the opening of the light-gated ion channel (labeled 1). This cascade remains almost completely unknown, although there is evidence that it is G-protein dependent (Warren et al., 2006) and that protein kinase C ζ is involved (Peirson et al., 2007). The data presented in this work and that of others (Warren et al., 2006; Sekaran et al., 2007) supports the hypothesis that a TRPC channel is the light-gated ion channel, with our data supporting TRPC7 as a prime candidate. The ion flux through this 2-APB-sensitive channel depolarizes (denoted with a lightning bolt in the membrane) the membrane potential, resulting in the activation of voltage-gated Na+ channels (VGNCs; labeled 2). The Na+ flux through TTX-sensitive VGNCs during action potential firing further depolarizes the membrane, leading to the activation of verapamil-sensitive L-type VGCCs (labeled 3). The relative timing for the opening of these three channel types is illustrated in the boxed drawing that depicts the changes in membrane voltage induced by light exposure in a typical ipRGC. Although our work indicates that Ca2+ influx through the initial light-gated ion channel contributes to increased somatic [Ca2+]i during light stimulation, most of the Ca2+ signal was the result of the depolarization-induced opening of VGCCs. The presence of a membrane-associated microdomain that prevents some of the Ca2+ flux through the light-gated channel from reaching the somatic cytoplasm is also possible. Experiments involving the stores depleting agent thapsigargin indicated that contribution of intracellular Ca2+ stores to light-evoked elevations in ipRGC [Ca2+]i was negligible.
Role for TRPC channels?
TRP channels mediate the light-gated current in Drosophila, and there has been considerable speculation that these channels are also involved in mammalian ipRGC phototransduction. To determine whether a member of the TRPC channel subfamily was an appropriate candidate, we tested a number of known TRPC channel blockers and found that 2-APB, SKF-96365, flufenamic acid, La3+, and Gd3+ all significantly inhibited the light-induced Ca2+ responses of the isolated ipRGCs. These results are, for the most part, similar to the findings of two previous reports in which various TRPC channel blockers reduced ipRGC light responses in whole-retina preparations from adult rats (patch-clamp recordings) (Warren et al., 2006) and neonatal mice (Ca2+ imaging) (Sekaran et al., 2007). Unfortunately, pharmacology alone cannot conclusively identify a TRPC channel, as known blockers are nonselective and inhibit a myriad of cation channels. Narrowing our search to TRPC3, TRPC6, and TRPC7, we detected message for each of these channels in the melanopsin-panned cultures. These data bolster previous immunocytochemical evidence localizing TRPC6 and TRPC7 to melanopsin-expressing RGCs (Warren et al., 2006; Sekaran et al., 2007). It also suggests that, like many neurons, ipRGCs likely contain multiple TRP channel subunits, raising the possibility that the light-gated channel is heteromeric. Interestingly, our PCR data showed a preferential expression of TRPC7 in melanopsin-panned cultures relative to Thy1-panned RGC cultures. Although definitive identification of the ipRGC light-gated channel will probably require genetic approaches, our pharmacological and PCR data endorse TRPC channels, especially TRPC7, as prime candidates.
Because VGCCs are present in conventional RGCs, it is perhaps not unexpected that VGCC-mediated Ca2+ influx also occurs in the more rare ipRGCs. However, it was surprising that, after action potential blockade, the remaining Ca2+ responses were so minimal. Our results support an additive effect for 2-APB with TTX, consistent with TRPC channel involvement, but the light-induced Ca2+ signal that was elicited with TTX present approached signal-to-noise limitations. One possibility for this finding is that the light-gated channel may be more permeable to Na+ relative to Ca2+. Previous data argues against this because removal of extracellular Na+ does not significantly alter light-stimulated currents in voltage-clamped rat ipRGCs (Warren et al., 2003). Another plausible hypothesis is that most of the Ca2+ passing through the light-gated channel may not reach the ipRGC soma. For example, Drosophila TRP channels are closely associated with scaffolding and other proteins in a structure termed a “signalplex,” and there is accumulating evidence that mammalian TRPC channels form similar membrane-bound complexes (Ambudkar et al., 2006). These complexes provide Ca2+ signaling microdomains that are spatially segregated from the somatic cytoplasm, allowing more precise regulation of Ca2+-dependent processes within the microdomain. If a similar TRPC signalplex exists in ipRGCs, Ca2+ influx through these channels may not have the same access to the soma as VGCC-mediated Ca2+ entry. Finally, it should be noted that the membrane depolarization induced by the initial Ca2+ influx could also be amplified through the activation of Ca2+-activated chloride currents. In other sensory neurons, such as those involved in olfactory transduction, Ca2+-activated chloride efflux is a major component of the depolarizing current (Lowe and Gold, 1993).
Photoresponses of melanopsin-immunopanned RGCs
The present study establishes the feasibility of using an immunopanning approach to generate enriched cultures of melanopsin-expressing ipRGCs. Like conventional RGCs, melanopsin-panned ipRGCs expressed Thy1 and responded to glutamate stimulation. As illustrated throughout this work, multiple and repeatable light responses could be elicited from the isolated ipRGCs over the first few days of culture. However, in cultures maintained for longer periods, a reduction in melanopsin expression and an accompanying loss of photosensitivity was apparent. The reason is not yet known, but there is evidence from rat models of rod/cone degeneration that melanopsin transcription is dependent on the presence of these classical photoreceptors (Sakamoto et al., 2004; Wan et al., 2006) (but see Semo et al., 2003). Immunopanned ipRGCs should therefore provide an in vitro system in which to test whether certain retinal- or SCN-derived factors are involved in regulating melanopsin expression.
In some ipRGCs, light responses were reduced if consecutive light pulses were spaced too closely together. Also, Ca2+ responses exhibited a characteristic decay during prolonged 4 min light stimuli. On the surface, these findings are puzzling given that, in vivo, these neurons provide the photic information that synchronizes SCN-driven circadian rhythms to the external day/night environment. The observed response decay was not caused by VGCC desensitization, or another process unique to the Ca2+ signal, as indicated by the linear correlation between [Ca2+]i and spiking frequency throughout the 4 min light stimuli. One possibility is that the response decay was caused by chromophore depletion (bleaching). Because photoresponsiveness was recoverable, a corollary to this hypothesis is that ipRGCs can regenerate bleached chromophore back to light-sensitive conformations. Chromophore regeneration occurs in invertebrate photoreceptors and there is indirect evidence that this process exists in mammalian ipRGCs (Doyle et al., 2006; Tu et al., 2006). However, rather than chromophore bleaching, the pattern of response decay may instead reflect an active adaptation to the constant-intensity light stimulus. In support, patch-clamp recordings of rat ipRGCs in intact retinas indicate that these photoreceptors do exhibit both light and dark adaptation (Wong et al., 2005).
Ca2+ is a key intracellular messenger that, among its many functions, modulates neuronal output by regulating the activation of potassium channels (Sah and Faber, 2002). In considering other potential functions associated with VGCC-mediated Ca2+ influx, a role in ipRGC adaptation might be expected as Ca2+ provides the feedback that initiates adaptation mechanisms in vertebrate rods/cones (Krizaj and Copenhagen, 2002) and Drosophila photoreceptors (Gu et al., 2005). In addition, Ca2+ influx via L-type VGCCs contributes to neuronal plasticity in many CNS neurons by coupling excitation to the activation of genes such as c-fos (Murphy et al., 1991; Thompson et al., 1995). Light-induced Fos protein expression has been observed in melanopsin RGCs in mice lacking rods and cones (Semo et al., 2003), and so the light-evoked alterations in [Ca2+]i could regulate ipRGC gene expression in response to cell activity.
A major advantage of melanopsin-based immunopanning is that it enables the study of solitary ipRGCs. In addition to their intrinsic photosensitivity, melanopsin-expressing RGCs receive synaptic input from retinal bipolar and amacrine cells (Belenky et al., 2003; Dacey et al., 2005; Perez-Leon et al., 2006; Ostergaard et al., 2007; Viney et al., 2007; Wong et al., 2007), and may be electrically coupled to other inner retinal neurons via gap junctions (Sekaran et al., 2003). Isolating ipRGCs into enriched cultures therefore eliminates all extrinsic modulatory influences on the intrinsic light responses that occur in the intact retina, and negates the need for pharmacological blockade of synaptic activity. Much of the ipRGC phototransduction cascade remains unknown (Fig. 9), and enriched cultures of immunopanned ipRGCs should serve as a useful preparation for future physiological, molecular and biochemical characterizations of melanopsin-related signaling pathways.
Footnotes
This work was supported by National Institutes of Health Grants MH062296, EY017809 (G.E.P., P.J.S.), and MH070922 (C.N.A.), Canadian Institutes of Health Research (CIHR) Grant MOP-15683, and Group grant in the Retina (W.H.B.). A.T.E.H. was supported by a CIHR postdoctoral fellowship and J.Y. was supported by a Nova Scotia Health Research Foundation studentship. Pilot studies were performed by A.T.E.H. during a summer fellowship, supported by the Grass Foundation at the Marine Biological Laboratory in Woods Hole, MA. We thank Connie King and Anne Simpson for assistance with animal care.
References
- Ambudkar IS, Bandyopadhyay BC, Liu X, Lockwich TP, Paria B, Ong HL. Functional organization of TRPC-Ca2+ channels and regulation of calcium microdomains. Cell Calcium. 2006;40:495–504. doi: 10.1016/j.ceca.2006.08.011. [DOI] [PubMed] [Google Scholar]
- Barres BA, Silverstein BE, Corey DP, Chun LL. Immunological, morphological, and electrophysiological variation among retinal ganglion cells purified by panning. Neuron. 1988;1:791–803. doi: 10.1016/0896-6273(88)90127-4. [DOI] [PubMed] [Google Scholar]
- Belenky MA, Smeraski CA, Provencio I, Sollars PJ, Pickard GE. Melanopsin retinal ganglion cells receive bipolar and amacrine cell synapses. J Comp Neurol. 2003;460:380–393. doi: 10.1002/cne.10652. [DOI] [PubMed] [Google Scholar]
- Berson DM. Phototransduction in ganglion-cell photoreceptors. Pflugers Arch. 2007;454:849–855. doi: 10.1007/s00424-007-0242-2. [DOI] [PubMed] [Google Scholar]
- Berson DM, Dunn FA, Takao M. Phototransduction by retinal ganglion cells that set the circadian clock. Science. 2002;295:1070–1073. doi: 10.1126/science.1067262. [DOI] [PubMed] [Google Scholar]
- Catterall WA, Perez-Reyes E, Snutch TP, Striessnig J. International Union of Pharmacology. XLVIII. Nomenclature and structure-function relationships of voltage-gated calcium channels. Pharmacol Rev. 2005;57:411–425. doi: 10.1124/pr.57.4.5. [DOI] [PubMed] [Google Scholar]
- Dacey DM, Liao HW, Peterson BB, Robinson FR, Smith VC, Pokorny J, Yau KW, Gamlin PD. Melanopsin-expressing ganglion cells in primate retina signal colour and irradiance and project to the LGN. Nature. 2005;433:749–754. doi: 10.1038/nature03387. [DOI] [PubMed] [Google Scholar]
- Doyle SE, Castrucci AM, McCall M, Provencio I, Menaker M. Nonvisual light responses in the Rpe65 knock-out mouse: rod loss restores sensitivity to the melanopsin system. Proc Natl Acad Sci USA. 2006;103:10432–10437. doi: 10.1073/pnas.0600934103. [DOI] [PMC free article] [PubMed] [Google Scholar]
- Gooley JJ, Lu J, Fischer D, Saper CB. A broad role for melanopsin in nonvisual photoreception. J Neurosci. 2003;23:7093–7106. doi: 10.1523/JNEUROSCI.23-18-07093.2003. [DOI] [PMC free article] [PubMed] [Google Scholar]
- Gu Y, Oberwinkler J, Postma M, Hardie RC. Mechanisms of light adaptation in Drosophila photoreceptors. Curr Biol. 2005;15:1228–1234. doi: 10.1016/j.cub.2005.05.058. [DOI] [PubMed] [Google Scholar]
- Halaszovich CR, Zitt C, Jungling E, Luckhoff A. Inhibition of TRP3 channels by lanthanides. Block from the cytosolic side of the plasma membrane. J Biol Chem. 2000;275:37423–37428. doi: 10.1074/jbc.M007010200. [DOI] [PubMed] [Google Scholar]
- Hannibal J, Fahrenkrug J. Target areas innervated by PACAP-immunoreactive retinal ganglion cells. Cell Tissue Res. 2004a;316:99–113. doi: 10.1007/s00441-004-0858-x. [DOI] [PubMed] [Google Scholar]
- Hannibal J, Fahrenkrug J. Melanopsin containing retinal ganglion cells are light responsive from birth. NeuroReport. 2004b;15:2317–2320. doi: 10.1097/00001756-200410250-00003. [DOI] [PubMed] [Google Scholar]
- Hartwick AT, Lalonde MR, Barnes S, Baldridge WH. Adenosine A1-receptor modulation of glutamate-induced calcium influx in rat retinal ganglion cells. Invest Ophthalmol Vis Sci. 2004;45:3740–3748. doi: 10.1167/iovs.04-0214. [DOI] [PubMed] [Google Scholar]
- Hartwick AT, Zhang X, Chauhan BC, Baldridge WH. Functional assessment of glutamate clearance mechanisms in a chronic rat glaucoma model using retinal ganglion cell calcium imaging. J Neurochem. 2005;94:794–807. doi: 10.1111/j.1471-4159.2005.03214.x. [DOI] [PubMed] [Google Scholar]
- Hattar S, Liao HW, Takao M, Berson DM, Yau KW. Melanopsin-containing retinal ganglion cells: architecture, projections, and intrinsic photosensitivity. Science. 2002;295:1065–1070. doi: 10.1126/science.1069609. [DOI] [PMC free article] [PubMed] [Google Scholar]
- Hattar S, Lucas RJ, Mrosovsky N, Thompson S, Douglas RH, Hankins MW, Lem J, Biel M, Hofmann F, Foster RG, Yau KW. Melanopsin and rod-cone photoreceptive systems account for all major accessory visual functions in mice. Nature. 2003;424:76–81. doi: 10.1038/nature01761. [DOI] [PMC free article] [PubMed] [Google Scholar]
- Hattar S, Kumar M, Park A, Tong P, Tung J, Yau KW, Berson DM. Central projections of melanopsin-expressing retinal ganglion cells in the mouse. J Comp Neurol. 2006;497:326–349. doi: 10.1002/cne.20970. [DOI] [PMC free article] [PubMed] [Google Scholar]
- Inoue R, Okada T, Onoue H, Hara Y, Shimizu S, Naitoh S, Ito Y, Mori Y. The transient receptor potential protein homologue TRP6 is the essential component of vascular alpha(1)-adrenoceptor-activated Ca2+-permeable cation channel. Circ Res. 2001;88:325–332. doi: 10.1161/01.res.88.3.325. [DOI] [PubMed] [Google Scholar]
- Jakobs TC, Ben Y, Masland RH. Expression of mRNA for glutamate receptor subunits distinguishes the major classes of retinal neurons, but is less specific for individual cell types. Mol Vis. 2007;13:933–948. [PMC free article] [PubMed] [Google Scholar]
- Jung S, Muhle A, Schaefer M, Strotmann R, Schultz G, Plant TD. Lanthanides potentiate TRPC5 currents by an action at extracellular sites close to the pore mouth. J Biol Chem. 2003;278:3562–3571. doi: 10.1074/jbc.M211484200. [DOI] [PubMed] [Google Scholar]
- Kao JP. Practical aspects of measuring [Ca2+] with fluorescent indicators. Methods Cell Biol. 1994;40:155–181. doi: 10.1016/s0091-679x(08)61114-0. [DOI] [PubMed] [Google Scholar]
- Karschin A, Lipton SA. Calcium channels in solitary retinal ganglion cells from post-natal rat. J Physiol (Lond) 1989;418:379–396. doi: 10.1113/jphysiol.1989.sp017847. [DOI] [PMC free article] [PubMed] [Google Scholar]
- Krizaj D, Copenhagen DR. Calcium regulation in photoreceptors. Front Biosci. 2002;7:d2023–d2044. doi: 10.2741/a896. [DOI] [PMC free article] [PubMed] [Google Scholar]
- Kumbalasiri T, Rollag MD, Isoldi M, de Lauro Castrucci AM, Provencio I. Melanopsin triggers the release of internal calcium stores in response to light. Photochem Photobiol. 2007;83:273–280. doi: 10.1562/2006-07-11-RA-964. [DOI] [PubMed] [Google Scholar]
- Leinders-Zufall T, Rand MN, Waxman SG, Kocsis JD. Differential role of two Ca2+-permeable non-NMDA glutamate channels in rat retinal ganglion cells: kainate-induced cytoplasmic and nuclear Ca2+ signals. J Neurophysiol. 1994;72:2503–2516. doi: 10.1152/jn.1994.72.5.2503. [DOI] [PMC free article] [PubMed] [Google Scholar]
- Lewis RS. The molecular choreography of a store-operated calcium channel. Nature. 2007;446:284–287. doi: 10.1038/nature05637. [DOI] [PubMed] [Google Scholar]
- Lowe G, Gold GH. Nonlinear amplification by calcium-dependent chloride channels in olfactory receptor cells. Nature. 1993;366:283–286. doi: 10.1038/366283a0. [DOI] [PubMed] [Google Scholar]
- Meyer-Franke A, Kaplan MR, Pfrieger FW, Barres BA. Characterization of the signaling interactions that promote the survival and growth of developing retinal ganglion cells in culture. Neuron. 1995;15:805–819. doi: 10.1016/0896-6273(95)90172-8. [DOI] [PubMed] [Google Scholar]
- Minke B, Parnas M. Insights on TRP channels from in vivo studies in Drosophila. Annu Rev Physiol. 2006;68:649–684. doi: 10.1146/annurev.physiol.68.040204.100939. [DOI] [PMC free article] [PubMed] [Google Scholar]
- Morin LP, Blanchard JH, Provencio I. Retinal ganglion cell projections to the hamster suprachiasmatic nucleus, intergeniculate leaflet, and visual midbrain: bifurcation and melanopsin immunoreactivity. J Comp Neurol. 2003;465:401–416. doi: 10.1002/cne.10881. [DOI] [PubMed] [Google Scholar]
- Murphy TH, Worley PF, Baraban JM. L-type voltage-sensitive calcium channels mediate synaptic activation of immediate early genes. Neuron. 1991;7:625–635. doi: 10.1016/0896-6273(91)90375-a. [DOI] [PubMed] [Google Scholar]
- Ostergaard J, Hannibal J, Fahrenkrug J. Synaptic contact between melanopsin-containing retinal ganglion cells and rod bipolar cells. Invest Ophthalmol Vis Sci. 2007;48:3812–3820. doi: 10.1167/iovs.06-1322. [DOI] [PubMed] [Google Scholar]
- Panda S, Provencio I, Tu DC, Pires SS, Rollag MD, Castrucci AM, Pletcher MT, Sato TK, Wiltshire T, Andahazy M, Kay SA, Van Gelder RN, Hogenesch JB. Melanopsin is required for non-image-forming photic responses in blind mice. Science. 2003;301:525–527. doi: 10.1126/science.1086179. [DOI] [PubMed] [Google Scholar]
- Peirson S, Foster RG. Melanopsin: another way of signaling light. Neuron. 2006;49:331–339. doi: 10.1016/j.neuron.2006.01.006. [DOI] [PubMed] [Google Scholar]
- Peirson SN, Oster H, Jones SL, Leitges M, Hankins MW, Foster RG. Microarray analysis and functional genomics identify novel components of melanopsin signaling. Curr Biol. 2007;17:1363–1372. doi: 10.1016/j.cub.2007.07.045. [DOI] [PubMed] [Google Scholar]
- Perez-Leon JA, Warren EJ, Allen CN, Robinson DW, Lane Brown R. Synaptic inputs to retinal ganglion cells that set the circadian clock. Eur J Neurosci. 2006;24:1117–1123. doi: 10.1111/j.1460-9568.2006.04999.x. [DOI] [PMC free article] [PubMed] [Google Scholar]
- Provencio I, Jiang G, De Grip WJ, Hayes WP, Rollag MD. Melanopsin: an opsin in melanophores, brain, and eye. Proc Natl Acad Sci USA. 1998;95:340–345. doi: 10.1073/pnas.95.1.340. [DOI] [PMC free article] [PubMed] [Google Scholar]
- Qiu X, Kumbalasiri T, Carlson SM, Wong KY, Krishna V, Provencio I, Berson DM. Induction of photosensitivity by heterologous expression of melanopsin. Nature. 2005;433:745–749. doi: 10.1038/nature03345. [DOI] [PubMed] [Google Scholar]
- Ramsey IS, Delling M, Clapham DE. An introduction to TRP channels. Annu Rev Physiol. 2006;68:619–647. doi: 10.1146/annurev.physiol.68.040204.100431. [DOI] [PubMed] [Google Scholar]
- Reuss H, Mojet MH, Chyb S, Hardie RC. In vivo analysis of the drosophila light-sensitive channels, TRP and TRPL. Neuron. 1997;19:1249–1259. doi: 10.1016/s0896-6273(00)80416-x. [DOI] [PubMed] [Google Scholar]
- Riccio A, Mattei C, Kelsell RE, Medhurst AD, Calver AR, Randall AD, Davis JB, Benham CD, Pangalos MN. Cloning and functional expression of human short TRP7, a candidate protein for store-operated Ca2+ influx. J Biol Chem. 2002;277:12302–12309. doi: 10.1074/jbc.M112313200. [DOI] [PubMed] [Google Scholar]
- Sah P, Faber ES. Channels underlying neuronal calcium-activated potassium currents. Prog Neurobiol. 2002;66:345–353. doi: 10.1016/s0301-0082(02)00004-7. [DOI] [PubMed] [Google Scholar]
- Sakamoto K, Liu C, Tosini G. Classical photoreceptors regulate melanopsin mRNA levels in the rat retina. J Neurosci. 2004;24:9693–9697. doi: 10.1523/JNEUROSCI.2556-04.2004. [DOI] [PMC free article] [PubMed] [Google Scholar]
- Schaefer M, Plant TD, Obukhov AG, Hofmann T, Gudermann T, Schultz G. Receptor-mediated regulation of the nonselective cation channels TRPC4 and TRPC5. J Biol Chem. 2000;275:17517–17526. doi: 10.1074/jbc.275.23.17517. [DOI] [PubMed] [Google Scholar]
- Schmid S, Guenther E. Voltage-activated calcium currents in rat retinal ganglion cells in situ: changes during prenatal and postnatal development. J Neurosci. 1999;19:3486–3494. doi: 10.1523/JNEUROSCI.19-09-03486.1999. [DOI] [PMC free article] [PubMed] [Google Scholar]
- Sekaran S, Foster RG, Lucas RJ, Hankins MW. Calcium imaging reveals a network of intrinsically light-sensitive inner-retinal neurons. Curr Biol. 2003;13:1290–1298. doi: 10.1016/s0960-9822(03)00510-4. [DOI] [PubMed] [Google Scholar]
- Sekaran S, Lupi D, Jones SL, Sheely CJ, Hattar S, Yau KW, Lucas RJ, Foster RG, Hankins MW. Melanopsin-dependent photoreception provides earliest light detection in the mammalian retina. Curr Biol. 2005;15:1099–1107. doi: 10.1016/j.cub.2005.05.053. [DOI] [PMC free article] [PubMed] [Google Scholar]
- Sekaran S, Lall GS, Ralphs KL, Wolstenholme AJ, Lucas RJ, Foster RG, Hankins MW. 2-Aminoethoxydiphenylborane is an acute inhibitor of directly photosensitive retinal ganglion cell activity in vitro and in vivo. J Neurosci. 2007;27:3981–3986. doi: 10.1523/JNEUROSCI.4716-06.2007. [DOI] [PMC free article] [PubMed] [Google Scholar]
- Semo M, Lupi D, Peirson SN, Butler JN, Foster RG. Light-induced c-fos in melanopsin retinal ganglion cells of young and aged rodless/coneless (rd/rd cl) mice. Eur J Neurosci. 2003;18:3007–3017. doi: 10.1111/j.1460-9568.2003.03061.x. [DOI] [PubMed] [Google Scholar]
- Sollars PJ, Smeraski CA, Kaufman JD, Ogilvie MD, Provencio I, Pickard GE. Melanopsin and non-melanopsin expressing retinal ganglion cells innervate the hypothalamic suprachiasmatic nucleus. Vis Neurosci. 2003;20:601–610. doi: 10.1017/s0952523803206027. [DOI] [PubMed] [Google Scholar]
- Thompson MA, Ginty DD, Bonni A, Greenberg ME. L-type voltage-sensitive Ca2+ channel activation regulates c-fos transcription at multiple levels. J Biol Chem. 1995;270:4224–4235. doi: 10.1074/jbc.270.9.4224. [DOI] [PubMed] [Google Scholar]
- Treiman M, Caspersen C, Christensen SB. A tool coming of age: thapsigargin as an inhibitor of sarco-endoplasmic reticulum Ca2+-ATPases. Trends Pharmacol Sci. 1998;19:131–135. doi: 10.1016/s0165-6147(98)01184-5. [DOI] [PubMed] [Google Scholar]
- Tu DC, Owens LA, Anderson L, Golczak M, Doyle SE, McCall M, Menaker M, Palczewski K, Van Gelder RN. Inner retinal photoreception independent of the visual retinoid cycle. Proc Natl Acad Sci USA. 2006;103:10426–10431. doi: 10.1073/pnas.0600917103. [DOI] [PMC free article] [PubMed] [Google Scholar]
- Verkhratsky A. Physiology and pathophysiology of the calcium store in the endoplasmic reticulum of neurons. Physiol Rev. 2005;85:201–279. doi: 10.1152/physrev.00004.2004. [DOI] [PubMed] [Google Scholar]
- Viney TJ, Balint K, Hillier D, Siegert S, Boldogkoi Z, Enquist LW, Meister M, Cepko CL, Roska B. Local retinal circuits of melanopsin-containing ganglion cells identified by transsynaptic viral tracing. Curr Biol. 2007;17:981–988. doi: 10.1016/j.cub.2007.04.058. [DOI] [PubMed] [Google Scholar]
- Wan J, Zheng H, Hu BY, Xiao HL, She ZJ, Chen ZL, Zhou GM. Acute photoreceptor degeneration down-regulates melanopsin expression in adult rat retina. Neurosci Lett. 2006;400:48–52. doi: 10.1016/j.neulet.2006.02.084. [DOI] [PubMed] [Google Scholar]
- Warren EJ, Allen CN, Brown RL, Robinson DW. Intrinsic light responses of retinal ganglion cells projecting to the circadian system. Eur J Neurosci. 2003;17:1727–1735. doi: 10.1046/j.1460-9568.2003.02594.x. [DOI] [PMC free article] [PubMed] [Google Scholar]
- Warren EJ, Allen CN, Brown RL, Robinson DW. The light-activated signaling pathway in SCN-projecting rat retinal ganglion cells. Eur J Neurosci. 2006;23:2477–2487. doi: 10.1111/j.1460-9568.2006.04777.x. [DOI] [PMC free article] [PubMed] [Google Scholar]
- Wong KY, Dunn FA, Berson DM. Photoreceptor adaptation in intrinsically photosensitive retinal ganglion cells. Neuron. 2005;48:1001–1010. doi: 10.1016/j.neuron.2005.11.016. [DOI] [PubMed] [Google Scholar]
- Wong KY, Dunn FA, Graham DM, Berson DM. Synaptic influences on rat ganglion-cell photoreceptors. J Physiol (Lond) 2007;582:279–296. doi: 10.1113/jphysiol.2007.133751. [DOI] [PMC free article] [PubMed] [Google Scholar]