

Abstract
Tonic–clonic seizures represent a common pattern of epileptic discharges, yet the relationship between the various phases of the seizure remains obscure. Here we contrast propagation of the ictal wavefront with the propagation of individual discharges in the clonic phase of the event. In an in vitro model of tonic–clonic epilepsy, the afterdischarges (clonic phase) propagate with relative uniform speed and are independent of the speed of the ictal wavefront (tonic phase). For slowly propagating ictal wavefronts, the source of the afterdischarges, relative to a given recording electrode, switched as the wavefront passed by, indicating that afterdischarges are seeded from wavefront itself. In tissue that has experienced repeated ictal events, the wavefront generalizes rapidly, and the afterdischarges in this case show a different “flip–flop” pattern, with frequent switches in their direction of propagation. This same flip–flop pattern is also seen in subdural EEG recordings in patients suffering intractable focal seizures caused by cortical dysplasias. Thus, in both slowly and rapidly generalizing ictal events, there is not a single source of afterdischarge activity: rather, the source is continuously changing. Our data suggest a complex view of seizures in which the ictal event and its constituent discharges originate from distinct locations.
Keywords: epilepsy, seizure, tonic–clonic discharge, afterdischarge, pyramidal cell, cortex
Introduction
Epileptiform activity shows a variety of phase transitions: interictal to ictal activity; focal to generalized activity; the tonic to clonic transition; and the spontaneous cessation of epileptiform discharges (Prince et al., 1983; Wong and Prince, 1990; Traub and Miles, 1991; Traub et al., 1993; Dzhala and Staley, 2003; Steriade, 2003; Van Drongelen et al., 2003; Netoff et al., 2004; Pinto et al., 2005). However, the nature of the transitions, although being of obvious importance, remains obscure. Insights into these phase transitions may come from identifying changes in the source of activity in the different phases (Traub et al., 1993).
Our attempts to understand epileptiform activity can be helped by examining appropriate in vitro models. Using brain slices greatly reduces the dimensionality of the problem, essentially to analysis of a one-dimensional, horizontal propagation (Chervin et al., 1988; Traub et al., 1993; Wadman and Gutnick, 1993; Albowitz and Kuhnt, 1995; Pinto et al., 2005; Trevelyan et al., 2006, 2007). Furthermore, these models provide far greater control of the experimental conditions than in vivo models but also allow easier access for electrophysiological recording or imaging. A drawback is that brain slices are a “reduced” preparation, lacking long-range axonal connections. Conversely, the integrity of cellular function is essentially maintained, and, importantly, brain slices demonstrably can sustain complex network behavior that closely mimics that in vivo (Whittington et al., 1995b; Cossart et al., 2003; Cunningham et al., 2004; MacLean et al., 2005). The zero magnesium (0 Mg2+) in vitro model, in particular, manifests a wide range of epileptiform activity patterns, including interictal activity (Anderson et al., 1986; Flint et al., 1997), slow and rapid patterns of generalization (Wong and Prince, 1990; Trevelyan et al., 2006, 2007), tonic–clonic transitions (Anderson et al., 1986; Flint et al., 1997), and status epilepticus (Dreier and Heinemann, 1990; Pfeiffer et al., 1996; Dreier et al., 1998). The multifaceted nature of this particular model may come from the initial epileptic activity arising from enhanced excitation, whereas the late activity is influenced further by depressed inhibition (Whittington et al., 1995a; Trevelyan et al., 2007). In the present study, we use this to our advantage, because it allows us to contrast the speed of afterdischarge propagation (unchanging) with that of the ictal wavefront (progressively increasing) (Trevelyan et al., 2007).
We analyze the relative timing of afterdischarges in paired recordings, during the clonic phase of tonic–clonic epileptiform activity in two different conditions: patch-clamp recordings from mouse neocortical brain slices in which epileptiform activity has been provoked by reducing extracellular Mg2+ ions; and in human subdural recordings. With slowly propagating ictal events, activity is seeded continually from the region most recently recruited to the event, at the ictal wavefront. In contrast, rapidly generalizing events show a “flip–flop” pattern of afterdischarges, with regular switches in the direction of propagation. Importantly, in both slowly and rapidly generalizing events, the afterdischarges do not arise from a single location but instead appear to arise from a continually changing source.
Materials and Methods
Subdural EEG recordings.
Subdural recordings were made from four patients suffering partial seizures with a focal neocortical pathology (one had a region of cortical dysplasia, two had mesial temporal sclerosis/neurofibromatosis, and one had focal seizures subsequent to perinatal asphyxia). The recordings were from multi-contact (all four patients had 32 or more contacts) platinum array (Ad-Tech, Racine, WI) placed over the ictal foci. Continuous video EEG recordings were made, sampling at 200 Hz with a bandpass of 0.3–70 Hz (Grass Telefactor, West Warwick, RI). Supplementary recordings were made using Neuroscan (Charlotte, NC) equipment, sampling at either 500 Hz or 1 kHz with a bandpass of 0.1–200 Hz, with reference electrode on a distant contact on the subdural strip. The analyses of timing presented here were done on these latter recordings, sampled at the higher rate (1 kHz), and referenced to the common average signal.
Slice preparation.
All animal handling and experimentation were done according to National Institutes of Health guidelines. Recordings were made from slices of occipital cortex prepared acutely from postnatal day 13–18 d C57BL/6 mice. Animals were anesthetized with ketamine–xylazine (10 mg/kg), and the brain was removed and submerged in ice-cold isotonic sucrose solution (in mm: 222 sucrose, 26 NaHCO3, 2 MgCl2, 2.6 KCl, 1.5 NaH2PO4−, and 0.05 ascorbic acid). Coronal slices, 350 μm thick, were cut using a Leica (Nussloch, Germany) vibratome, and the slices were incubated in artificial CSF (ACSF) containing 1 mm Mg2+ ions (125 NaCl, 26 NaHCO3, 10 dextrose, 3.5 KCl, 2 CaCl2, 1.26 NaH2PO4−, and 1 MgSO4).
In vitro electrophysiology.
The chamber was mounted on a Scientifica (Uckfield, UK) movable top plate fitted with a heater plate (Warner Instruments, Hamden, CT), and the incoming solution (perfusion at 1–3 ml/min) was heated by a sleeve heater element (Warner Instruments). All imaging and electrophysiological recordings were done at 33–37°C. Whole-cell recordings were made using 3–7 MΩ pipettes [borosilicate glass (Harvard Apparatus, Holliston, MA); MX130 hydraulic micromanipulators (Siskiyou Design Instruments, Grants Pass, OR), containing 125 mm K methyl-SO4, 10 mm K-HEPES, 2.5 mm Mg-ATP, 6 mm NaCl,5 mm QX-314 [N-(2,6-dimethylphenylcarbamoylmethyl)triethylammoniumbromide], 0.3 mm Na-GTP, and 0.5% biocytin (w/v). QX-314 was included to allow the cells to be voltage clamped above the threshold for action potentials (at −30mV). Slices were fixed and stained for biocytin; the horizontal separation of the stained cells was measured from either the stained sections or the imaged locations of the electrodes (the two measures corresponded). Electrophysiological data were collected using a HEKA Elektronik (Lambrecht/Pfalz, Germany) EPC10 amplifier with Patchmaster software and analyzed off-line using Igor (WaveMetrics, Lake Oswego, OR). Some slices had been loaded with the Ca dye, Oregon Green BAPTA 1 (OGB1) before recording as part of another previously published set of studies (Trevelyan et al., 2006, 2007). There were no qualitative differences between the recordings from OGB1-loaded versus unloaded slices.
Analysis.
The latency of afterdischarges recorded in two pyramidal cells was derived as follows. The analysis was performed on either 1 s or 500 ms windows, approximately centered on the down slope of the discharges in the Vclamp recordings (the longer time window was used for the analysis in Fig. 1 because the dataset was derived from the final afterdischarges in an ictal event that occur at relatively low frequency; the analysis of entire ictal events shown in the remaining figures used shorter 500 ms bins because early discharges in an ictal event occur at >1 Hz frequency). The temporal derivative of these time windows was taken, and the cross-correlogram of the derivatives was obtained. The latency of the event in the two cells was taken to be the offset from zero of the peak of the cross-correlogram (see Fig. 1C). We used the derivative of the Vclamp trace because, first, this was dominated by the rapid onset of the excitatory synaptic drives and thus reflected well the relative timing of the onset of the event in both cells, and, second, the window usually incorporated the entire event, the start and end current in the window were virtually identical, and thus the mean of the derivative over this time was close to zero, thus validating the use of a correlogram.
Figure 1.

Highly uniform propagation speed of afterdischarges. A, Paired Vclamp recording (at −30 mV) of two layer 5 pyramidal cells (485 μm separation) during an ictal event. Bottom, An enlarged view of the after discharges. B, Examples of afterdischarges recorded in pairs of layer 5 pyramidal cells at the separations indicated. There is a steady increase in the delay with increasing separation of the recorded pyramidal cells. C, To quantify this, we derived cross-correlograms for the traces: a peak exactly at zero indicates simultaneous events, whereas deviations from zero in the peak give the temporal delay. The cross-correlograms for the raw traces and for the first temporal derivatives gave the same peak location. D, The temporal delays measured this way showed an extremely high correlation with the separation of the recorded cells. The gradient of this plot suggests the propagation speed of the afterdischarges to be ∼27 mm/s.
Results
Different determinants of propagation speed for tonic and clonic discharges
When neocortical brain slices are bathed in ACSF lacking Mg2+ ions, they start to experience epileptiform discharges with a very characteristic tonic–clonic structure (Anderson et al., 1986) (Fig. 1A). We documented previously how the initial wavefront, the tonic phase of the event, propagates with a huge range of velocities, primarily determined by the efficacy of a feedforward restraint (Trevelyan et al., 2006, 2007). In contrast, the afterdischarges propagate at a very uniform speed (Fig. 1B–D). The speed of afterdischarges remained the same with repeated ictal events, unlike the speed of the ictal wavefront (Fig. 2A), which became progressively faster with each ictal event (Trevelyan et al., 2007) until it approached the speed of the afterdischarge propagation. Thus, the speed of afterdischarges was independent of the speed of the ictal wavefront (Fig. 2A). Notably, the propagation speed of the afterdischarges (29 ± 18 mm/s) was similar to ictal propagation in disinhibited brain slices (20–100 mm/s) (Chervin et al., 1988; Wadman and Gutnick, 1993; Albowitz and Kuhnt, 1995; Pinto et al., 2005).
Figure 2.

The velocity of the ictal wavefront and the afterdischarge are independently set. A, The speed of afterdischarges does not change with successive ictal events, unlike the speed of the ictal wavefront, which increases with each successive event [data for the ictal wavefront is from Trevelyan et al. (2007), shown here for comparison]. B, The speed of the ictal wavefront plotted against the speed of subsequent afterdischarges for the same ictal event (n = 44 events from 12 slices). The delays are normalized to the separation of the recording electrodes so as not to bias the dataset by a skewed sample of electrode separations. The speed of the ictal wavefront and the discharges are not correlated.
Slowly generalizing events: all discharges are seeded from the ictal wavefront
A consistent feature of these slowly propagating ictal events was that the late afterdischarges propagated in the opposite direction to the wavefront (Figs. 1A, 3). The example given shows this particularly well because the first two ictal events propagated in opposite directions: in both cases, the afterdischarge propagation is reversed. We reasoned that the earliest discharges should travel in the same direction as the wavefront (Fig. 4, top left) because the process of recruiting new cortical territories to the ictal event must involve activity spreading from areas already involved in the event to areas that are still quiescent. This implies that the direction of propagation of individual discharges should reverse as the ictal event progresses.
Figure 3.

The late afterdischarges propagate in the opposite direction to the main ictal wavefront. A, Photomicrograph of the three recorded layer 5 pyramidal cells. Cell separations: black to red, 500 μm; red to blue, 820 μm. B, Vclamp recordings from three layer 5 pyramidal cells during the first ictal event to propagate in the slice. The ictal event propagates from black to red to blue. The afterdischarges, however, propagate in the opposite direction. C, The second ictal event recorded in this slice happened to propagate in the opposite direction; all activity developed spontaneously. Remarkably, the afterdischarges also switched direction. Thus, the afterdischarges consistently propagated in the opposite direction to the ictal wavefront.
Figure 4.

The direction of the discharges reverses as the wavefront passes the recorded cell. A, Paired voltage-clamp recording from pyramidal cells (separation, 610 μm) during an early, slowly propagating ictal event. The earliest discharges spread from the red to the black cell and are thus propagating in the direction of the ictal wavefront. The direction of the discharge propagation subsequently reverses so that the later afterdischarges propagate backward from the black to the red cell. The relative timing of the discharges is shown in the plot below the Vclamp traces and shows clearly that the discharges reverse their direction as the synaptic barrage reaches its greatest intensity in the later recruited cell. Positive values indicate that the discharge propagates in the same direction as the ictal wavefront, whereas negative values represent discharges propagating in the opposite direction to the main wavefront. B, Pooled data from eight paired recordings (12 ictal events), aligned by the peak filtered inward current in the later recruited of the two cells. The top plot shows low-pass-filtered (0.2 Hz) Vclamp recordings during slowly propagating ictal events. Each recording is one of a pair of Vclamp recordings and shows the later of the two cells to be recruited. The minima in these filtered plots accurately reflect the peak intensity of the synaptic barrage (for an overlay of the raw Vclamp trace and the low-pass-filtered version, see supplemental Fig. 1, available at www.jneurosci.org as supplemental material). The bottom plot shows the mean discharge latency in the pairs of recorded cells, normalized to a cell separation of 1 mm. The plot has the same convention as in Figure 3 (positive, same direction as ictal wavefront; negative, opposite direction). C, Schematic to show the typical pattern of activity flow during a slowly propagating ictal event. This figure is adapted from Trevelyan et al. (2006) and shows a line scan through a cortical slice that had been bulk loaded with the Ca2+ dye Oregon Green BAPTA 1. The ordinate represents distance, and the abscissa represents time. The line scan shows a slowly propagating ictal event, and the wavefront is outlined by the dotted red line. Our analysis of the timing of discharges, presented here, indicates that all activity originates in this narrow propagating band of tissue and spreads both forward, to recruit more tissue to the event, and backward, in the form of afterdischarges.
To examine the discharge reversal further, we plotted the direction of propagation of all predominantly excitatory barrages in paired recordings from separate layer 5 pyramidal cells, as an ictal event progressed across the cortical slice (Fig. 4). The analysis clearly showed that the direction of propagation of discharges reversed direction at approximately the time, or fractionally before, the later recruited cell was experiencing the most intense excitatory drive. The low-pass-filtered Vclamp traces identifies this peak excitatory drive clearly, so we used the filtered traces of the later recruited cells to align all the events (Fig. 4B). The delays between discharges in the two cells were normalized by the separation of the cells. All events examined (n = 12 events from 8 different brain slices) showed the same trend, with a reversal fractionally before the peak excitatory drive in the second cell. There was a significant shift in the time delay from the period 5–10 s before this time point, to 5–10 s after, but subsequently the time delay remained constant.
Our interpretation of this reversal is explained with the aid of a Ca2+ fluorescence line scan of a slowly propagating ictal event (Fig. 4C; for additional explanation of these plots, see Trevelyan et al., 2006). Line scans through the infragranular layers can give a useful representation of the network activity patterns as the ictal event propagates. In these plots, the ictal wave front is seen as a diagonal band (dotted red outline) that, in the case shown, traverses the 750 μm field of view in ∼5.5 s (∼140 μm/s). Thus, the delay in activation of different cortical territories is likely to translate into significant differences in refractoriness to activation over quite short cortical distances. Synaptic volleys spread forward from the wave front to recruit new cortical territories, and they also propagate backward from it as afterdischarges.
Rapidly generalizing events: flip–flop afterdischarge propagation
The pattern of activity, in the 0 Mg2+ model of epilepsy, changes over time (Dreier and Heinemann, 1990; Whittington et al., 1995a; Pfeiffer et al., 1996; Dreier et al., 1998; Trevelyan et al., 2007). In particular, there is a progressive increase in propagation speed of ictal events, such that the late events generalize across the tissue with great rapidity (Trevelyan et al., 2007). We therefore examined whether the afterdischarges showed the same simple reversed relationship to the ictal wavefront (Fig. 5A) in these rapidly propagating ictal events. In contrast with the slow ictal events, rapidly generalizing events showed regular switches in the direction of propagation of the afterdischarges (Fig. 5A). The probability of consecutive afterdischarges traveling in opposite directions was significantly different for slowly and rapidly propagating ictal events [Pslow(switch) = 0.098 ± 0.113; Pfast(switch) = 0.250 ± 0.138; p < 0.05, Student's t test). The afterdischarge flip–flop pattern in rapidly generalizing events is illustrated schematically (Fig. 5B) with the aid of a Ca2+ line scan from a late 0 Mg2+ event (Trevelyan et al., 2007).
Figure 5.

Frequent switches in the direction of propagation of individual discharges after many ictal events. A, Paired Vclamp recordings of separate layer 5 pyramidal cells in a slice that has experienced many previous ictal events. The ictal event rapidly generalizes, as evident by the almost synchronous initial excitatory volley in the two cells. The bottom shows the relative timing of individual discharges and, as is typical for these rapidly generalizing events, shows that discharges switch directions frequently. B, Line scan schematic to illustrate that, in rapidly generalizing events, there are regular switches in the direction that afterdischarges propagate. It should be noted that the directionality of afterdischarges cannot be determined from our Ca2+ imaging dataset because the afterdischarges traverse the entire field of view within a single time frame: the arrows are merely a heuristic aid. C, Afterdischarge pattern recorded from two subdural electrodes (separated by ∼3 cm) in a patient with intractable seizures caused by a focal cortical dysplasia. Although in this patient the source of the seizure activity was clearly localized, the afterdischarges show frequent switches in the direction of propagation.
Finally, we performed the same analyses on subdural recordings taken from human subjects with focal seizures emanating from discrete cortical foci. The example shown in Figure 5 (Traub et al., 2001) was taken from a 13-month-old girl who initially presented at ∼5 weeks age, with brief isolated jerks in both arms. At age 5 months, she started to experience generalized seizures and, at the time of investigation, was suffering 10–15 generalized seizures per day. The recordings were made from chronically implanted 32 electrode array (4 × 8 electrode arrangement, 1 cm inter-electrode spacing) placed over an area of focal cortical dysplasia in the right frontal lobe. The outward appearance of the seizures was a short period of behavioral arrest (unresponsive) for a few seconds, followed by generalized jerking of all limbs, predominating on the left and lasting 2–3 min. This corresponded well with the timing of activity in the electrical recordings, with approximately a 20 s delay from the onset of very fast oscillations to generalized activity at all electrodes. Subsequent to these recordings, the focal dysplasia was surgically removed, and the patient became seizure free, providing confirmation that this was indeed the ictal focus.
In these in vivo recordings, the afterdischarges showed the same flip–flop pattern as seen in the late 0 Mg2+ events, with consecutive afterdischarges regularly traveling in opposite directions (Fig. 5C) (supplemental Fig. 2, available at www.jneurosci.org as supplemental material). This was not an artifact of a one-dimensional sampling of epileptic propagation through a complex two-dimensional area, because similar patterns were found for all pairings from a 32 electrode array overlying the dysplastic region [Psubdural(switch) = 0.321 ± 0.107; 75 electrode pairings analyzed]. Recordings from all four patients showed the same flip–flop patterns. We conclude therefore that, after repeated ictal events, there can be multiple sources of afterdischarge bursts.
Afterdischarge propagation failure
Finally, we also noted examples of failure of backpropagating afterdischarges in slowly generalizing ictal events. The failures tended to follow soon after a large afterdischarge (Fig. 6A). These recordings usually showed examples of partial failures at other times (Fig. 6A, filled arrowheads). Our paired recordings clearly represent a limited sampling of the spatial activity so only give a partial picture of the failure. The notable feature of these recordings, however, is that failure of propagation of these late afterdischarges only seems to occur when there has been a substantial delay in the initial recruitment and in one direction only: from the later to the earlier activated cortical territories. We never saw such failures (large event in one electrode and virtually nothing in the other) associated with rapidly propagating ictal events (>40 events from 10 separated paired recordings). Thus, these data strongly suggest that a difference in the refractoriness of cortical territories contributes to the failures. In short, the longer a cortical area has been seizing, the more refractory that area is to reactivation.
Figure 6.
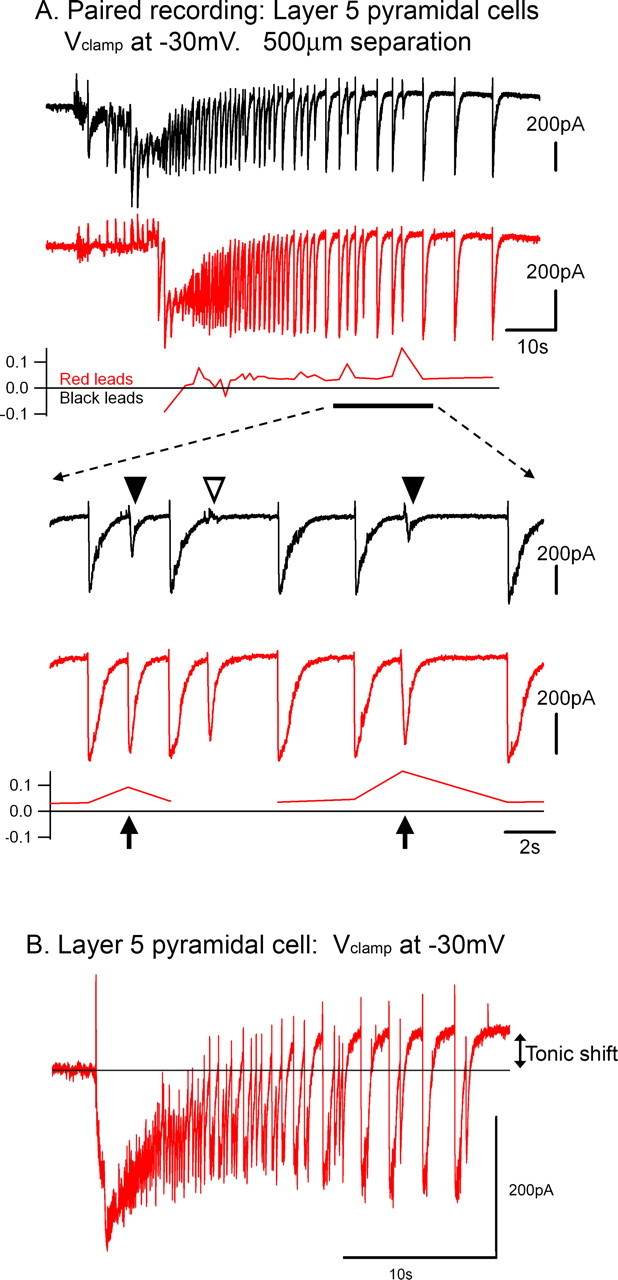
Failure of backpropagating afterdischarges. A, Simultaneous Vclamp recordings of two layer 5 pyramidal cells, during a slowly propagating ictal event. Toward the end of the clonic phase, there are several examples of discharges failing to propagate back toward the cell that has been active for the longest time. An expanded view of these recordings is shown below. Note that the partial failures (filled arrowheads) are associated with an increase in latency (arrows). There is a break in the delay plot for the event that fails to propagate, because the cross-correlation at this time was meaningless. B, Vclamp recording of a layer 5 pyramidal cells, held at −30 mV, to show a consistent feature of these recordings: the upwards shift in the baseline current during the afterdischarge phase of the ictal event (tonic shift).
Interestingly, these partial failures constitute an exception to the rule that discharges propagate at a uniform rate: partial failures are associated with a marked increase in the delay of propagation (Fig. 6A). This delay may also contribute to the likelihood of failure of backpropagation because it will have the effect of desynchronizing the excitatory drive: rapidly propagating events will involve a more synchronous firing over a wider cortical territory than more slowly propagating events. These failures are a feature of the terminal stages of the ictal event and are associated with an upward baseline shift in the −30 mV Vclamp recordings at this time (Fig. 6B). The underlying cause of the refractoriness remains of great importance because it is likely to influence the eventual termination of the event.
Discussion
We analyzed the direction of propagation of afterdischarges to show that the source of individual discharges is different from the source of the ictal event itself. This conclusion appears to hold true for both slowly and rapidly generalizing, in vitro epileptiform activity, and also in vivo partial seizures, recorded in humans. In addition to this difference in initiation site, the ictal wavefront and the subsequent afterdischarges also differ with respect to the pattern and speed of propagation. These data are consistent with our previous interpretation of the spread of the ictal wavefront: that recruitment of new cortical territories is set primarily by the efficacy of an inhibitory restraint (Trevelyan et al., 2006). The inhibitory restraint, as we previously described it, works by vetoing the excitatory drive on to pyramidal neurons and thus causes the wavefront to stall. This intermittent stalling is the signature of the inhibitory restraint. Once the new territory is recruited, however, the restraint has effectively failed. Thus, the inhibitory restraint should not influence the afterdischarges and, indeed, the afterdischarges, in general, propagate without stalling (but see Fig. 6 and discussion below). Our data provide additional support for the view that distinct mechanisms underlie the different phases of seizures (Traub et al., 1993; Pinto et al., 2005).
The slowly generalizing in vitro events are the most straightforward to understand and provide insight into one mechanism by which the events may be sustained. The key observation is an apparent switch in the direction of propagation of individual discharges coincident with the peak excitatory drive (Fig. 4). Multielectrode extracellular recordings (Wong and Prince, 1990) and Ca2+ imaging experiments (Trevelyan et al., 2006) indicate that this peak synaptic barrage occurs as the ictal wavefront passes the recorded cell. Because our analysis was of paired recordings, the discharges would arrive at both electrodes simultaneously if arising from a point halfway between them. As such, the zero time delay would occur fractionally before the wavefront reached the later recruited cell, and a careful study of Figure 4B suggests that this is indeed so (the exact timing will be obscured by the fact that, to pool the dataset, we normalized for the separation of the cells. The switch time for a 200 μm separated pair will be different from that for a 1 mm separated pair). We conclude therefore, that, in these slowly propagating ictal events, the ictal wavefront must be the source of all activity, driving the recruitment of new territories ahead of the wavefront and also seeding afterdischarges that then propagate in the opposite direction (shown schematically in Fig. 4C).
In slowly propagating ictal events, the pacemaker for the afterdischarges appears to be the high frequency “tonic” activity at the wavefront itself. The fact that the afterdischarges have a dominant frequency lower than that at the ictal wavefront implies that the high-frequency activity is failing to backpropagate through the network. This would occur if sustained activity made networks refractory to activation. Wong and Prince (1990) provided experimental evidence for this refractoriness by demonstrating that networks could not follow even quite low-frequency (2 Hz) extracellular stimulation after sustained ictal activity. We also provide some circumstantial evidence for this view, as well, by showing examples of failure of late afterdischarges to backpropagate in the slowly generalizing events but not in the rapidly generalizing events. The difference between the slow and rapid generalizing events in this regard is consistent with the idea that it is the relative refractoriness of cortical areas that influences afterdischarge propagation.
Several factors may contribute to the differential refractoriness: Ca2+-activated K+ channels (witness the increase in intracellular Ca2+ levels during the clonic phase coupled with a progressive shift in the baseline current at this time, indicative of a slowly activated, tonic outward current); an increased Na+–K+–ATPase activity (Thomas, 1969); and synaptic changes (Larkman and Jack, 1995), such as receptor desensitization and vesicle depletion (Bekkers and Stevens, 1990). Indeed, it seems probable that all these different mechanisms contribute to varying degrees and likely other mechanisms, too.
The great delays in the initial activation of cortical territories in slowly propagating events will mean that there are corresponding differences in the refractoriness of these territories. Because the newly recruited territories appear to seed afterdischarges, it would seem that these “fresh” territories may be sustaining the ictal event. Ultimately, however, the ictal wavefront will reach the end of the slice, and so, presumably, with the lack of new fresh territory to sustain the event, the pacemaker drive from the ictal wavefront is reduced, leading to an eventual termination. In agreement with previous in vitro studies (Wong and Prince, 1990), we found that termination occurred simultaneously throughout the tissue. In a more extensive network, however, this need not necessarily be the case. There are well described clinical cases in which seizures appear to “migrate,” the original area ceasing to show spiking as another area becomes active (Binnie et al., 1994). Our in vitro data suggest that this pattern of motile focal ictal activity should be particularly associated with slowly propagating ictal events, with feedforward activation being limited by the inhibitory restraint, and feedback activation by increasing refractoriness.
It is clear, however, that the ictal wavefront is not the only potential pacemaker, as evident from the rapidly propagating events, in which afterdischarges appear to be triggered from multiple locations. In these events, there are unlikely to be substantial differences in the refractoriness of cortical territories. Traub et al. (1993) suggested that these secondary discharges may arise from dendritic Ca2+ spikes, based on their analysis of discharge patterns in disinhibited hippocampal slices. In their model, they also showed how an inhomogeneous expression of glutamate receptors could reverse the direction of afterdischarges. The model, however, predicts that the reversal is consistently in one direction and not the flip–flop pattern we show here. A second issue is timing: their proposed mechanism is likely to be constrained by the time course of the Ca2+ spike, and thus a mechanism that could explain reversal of discharges that are occurring in the theta band (5–12 Hz, as in their disinhibited hippocampal slices) rather than the delta rhythm (0.5–2 Hz) of the afterdischarges in our neocortical slices. Spontaneous changes in wave propagation have been noted previously in both the hippocampus (Finnerty and Jefferys, 2000; Luhmann et al., 2000; Derchansky et al., 2006) and neocortex (Bao and Wu, 2003). Coupled oscillators have been proposed to underlie these spontaneous switches (Bao and Wu, 2003; Derchansky et al., 2006), although once again, this latter mechanism necessarily works at a higher frequency (theta rather than delta) because the latency of activation between oscillators has to be approximately half the period of the oscillation. It is possible, however, that, although the rhythms we record are ostensibly much slower, at the actual site of reversal the apparent rhythm may be at the requisite theta frequency and, thus, the reversals could indeed be mediated by these previously described mechanisms.
In vivo, the situation is likely to be more complicated still. First, there are practical issues regarding the interpretation of our recordings: our in vitro studies used intracellular recordings from relatively close pyramidal cells (generally <1 mm separation), whereas the human recordings were extracellular, derived from electrodes located sometimes centimeters apart. The intracellular recordings, because they all derive from the same cell class (layer 5 pyramidal cells), should have a consistent temporal relationship with the extracellular signal, so there should be no interpretative issues regarding intracellular versus extracellular recordings. The much greater distances between subdural electrodes may introduce aliasing issues, but this does not alter the fact that the timing of peaks at individual electrodes shows great jitter (relative to other electrodes), also suggesting the same conclusion: that the source of afterdischarges is highly variable.
Slowly propagating in vivo events (Jasper, 1969; Blume et al., 2001) should seed activity from an annulus of increasing radius, and, with the complexities of long range axonal projections, there is the possibility for reentry loops and an inhomogeneous spread of activity through the tissue (Alarcon et al., 1997). As such, we may have seen different patterns of activity in our in vitro preparations if we had sectioned in a different plane (Gloveli et al., 2005) or even cut tangentially (Schiff et al., 2007), although the same principles of the effects of differential refractoriness with slowly propagating waves should apply whatever the sectioning angle. Indeed, there is supporting evidence for this view from human EEG studies of patients with temporal lobe epilepsy in which the pathology is localized to one hemisphere: after the spread to the contralateral hemisphere, the late ictal discharges can often be more prominent there (Binnie et al., 1994). As for rapidly propagating in vivo events, when large cortical territories are likely to be equally refractory, there should be many potential triggers for afterdischarges. Thus, as with the deceptive localizing information associated with interictal discharges (Lieb et al., 1981; Alarcon et al., 1994, 1997; Binnie et al., 1994), the relationship between afterdischarge sources and the actual ictal focus is likely to be obscure and probably not useful for identifying the key pathological locus.
Footnotes
This work was supported by the Epilepsy Foundation of America, the National Institute of Neurological Disorders and Stroke, and the Kavli Foundation. We thank Drs. Stewart Boyd, Helen Cross, Leo Towle, and Michael Kohrman for their role in providing the human data, and Dr. Boyd also for discussion of clinical issues. We also thank Dr. Fiona Le Beau for commenting on previous drafts of this manuscript.
Conflict of interest statement: The authors declare no competing financial interests.
References
- Alarcon G, Guy CN, Binnie CD, Walker SR, Elwes RD, Polkey CE. Intracerebral propagation of interictal activity in partial epilepsy: implications for source localisation. J Neurol Neurosurg Psychiatry. 1994;57:435–449. doi: 10.1136/jnnp.57.4.435. [DOI] [PMC free article] [PubMed] [Google Scholar]
- Alarcon G, Garcia Seoane JJ, Binnie CD, Martin Miguel MC, Juler J, Polkey CE, Elwes RD, Ortiz Blasco JM. Origin and propagation of interictal discharges in the acute electrocorticogram. Implications for pathophysiology and surgical treatment of temporal lobe epilepsy. Brain. 1997;120:2259–2282. doi: 10.1093/brain/120.12.2259. [DOI] [PubMed] [Google Scholar]
- Albowitz B, Kuhnt U. Epileptiform activity in the guinea-pig neocortical slice spreads preferentially along supragranular layers—recordings with voltage-sensitive dyes. Eur J Neurosci. 1995;7:1273–1284. doi: 10.1111/j.1460-9568.1995.tb01117.x. [DOI] [PubMed] [Google Scholar]
- Anderson WW, Lewis DV, Swartzwelder HS, Wilson WA. Magnesium-free medium activates seizure-like events in the rat hippocampal slice. Brain Res. 1986;398:215–219. doi: 10.1016/0006-8993(86)91274-6. [DOI] [PubMed] [Google Scholar]
- Bao W, Wu JY. Propagating wave and irregular dynamics: spatiotemporal patterns of cholinergic theta oscillations in neocortex in vitro. J Neurophysiol. 2003;90:333–341. doi: 10.1152/jn.00715.2002. [DOI] [PMC free article] [PubMed] [Google Scholar]
- Bekkers JM, Stevens CF. Presynaptic mechanism for long-term potentiation in the hippocampus. Nature. 1990;346:724–729. doi: 10.1038/346724a0. [DOI] [PubMed] [Google Scholar]
- Binnie CD, Elwes RD, Polkey CE, Volans A. Utility of stereoelectroencephalography in preoperative assessment of temporal lobe epilepsy. J Neurol Neurosurg Psychiatry. 1994;57:58–65. doi: 10.1136/jnnp.57.1.58. [DOI] [PMC free article] [PubMed] [Google Scholar]
- Blume WT, Ociepa D, Kander V. Frontal lobe seizure propagation: scalp and subdural EEG studies. Epilepsia. 2001;42:491–503. doi: 10.1046/j.1528-1157.2001.26700.x. [DOI] [PubMed] [Google Scholar]
- Chervin RD, Pierce PA, Connors BW. Periodicity and directionality in the propagation of epileptiform discharges across neocortex. J Neurophysiol. 1988;60:1695–1713. doi: 10.1152/jn.1988.60.5.1695. [DOI] [PubMed] [Google Scholar]
- Cossart R, Aronov D, Yuste R. Attractor dynamics of network UP states in the neocortex. Nature. 2003;423:283–288. doi: 10.1038/nature01614. [DOI] [PubMed] [Google Scholar]
- Cunningham MO, Halliday DM, Davies CH, Traub RD, Buhl EH, Whittington MA. Coexistence of gamma and high-frequency oscillations in rat medial entorhinal cortex in vitro. J Physiol (Lond) 2004;559:347–353. doi: 10.1113/jphysiol.2004.068973. [DOI] [PMC free article] [PubMed] [Google Scholar]
- Derchansky M, Rokni D, Rick JT, Wennberg R, Bardakjian BL, Zhang L, Yarom Y, Carlen PL. Bidirectional multisite seizure propagation in the intact isolated hippocampus: the multifocality of the seizure “focus”. Neurobiol Dis. 2006;23:312–328. doi: 10.1016/j.nbd.2006.03.014. [DOI] [PubMed] [Google Scholar]
- Dreier JP, Heinemann U. Late low magnesium-induced epileptiform activity in rat entorhinal cortex slices becomes insensitive to the anticonvulsant valproic acid. Neurosci Lett. 1990;119:68–70. doi: 10.1016/0304-3940(90)90757-z. [DOI] [PubMed] [Google Scholar]
- Dreier JP, Zhang CL, Heinemann U. Phenytoin, phenobarbital, and midazolam fail to stop status epilepticus-like activity induced by low magnesium in rat entorhinal slices, but can prevent its development. Acta Neurol Scand. 1998;98:154–160. doi: 10.1111/j.1600-0404.1998.tb07286.x. [DOI] [PubMed] [Google Scholar]
- Dzhala VI, Staley KJ. Transition from interictal to ictal activity in limbic networks in vitro. J Neurosci. 2003;23:7873–7880. doi: 10.1523/JNEUROSCI.23-21-07873.2003. [DOI] [PMC free article] [PubMed] [Google Scholar]
- Finnerty GT, Jefferys JG. 9–16 Hz oscillation precedes secondary generalization of seizures in the rat tetanus toxin model of epilepsy. J Neurophysiol. 2000;83:2217–2226. doi: 10.1152/jn.2000.83.4.2217. [DOI] [PubMed] [Google Scholar]
- Flint AC, Maisch US, Kriegstein AR. Postnatal development of low [Mg2+] oscillations in neocortex. J Neurophysiol. 1997;78:1990–1996. doi: 10.1152/jn.1997.78.4.1990. [DOI] [PubMed] [Google Scholar]
- Gloveli T, Dugladze T, Rotstein HG, Traub RD, Monyer H, Heinemann U, Whittington MA, Kopell NJ. Orthogonal arrangement of rhythm-generating microcircuits in the hippocampus. Proc Natl Acad Sci USA. 2005;102:13295–13300. doi: 10.1073/pnas.0506259102. [DOI] [PMC free article] [PubMed] [Google Scholar]
- Jasper HH. Mechanisms of propagation: extracellular studies. In: Jasper HH, Ward AA, Pope A, editors. Basic mechanisms of the epilepsies, including hippocampus. New York: Plenum; 1969. [Google Scholar]
- Larkman AU, Jack JJ. Synaptic plasticity: hippocampal LTP. Curr Opin Neurobiol. 1995;5:324–334. doi: 10.1016/0959-4388(95)80045-x. [DOI] [PubMed] [Google Scholar]
- Lieb JP, Engel J, Jr, Gevins A, Crandal PH. Surface and deep EEG correlates of surgical outcome in temporal lobe epilepsy. Epilepsia. 1981;22:515–538. doi: 10.1111/j.1528-1157.1981.tb04124.x. [DOI] [PubMed] [Google Scholar]
- Luhmann HJ, Dzhala VI, Ben-Ari Y. Generation and propagation of 4-AP-induced epileptiform activity in neonatal intact limbic structures in vitro. Eur J Neurosci. 2000;12:2757–2768. doi: 10.1046/j.1460-9568.2000.00156.x. [DOI] [PubMed] [Google Scholar]
- MacLean JN, Watson BO, Aaron GB, Yuste R. Internal dynamics determine the cortical response to thalamic stimulation. Neuron. 2005;48:811–823. doi: 10.1016/j.neuron.2005.09.035. [DOI] [PubMed] [Google Scholar]
- Netoff TI, Clewley R, Arno S, Keck T, White JA. Epilepsy in small-world networks. J Neurosci. 2004;24:8075–8083. doi: 10.1523/JNEUROSCI.1509-04.2004. [DOI] [PMC free article] [PubMed] [Google Scholar]
- Pfeiffer M, Draguhn A, Meierkord H, Heinemann U. Effects of gamma-aminobutyric acid (GABA) agonists and GABA uptake inhibitors on pharmacosensitive and pharmacoresistant epileptiform activity in vitro. Br J Pharmacol. 1996;119:569–577. doi: 10.1111/j.1476-5381.1996.tb15710.x. [DOI] [PMC free article] [PubMed] [Google Scholar]
- Pinto DJ, Patrick SL, Huang WC, Connors BW. Initiation, propagation, and termination of epileptiform activity in rodent neocortex in vitro involve distinct mechanisms. J Neurosci. 2005;25:8131–8140. doi: 10.1523/JNEUROSCI.2278-05.2005. [DOI] [PMC free article] [PubMed] [Google Scholar]
- Prince DA, Connors BW, Benardo LS. Mechanisms underlying interictal-ictal transitions. Adv Neurol. 1983;34:177–187. [PubMed] [Google Scholar]
- Schiff SJ, Huang X, Wu J-Y. Dynamical evolution of spatiotemporal patterns in mammalian middle cortex. Phys Rev Lett. 2007;98:178102. doi: 10.1103/PhysRevLett.98.178102. [DOI] [PMC free article] [PubMed] [Google Scholar]
- Steriade M. Neuronal substrates of sleep and epilepsy. Cambridge, UK: Cambridge UP; 2003. [Google Scholar]
- Thomas RC. Membrane current and intracellular sodium changes in a snail neurone during extrusion of injected sodium. J Physiol (Lond) 1969;201:495–514. doi: 10.1113/jphysiol.1969.sp008769. [DOI] [PMC free article] [PubMed] [Google Scholar]
- Traub RD, Miles R. Neuronal networks of the hippocampus. Cambridge: Cambridge UP; 1991. [Google Scholar]
- Traub RD, Jefferys JG, Miles R. Analysis of the propagation of disinhibition-induced after-discharges along the guinea-pig hippocampal slice in vitro. J Physiol (Lond) 1993;472:267–287. doi: 10.1113/jphysiol.1993.sp019946. [DOI] [PMC free article] [PubMed] [Google Scholar]
- Traub RD, Whittington MA, Buhl EH, LeBeau FE, Bibbig A, Boyd S, Cross H, Baldeweg T. A possible role for gap junctions in generation of very fast EEG oscillations preceding the onset of, and perhaps initiating, seizures. Epilepsia. 2001;42:153–170. doi: 10.1046/j.1528-1157.2001.26900.x. [DOI] [PubMed] [Google Scholar]
- Trevelyan AJ, Sussillo D, Watson BO, Yuste R. Modular propagation of epileptiform activity: evidence for an inhibitory veto in neocortex. J Neurosci. 2006;26:12447–12455. doi: 10.1523/JNEUROSCI.2787-06.2006. [DOI] [PMC free article] [PubMed] [Google Scholar]
- Trevelyan AJ, Sussillo D, Yuste R. Feedforward inhibition contributes to the control of epileptiform propagation speed. J Neurosci. 2007;27:3383–3387. doi: 10.1523/JNEUROSCI.0145-07.2007. [DOI] [PMC free article] [PubMed] [Google Scholar]
- Van Drongelen W, Koch H, Marcuccilli C, Pena F, Ramirez JM. Synchrony levels during evoked seizure-like bursts in mouse neocortical slices. J Neurophysiol. 2003;90:1571–1580. doi: 10.1152/jn.00392.2003. [DOI] [PubMed] [Google Scholar]
- Wadman WJ, Gutnick MJ. Non-uniform propagation of epileptiform discharge in brain slices of rat neocortex. Neuroscience. 1993;52:255–262. doi: 10.1016/0306-4522(93)90154-8. [DOI] [PubMed] [Google Scholar]
- Whittington MA, Traub RD, Jefferys JG. Erosion of inhibition contributes to the progression of low magnesium bursts in rat hippocampal slices. J Physiol (Lond) 1995a;486:723–734. doi: 10.1113/jphysiol.1995.sp020848. [DOI] [PMC free article] [PubMed] [Google Scholar]
- Whittington MA, Traub RD, Jefferys JG. Synchronized oscillations in interneuron networks driven by metabotropic glutamate receptor activation. Nature. 1995b;373:612–615. doi: 10.1038/373612a0. [DOI] [PubMed] [Google Scholar]
- Wong BY, Prince DA. The lateral spread of ictal discharges in neocortical brain slices. Epilepsy Res. 1990;7:29–39. doi: 10.1016/0920-1211(90)90051-v. [DOI] [PubMed] [Google Scholar]