Abstract
Tuning curves were recorded with patch electrodes from the inferior colliculus (IC) of awake bats to evaluate the tuning of the inputs to IC neurons, reflected in their synaptic tuning, compared with the tuning of their outputs, expressed in their discharge tuning. A number of unexpected features were revealed with whole-cell recordings. Among these was that most neurons responded to tones with inhibition and/or subthreshold excitation over a surprisingly broad frequency range. The synaptic tuning in many cells was at least 1.5–2.0 octaves wide and, on average, was more than twice as wide as the frequency range that evoked discharges even after inhibition was blocked. In most cells, tones evoked complex synaptic response configurations that varied with frequency, suggesting that these cells were not innervated by congruent excitatory and inhibitory projections. Synaptic tuning was not only wide but was also diverse, in which some cells were dominated by excitation (n = 20), others were dominated by excitation with sideband inhibition (n = 21), but most were dominated by inhibition with little evidence of excitation (n = 31). Another unexpected finding was that some cells responded with inhibition to the onset and offset of tones over a wide frequency range, in which the patterns of synaptic responses changed markedly with frequency. These cells never fired to tones at 50 dB sound pressure level but fired to frequency-modulated sweeps at that intensity and were directionally selective. Thus, the features revealed by whole-cell recordings show that the processing in many IC cells results from inputs spectrally broader and more complex than previously believed.
Keywords: in vivo whole-cell recordings, inferior colliculus, synaptic tuning, inhibition, tuning curves, FM directional selectivity
Introduction
Tuning curves define the frequency–intensity combinations that evoke discharges from auditory neurons and represent their most basic feature. The excitation evoked by frequencies within the tuning curve is often accompanied by inhibition, which acts to shape numerous discharge features (Faingold et al., 1989; Yang et al., 1992; Pollak and Park, 1993; Covey et al., 1996; Le Beau et al., 1996, 2001; Klug et al., 2002; Galazyuk et al., 2005). Moreover, sideband inhibition is also evoked by frequencies that flank the excitatory tuning curve (Suga, 1965; Yang et al., 1992; Fuzessery and Hall, 1996; Palombi and Caspary, 1996; LeBeau et al., 2001; Escabi and Schreiner, 2002; Fuzessery et al., 2006). Sideband inhibition acts to both sharpen tuning curves and shape the responses to broadband complex signals through the temporal interactions of inhibition and excitation evoked by the various spectral components of the signal.
The inferior colliculus (IC) is the site of the convergence of both excitatory and inhibitory projections from the majority of lower auditory nuclei and thus is the nexus of the ascending auditory system (Aitkin, 1985; Pollak and Casseday, 1986; Oliver and Huerta, 1992; Casseday et al., 2002). Consistent with the massive convergence, IC neurons express a variety of tuning configurations, as well as a host of other response properties, attributable in large part to the particular complement of inputs that innervate each neuron. Inhibitory inputs are especially important, and their impacts are manifest in the changes in tuning curves, response magnitudes, temporal discharge patterns, binaural properties, and selectivity for complex signals, such as frequency-modulated (FM) directional selectivity, that commonly occur in IC neurons when inhibitory receptors are blocked (Fuzessery and Hall, 1996; Palombi and Caspary, 1996; Koch and Grothe, 1998; LeBeau et al., 2001; Klug et al., 2002; Pollak et al., 2002, 2003; Xie et al., 2005; Andoni et al., 2007).
Inhibition, however, cannot be directly visualized with extracellular recordings but rather is inferred from the suppressive effects of some stimulus manipulation on the excitation evoked by another signal or inferred from increases in driven activity when inhibition is blocked. Inhibition can only be directly visualized with intracellular recordings. Over the past four decades, however, there have been only a few in vivo intracellular studies of the IC that used either sharp electrodes (Nelson and Erulkar, 1963; Kuwada et al., 1997; Pedemonte et al., 1997; Voytenko and Galazyuk, 2007) or whole-cell recordings (Casseday et al., 1994; Covey et al., 1996; Tan and Borst, 2007; Tan et al., 2007). Although those studies have shown the prevalence of sound-evoked inhibition in the IC with both monaural and binaural stimulation, the stimuli used to evoke responses in all of those studies used clicks, amplitude modulations, FM sweeps, or best frequency (BF) tones, the frequency to which the neuron is most sensitive, and only rarely were responses to additional off–BF frequencies presented.
Here we used patch electrodes to evaluate the tuning of IC neurons in awake bats and to determine the relationship between the inputs to each cell, reflected in its synaptic tuning and its outputs, expressed in its discharge tuning, with particular attention directed at inhibition. We show that, although discharge tuning curves recorded with patch electrodes are similar to those recorded extracellularly, there are some prominent differences. With patch recordings, many cells did not fire action potentials to tones, despite receiving sound-evoked innervation and responding with postsynaptic potentials (PSPs). Additionally, the range of frequencies that evoked PSPs was, on average, at least twice as broad as expected from extracellular studies, and, in most cells, PSPs were predominantly inhibitory. The patterns of PSPs were also surprisingly diverse, suggesting that many IC cells derive distinct inputs from different regions of the sensory surface. Finally, although tone-evoked responses in some cells were overwhelmingly inhibitory, they nevertheless fired to frequency-modulated sweeps.
Materials and Methods
Surgical procedures.
Experiments were conducted on Mexican free-tailed bats, Tadarida brasilensis mexicana, captured from local sources in Austin, Texas. Surgical procedures were done under general anesthetic. Bats were initially sedated with isoflurane (inhalation) and then anesthetized with 0.05 ml intraperitoneal injection of ketamine/xylazine mixture [ketamine at 8.17 ml (100 mg/ml) and xylazine at 1.32 ml (100 mg/ml) mixed with 40 ml of 0.9% NaCl (Henry Schein, Melville, NY)]. The bat's head was then secured by fitting the teeth of its upper jaw into a bite bar and a clamp fitted around the snout to hold the head firmly. The muscles and skin overlying the skull were reflected, a foundation layer of cyanoacrylate was placed on the surface of the skull, and Lidocaine ointment was applied topically to all open wounds. The bat was then transferred to a heated recording chamber and placed in a cushioned restraining apparatus attached to a custom-made stereotaxic instrument. A small metal rod was cemented to the foundation layer on the skull and then attached to a bar mounted on the stereotaxic instrument to ensure a uniform positioning of the head. The IC can be seen through the thin brain case as two white masses on either side of the midline, and an opening was made over one IC with a scalpel that cut out a small portion of the skull, which was removed. The dura was broken with a fine, polished needle, and a well was constructed around the opening with silicon grease. The brain was kept clean and moist with Ringer's solution. The bat was placed in a restraining cushion, placed in the stereotaxic device, the bar on its head was secured to the stereotaxic instrument, and the bite bar was removed. Recordings were begun after the bats recovered from the anesthetic, and thus all data were obtained from awake animals. The bats typically lay quietly during the remainder of the experiments. If they showed signs of discomfort, data collection stopped and doses of the neuroleptic ketamine hydrochloride (1:40 dilution, 0.01 cc injection; Henry Schien) were administered. All experimental procedures were in accordance with a protocol approved by the University of Texas Institutional Animal Care Committee.
Electrodes.
Electrodes were made from thick-walled (1.65 mm outer diameter, 1.1 mm inner diameter) capillary glass (PG52165-4; World Precision Insturments, Sarasota, FL) to minimize electrode capacitance. After pulling the proper configuration on a P-97 Flaming-Brown type puller (Sutter Instruments, Novato, CA), electrodes were filled with the following solution adjusted to pH 7.3 (in mm): 115 K-gluconate, 10 HEPES, 20 KCl, 4 MgATP, 0.3 Na2GTP, 0.5 EGTA, and 10 Na2 phosphocreatine. Electrodes with impedances ranging from 5 to 8 MΩ were placed in a pipette holder with a pressure port and the pipette holder attached to the piezoelectric microdrive (Burleigh Inchworm; EXFO Burleigh, Plano, TX). The pressure port was connected via tubing to a manometer and a valve that permits switching from positive to no pressure to negative pressure.
Signal generation, recording procedures, and signal processing.
Auditory stimuli were generated digitally in IGOR (WaveMetrics, Lake Oswego, OR). Custom software ran concurrently with IGOR to present sound stimuli and collect responses via an InstruTech (Port Washington, NY) ITC-18 analog-to-digital interface. Sampling rates for acoustic stimuli and data acquisition were 200 kHz. All signals were presented monaurally to the ear contralateral to the IC from which recordings were made. Acoustic stimuli were tone bursts and downward- and/or upward-sweeping FM sweeps with rise–fall times of 0.2 or 0.5 ms. Three to 10 repetitions of each stimulus were presented at a rate of two to four per second.
The acoustic signals that output from the InstruTech interface were fed to a custom-made electronic attenuator. The output of the attenuator was fed to one of two types of loudspeakers. Most experiments were conducted with custom-designed earphones biased with 200 V direct current. The design of the earphone is described by Schuller (1997) and is flat ±5 dB from ∼10 to 80 kHz. The earphone was inserted into the funnel formed by the bat's pinnae and positioned adjacent to the external auditory meatus. The acoustic attenuation between the ears was ∼40 dB. In a few experiments, sound was presented in the free field from a 3 inch ribbon tweeter (Fountek JP3.0; Madisound Speakers, Madison, WI) positioned ∼30–40° on the side contralateral to the IC from which recordings were made. The speaker was flat ±6 dB from approximately ∼3–80 kHz. Measurements of the frequency response of the speakers and of sound pressure levels (SPLs) were made with ¼ inch Brüel and Kjær (Norcross, GA) microphone cartridges. All acoustic signals were set to the same peak intensity that corresponded to 70 dB SPL when measured between 20 and 25 kHz.
The procedure we used to search for neurons was to first position the electrode over the IC and apply positive pressure. On entering the brain, the voltage offset was set to 0 and the electrode resistance was monitored. The electrode was initially advanced to a depth of ∼300 μm to traverse the pericentral nuclei and enter the central nucleus of the IC. On entering the central nucleus, the electrodes were advanced in steps of 1–2 μm under positive pressure to prevent tip contamination, and cells were searched for in current-clamp mode. An abrupt increase in electrode resistance indicated an encounter with a cell. On encountering a cell, positive pressure was turned off. The cells often sealed spontaneously, or, in other cases, a negative pressure was applied to obtain a gigaohm seal. After the seal was obtained, gentle negative pressure was applied to break-in, and both series resistance and capacitance were neutralized. Data collection then began. All responses were obtained in current-clamp mode.
Responses were recorded with a Dagan (Minneapolis, MN) BVC 700A Bridge and Voltage Clamp Amplifier. Data were digitized at 200 kHz by an InstruTech ITC-18/PCI and recorded on a Macintosh G5 (Apple Computers, Cupertino, CA) using a custom interface in the IGOR PRO environment. Data were collected in IGOR PRO, and the files were then analyzed off-line. The membrane potentials reported are those measured from recordings and were not corrected for liquid junction potential.
Measurements of tuning curves, tuned regions, and best frequencies.
The stimulus protocol presented to each neuron consisted of tone bursts at a fixed intensity of 50 dB SPL whose frequencies were varied over a range of 20–40 kHz. If recordings remained stable, the same frequencies were presented again at different intensities. In a few neurons, downward- and upward-sweeping FM signals were also presented.
Tuning curves were constructed from responses evoked by tones of different frequency–intensity combinations presented over a 30–40 dB intensity range in 10 or 20 dB increments. We distinguish between the tuning measured from discharges that show the output of the neuron, which we term discharge tuning, and the tuning of synaptic responses that reflect the inputs of the neuron, which we refer to as synaptic tuning. In some neurons, we did not obtain the full tuning curve but only recorded responses evoked by tones of various frequencies at one intensity, usually at 50 dB SPL. We refer to the range of frequencies that evoked responses, either synaptic or discharges, at one intensity as the “tuned region” of the neuron to distinguish it from the more complete description provided by the tuning curve.
The BF of each neuron, the frequency requiring the lowest intensity to evoke a response, was either determined from its tuning curve or estimated from its tuned region. For neurons that discharged to tones, the BF was the frequency in their tuning curve at which the lowest intensity evoked discharges. In the tuning curves of neurons that did not discharge to tones, the BF was the frequency at which the lowest intensity evoked a PSP, either an IPSP or an EPSP or a response composed of both excitation and inhibition. In neurons from which we did not obtain a full tuning curve but only their tuned regions, their BFs were estimated as the midfrequency of the frequency range that evoked discharges. BFs were not measured or estimated in neurons whose tuned regions were composed entirely of subthreshold excitation and/or inhibition with no discharges.
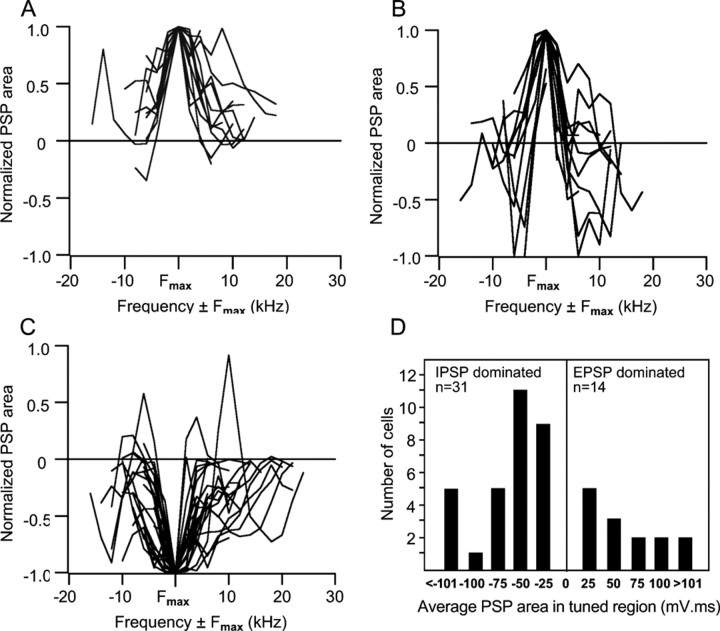
PSPs evoked within tuned regions were quantified by integrating responses evoked by each frequency. The membrane potential before sound presentation was set to 0. The area between the PSP response and baseline was calculated for each response within a 100 ms window after stimulus onset, so that depolarizing responses yielded a positive area and hyperpolarizing responses were negative. Action potentials were not incorporated in the integration, and, in records with action potentials, membrane potential values were interpolated between spikes. For responses that contained depolarizations and hyperpolarizations, the area was calculated by subtracting negative from positive values. The integrated responses were graphed in two ways. The first shows the normalized responses evoked across the frequencies of the tuned region of each neuron (see Fig. 7 A–C). In these graphs, responses were binned in 2 kHz increments, normalized to the largest (absolute value) PSP area (Fmax), and then aligned at Fmax. The second shows the average PSP area of each tuned region (see Fig. 7D). PSP areas for each frequency within the tuned region of the neuron were summed, and the sum was divided by the number of responses. The sign of the summed responses for neurons dominated by excitation was positive, whereas the sign of the summed responses of neurons dominated by inhibition was negative.
Figure 7.
Integrated PSP values for cells dominated by excitation, inhibition, and excitation with inhibitory sidebands. In theses graphs, the normalized PSP responses are aligned to the largest (absolute value) PSP area (Fmax) and graphed as responses evoked by frequencies above and below the frequency that evoked Fmax. A, Normalized PSP values in the tuned regions of 14 EPSP-dominated cells. Integrated PSP values are positive (depolarized) for responses evoked by almost every frequency in all cells. B, Normalized PSP values in the tuned regions of 17 cells that had excitatory regions flanked by inhibitory surrounds. The responses to Fmax were excitatory in all of these cell, but frequencies above and or below Fmax evoked strong inhibitions. C, Normalized PSP values in the tuned regions of 31 IPSP-dominated cells. Three cells have a prominent excitatory peak, appearing to be similar to the excitatory-dominated cells with sideband inhibition in B. The reason for the excitatory peaks is that a larger and longer-lasting excitation than inhibition was evoked by one or two frequencies in their tuned regions, whereas the responses evoked by all other frequencies were inhibitory. D, Average PSP areas in the tuned regions of cells dominated by IPSPs and cells dominated by EPSPs. The average PSP area in every IPSP-dominated cell was negative (hyperpolarized), whereas the average PSP area in every EPSP-dominated cell was positive (depolarized). Differences in the absolute values among EPSP-dominated or among IPSP-dominated cells were attributable to differences in PSP amplitudes and durations. Some of the differences were a consequence of the durations of the tone bursts, which were not the same in all cells and ranged from 10 to 50 ms among cells.
Measurement of chloride reversal potential.
Estimates of the chloride reversal potential were made in four neurons. Three to 10 repetitions of tone bursts that evoked a response configuration that had both hyperpolarizations and depolarizations were presented, and responses were recorded at the normal resting potential. Hyperpolarizing current was then applied that shifted the membrane potential by −5 mV, and the same tone bursts were presented again. This procedure was repeated several times, so that the tone-evoked responses were obtained at membrane potentials ranging from 5 to 20 mV more negative than the normal resting potential. The chloride reversal potential was estimated to be midway between the most negative membrane potential at which the hyperpolarizations were still present and the next more negative membrane potential at which the hyperpolarization reversed to a depolarization. Those values ranged between −58 and −63 mV, and our estimate of the chloride reversal potential was approximately −60 mV.
There are, however, uncertainties in our estimates of the chloride equilibrium potential. One is the adequacy of the space clamp. We did not know whether the same membrane potential measured through the patch electrode reflected the membrane potential on the dendrites. In short, the reversal potential may indeed have been, or may not have been, more positive than we estimated. A second uncertainty is the assumption that the dialysis was complete and that each cell actually had the same internal chloride concentration as the patch electrodes. No doubt some dialysis occurred and brought the internal chloride concentration closer to that in the patch electrode, but how much closer and to what degree in each cell is unknown. One reason is that the series resistance was fairly high (50–100 mΩ) with in vivo recordings, thereby hindering dialysis.
Nevertheless, we obtained chloride reversal potential estimates from four IC cells in four different animals, and the four measurements were in close agreement. We therefore feel that −60 mV is a reasonable estimate of the chloride reversal potential.
Results
Whole-cell recordings were obtained from 72 neurons in the central nucleus of the IC that had an average resting potential of −49 ± 6 mV. Cells recorded with patch electrodes had little or no spontaneous discharge activity, a feature also found in previous extracellular studies of the IC in bats (Bauer et al., 2000; Hurley and Pollak, 2001; Klug et al., 2002). Neurons were recorded at depths ranging from ∼300 to 900 μm. The average depth was 541 μm, and most (75%) were recorded between 400 and 600 μm. Tuning curves, the responses evoked by tones over a wide range of frequency–intensity combinations, were obtained from 40 cells, whereas tuned regions, responses evoked by a range of frequencies at only one intensity, were obtained from 32 other cells.
Below, the results are presented in four sections. In the first section, we describe the discharge and synaptic tuning curves recorded with patch electrodes and compare that tuning with the discharge tuning curves obtained from IC cells in a previous extracellular study. In the second section, we compare the range of frequencies that evoke discharges at one intensity, the tuned region of discharges, with the range of frequencies that evoke synaptic responses at the same intensity. In the third section, we focus on the various temporal patterns of synaptic responses evoked by different frequencies at one intensity, i.e., the synaptic response patterns in the tuned region of the neuron. We consider these features because the changes or lack of changes in PSP configuration with frequency offer insights into the degree to which each cell received inputs from multiple sources. In the last section, we show in greater detail the response properties of cells whose tone-evoked synaptic responses were dominated by inhibition and compare their responses evoked by tones with responses evoked by FM sweeps.
Comparison of discharge tuning measured with patch and extracellular electrodes
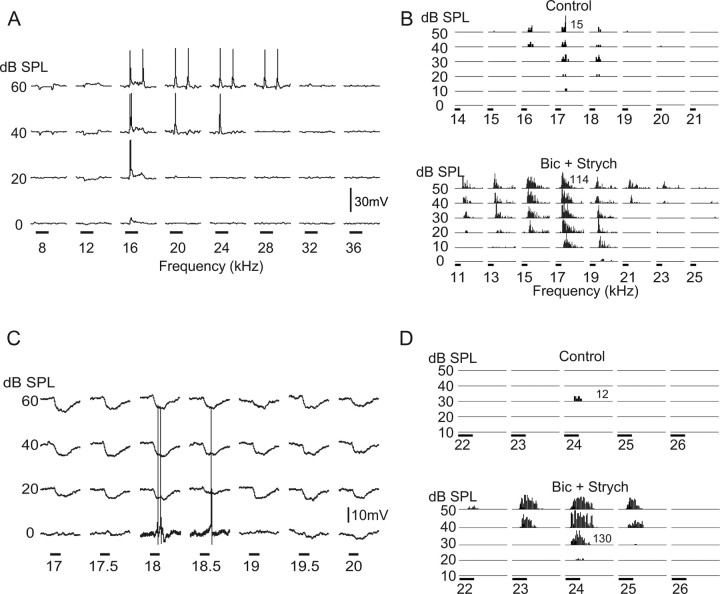
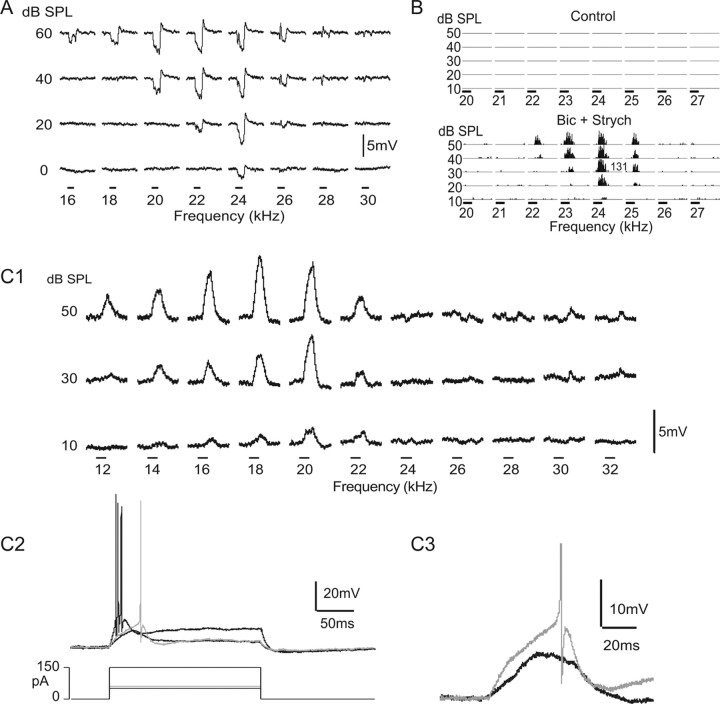
Representative examples of tuning curves recorded from 40 cells with patch electrodes are shown in Figures 1 and 2, together with comparable discharge tuning curves recorded with extracellular electrodes in a previous study of the IC in Mexican free-tailed bats (Xie et al., 2005). Three general types of discharge tuning curves were observed with both methods: (1) V-shaped tuning curves (Fig. 1A,B); (2) upper-threshold tuning curves (Fig. 1C,D), in which the tuning was bounded by both low and high thresholds; and (3) null tuning (Fig. 2A,B,C1), in which neurons did not fire to tones at any frequency–intensity combination. Null tuning may seem surprising because almost all studies of tuning focus on tone-evoked responses that are presented as discharge tuning curves. However, IC cells that did not respond to tones have been noted in studies conducted in several species of bats by other investigators (Suga, 1965, 1968; Casseday and Covey, 1992; Casseday et al., 1997; Fuzessery et al., 2006). Thus, IC neurons that fail to discharge to tones have been seen by other investigators, but that feature was not emphasized and may be underappreciated because none of those studies showed a figure of a null tuning curve.
Figure 1.
Neurons with V-shaped tuning curves (A, B) and upper-threshold tuning curves (C, D). The tuning curves in A and C were recorded with patch electrodes and show both the discharge and synaptic tuning of two IC neurons. The tuning curves in B and D are from two IC cells that were recorded with extracellular electrodes in a previous study by Xie et al. (2005). A, A neuron with a V-shaped discharge tuning curve with wide range of synaptic tuning and sideband inhibition. Notice the frequency increments are in steps of 4.0 kHz. Tone bursts were 50 ms, indicated by the time bars. Nonspiking responses are averages of 10 trials, and spikes are single traces. Resting potential was −48 mV. A more detailed and amplified view of the tuning at 60 dB SPL is shown in Figure 6B. B, V-shaped tuning curve recorded extracellularly that expanded markedly on both high- and low-frequency sides of the BF when inhibition was blocked. The scale of the histograms in the control and tuning curves when inhibition was blocked are not the same. The higher spike counts evoked when inhibition was blocked are indicated by the numbers in each tuning curve, which show the highest spike count of each curve. Tone duration was 10 ms as shown by time bars. C, Tuning curve of an upper-threshold cell recorded with a patch electrode showing the prominent inhibition evoked by most frequency–intensity combinations. Resting potential was −44 mV. Time bars, 50 ms. Nonspiking responses are averages of five trials, and spikes are single traces. D, An upper-threshold neuron recorded with an extracellular electrode before (control) and the release from inhibition that allowed an underlying suprathreshold excitation to be expressed when inhibition was blocked by bicuculline (Bic) and strychnine (Strych). Time bars, 15 ms.
Figure 2.
Tuning curves of two null-tuned cells recorded with patch electrodes (A, C1) and from another null-tuned cell recorded with an extracellular electrode (B). A, Null tuning curve from a cell whose responses were dominated by inhibition. Traces are averages of five trials. Time bars, 50 ms. Resting potential was −46 mV. B, Null tuning curves recorded with an extracellular electrode. When inhibition was blocked by bicuculline (Bic) and strychnine (Strych), the underlying suprathreshold excitation that was completely suppressed by inhibition was released and allowed the cell to express a V-shaped tuning curve. Time bars, 15 ms. C1, Another null-tuned neuron recorded with a patch electrode whose responses were dominated by subthreshold excitation. Time bars, 50 ms. C2, Responses of the same cell in C1 evoked by injections of depolarizing current steps. Current injections of +60 pA evoked a single action potential (gray trace), and higher current steps (+150 pA) evoked multiple action potentials. Lower currents were subthreshold. C3, Enlarged trace showing the threshold response evoked by +60 pA current injection (gray trace) and the subthreshold depolarization evoked by 18 kHz tone at 50 dB SPL (black trace), the largest tone-evoked response recorded. Resting potential was −55 mV.
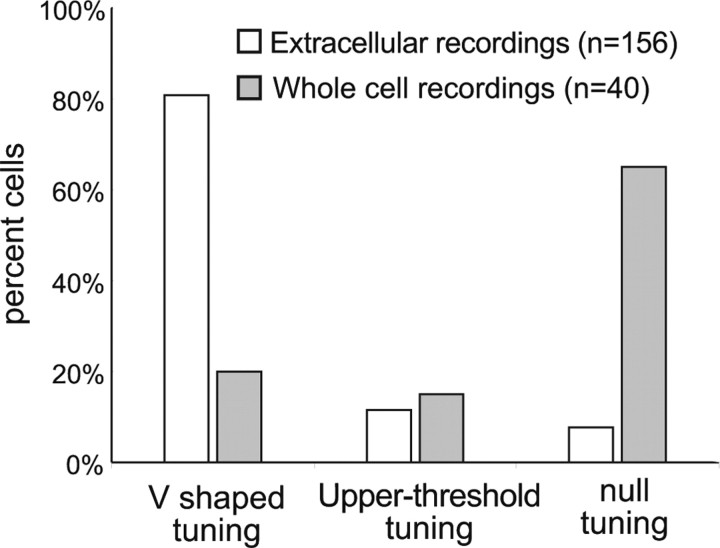
Although comparable types of discharge tuning curves were obtained with both extracellular and patch recordings, the percentages of V-shaped and null tuning curves were markedly different with the two methods (Fig. 3). A far larger percentage of neurons with V-shaped tuning was obtained with extracellular than with patch electrodes (81% with extracellular and 20% with patch). In contrast, a higher percentage of null tuning was obtained with patch than with extracellular recordings (8% with extracellular and 65% with patch). The percentages of upper-threshold tuning were approximately the same with the two methods (12% with extracellular and 15% with patch).
Figure 3.
Histograms showing the percentage of V-shaped, upper-threshold, and null tuning curves recorded with patch electrodes in the present study compared with the percentages recorded in the previous study of the IC by Xie et al. (2005) with extracellular electrodes.
Tuning curves recorded extracellularly with multibarrel electrodes and tuning curves recorded with patch electrodes provide two complementary views of inhibition and how it shapes the discharge tuning curves of most IC neurons. With extracellular recordings, sideband inhibition, the inhibition evoked by frequencies higher or lower than those that evoked discharges, cannot be seen directly, but rather its effects are revealed when inhibition is blocked by the iontophoretic application of bicuculline and strychnine. Blocking inhibition allowed the cells to respond to sounds that had previously been outside their excitatory tuning curves, thereby causing discharge tuning curves to expand. Whole-cell recordings, conversely, show the inhibition evoked by sideband frequencies but do not directly show the degree to which the sideband inhibition sharpened discharge tuning.
The influences of inhibition in shaping tuning curves were apparent from the expansion of discharge tuning with extracellular recordings when inhibition was blocked by bicuculline and strychnine, as shown in Figures 1 and 2. The neuron in Figure 1B had a V-shaped tuning curve that expanded substantially at most intensities when inhibition was blocked. Of the 39 IC neurons with V-shaped tuning curves recorded with extracellular electrodes by the Xie et al. (2005), the tuning curves of 29 neurons expanded when inhibition was blocked, showing that sideband inhibition sharpened the tuning in many IC cells. The effects of blocking inhibition were even more dramatic in the upper-threshold and null tuning curves of IC cells that were recorded extracellularly. As shown in Figures 1D and 2B, blocking inhibition caused both the upper-threshold tuning curve and the null tuning curve to change into V-shaped tuning curves. The tuning expansion was seen in each of the seven upper-threshold and three null-tuned cells recorded with extracellular electrodes, showing that these cells received stronger inhibitory than excitatory innervations that prevented firings and thereby created the upper-threshold and null features.
The inhibition evoked by frequencies that flanked discharge tuning curves was directly visualized with whole-cell recordings. For example, the V-tuned cell in Figure 1A had substantial sideband inhibition on both the low- and high-frequency sides of the frequencies that evoked discharges. Upper-threshold tuning curves obtained with patch recordings had extensive inhibition evoked by most or all frequencies, as illustrated by the neuron in Figure 1C. The global suppressive influences of inhibition were even more apparent from the patch recordings of null-tuned cells. Nineteen of the 26 null-tuned cells had dominant inhibitory responses at all frequency–intensity combinations, as illustrated by the cell in Figure 2A. In this cell, most frequencies also evoked depolarizations that either preceded or followed the strong hyperpolarizations. If inhibition were blocked in this cell, those excitatory events may well have been expressed as sound-evoked discharges and a change to a V-shaped tuning curve, as in the cell shown in Figure 2B that was recorded extracellularly.
Seven of the null-tuned cells, however, were not dominated by IPSPs, but rather their tuning curves were composed mainly of EPSPs (Fig. 2C1). It is noteworthy that, although tones failed to evoke discharges in these cells, injecting depolarizing current steps always evoked discharges, a feature shown in Figure 2C. The threshold for evoking discharges could be estimated by the membrane potential that first evoked discharges in the current injection records. The resting potential in the cell shown in Figure 2C was −55 mV, and the estimated spike threshold was −40 mV. The largest EPSP evoked by tones in this cell was approximately −46 mV and was below threshold (Fig. 2C3, black trace). The same analysis on six other null cells also showed that the tone-evoked depolarizations were below spike threshold. Although tones evoked EPSPs, a “pure” EPSP does not mean that only excitatory events were evoked by that stimulus. Rather, it is likely that every postsynaptic potential reflected the net change in membrane potential generated by increases in both excitatory and inhibitory conductances, in which one conductance, excitatory in these cells, dominated because of its relative timing and/or magnitude and attenuated or even completely masked the effects of the other.
Synaptic tuning is wider than discharge tuning
In the previous section, the receptor blockers revealed hidden suprathreshold excitations on the flanks of the tuning curve that were normally rendered subthreshold by inhibition, which caused tuning curves to expand when inhibition was blocked. However, the extracellular recordings could not reveal whether even higher or lower frequencies, beyond the frequencies of sideband inhibition, might have evoked either pure inhibitory or subthreshold excitatory responses. Below we explore the extent of tuning in greater detail and show that the range of frequencies that evoke synaptic responses is substantially wider than that indicated by the expansion of discharge tuning, even after accounting for the sideband inhibition that sharpened tuning curves.
To compare the bandwidths of discharge and synaptic tuning, we measured the bandwidths of tuned regions. For discharge tuning, we measured the range of frequencies that evoked discharges at 50 dB SPL while inhibition was blocked in extracellular recordings and compared those bandwidths with the range of frequencies that evoked synaptic responses, EPSPs and/or IPSPs, recorded with patch electrodes in other neurons. The discharge tuning while inhibition was blocked was obtained from 49 of the 156 cells recorded with extracellular electrodes in the previous study by Xie et al. (2005). The synaptic tuning was from 67 cells, 49 of which had tuned regions measured at 50 dB SPL. The tuning curves in 18 other cells were generated with intensity increments of 20 dB and thus we only had tuned regions at 0, 20, 40, or 60 dB SPL. To be conservative, we used the synaptic tuning at 40 dB for those 18 cells. Five cells were not included because they were tested with a very narrow range of frequencies (<10 kHz) and were responding strongly to both the lowest and highest frequencies.
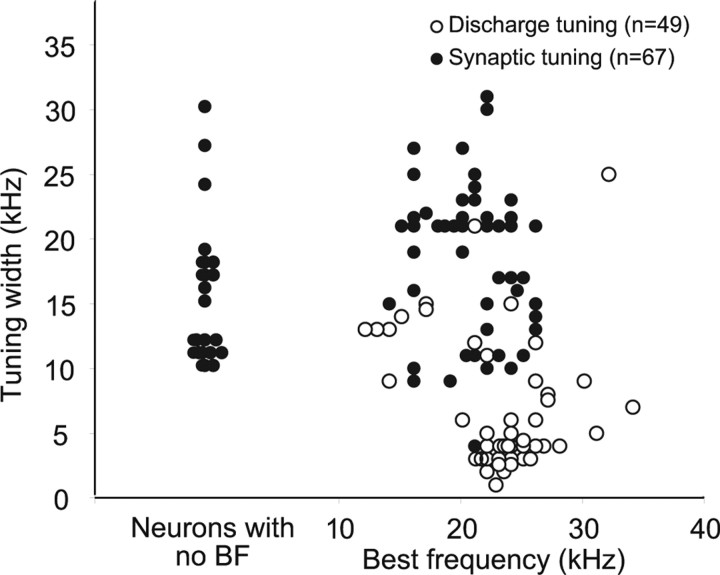
The distributions of discharge and synaptic tuning bandwidths are shown in Figure 4. The significant point is that the bandwidth of synaptic tuning was substantially broader than discharge tuning in the majority of cells. With extracellular recordings, the average bandwidth of discharge tuned regions at 50 dB SPL was 7.1 ± 5.4 kHz while inhibition was blocked (n = 49). In contrast, the average bandwidth of synaptic tuned regions obtained with whole-cell recordings was 17.6 ± 6.6 kHz (n = 67). Thus, the synaptic tuning was, on average, 10.5 kHz wider and more than double the average bandwidth of the discharge-tuned regions measured while inhibition was blocked. Additionally, the BFs of the two sample populations were similar. With patch recordings, the average BF was 20.8 ± 3.6 kHz, and, with extracellular recordings, the average BF after inhibition was blocked was 23.3 ± 4.5 kHz. The average BFs of both samples are in close agreement with the frequencies that are overrepresented in the auditory system of this species, from ∼20 to 25 kHz (Vater and Siefer, 1995; Bauer et al., 2000; Klug et al., 2002).
Figure 4.
Distributions of widths of discharge tuning from cells recorded in a previous extracellular study and synaptic tuning recorded in this study. Discharge tuning is widths of tuning curves at 50 dB SPL while inhibition was blocked. Synaptic tuning is widths of tuned regions at 50 dB SPL from 49 IC cells and from the tuned regions of 18 other IC cells at 40 dB SPL. The tuned regions at 50 dB SPL were not determined in the 18 cells because their tuning curves were generated in increments of 20 dB, at 0, 20, 40, and 60 dB SPL. The tuning width at 40 dB was used in those cells. Notice that the distribution of BFs of the two samples was similar. Widths of synaptic tuning of cells shown at the far left are for cells in which a BF could not be determined because there were no spikes in their tuned regions at 50 dB SPL. The tuning widths of those cells are included because their widths were evaluated with a similar range of frequencies as those presented to other neurons, from ∼10 to 30 kHz. Average discharge tuning width was 7.1 ± 5.4 kHz (n = 49). Average synaptic tuning was 17.6 ± 6.0 kHz (n = 67).
The 10.5 kHz difference between discharge and synaptic tuning is a conservative estimate and is surely larger than our measures indicate. The reason is that there was little or no spontaneous activity in the IC of bats, and thus the limits of the discharge-tuned regions were unambiguous in most cells. With whole-cell recordings, we usually presented a 15–30 kHz range of frequencies, and synaptic responses were commonly still evoked by the lowest and/or highest frequencies presented (Figs. 5B, 6B). Moreover, in 18 cells, the bandwidth of synaptic tuning was measured at a level 10 dB lower than the sound level at which discharge tuning was measured. Because the full range of frequencies that could evoke synaptic responses was usually not presented and the levels of 18 tuned regions were at 40 dB SPL, the bandwidths of the tuned synaptic regions at 50 dB SPL were underestimated. Even with this underestimate, the range of frequencies that evoked synaptic responses in many IC cells was wide, sometimes spanning two octaves or more as we show below and was substantially wider than had been suspected from studies of discharge tuning.
Figure 5.
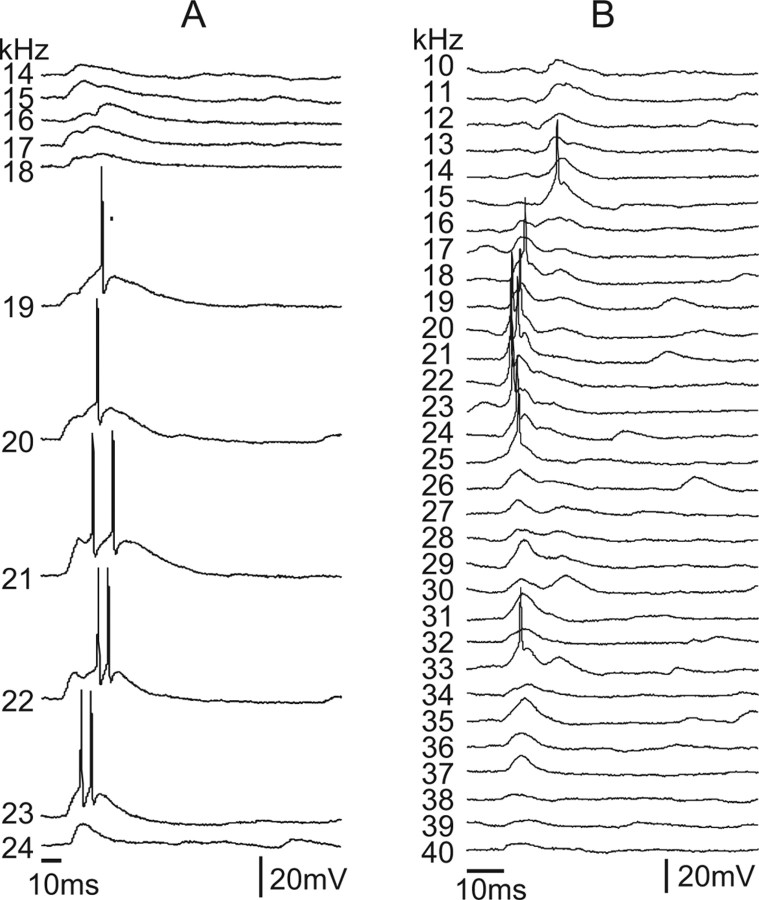
Two neurons whose tuned regions were dominated by EPSPs. A, Only subthreshold and suprathreshold excitations were evoked by 10 ms tone bursts at 50 dB SPL. Resting potential was −50 mV. B, Another EPSP-dominated neuron in which 10 ms tones at 50 dB SPL evoked suprathreshold EPSPs from ∼15 to 25 kHz and mostly subthreshold EPSPs from ∼26 to 40 kHz. Small IPSPs that preceded the EPSPs were evoked on the low-frequency side of the tuned region, from ∼13 to 10 kHz. Resting potential was −50 mV. All traces are single trials in both neurons.
Figure 6.
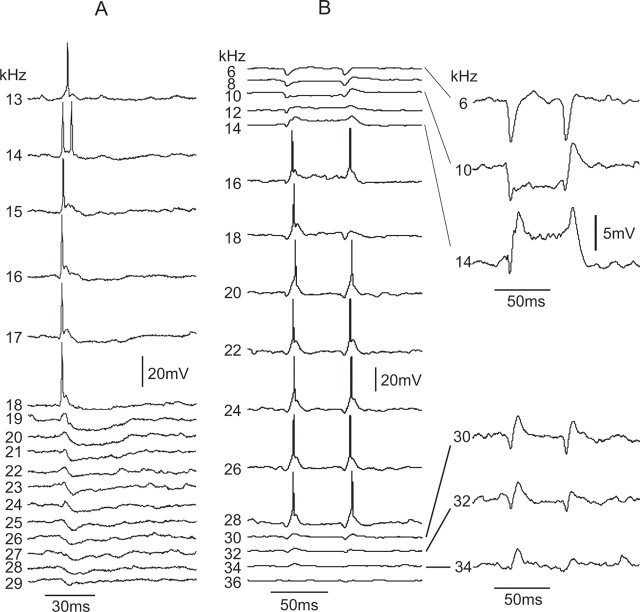
Two cells in which a range of frequencies evoked predominantly EPSPs and sideband frequencies evoked either IPSPs or a subthreshold EPSP–IPSP configuration. A, Cell that responded to “low” frequencies, from 13 to 18 kHz, predominantly with EPSPs and discharges. Higher frequencies, from 19 to 25 kHz, evoked EPSPs that appeared to be suppressed to subthreshold levels by longer-lasting IPSPs. Synaptic responses evoked by frequencies from ∼26 to 29 kHz were largely small IPSPS. Tone bursts were 30 ms at 50 dB SPL. Resting potential was −50 mV. B, Cell with central excitatory region flanked on both high low sides by inhibition. Frequencies immediately below the excitatory region, at 14 kHz, evoked a synaptic configuration similar to the higher, suprathreshold frequencies, but the inhibition appeared to suppress the excitation. Lower frequencies, from 12 kHz and below, evoked strong inhibition. Similar features were seen on the high frequencies, from ∼30 to 34 kHz. Insets on right show magnified views of PSP responses. Tone bursts were 50 ms at 60 dB SPL. Resting potential was −48 mV. This is the same cell whose tuning curve is shown in Figure 1B. In both neurons, nonspiking traces are averages of 10 trials, and spiking traces are single trials.
Synaptic response patterns in tuned regions
A wide variety of tuned regions were recorded that varied continuously in the complexities of evoked synaptic responses and the bandwidths of the synaptic tuning. Although the types of tuned regions were continuous, we placed cells into one of three categories, based on the degree to which the PSPs within their tuned regions were predominantly EPSPs (n = 14), mixtures of EPSPs in their excitatory regions and IPSPs evoked by sideband frequencies (n = 21), or predominantly IPSPs (n = 31). Neurons in the three major groups were not homogeneous. Rather, there were numerous subtypes within each group, in which subtypes differed in two features: (1) the bandwidth of their synaptic tuning and/or (2) in the variety of the temporal patterns of the PSPs evoked by the different frequencies of their tuned regions. Because the tuned synaptic regions were often very broad, in the following figures we plot tuned regions vertically rather than horizontally, such that the responses are stacked from those evoked by the lowest frequencies at the top to responses evoked by progressively higher frequencies beneath so that the responses evoked by the highest frequencies are at the bottom.
Although the tuned regions of 20 neurons were dominated by EPSPs, the resting potentials of six cells were between −55 to −58 mV and thus close to our estimates of the chloride reversal potential (approximately −60 mV; see Materials and Methods). These cells had large sound-evoked EPSPs, but we are unsure about whether they had prominent sideband inhibitory regions that were not expressed as IPSPs attributable to shunting inhibition. Given this uncertainty, we only include the remaining 14 neurons, which had more depolarized resting potentials, at or approximately −50 mV, in the group of neurons whose tuned regions were dominated by EPSPs. Two neurons whose tuned regions were dominated by EPSPs are shown in Figure 5. The resting potentials of both cells were −50 mV, and EPSPs were evoked by all frequencies with either little (Fig. 5B) or no evidence of any IPSPs (Fig. 5A), even by frequencies that flanked those that evoked discharges. The major difference between the two cells was that the bandwidths of both their discharge and synaptic regions were substantially broader in the cell in Figure 5B than the cell in Figure 5A.
The dominance of excitation in the 14 cells was quantified by integrating the area under the PSPs evoked by each frequency in their tuned regions. Figure 7A shows the normalized PSP values in the tuned regions of all 14 EPSP-dominated cells. In theses graphs, the normalized PSP responses are aligned to the largest (absolute value) PSP area (Fmax) and graphed as responses evoked by frequencies above and below the frequency that evoked Fmax. We also calculated the average PSP value summed over all frequencies for each of the cells (the average PSP in the tuned region). As shown in Figure 7D, the average PSP value of the entire tuned region was positive for every cell in this category, confirming that the tuned regions of these cells were dominated by excitation.
The tuned regions of other cells had an excitatory frequency region of predominantly EPSPs that was flanked on the high, low, or both sides by prominent IPSPs or responses composed of a combination of IPSP–EPSPs. Two neurons with sideband inhibition that displayed marked differences in bandwidth and PSP configurations within their tuned regions are shown in Figure 6. All neurons with V-shaped tuning curves were dominated by EPSPs or EPSPs with sideband IPSPs at 40 or 50 dB SPL.
Figure 7B shows the integrated PSPs evoked by each frequency in the tuned regions of 17 cells and shows that excitation dominates at and around the Fmax of each cell and that responses evoked by frequencies that flanked the excitatory regions were predominately inhibitory. Four cells with sidebands were omitted from the graph for clarity. Each of those cells had a prominent excitatory region of several kilohertz in which large EPSPs and/or discharges were evoked and those excitatory regions were surrounded by broad inhibitory regions. However, frequencies that evoked discharges were followed by strong hyperpolarizations with longer durations than the depolarizations. Because spikes were not included in the calculations of PSP areas, integration of PSP areas in the excitatory regions of some cells yielded negative values attributable to afterhyperpolarization, suggesting erroneously that these cells received stronger inhibitory innervations.
Whereas neurons with tuned regions dominated by EPSPs represent one extreme of the PSP continuum, at the other extreme were neurons whose tuned regions were dominated by IPSPs, in which all frequencies evoked mainly or, in some neurons, only IPSPs with little indication of any EPSPs (see Figs. 8–10). Tuned regions dominated by IPSPs were the most common type that we recorded (31 of 72, 43%). All neurons with upper-threshold and most, but not all, with null tuning curves exhibited tuning dominated by IPSPs at 40 or 50 dB SPL.
Figure 8.
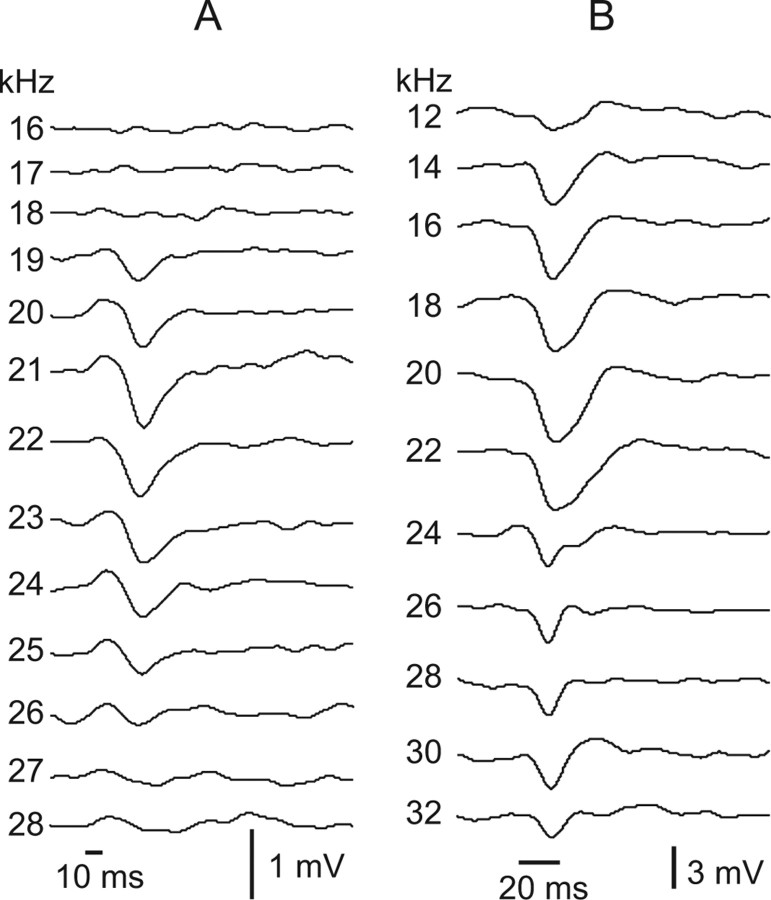
Tuned regions of two cells that were dominated by IPSPs. The tuned regions of this IPSP-dominated subtype were characterized by uniform PSP patterns evoked across frequency. The widths of the tuned regions differed among cells in this subgroup, illustrated by the narrow tuning in A and the much broader tuning in B. Tone burst durations were 10 ms in A and 20 ms in B. All tones were 50 dB SPL. Records in A are averages of 10 trials, and records in B were averages of three trials. Resting potential of the cell in A was −44 mV, and the cell in B was −46 mV.
Figure 9.
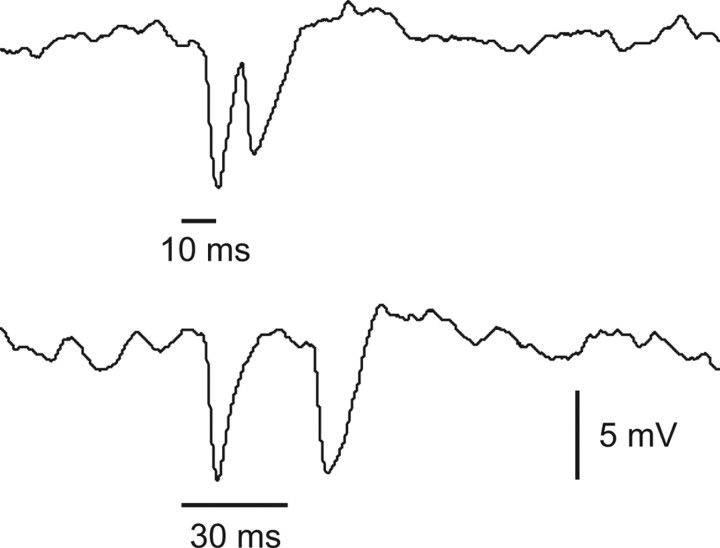
Responses evoked in an on–off neuron with two different tone burst durations, showing that the neuron responded with IPSPs to the onset and to the offset of the tone burst. Tone burst was 25 kHz at 50 dB SPL. Resting potential was −48 mV. Both records are averaged responses of 10 trials. The tuned region of this cell is shown in Figure 10A.
Figure 10.
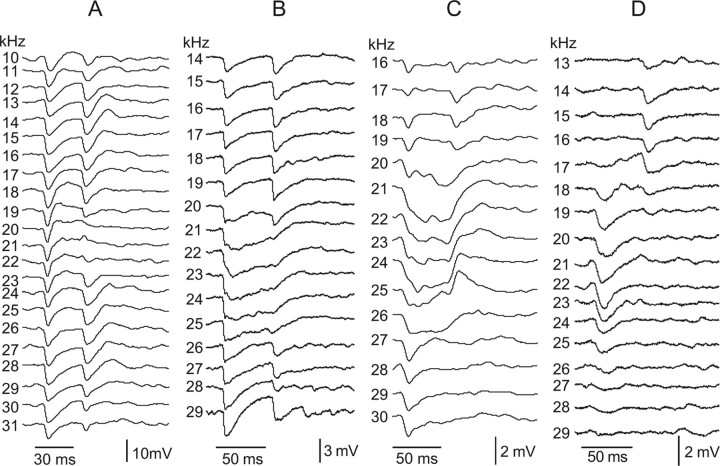
Tuned regions of four IPSP-dominated cells that responded to tones with on–off IPSPs. All tones were 50 dB SPL with durations shown by the time bars below each tuned region. Resting potential was −48 mV (A), −50 mV (B), −48 mV (C), and −49 mV (D). All traces are averaged responses of 10 trials. For additional explanation, see Results.
Figure 7C shows the integrated PSPs evoked by the frequencies within the tuned regions of IPSP-dominated cells and confirms the predominance of inhibition in these cells. Three cells in Figure 7C have a prominent excitatory peak, suggesting they may be similar to some of the excitatory-dominated cells with sideband inhibition in Figure 7B. The reason for the excitatory peaks is that a larger and longer-lasting excitation than inhibition was evoked by one or two frequencies in their tuned regions, whereas the responses evoked by all other frequencies were inhibitory, e.g., the cell in Figure 13. That these cells were dominated by inhibition is also illustrated in Figure 7D, which shows that the average PSP evoked by all frequencies was inhibitory in these cells.
Figure 13.
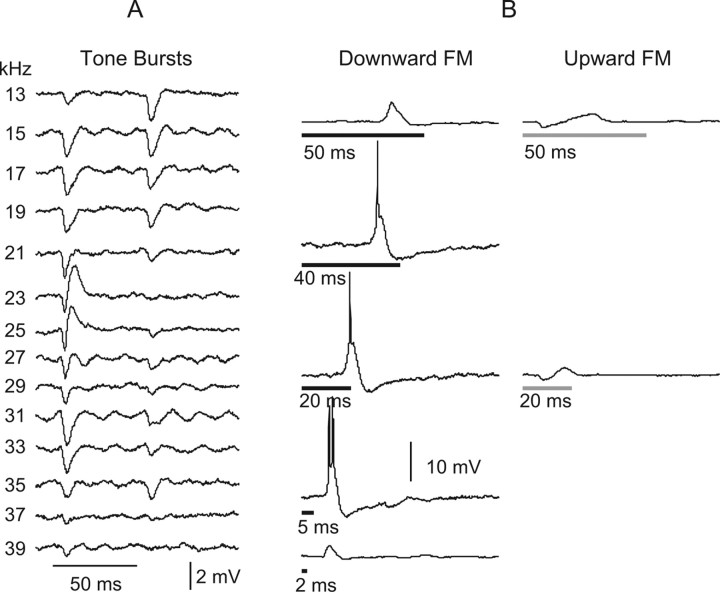
Another on–off cell with directionally selective responses to FM sweeps. The tuned region for tone bursts at 50 dB SPL is shown in A. The cell discharged to downward FM signals at 50 dB SPL that swept from 45 to 15 kHz with durations ranging from 5.0 to 40 ms. The neuron responded to longer (50 ms) and shorter (2 ms) downward FM sweeps with subthreshold EPSPs. It did not fire to upward FM sweeps and responded to those sweeps with an initial IPSP followed by an EPSP. Presumably the initial hyperpolarization suppressed the subsequent excitation to subthreshold levels. Nonspiking traces are averages of 10 trials, and spiking traces are single trials. Resting potential was −52 mV.
As with the two other types described above, neurons dominated by IPSPs could be further divided into two major subgroups based on the temporal patterns of the IPSPs. One subgroup (20 of 31) was characterized by a relatively uniform, sustained IPSP pattern evoked by all frequencies, as illustrated by the two neurons in Figure 8. The neurons in Figure 8 differed mainly in the bandwidths of their tuned regions. Seven of the 20 cells with a uniform IPSP configuration had narrowly tuned regions that averaged 11.0 ± 2.4 kHz in bandwidth, comparable with the neuron in Figure 8A. However, most IPSP-dominated cells (13 of 20) with uniform IPSPs were more broadly tuned, in which the average bandwidth of their tuned regions was 21.6 ± 4.0 kHz, similar to the neuron in Figure 8B.
Neurons in the second subgroup (11 of 31) were characterized by prominent onset IPSPs followed by offset IPSPs. That the IPSPs were evoked by the onset and offset of tones was confirmed by presenting tones of different durations and showing that the interval between the onset and offset IPSP followed the duration of the tone bursts (Fig. 9). We hereafter refer to these as on–off neurons. Below we consider the on–off neurons in greater detail and describe their shared features as well as the diversity of the temporal features of evoked IPSPs across frequency displayed by the neurons in this subgroup.
Features of on–off neurons
The tuned regions of on–off neurons had several common synaptic features that included broad tuning and the absence of any tone-evoked discharges at 50 dB SPL. These features are illustrated by the four on–off neurons in Figure 10. Synaptic responses in these cells were evoked over a frequency range of at least one octave, and the true frequency range was probably even broader because strong IPSPs were still evoked by the lowest and highest frequencies that we presented. For example, the cell shown in Figure 10A had prominent on–off IPSPs evoked by frequencies over a 21 kHz range, from 10 to 31 kHz. No doubt the synaptic tuning region would have been even wider had we presented frequencies below 10 kHz and above 31 kHz.
The patterns of PSPs across frequency were diverse among on–off cells. In most but not all of these cells, onset and offset IPSPs were evoked by frequencies by both the lower and higher frequencies of the synaptic tuned region of the neuron, whereas midrange frequencies evoked responses different from the on–off configuration evoked by higher or lower frequencies. These changes in midrange frequencies are illustrated by the onset and offset IPSPs of the neurons in Figure 10, A and B. Onset and offset IPSPs were evoked by lower and higher frequencies for the neuron in Figure 10A, whereas midrange frequencies, from 20 to 22 kHz, evoked an onset IPSP followed by a depolarization, with little evidence of an offset IPSP. The depolarization and loss of the offset IPSP at midrange frequencies is even more pronounced as shown in Figure 13A. For the neuron in Figure 10B, midrange frequencies of 21–24 kHz evoked a sustained inhibition that was sandwiched between the onset–offset responses evoked by lower and higher frequencies.
IPSPs evoked by the onset and offset of a tone were not evoked by both low and high frequencies in all on–off cells. An onset IPSP was evoked throughout the tuned regions in almost all of these cells, but, in some cells, an offset IPSP, and hence the on–off configuration, was evoked only by low frequencies. For the neuron in Figure 10C, the on–off IPSP configuration was evoked only by frequencies from ∼16 to 19 kHz. Midrange frequencies, from ∼20 to 24 kHz, evoked a sustained IPSP throughout the duration of the tone, in which hints of the onset and offset IPSPs rode on the sustained inhibition. Higher frequencies, from 27 kHz and above, evoked only an onset IPSP. The neuron in Figure 10D illustrates yet another variation of the on–off configuration. In this neuron, the onset IPSP responses were spectrally segregated from the offset IPSPs. Thus, low frequencies, from 13 to 17 kHz, evoked only offset IPSPs, whereas high frequencies, from 19 to 28 kHz, evoked only onset IPSPs. Midrange frequencies (17–18 kHz) evoked either a depolarization followed by an offset IPSP (17 kHz) or what appeared to be a transitional configuration that had both the onset and offset IPSP.
In summary, the tuning in each of the on–off cells was at least one octave wide and almost certainly even broader because we did not obtain responses that showed the full limits of their tuned synaptic regions. Additionally, the temporal patterns of the evoked PSPs varied widely among these cells, as did the frequencies within the tuned region of each neuron that evoked IPSPs at the onset and offset of the tones. Finally, not a single action potential was evoked in any of the 11 on–off cells by tone bursts at 50 dB SPL at any frequency. Thus, these synaptic features would have been invisible with extracellular recordings.
Influence of intensity on synaptic and discharge features of on–off neurons
The influences of intensity were investigated in six on–off neurons by recording intensity functions, i.e., PSPs and discharges evoked by one frequency at different intensities. We obtained full tuning curves from two neurons, and thus the intensity functions were obtained over a wide range of frequencies. These cells did not discharge at any frequency–intensity combination and thus were part of the population of cells we refer to as having null tuning. One of these on–off cells is shown in Figure 2A. In two other on–off cells, we recorded intensity functions over 3–5 kHz frequency range, which included their best frequency, and in two others intensity functions were obtained only at their best frequency. These four cells had upper-threshold intensity functions in which discharges were evoked but only at low intensities and only over a very narrow range of frequencies.
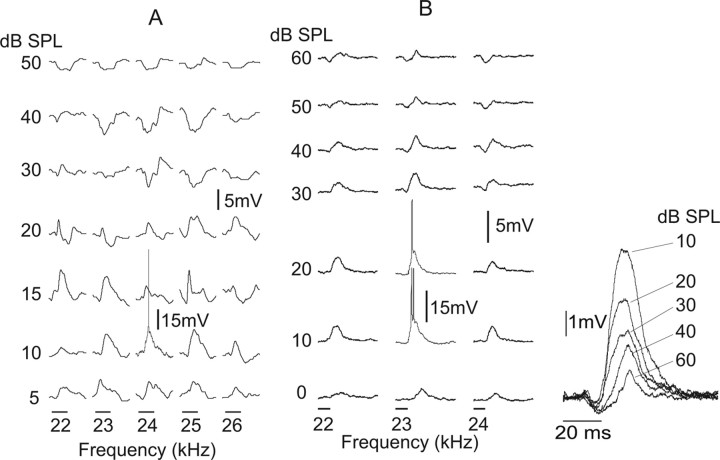
The upper-threshold feature is illustrated by the two on–off cells in Figure 11. The neuron in Figure 11A is the same neuron whose tuned region is shown in Figure 10C, whereas the neuron in Figure 11B is the same neuron shown in Figure 10D. For the neuron in Figure 11A, we obtained intensity functions for five frequencies, from 22 to 26 kHz. There are three notable features. The first is that discharges were evoked only by 24 kHz tones at 10 dB SPL. The second is that low intensities (5–10 dB SPL) evoked EPSPs at each frequency. The third feature is that higher intensities, from 20 to 50 dB SPL, evoked progressively stronger IPSPs such that IPSPs were the dominant responses evoked at 30–50 dB SPL.
Figure 11.
Intensity functions showing responses evoked by tones of increasing intensity at several frequencies for two on–off cells. The discharge features of both cells were upper-threshold and very narrowly tuned in that they fired only to one frequency and only at very low intensities. The amplitudes of the spiking responses evoked by 24 kHz at 10 dB in A and by 23 kHz at 10–20 dB in B are reduced for clarity. Inset on far right shows PSPs of the neuron in B evoked by increasing tone intensity but without spikes. Notice progressive increase in both the amplitude and duration of the initial hyperpolarization that appeared to quench the afterdepolarization. Tone burst durations were 50 ms in A and 20 ms in B and are shown by time bars below each intensity function. The tuned region of neuron A is shown in Figure 10C, and the tuned region of neuron B is shown in Figure 10D. In both neurons, nonspiking traces are averages of 10 trials, and spiking traces are single trials. Traces evoked by 23 kHz tone at 10–20 dB SPL in inset are averages of nonspiking trials.
The neuron in Figure 11B had a similar sequence of EPSP prominence at low intensities that was overwhelmed by inhibition at higher intensities. The only frequency that evoked discharges was 23 kHz and only at 10–20 dB SPL. Increasing intensities recruited progressively stronger IPSPs across frequency that appeared to quench the EPSPs, as shown in the inset on the far left. Given the excitation evoked at each intensity, it would follow that, if inhibition were blocked in these cells, V-type tuning curves would likely have emerged, as was seen in the upper-threshold type cells that were recorded extracellularly with multibarrel electrodes.
Responses evoked by FM sweeps
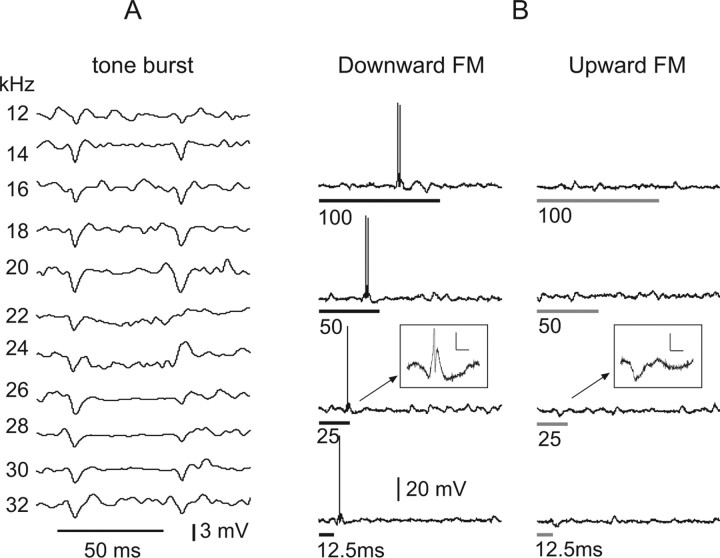
In the previous section, we showed that these cells either fail to discharge to any tone burst or discharge only to a very narrow range of frequencies and only at very low intensities. However, we also presented downward FM sweeps to four on–off cells and found that three of those cells discharged vigorously to downward FM sweeps. Two of those cells were also tested with upward sweeps, but the upward sweeps evoked no action potentials, which revealed their directional selectivity for downward sweeps. Moreover, the responses to downward FM sweeps were evoked at 50 dB SPL and had a spectral composition similar to the range of tones that evoked predominantly IPSPs at that intensity. Finally, the on–off cell that did not discharge to FM sweeps nevertheless displayed a directional selectivity in that downward sweeps evoked subthreshold EPSPs, whereas the upward sweeps evoked initial IPSPs followed by subthreshold EPSPs.
The disparity in responsiveness to tones and FM sweeps is illustrated by the two neurons in Figures 12 and 13. The cell in Figure 12 discharged preferentially to FM signals that swept downward from 45 to 15 kHz. The intensity of the FM sweeps was 50 dB SPL, and the sweeps were presented at various durations. Because the frequency excursion was held constant at 45–15 kHz, each duration had a different sweep rate. Although discharges were evoked by each of the downward FM sweeps, the neuron did not fire to any of the upward FM sweeps that had the same frequency excursion and sweep rates as the downward sweeps. Thus, the neuron was directionally selective but was not sweep rate selective. Responses to 12–32 kHz tone bursts at 50 dB SPL are shown in the left panel and evoked predominantly on–off IPSPs.
Figure 12.
Directionally selective responses evoked by FM sweeps in an on–off neuron. The tuned region for tone bursts at 50 dB SPL is shown in A. The neuron responded with discharges to FM signals that swept downward from 45 to 15 kHz. Discharges were evoked by downward FM sweeps at all signal durations. The cell failed to discharge to the same FM signals that swept upward from 15 to 45 kHz. Insets show magnified view of synaptic responses to the downward and upward FM sweeps. FM duration is shown by time bars under each record. All FM sweeps were 50 dB SPL, the same intensity as the tone bursts in A that failed to evoked any discharge. All traces of tone burst responses in A were averages of five trials, whereas all FM responses were from single trials. Resting potential was −48 mV.
Similar response features were evoked in the on–off neuron in Figure 13. This neuron was also directionally selective, discharging only to downward FM sweeping from 45 to 15 kHz and not to upward sweeps. It responded to upward sweeps with an initial IPSP followed by an EPSP whose duration varied with signal duration. The neuron also preferred a broad range of downward sweep rates in that it discharged only to sweep durations from 40 to 5 ms and responded to longer or shorter FM sweeps with subthreshold EPSPs.
Discussion
The results with whole-cell recordings are consistent with three principal features of IC neurons seen with extracellular recordings: (1) the response properties of IC cells are heterogeneous; (2) inhibition is a prominent feature of IC cells; and (3) the discharge tuning curves of IC cells are fairly narrow and have sideband inhibition that often sharpens the tuning. There were, however, several surprising features that are not consistent with previous findings. One is the large number of null-tuned cells. More important are that synaptic tuning was broad, often covering at least 20 kHz, and that patterns of sound-evoked PSPs often varied markedly with frequency. Other surprises were the number of cells in which sound-evoked responses were predominantly inhibitory and the responsiveness of on–off cells to FM sweeps. Below we consider each of these features and discuss why the results from the whole-cell recordings are inconsistent with some classically held ideas about how tuning is generated in IC cells and the ways that selective response properties for FM direction are formed.
Null-tuned cells
It is unclear whether null cells were recorded in most previous intracellular studies of the IC. Two studies used either clicks (Pedemonte et al., 1997) or FM sweeps (Voytenko and Galazyuk, 2007), and two others only report that tones evoked PSPs in all cells but do not comment on whether or not all of those cells also discharged to tones (Nelson and Erulkar, 1963; Kuwada et al., 1997). In the whole-cell study by Covey et al. (1996), the patch electrodes were filled with cesium, which influenced excitability. However, a recent whole-cell study of the mouse IC by Tan and Borst (2007) report that approximately one-third of the cells did not discharge to tones but responded with subthreshold PSPs. Those nondischarging cells may well have been null tuned.
We also are unsure about why we recorded a larger proportion of null cells with patch than with extracellular electrodes, although two explanations may, at least in part, account for these differences. First, in extracellular studies, we often searched with tones and thus may have missed many null neurons simply because they did not discharge to the search stimuli. In whole-cell studies, we searched with current steps, and the search was not biased by tonal response features. A second reason may be sampling bias. For some unknown reason, gigaohm seals may have been more readily made on null neurons than on other types. Alternatively, it may have been that null neurons are more common in portions of the IC that we sampled. In the IC of the big brown bat, neurons unresponsive to tones, but which respond vigorously to FM, are regionally localized (Casseday et al., 1997). Although we did not target our electrodes to specific portions of the IC, nor did we attempt to systematically sample the entire IC, we may have inadvertently made successful recordings in regions in which null cells are prevalent. Whatever the reasons, comparable tuning features were recorded with both methods, although the proportion of cells with V-shaped and null tuning were substantially different.
Synaptic tuning is wider than discharge tuning
The wide synaptic tuning in the majority of cells is surprising because it departs from traditional views of tuning in the IC. One view holds that tuning is entirely inherited from one lower nucleus through excitatory projections, in which inhibition does not sharpen tuning but acts only as a gain control (Ramachandran et al., 1999). Another more generally accepted view is that tuning of IC neurons is primarily inherited from lower nuclei, in which the excitatory projections are fairly narrowly tuned, and the tuning of their targets in the IC are then further sharpened by inhibitory projections that are congruent with excitatory projections in BF and tuning width (Aitkin, 1985; Palombi and Caspary, 1996). In this view, only the sideband inhibition, on either side of the BF, is sufficiently strong to suppress the excitation to subthreshold levels, thereby sharpening tuning. This hypothesis explains why blocking inhibition causes an overall increase in response magnitude throughout the tuning curve and why the release of sideband excitation from inhibition results in tuning expansion. Thus, the expanded tuning curve should express most, if not the full extent, of the innervation of the cell.
The synaptic tuning in many IC cells, however, is not congruent with discharge tuning and is, on average, at least 10 kHz wider than the discharge tuning when inhibition was blocked. Thus, discharge tuning widths of 15–20 kHz when inhibition was blocked were only rarely observed in our previous experiments, but the synaptic tuning in many IC neurons was at least that broad, and almost certainly even broader, given that we did not measure the full extent of synaptic tuning in most cells. To be sure, the responses on the far frequency flanks of the tuned regions in most cells were mainly IPSPs, but, as pointed out previously, we cannot be sure that those events were purely inhibitory or were composed of a much stronger inhibition that swamped a weaker excitation. Either way, the synaptic tuning in the majority of IC cells is not reflected in the expanded discharge tuning during blocking inhibition but rather shows that many IC cells receive innervation from inputs that have a broader spectral range than previously believed, a feature also seen in a recent intracellular study of responses to FM sweeps (Voytenko and Galazyuk, 2007).
IC cells receive convergent projections from multiple sources
The lack of changes in PSP configuration with frequency supports the classical view of tuning for some cells, but the changes observed in other cells are at odds with that view. Some cells had uniform patterns of PSPs across frequency and relatively narrow discharge and synaptic tuning. The similar PSP configuration evoked across frequency further suggests that the tuning in those cells was primarily inherited from one or a few lower sources, features consistent with the traditional view of tuning described above.
In other cells, however, the changes in PSP configuration were more complex, and the complexity suggests convergence from larger sets of lower-order nuclei, in which some sources were activated by some frequencies and different sources were activated by other frequencies. Additionally, such frequency-dependent recruitments appear to be relatively simple in some cells and far more complex in others. The on–off neurons are one type that had complex frequency-dependent changes in synaptic configuration, and those changes offer insights into the convergences that must generate the various synaptic configurations. Specifically, there apparently are separate inhibitory sources for the onset and offset IPSPs and yet other sources that change the PSP configuration evoked by midrange frequencies. The separate sources for onset and offset IPSPs is suggested by cells in which onset IPSPs were evoked by all frequencies, whereas offset IPSPs were evoked only by low frequencies (Fig. 10C), and by on–off cells in which the onset IPSPs were spectrally segregated from the offset IPSPs (Fig. 10D).
Extracellular recordings could not reveal many features of IC cells
Previous extracellular studies have shown that tuning and other discharge properties of IC cells are both diverse and are shaped by inhibition (Koch and Grothe, 1998; Caspary et al., 2002; Davis, 2002; Xie et al., 2005), features consistent with the massive convergence of excitatory and inhibitory inputs from lower centers. Nevertheless, many features we observed with patch recordings were surprising because their presence could not have been imagined with extracellular recordings.
The surprising features, as well as their functional uncertainties, are encapsulated by the responses of on–off cells. That tones evoke both an onset and offset IPSP could not have been deduced from extracellular recordings nor could the wide range of frequencies that evoked those responses. Moreover, why those cells have such broad inhibitory tuning and how the two inhibitory events interact to shape responses to complex signals are perplexing. As an illustration, recall that on–off cells are directional selectivity for FM sweeps, a feature classically explained by an asymmetry in the spectrotemporal features of both the excitatory and inhibitory regions (Suga, 1965; Fuzessery et al., 2006; Andoni et al., 2007). Spectrotemporal asymmetry posits that selectivity for downward sweeping FM is a consequence of inhibition that flanks the excitatory region with latencies slightly longer than the latencies of excitatory frequencies. Thus, as the signal sweeps downward, it first evokes a short-latency excitation that is unopposed by a longer-latency inhibition, whereas signals that sweep upward first evoke an inhibition that prevents discharges. Given the prominence of an initial IPSP evoked by every frequency, it is difficult to visualize how any excitation could be evoked before inhibition in on–off cells.
The onset IPSPs revealed with patch recordings, however, suggest at least a partial resolution to this dilemma. The argument is that their directional selectivities are primarily a consequence of onset inhibitory inputs from the ventral nucleus of the lateral lemniscus (VNLL). The rationale is that VNLL neurons are glycinergic (Winer et al., 1995; Vater et al., 1997), broadly tuned (Haplea et al., 1994), and respond to tones with only a single onset spike (Huffman et al., 1998; Nayagam et al., 2005), features appropriate for generating onset IPSPs, and they are directionally selective for FM sweeps (Huffman et al., 1998). Thus, because of VNLL directional selectivity, FM signals sweeping in one direction evoke no onset inhibition, which allows excitation at midrange frequencies to evoke discharges, whereas the onset inhibition evoked by signals sweeping in the opposite direction suppresses firings.
Whatever explanation will ultimately emerge, it will have to incorporate the tone-evoked patterns of IPSPs, the frequency-dependent variability in PSP configurations and the broad synaptic tuning in on–off cells. The same reasoning is applicable to many other cell types in the IC, whose features revealed with whole-cell recordings suggest that the processing in those cells results from inputs spectrally broader and more complex than previously believed because the inputs to IC cells were essentially invisible with extracellular recordings.
Footnotes
This work was supported by National Institutes of Health Grant DC 20068. We declare that we have no competing financial interests. We thank Carl Resler, for technical support, Rick Aldrich, Na Li, Stephan Brenowitz, Nace Golding, Achim Klug, Michael Burger, and Sari Andoni for their comments and suggestions. We also thank Gary Rose for showing us how to record in vivo with patch electrodes and Nace Golding for his encouragement and technical advice.
References
- Aitkin LM. Clifton, NJ: Humana; 1985. The auditory midbrain: structure and function in the central auditory pathway. [Google Scholar]
- Andoni S, Li N, Pollak GD. Spectrotemporal receptive fields in the inferior colliculus revealing selectivity for spectral motion in conspecific vocalizations. J Neurosci. 2007;27:4882–4893. doi: 10.1523/JNEUROSCI.4342-06.2007. [DOI] [PMC free article] [PubMed] [Google Scholar]
- Bauer EE, Klug A, Pollak GD. Features of contralaterally evoked inhibition in the inferior colliculus. Hear Res. 2000;141:80–96. doi: 10.1016/s0378-5955(99)00206-3. [DOI] [PubMed] [Google Scholar]
- Caspary DM, Palombi PS, Hughes LF. GABAergic inputs shape responses to amplitude modulated stimuli in the inferior colliculus. Hear Res. 2002;168:163–173. doi: 10.1016/s0378-5955(02)00363-5. [DOI] [PubMed] [Google Scholar]
- Casseday JH, Covey E. Frequency tuning properties of neurons in the inferior colliculus of an FM bat. J Comp Neurol. 1992;319:34–50. doi: 10.1002/cne.903190106. [DOI] [PubMed] [Google Scholar]
- Casseday JH, Ehrlich D, Covey E. Neural tuning for sound duration: role of inhibitory mechanisms in the inferior colliculus. Science. 1994;264:847–850. doi: 10.1126/science.8171341. [DOI] [PubMed] [Google Scholar]
- Casseday JH, Covey E, Grothe B. Neural selectivity and tuning for sinusoidal frequency modulations in the inferior colliculus of the big brown bat, Eptesicus fuscus. J Neurophysiol. 1997;77:1595–1605. doi: 10.1152/jn.1997.77.3.1595. [DOI] [PubMed] [Google Scholar]
- Casseday JH, Fremouw T, Covey E. The inferior colliculus: a hub for the central auditory system. In: Oertel D, Popper AN, Fay RR, editors. Integrative functions in the mammalian auditory pathway. New York: Springer; 2002. pp. 238–318. [Google Scholar]
- Covey E, Kauer JA, Casseday JH. Whole-cell patch-clamp recording reveals subthreshold sound-evoked postsynaptic currents in the inferior colliculus of awake bats. J Neurosci. 1996;16:3009–3018. doi: 10.1523/JNEUROSCI.16-09-03009.1996. [DOI] [PMC free article] [PubMed] [Google Scholar]
- Davis KA. Evidence of a functionally segregated pathway from dorsal cochlear nucleus to inferior colliculus. J Neurophysiol. 2002;87:1824–1835. doi: 10.1152/jn.00769.2001. [DOI] [PubMed] [Google Scholar]
- Escabi MA, Schreiner CE. Nonlinear spectrotemporal sound analysis by neurons in the auditory midbrain. J Neurosci. 2002;22:4114–4131. doi: 10.1523/JNEUROSCI.22-10-04114.2002. [DOI] [PMC free article] [PubMed] [Google Scholar]
- Faingold CL, Gehlbach G, Caspary DM. On the role of GABA as an inhibitory neurotransmitter in inferior colliculus neurons: iontophoretic studies. Brain Res. 1989;500:302–312. doi: 10.1016/0006-8993(89)90326-0. [DOI] [PubMed] [Google Scholar]
- Fuzessery ZM, Hall JC. Role of GABA in shaping frequency tuning and creating FM sweep selectivity in the inferior colliculus. J Neurophysiol. 1996;76:1059–1073. doi: 10.1152/jn.1996.76.2.1059. [DOI] [PubMed] [Google Scholar]
- Fuzessery ZM, Richardson MD, Coburn MS. Neural mechanisms underlying selectivity for the rate and direction of frequency-modulated sweeps in the inferior colliculus of the pallid bat. J Neurophysiol. 2006;96:1320–1336. doi: 10.1152/jn.00021.2006. [DOI] [PubMed] [Google Scholar]
- Galazyuk AV, Lin W, Llano D, Feng AS. Leading inhibition to neural oscillation is important for time-domain processing in the auditory midbrain. J Neurophysiol. 2005;94:314–326. doi: 10.1152/jn.00056.2005. [DOI] [PubMed] [Google Scholar]
- Haplea S, Covey E, Casseday JH. Frequency tuning and response latencies at three levels in the brainstem of the echolocating bat, Eptesicus fuscus. J Comp Physiol. 1994;174:671–683. doi: 10.1007/BF00192716. [DOI] [PubMed] [Google Scholar]
- Huffman RF, Argeles PC, Covey E. Processing of sinusoidally frequency modulated signals in the nuclei of the lateral lemniscus of the big brown bat, Eptesicus fuscus. Hear Res. 1998;126:161–180. doi: 10.1016/s0378-5955(98)00165-8. [DOI] [PubMed] [Google Scholar]
- Hurley LM, Pollak GD. Serotonin effects on frequency tuning of inferior colliculus neurons. J Neurophysiol. 2001;85:828–842. doi: 10.1152/jn.2001.85.2.828. [DOI] [PubMed] [Google Scholar]
- Klug A, Bauer EE, Hanson JT, Hurley L, Meitzen J, Pollak GD. Response selectivity for species-specific calls in the inferior colliculus of Mexican free-tailed bats is generated by inhibition. J Neurophysiol. 2002;88:1941–1954. doi: 10.1152/jn.2002.88.4.1941. [DOI] [PubMed] [Google Scholar]
- Koch U, Grothe B. GABAergic and glycinergic inhibition sharpens tuning for frequency modulations in the inferior colliculus of the big brown bat. J Neurophysiol. 1998;80:71–82. doi: 10.1152/jn.1998.80.1.71. [DOI] [PubMed] [Google Scholar]
- Kuwada S, Batra R, Yin TC, Oliver DL, Haberly LB, Stanford TR. Intracellular recordings in response to monaural and binaural stimulation of neurons in the inferior colliculus of the cat. J Neurosci. 1997;17:7565–7581. doi: 10.1523/JNEUROSCI.17-19-07565.1997. [DOI] [PMC free article] [PubMed] [Google Scholar]
- Le Beau FE, Rees A, Malmierca MS. Contribution of GABA- and glycine-mediated inhibition to the monaural temporal response properties of neurons in the inferior colliculus. J Neurophysiol. 1996;75:902–919. doi: 10.1152/jn.1996.75.2.902. [DOI] [PubMed] [Google Scholar]
- Le Beau FE, Malmierca MS, Rees A. Iontophoresis in vivo demonstrates a key role for GABAA and glycinergic inhibition in shaping frequency response areas in the inferior colliculus of guinea pig. J Neurosci. 2001;21:7303–7312. doi: 10.1523/JNEUROSCI.21-18-07303.2001. [DOI] [PMC free article] [PubMed] [Google Scholar]
- Nayagam DA, Clarey JC, Paolini AG. Powerful, onset inhibition in the ventral nucleus of the lateral lemniscus. J Neurophysiol. 2005;94:1651–1654. doi: 10.1152/jn.00167.2005. [DOI] [PubMed] [Google Scholar]
- Nelson PG, Erulkar SD. Synaptic mechanisms of excitation and inhibition in the central auditory pathway. J Neurophysiol. 1963;26:908–922. doi: 10.1152/jn.1963.26.6.908. [DOI] [PubMed] [Google Scholar]
- Oliver DL, Huerta MF. Inferior and superior colliculi. In: Webster DB, Popper AN, Fay RR, editors. The mammalian auditory system: neuroanatomy. New York: Springer; 1992. pp. 168–221. [Google Scholar]
- Palombi PS, Caspary DM. GABA inputs control discharge rate primarily within frequency receptive fields of inferior colliculus neurons. J Neurophysiol. 1996;75:2211–2219. doi: 10.1152/jn.1996.75.6.2211. [DOI] [PubMed] [Google Scholar]
- Pedemonte M, Torterolo P, Velluti RA. In vivo intracellular characteristics of inferior colliculus neurons in guinea pigs. Brain Res. 1997;759:24–31. doi: 10.1016/s0006-8993(97)00123-6. [DOI] [PubMed] [Google Scholar]
- Pollak GD, Casseday JH. New York: Springer; 1986. The neural basis of echolocation in bats. [Google Scholar]
- Pollak GD, Park TJ. The effects of GABAergic inhibition on monaural response properties of neurons in the mustache bat's inferior colliculus. Hear Res. 1993;65:99–117. doi: 10.1016/0378-5955(93)90205-f. [DOI] [PubMed] [Google Scholar]
- Pollak GD, Burger RM, Park TJ, Klug A, Bauer EE. Roles of inhibition for transforming binaural properties in the brainstem auditory system. Hear Res. 2002;168:60–78. doi: 10.1016/s0378-5955(02)00362-3. [DOI] [PubMed] [Google Scholar]
- Pollak GD, Burger RM, Klug A. Dissecting the circuitry of the auditory system. Trends Neurosci. 2003;26:33–39. doi: 10.1016/s0166-2236(02)00009-7. [DOI] [PubMed] [Google Scholar]
- Ramachandran R, Davis KA, May BJ. Single-unit responses in the inferior colliculus of decerebrate cats. I. Classification based on frequency response maps. J Neurophysiol. 1999;82:152–163. doi: 10.1152/jn.1999.82.1.152. [DOI] [PubMed] [Google Scholar]
- Schuller G. A cheap earphone for small animals with good frequency responses in the ultrasonic frequency range. J Neurosci Methods. 1997;71:187–190. doi: 10.1016/s0165-0270(96)00142-2. [DOI] [PubMed] [Google Scholar]
- Suga N. Analysis of frequency modulated sounds by auditory neurons of echolocating bats. J Physiol (Lond) 1965;179:26–53. doi: 10.1113/jphysiol.1965.sp007648. [DOI] [PMC free article] [PubMed] [Google Scholar]
- Suga N. Analysis of frequency-modulated and complex sounds by single auditory neurons of bats. J Physiol (Lond) 1968;198:51–80. doi: 10.1113/jphysiol.1968.sp008593. [DOI] [PMC free article] [PubMed] [Google Scholar]
- Tan ML, Borst JG. Comparison of responses of neurons in the mouse inferior colliculus to current injections, tones of different durations and sinusoidal amplitude-modulated tones. J Neurophysiol. 2007;98:454–466. doi: 10.1152/jn.00174.2007. [DOI] [PubMed] [Google Scholar]
- Tan ML, Theeuwes HP, Feenstra L, Borst JG. Membrane properties and firing patterns of inferior colliculus neurons: an in vivo patch-clamp study in rodents. J Neurophysiol. 2007;98:443–453. doi: 10.1152/jn.01273.2006. [DOI] [PubMed] [Google Scholar]
- Vater M, Siefer W. The cochlea of Tadarida brasiliensis: specialized functional organization in a generalized bat. Hear Res. 1995;91:178–195. doi: 10.1016/0378-5955(95)00188-3. [DOI] [PubMed] [Google Scholar]
- Vater M, Covey E, Casseday JH. The columnar region of the ventral nucleus of the lateral lemniscus in the big brown bat (Eptesicus fuscus): synaptic arrangements and structural correlates of feedforward inhibitory function. Cell Tissue Res. 1997;289:223–233. doi: 10.1007/s004410050869. [DOI] [PubMed] [Google Scholar]
- Voytenko SV, Galazyuk AV. Intracellular recording reveals temporal integration in inferior colliculus neurons of awake bats. J Neurophysiol. 2007;97:1368–1378. doi: 10.1152/jn.00976.2006. [DOI] [PubMed] [Google Scholar]
- Winer JA, Larue DT, Pollak GD. GABA and glycine in the central auditory system of the mustache bat: structural substrates for inhibitory neuronal organization. J Comp Neurol. 1995;355:317–353. doi: 10.1002/cne.903550302. [DOI] [PubMed] [Google Scholar]
- Xie R, Meitzen J, Pollak GD. Differing roles of inhibition in hierarchical processing of species-specific calls in auditory brainstem nuclei. J Neurophysiol. 2005;94:4019–4037. doi: 10.1152/jn.00688.2005. [DOI] [PubMed] [Google Scholar]
- Yang L, Pollak GD, Resler C. GABAergic circuits sharpen tuning curves and modify response properties in the mustache bat inferior colliculus. J Neurophysiol. 1992;68:1760–1774. doi: 10.1152/jn.1992.68.5.1760. [DOI] [PubMed] [Google Scholar]


