

Abstract
One important characteristic of sensory input is frequency, with sensory neurons often tuned to narrow stimulus frequency ranges. Although vital for many neural computations, the cellular basis of such frequency tuning remains mostly unknown. In the electrosensory system of Apteronotus leptorhynchus, the primary processing of important environmental and communication signals occurs in pyramidal neurons of the electrosensory lateral line lobe. Spike trains transmitted by these cells can encode low-frequency prey stimuli with bursts of spikes and high-frequency communication signals with single spikes. Here, we demonstrate that the selective expression of SK2 channels in a subset of pyramidal neurons reduces their response to low-frequency stimuli by opposing their burst responses. Apamin block of the SK2 current in this subset of cells induced bursting and increased their response to low-frequency inputs. SK channel expression thus provides an intrinsic mechanism that predisposes a neuron to respond to higher frequencies and thus specific, behaviorally relevant stimuli.
Keywords: SK channels, frequency tuning, electric fish, sensory processing, pyramidal neurons, bursting
Introduction
Sensory systems discriminate stimuli across multiple dimensions. The frequency of such signals is an important characteristic and frequency tuning has been demonstrated in the auditory (Hudspeth, 2000; Elhilali et al., 2004; Woolley et al., 2005), visual (Priebe et al., 2006), and somatosensory (Andermann et al., 2004) systems. The cell-intrinsic biophysical mechanisms that shape the frequency responses are not well understood. The electrosensory system of Apteronotus leptorhynchus estimates the frequency content of input signals. These fish produce an electric organ discharge (EOD) to create an electric field that permits them to locate objects (electrolocation) and communicate (electrocommunication). Cutaneous electroreceptors encode amplitude modulations (AMs) of the EOD and project to pyramidal neurons in the hindbrain electrosensory lateral line lobe (ELL) (Turner and Maler, 1999; Bell and Maler, 2005). ELL pyramidal cells extract the AM intensity and frequency. In general, prey capture is associated with low frequencies (<20 Hz), whereas electrocommunication signals are high-frequency AMs (>50 Hz; typically male–female interactions) (Nelson and Maciver, 1999; Zakon et al., 2002).
The ELL is part of a thoroughly characterized neural network (Berman and Maler, 1999) well suited for the study of neuronal frequency tuning. It is divided into four topographic maps, the lateral (LS), centrolateral (CLS), centromedial (CMS), and medial (MS) segments (Bell and Maler, 2005). Whereas the LS, CLS, and CMS receive identical inputs from tuberous electroreceptors, the MS receives input from ampullary receptors and are not evaluated in this study. The physiological and molecular makeup of the different ELL maps suggests that pyramidal neurons in the most lateral map are specialized to encode high-frequency communication signals, whereas pyramidal neurons in the more medial maps encode low-frequency prey signals (Shumway, 1989; Metzner and Juranek, 1997). Within each map, pyramidal cell responses to low-frequency input are encoded by spike bursts, whereas high-frequency stimuli are encoded with isolated spikes (Oswald et al., 2004). This suggests that frequency tuning of ELL pyramidal cells might depend on the biophysical control of burst generation.
Small conductance calcium-activated potassium (SK) channels (Kohler et al., 1996) open in response to elevations in calcium and produce a medium afterhyperpolarization (mAHP). SK channels can regulate numerous aspects of neuronal dynamics including the following: spike frequency adaptation (Pedarzani et al., 2005), spike patterning (Wolfart et al., 2001; Cloues and Sather, 2003), synaptic excitability (Stackman et al., 2002; Kramar et al., 2004), dendrosomatic coupling (Womack and Khodakhah, 2003), and long-term potentiation (Behnisch and Reymann, 1998; Lancaster et al., 2001; Stackman et al., 2002; Faber et al., 2005; Ngo-Anh et al., 2005). The links between SK channel kinetics and behaviorally relevant neuronal computations have not, however, been rigorously explored.
Here, we show that SK2 channels are differentially expressed across the ELL maps, with the highest levels in pyramidal neurons tuned to high frequencies. We hypothesize that frequency tuning in ELL pyramidal neurons is regulated by SK channel control of burst output. Consistent with this hypothesis, apamin was found to reduce the size of the mAHP in high-frequency tuned neurons, increasing their response to low-frequency input via an increase in bursting. In contrast, apamin had no effect on neurons tuned to low frequencies. We conclude that SK channels can regulate frequency selectivity in pyramidal neurons and thus tuning for prey versus communication signals.
Materials and Methods
Isolation of
Apteronotus SK2 channel cDNA. The Apteronotus SK2 (AptSK2) channel sequence was initially isolated using PCR and degenerate primers designed to match all possible codons for the conserved amino acid segments The primers were based on comparisons of human, rat, and trout SK channel sequences. High levels of sequence conservation were found between the putative transmembrane segments S1 and S6. The primers used were as follows: forward, 5′-ATCTTYGGIATGTTYGGIATIGT-3′, and reverse, 5′-TATAGATIAGCCAIGTYTCY-3′, where Y is C+T and I is inosine. PCR was performed on brain cDNA from A. leptorhynchus (Bottai et al., 1997). The product of the degenerate reverse transcription-PCR (900 bp) was cloned into the pGEM-T vector (Promega, Madison, WI). Sequencing of the purified plasmids allowed the identification of sequences with high homology to known SK channels. The 5′ and 3′ regions of the channel were further isolated through rapid amplification of cDNA ends using the Generacer kit from Invitrogen (Carlsbad, CA). Once the sequence of the SK2 channel was assembled, primers were designed from the 5′ and 3′ untranslated (UTR) sequences that could amplify the full-length channel. The channel was then amplified by PCR using Pfu polymerase, to decrease the likelihood of error introduction and the DNA sequence confirmed.
The amono acid sequence of the AptSK2 channel was aligned with the rat, mouse, human, and trout SK channels along with the human BK channel for the creation of a phylogenic tree. Alignments were performed using the Clustal W algorithm included in the Lasergene software package (DNAstar, Madison, WI).
Apteronotus brain section preparation for in situ hybridization. Fish were anesthetized in tank water containing 3-aminobenzoic acid ethyl ester (MS-222) and respirated with O2-bubbled MS-222 water during the perfusion procedure while surrounded in ice. After surgical exposure of the heart, 20 ml of cold PBS was perfused via a needle inserted into the conus arteriosus. The fish were perfused with 40 ml of cold PBS containing 4% paraformaldehyde (PFA). Whole brains were surgically removed and placed in 4% PFA-containing solutions. The brains were cryoprotected by placing them in a 4% PFA solution containing 10–15% sucrose overnight at 4°C. Cryostat sections (20 μm) were cut and mounted on poly-l-lysine-coated slides and stored at −20°C until use.
In situ hybridization. The hybridization probe templates were created by PCR amplification of 5′ UTR plus the initial 5′ sequence (397 nt total). The RNA synthesis reaction involved the use of a digoxin (DIG)-labeled UTP in the NTP mix at a ratio of 1:3 with unlabeled UTP. In situ hybridization was performed on cryostat sections prepared as outlined above. The hybridization procedure was based on a protocol previously designed for Apteronotus slices (Bottai et al., 1997), but modified for the use of DIG-labeled probes. Slides were postfixed by placing them on a 40°C hotplate for 10 min followed by 20 min in 4% PFA/PBS at 4°C. Slides were then dehydrated in ascending alcohol (50, 70, 95, 100%; 3 min each). Unless otherwise noted, all of the following steps were done at room temperature (22°C). Pretreatment of slides involved a brief rinse in PBS (5 min) followed by permeabilization in 0.3% Triton X-100/PBS for 15 min. Slides were rinsed twice in PBS (5 min) and further permeabilized with proteinase K (5 μg/ml) in TE buffer (100:50) at 37°C for 30 min. Again, slides were rinsed twice with PBS (5 min), and then in triethanolamine (TEA) (0.1 m; 2 min) followed by acetylation with 0.25% acetic anyhydride in TEA for 5 min. Slides were dehydrated in ascending alcohol (50, 70, 95, 100%; 3 min each). Then, slides were incubated for 1 h on a slide plate (humid chamber) at 50°C with 200 μl of prehybridization solution (50% formamide, 0.75 m NaCl, 25 mm EDTA, 25 mm PIPES, 1× Denhardts, 0.2% Tween 20, 1 mg/ml salmon sperm DNA, 1 mg/ml yeast tRNA). The hybridization solution included dextrane sulfate (10%) along with the specific hybridization probe. The probe solution was added and each slide was coverslipped, sealed with DPX mounting media (Sigma, St. Louis, MO) and left overnight at the appropriate temperature. After hybridization, the slides were washed in descending sodium citrate buffer (2× SSC, 1× SSC–50% formamide, 0.2× SSC) for 20 min at the hybridization temperature. Immunodetection of the DIG-labeled probe involved the following procedure: slides were washed twice in buffer 1 (100 mm Tris, pH 7.5, 150 mm NaCl) for 10 min. Slides were then blocked for 30 min (buffer 1, 0.1% Triton X-100, 2% sheep serum, 1% Block (Roche, Indianapolis, IN), followed by incubation in a humid chamber with blocking buffer containing anti-DIG alkaline phosphatase antibody at 1:1000. Slides were washed (100 mm Tris-HCl, pH 9.5, 100 mm NaCl, 50 mm MgCl2) and placed back into the humid chamber and incubated for 2–15 min with coloration solution (3% 4-nitro-blue-tetrazolium chloride/5-bromo-4-chloro-3-indolyl phosphate in buffer 2). Coloration was stopped by placing slide in TE (10:1) for 10 min. Slides were subsequently coverslipped and sealed.
Optical density (OD) measurements were made using ImageJ software. Cells were grouped based on segment (LS, CLS, CMS) and as well as pyramidal cell sublayer (superficial or intermediate) (Bastian and Courtright, 1991; Berman et al., 1995) resulting in six distinct groups. Superficial neurons were considered to be those lying along the upper 25 μm of the pyramidal cell layer as shown previously (Berman et al., 1995), whereas intermediate cells were considered those to be >25 μm from the stratum fibrosum (upper boundary of the pyramidal cell layer). Local background measurements were taken from the plexiform layer (see Fig. 2, pl) and were subtracted from cell values. OD histograms were created using a bin width of 10 OD units. OD measurements made on pyramidal cells from sense controls served as an estimate of general background labeling of pyramidal cell somata.
Figure 2.

Compartmental expression pattern of AptSK2 in the ELL. A, In situ hybridization analysis of AptSK2 in the ELL. Lines indicate segment divisions of the sensory maps in the ELL. The highest expression is found in the LS, with a lower level found in the CLS and CMS. Undetectable levels are found in the MS. B, Magnified view of the segmental localization pattern. Superficial (SP) and intermediate (IP) pyramidal neurons are strongly labeled in the LS and CLS along with ventral molecular layer (VML) interneurons and granule cells (GC). In the CMS, only intermediate pyramidal neurons display strong SK2 expression. St.F, Stratum fibrosum; pl, plexiform layer; GCL, granule cell layer. Scale bars, 100 μm. C, OD histogram of cells from the superficial layer of the CMS showing a single peak. Bin width was 10 OD units. The arrow points to the location of the mean OD of the sense controls; the distribution of sense controls OD values overlaps that of the CMS superficial cells. D, Bimodal OD histogram from cells in the LS, CLS, and intermediated CMS segments. The dotted lines represent the separation of low and high OD levels for the bimodal histogram in D; note that this value corresponds to the maximum value of the histogram in C.
Preparation of slices for electrophysiology.
Fish (A. leptorhynchus) were obtained from local importers and maintained at 26–28°C in fresh water aquaria, in accordance with protocols approved by the University Animal Care Committee. All chemicals were obtained from Sigma unless otherwise noted. Animals were anesthetized in 0.05% phenoxy-ethanol, and ELL tissue slices of 300–400 μm thickness were prepared as described previously (Turner et al., 1994). Slices were maintained by constant perfusion of artificial CSF (ACSF) (1–2 ml/min), and superfusion of humidified 95% O2, 5% CO2 gas. ACSF contained the following: 124 mm NaCl, 3 mm KCl, 25 mm NaHCO3, 1.0 mm CaCl2, 1.5 mm MgSO4, and 25 mm [scap]d-glucose, pH 7.4. HEPES-buffered ACSF for pressure ejection of pharmacological agents contained the same elements, with the following differences: 148 mm NaCl and 10 mm HEPES.
Recording procedures.
Glass microelectrodes were backfilled with 2 m KAc, pH 7.4 (90–120 MΩ resistance), containing 2% Neurobiotin (Vector Labs, Burlingame, CA). Recordings were made from pyramidal cells from all three ELL segments receiving P-unit inputs (LS, CLS, and CMS). Recordings were made from the pyramidal cell layer (PCL) and digitized using a NI PCI-6030E DAQ board (National Instruments, Austin, TX). Intracellular stimuli were delivered, and data were recorded in custom software using the Matlab data acquisition toolbox (Mathworks, Natick, MA). Cells were held at a level just below firing threshold with a negative current injection. Random amplitude modulations (RAMs) consisting of white noise low-pass filtered to 0–60 Hz were given on top of the negative current injection, and the SD of the waveform was adjusted to give firing rates of 10–25 Hz. Apamin (1–10 μm) or 1-ethyl-2-benzimidazolinone (EBIO) (1 mm) were focally ejected into the PCL using electrodes of 1–2 μm tip diameter and 7–15 psi pressure ejection. Previous studies have estimated a ∼10× dilution factor for ejected toxins (Turner et al., 1994). Pharmacological agents were dissolved in HEPES-buffered ACSF.
Cell fills.
ELL pyramidal cells were filled after recording using sustained positive-current ejection pulse (+1 nA; 250 ms). After recording, slices were transferred to 4% paraformaldehyde and fixed for several days at 4°C. Slices were washed in 0.1 m phosphate buffer (PB) for several hours, and then placed in a solution of PB, Triton X-100 (0.1%), DMSO (0.5%), and streptavidin-Cy3 (1:1500) for 3 d. Slices were visualized under fluorescent microscopy for classification. Superficial pyramidal cells were distinguished by the extent of their dendritic arborization, and by the location of the soma within the PCL. A total of 29 cells were filled from the three major tuberous electrosensory maps. Cells were classified as E- or I-cells depending on the presence of absence of a basilar dendrite. Of the cells, 7 were from the LS (E-cells, 3; I-cells, 4), 13 were from the CLS (E-cells, 7; I-cells, 6), and 9 were from the CMS (2 superficial E-cells, 2 superficial I-cells, 4 intermediate E-cells, and 1 intermediate I-cell).
Data analysis.
All electrophysiological data were analyzed in Matlab R2006a (Mathworks). Spike threshold was taken based on the first derivative of the voltage waveform. Data was plotted in Origin (OriginLab, Northampton, MA) or Igor Pro (Wavemetrics, Lake Oswego, OR). Spike trains were digitized into binary trains, and detrended. Coherence estimates were made between the digitized spike trains and the original RAM stimulus and given by the following: C(f) = [Psr(f)2/Pss(f)Prr(f)], where Pss and Prr denote the power spectrum of the stimulus and the response, and Psr denotes the cross-spectrum between the stimulus and response (e.g., the spike train). Pyramidal cells displaying spontaneous slow oscillations (Turner et al., 1996) were excluded from analysis. Statistical significance was determined using paired t tests unless otherwise noted. Cells were classified as high or low pass based on the ratio of their average coherence between 0 and 20 Hz, and between 30 and 50 Hz.
Afterhyperpolarizations (AHPs) were averages of five spikes generated by a current injection (0.1 nA) to reach the minimum spike threshold. Spikes were averaged after alignment of spikes at threshold using Clampfit 9.0 software (Molecular Devices, Palo Alto, CA). AHP measurements were taken at the peak of the fast AHP and at 10 ms after spike peak. Significance was assessed using a paired t test with a significance level of p < 0.05 unless otherwise noted. Statistical significance for ANOVA was determined using Tukey's honestly significant difference (HSD).
Results
Isolation of SK channel cDNA from Apteronotus
Degenerate PCR was used to isolate SK channel genes from Apteronotus brain mRNA (see Materials and Methods) revealing the expression of three different SK genes, orthologous to mammalian SK1, SK2, and SK3. Of these, only AptSK1 and -2 were detected in mRNA from the ELL, with AptSK2 expressed at much higher levels. At the cellular level, in situ hybridization studies showed that the expression of AptSK1 and -2 mRNAs occurs in a nearly identical segmental pattern within the ELL (data not shown); thus, the differential segmental effects of apamin or EBIO might be attributed to their actions on either AptSK1 or -2 channels. However, preliminary immunohistochemical analysis has shown that AptSK2 channels are strictly somatic in these cells (L. D. Ellis, unpublished observations), well positioned to contribute to the AHPs that regulate firing patterns and burst responses. In contrast, AptSK1 channels localize nearly exclusively to distal apical dendrites (Ellis, unpublished observations). We therefore attribute the effects of the application of SK channel modulators (apamin or EBIO) onto the pyramidal cell layer (described in subsequent sections) primarily to their action on AptSK2 channels. In the localization studies described below, we focused on AptSK2, which is the primary somatic SK channel in the ELL, although we cannot rule out a minor contribution from AptSK1 channels to the SK-mediated AHPs we record in these cells.
The AptSK2 channel is highly homologous to SK2 channels from other species (Fig. 1). The AptSK2 channel protein shows a 96.0% identity to the trout ortholog and 86.8% identity to the human SK2 (Fig. 1A). Regions of functional importance are highly conserved, including the putative pore region, the six transmembrane segments, and two residues in the C-terminal intracellular tail (AptSK2; R422, K436) that are required for the calmodulin interactions necessary for gating and surface expression (Lee et al., 2003). Two residues (AptSK2; N334, D307) in the outer vestibule of the pore that are respon4sible for apamin sensitivity (Ishii et al., 1997) are also conserved. The high level of sequence conservation indicates that AptSK2 should function and show drug responses similar to previously cloned SK2 channels.
Figure 1.
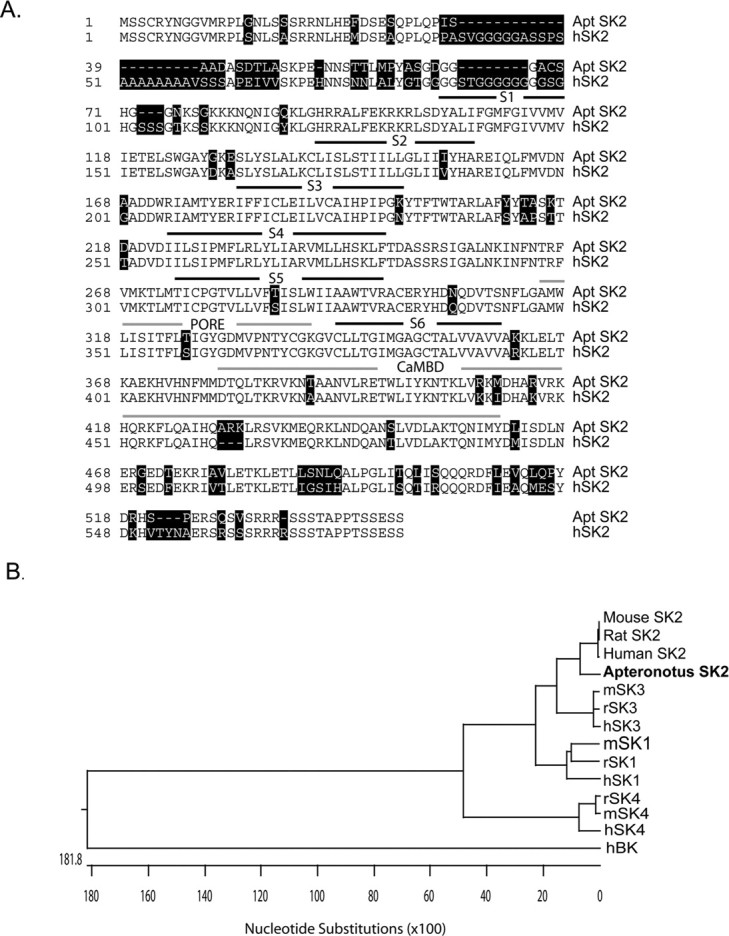
Sequence evaluation of SK2. A, Alignment of the amino acid sequences from the cloned SK2 channel from Apteronotus (Apt) with the human channel (hSK2). Sequence variations are highlighted. The six predicted transmembrane segments (S1–S6) are indicated (black lines) along with the channel pore and predicted CaMBD (calmodulin-binding domain) (gray lines). B, Phylogenic comparison of the AptSK2 channel with the human (h), rat (r), mouse (m) SK channels and the human BK channel shows that the AptSK2 channel is homologous to the previously cloned mammalian channels. Analysis was with the Clustal W method within the Lasergene software package.
AptSK2 gene expression is regulated in a map-specific manner
The ELL receives direct input from electroreceptors on the skin and is responsible for the primary processing of electrosensory information, which is then relayed onto higher brain areas. The ELL is subdivided into four segments containing topographic maps of the fish body (Heiligenberg and Dye, 1982; Carr et al., 1986). The most medial segment (MS) receives input from ampullary receptors and was not assessed in this study. The three sequential lateral segments (CMS, CLS, and LS) receive identical inputs from tuberous receptors (for review, see Turner and Maler, 1999). Each segment is organized in a laminar pattern with three distinct classes of pyramidal cells (superficial, intermediate, and deep) defined on the basis of morphological, biochemical, and physiological criteria (Turner and Maler, 1999; Bastian et al., 2002, 2004). Superficial and intermediate pyramidal cells are located in the pyramidal cell layer, whereas the granular layer contains the deep pyramidal neurons (these were not examined in this study, because it is difficult to distinguish them from adjacent interneurons).
In situ hybridization was used to characterize AptSK2 mRNA levels in pyramidal neurons of the three ELL segments. The AptSK2 probe was 397 nt in length, comprising 232 nt of 5′-UTR and 165 nt of coding sequence. In control experiments, the sense probe showed low levels of nonspecific staining across all segments of the ELL and other brain regions (data not shown). Mean OD measurements were taken from individual cells sampled from across all segments for the sense controls. The average OD was 61.5 ± 17.1 (n = 59 cells from three sections from three different fish), which we take to represent the value of background nonspecific staining; the mean value of the sense OD values is indicated by an arrow in Fig. 2C.
The staining pattern produced by the AptSK2 antisense probe revealed that a large number of pyramidal neurons from both the LS and CLS were strongly labeled, whereas in the CMS fewer cells were AptSK2 positive (Fig. 2). Within the LS and CLS, both superficial and intermediate pyramidal neurons were strongly stained along with several classes of interneurons (granular cells and VML neurons) (Fig. 2B). Interestingly, in the CMS, the expression of AptSK2 mRNA appeared to be restricted to intermediate pyramidal neurons alone, whereas adjacent superficial neurons appeared unlabeled.
To quantify the expression of the AptSK2 probe, each segment was divided into superficial and intermediate pyramidal cell layers (resulting in six separate compartments) and the OD of individual cells was measured (see Materials and Methods). The staining pattern for the CMS superficial layer was unimodal with a mean OD of 66.7 ± 25.7 (Fig. 2C). This distribution completely overlapped and was not statistically different from that of the sense controls (t test, p > 0.05; note location of arrow in Fig. 2C), implying that this is background staining and CMS superficial pyramidal cells do not express AptSK2 mRNA. The OD histograms from the other five regions were bimodal showing two distinct peaks (data not shown). The first peak had mean values comparable with the sense controls, whereas the second peak showed much higher OD values suggesting that there were two populations of pyramidal neurons, one that expressed AptSK2 mRNA and another that did not. We picked an OD of 135 as the separating value between the two OD populations because this was the maximum OD value from the CMS superficial cells (Fig. 2C, dotted line) and a trough was present at this level in the CMS intermediate, CLS, and LS OD histograms. The peaks were analyzed by averaging the data points between 0 and 135 (low OD values) and 135 and 255 (high OD values). When the two regions of the histogram were compared individually across the five regions that showed bimodal peaks, the mean OD values were not statistically different for either the low (CMS intermediate, 73.4 ± 27.9; CLS superficial, 67.6 ± 28.4; CLS intermediate, 71.9 ± 34.3; LS superficial, 74.6 ± 29.6; LS intermediate, 75.0 ± 34.3; p = 0.65, one-way ANOVA) or high groups (CMS intermediate, 173.2 ± 21.2; CLS superficial, 174.3 ± 18.4; CLS intermediate, 175.6 ± 20.3; LS superficial, 174.3 ± 21.5; LS intermediate, 176 ± 26.6; p = 0.98, one-way ANOVA). The five regions were therefore combined for additional statistical analysis (Fig. 2D). The summed histograms were again divided in the same way: low OD value group (0–135) and high OD value group (135–255) (Fig. 2D, dotted line). When the OD values of the CMS superficial group were compared with the high and low groups from the summed histogram, a significant difference between the three groups was found (one-way ANOVA). Post hoc analysis revealed that this was the result of differences between the high group and either the low group (Tukey's HSD, p < 0.0001) or the CMS superficial values (Tukey's HSD, p < 0.0001), whereas there was no significant difference between the low group and the CMS superficial values (Tukey's HSD, p = 0.46). We conclude that the low OD group from the combined histograms was the result of background staining, which was further supported by the fact that there was no statistical difference among the low OD group, the CMS superficial cells, and sense control values (one-way ANOVA, p > 0.05).
This analysis indicates that the levels of in situ hybridization signal for the AptSK2 mRNA are low or not present in all pyramidal neurons from the CMS superficial layer, whereas the other regions (CLS, LS, and the intermediate cells of CMS) have two cell populations that are either strongly positive for AptSK2 or do not express AptSK2 mRNA (Fig. 2). This suggests that AptSK2 channels may contribute to the response properties of only certain types of pyramidal neurons in this system. Therefore, to further understand the roles that the different levels of AptSK2 channel expression might play in the ELL, we used pharmacological modulation to probe pyramidal neuron responses in an in vitro slice preparation. The above data predict that CMS superficial cells should not respond to drugs that modify SK channel function, whereas the other regions should contain both responsive and unresponsive pyramidal neurons.
I-type pyramidal neurons lack SK channels
An interesting feature of the mRNA localization was the bimodal OD peak apparent in the CLS, LS, and intermediate CMS segments. The number of positively stained neurons was approximately one-half of the pyramidal cell density assessed from Nissl and Golgi stains (Maler, 1979). This result suggested that AptSK2 gene expression was restricted to a subclass of pyramidal neurons. Pyramidal neurons in the ELL are divided approximately equally between the E- and I-types, which respond best to either increases (E-cells) or decreases (I-cells) in the amplitude of EOD distortions in the external environment (Maler, 1979; Saunders and Bastian, 1984). E-cell types are readily identified histologically by the presence of a large basilar dendrite that receives direct excitatory input from the primary afferents. To test whether SK currents were restricted to one of these cell types, we compared apamin-sensitive AHPs in Neurobiotin-labeled E- and I-cells.
Intracellular recordings from pyramidal neurons in an in vitro slice preparation of the ELL (Mathieson and Maler, 1988; Turner et al., 1994; Berman and Maler, 1999) were used to assess the spike responses across the ELL. Spikes were evoked through stimulation with a suprathreshold current injection. The contribution of SK channels to the AHP and firing pattern was tested by application of the channel blocker apamin (1 μm) and/or the channel agonist EBIO (1 mm). After recording, cells were filled with Neurobiotin to allow for identification of not only pyramidal cell subtype (E or I) but also their location in relation to the pyramidal cell body layer (superficial or intermediate).
The AHP after an action potential was measured in relation to the membrane potential before spike threshold was reached. Measured at its maximum value of hyperpolarization, the AHP of identified I-cells (Fig. 3A) in all ELL segments was insensitive to either apamin (−5.7 ± 0.9 to −6.5 ± 1.0 mV; n = 13; p > 0.05, paired t test) or EBIO treatment (−7.0 ± 2.1 to −7.6 ± 3.2 mV; n = 5; p > 0.05, paired t test) (Fig. 3B). Thus, the I-type pyramidal neurons, which are inhibited by stimulation of the receptive field center, are also characterized by the absence of SK channels.
Figure 3.

I-cells do not respond to SK channel modulation. A, Neurobiotin-labeled I-cell showing the lack of a basilar dendrite (arrow). B, C, Superimposed spike averages from single I-cells showing no change in the AHP after either EBIO (B) or apamin (C) application.
Characterization of apamin-sensitive AHPs in basilar (E-type) pyramidal neurons
The lack of apamin and EBIO sensitivity in I-type pyramidal neurons suggests that the in situ hybridization studies were detecting AptSK2 mRNA in E-type cells only (CLS, LS, and CMS intermediate cells). Furthermore, because there was a lack of AptSK2 mRNA expression in the CMS superficial cell layer, measurements of the apamin-sensitive contribution to the AHP in the E-type cells should follow the patterns of mRNA distribution shown in Figure 2 and should only be apparent in E-cells from the LS, CLS, or CMS intermediate sections. This prediction was tested by analysis of the AHPs that followed current-induced spike responses in Neurobiotin-labeled E-type pyramidal neurons (Fig. 4A) from all three segments of the ELL. The AHP, measured at its trough (1.21 ± 0.73 ms after the peak of the action potential; n = 16), was examined before and after the application of apamin (Fig. 4B). Because both superficial and intermediate cells of the LS and CLS showed responses to apamin, we pooled the cell data sets within these segments for analysis. Apamin reduced the AHP to 30 ± 12% of predrug values (from 7.6 ± 1.4 to 2.3 ± 0.35 mV; n = 6) of control in the LS and 60 ± 9% of control (from 6.4 ± 0.58 to 4.2 ± 0.78 mV; n = 8) in the CLS (Fig. 4B). Thus, apamin-sensitive SK currents are present in E-type pyramidal neurons of both segments, with an apparently greater contribution to the AHP in LS neurons.
Figure 4.

E-cell responses to apamin match the AptSK2 distribution patterning. A, An E-cell labeled with Neurobiotin showing the presence of a basilar dendrite (arrow). B, Single-cell AHP averages generated via intracellular current injection (0.1 nA) superimposed before and after drug treatment. Neurons in the LS and CLS along with CMS intermediate cells respond to apamin (gray) with a decrease in the size of the AHP. CMS superficial cells do not show a response to apamin. C, A representative CLS cell showing an increased and persistent AHP after EBIO. D, A CMS superficial cell showing no response to EBIO. E, Elimination of the DAP after TTX application to the apical dendrites reveals that the time course of the DAP overlaps that of the apamin-sensitive AHP.
In contrast to the LS and CLS, superficial pyramidal neurons in the CMS were not labeled with the AptSK2 probe; however, the adjacent intermediate E-type pyramidal cells (∼10–20 μm cell-to-cell spacing) (Maler, 1979) were positive for AptSK2 mRNA (Fig. 2B). The absence of active SK channels in Neurobiotin-labeled superficial E-type neurons was confirmed when recordings revealed markedly smaller AHPs in comparison with nearby intermediate E-type cells (CMS superficial, −1.85 ± 0.35; CMS intermediate, −7.6 ± 1.2 mV; p < 0.05, paired t test) (Fig. 4B); the AHPs of the CMS superficial E-type pyramidal cells were not reduced by apamin (112 ± 7% of control; change of −0.6 ± 0.45 mV; n = 4). In contrast, SK channels were expressed in the CMS intermediate E-type cells (Fig. 4B) with apamin reducing the average AHP to 40 ± 8% (−2.0 ± 0.4 mV; n = 3) of control levels for labeled cells. These results confirm that SK channel activity is characteristic of intermediate, but not superficial E-type pyramidal neurons in the CMS. All changes in AHP size were significant compared with CMS superficial cells (p < 0.05, one-way ANOVA, Tukey's post hoc test).
Because all the E-type pyramidal neurons in the LS, CLS, and the intermediate E-type pyramidal cells of the CMS had apamin-sensitive AHPs, we combined these populations (referred to as the SK group) for analysis of the response to the SK channel agonist EBIO. Application of EBIO led to a significant (p < 0.01, paired t test) increase in the size of the AHP for the SK group to 137 ± 42% of control (−6.4 ± 2.5 to −8.2 ± 2.9 mV; n = 14) (Fig. 4C), whereas CMS E-type superficial cells remained close to control levels at 97 ± 8% (−2.15 ± 0.7 to −2.1 ± 0.45 mV; n = 4) (Fig. 4D). We therefore also pooled the CMS E-type superficial cells with the I-type cells (all segments) into a non-SK group, for evaluation of bursting and frequency tuning (see below), because in these populations the AHP was not affected by either apamin or EBIO (Figs. 3, 4).
Importantly, enhancement of the AptSK2 current with EBIO in the SK group also led to a significant increase in the duration of the mAHP, resulting in a residual hyperpolarization of 2.8 ± 2.5 mV at a point 10 ms after the spike peak (Fig. 4C) (p < 0.01, paired t test), consistent with the finding that EBIO prolongs the open time of SK channels (Pedarzani et al., 2001). Thus, the measurements of both apamin and EBIO effects on the AHPs confirmed that AptSK2 channels are differentially expressed among the pyramidal neurons in the ELL, as predicted by the mRNA localization studies. Furthermore, the electrophysiology demonstrated that the cells that were negative for AptSK2 expression in the LS and CLS were likely I-type pyramidal cells because they showed a lack of drug response similar to the AptSK2-negative E-type superficial cells of the CMS (Fig. 4D).
SK channels oppose burst firing in ELL pyramidal neurons
To understand how SK channel current might contribute to the response properties of E-type pyramidal neurons, the role of the depolarizing afterpotentials (DAPs) must be considered. Pyramidal neurons of the ELL respond to electrosensory inputs in two modes, single spikes or bursts of spikes (Gabbiani et al., 1996; Metzner et al., 1998; Oswald et al., 2004). Burst firing is driven by depolarizing current in the form of a DAP generated by current flowing back to the soma from actively backpropagating dendritic spikes. The dendritic origin of the DAP can be revealed by blocking dendritic sodium channels with the application of TTX to the apical dendrites, eliminating the dendritic spike (Turner et al., 1994; Lemon and Turner, 2000; Mehaffey et al., 2006). In superficial pyramidal neurons from the LS, TTX can block a potent DAP that lasts for 8–10 ms after spike initiation, a time course that overlaps the apamin-sensitive AHP in these cells (Fig. 4E). Although the DAP can be evident after a single action potential, as seen in the LS, it can also require the cumulative buildup of backpropagating spikes, as previously demonstrated in the CMS (Lemon and Turner, 2000). Furthermore, although the DAP is not always readily apparent, blockade of the dendritic spike always reveals a significant impact of the DAP on both the firing dynamics of the cell and on the AHP (Turner et al., 1994; Mehaffey et al., 2005). In general, the polarity and magnitude of spike afterpotentials reflect interplay between the depolarizing currents arising from dendritic spike backpropagation and the somatic hyperpolarizing currents arising from SK channels.
The temporal overlap of apamin-sensitive currents with the DAP suggested that SK channels would oppose burst generation in the ELL pyramidal cells through their ability to reduce the DAP. To test this idea, we examined the firing patterns of pyramidal neurons expressing apamin-sensitive currents before and after SK channel modulation. We used the coefficient of variation (CV) of interspike intervals (ISIs) as a simple measure of the variability of spike discharge in response to step depolarizations; we used the burst fraction as an equivalent measure when analyzing the response of these cells to noise injections (see below). A CV of ≅1 is indicative of random firing (Poisson process with exponentially distributed ISIs) (Softky and Koch, 1993; Bair et al., 1994; Shadlen and Newsome, 1998), whereas a CV ≫ 1 is typically associated with burst discharge (Wilbur and Rinzel, 1983), allowing this measure to serve as a sensitive burst indicator. A representative E-type pyramidal neuron from the CLS responded to a step depolarization by initially firing in an irregular manner (0.3 nA) (Fig. 5A). Application of EBIO regularized the discharge pattern, whereas apamin produced a burst-type discharge. The entire SK group of neurons had CV values near 1 (0.95 ± 0.38; n = 25), suggesting that their discharge is random (Poisson process). Similar to the effect on the cell in Figure 5A, application of the SK agonist EBIO decreased the CV from 1.1 ± 0.6 to 0.4 ± 0.4 (p < 0.01, paired t test; n = 11), which represents a regularization of the control Poisson-like firing pattern. The ISI histogram (ISIH) for the cell in Figure 5 revealed a dramatic shift to higher ISI values in response to EBIO, completely eliminating the shorter ISIs present in the original firing pattern (Fig. 5B). In the SK channel group, EBIO increased the mean ISI from 22.8 ± 8.2 to 51.7 ± 36.8 ms (n = 11; p < 0.02, paired t test). In contrast, apamin (1 μm) led to an increase in CV values from 0.96 ± 0.12 to 1.77 ± 0.22 (p < 0.05, paired t test; n = 14), representing a conversion to burst firing. This was accompanied by a conversion of the ISIH to a bimodal distribution (Fig. 5B) and a decrease in the ISIs of its first peak from 15 ± 1.6 ms (control) to 7.6 ± 0.78 ms (the intraburst peak; p < 0.05; n = 14). The conversion of pyramidal cells from a tonic to bursting mode was also demonstrated when the ISI values were plotted as a joint interval return map (Fig. 5C). A random distribution of points is indicative of nonbursting units, whereas a tightly clustered group at short intervals combined with points along the x- and y-axes stretching out to longer intervals has been previously demonstrated to represent burst firing (Turner et al., 1996). The baseline ISI values were associated with a randomly distributed return map. After EBIO, the ISI values were clustered at higher values, which was converted to a burst pattern after apamin (Fig. 5C). We conclude that the AptSK2-mediated mAHP, by reducing the DAP that drives burst firing, can inhibit burst responses in the SK-positive ELL pyramidal cells.
Figure 5.

SK channels control the firing mode of a CLS cell. A, Representative traces from a CLS E-cell (0.3 nA current injection) showing a regularization of the firing pattern after EBIO (1 mm) and the subsequent conversion to a burst-firing mode after application of apamin (1 μm). B, Plotting the natural logarithm of the ISIs representing the traces in A shows a shift of the ISI distribution to longer intervals in response to EBIO along with a decrease in the spike count; the interval axis has been labeled in time units for clarity. The ISI distribution is shifted to shorter intervals and becomes clearly bimodal after apamin. The first peak of the apamin ISIH contains the burst spikes. C, Joint interval return maps showing randomly distributed points under baseline conditions confirm a nonbursting firing mode; the shortest ISIs are typically >10 ms. EBIO leads to an increase in ISI values and a regularization that is demonstrated by the presence of a single cluster of long ISIs. Apamin leads to a separation of the return map into a burst cluster (ISIs, <10 ms) and broadly distributed longer ISI returns representing variable interburst intervals as previously shown (Turner et al., 1996).
SK channels promote high-frequency tuning of ELL pyramidal neurons
The ability for SK channels to oppose burst firing in some classes of pyramidal neurons prompted us to examine the potential for SK currents to modulate frequency responses in this system. A previous study has suggested that ELL pyramidal cells can respond to afferent input in a frequency-dependent manner: spike bursts code preferentially for low-frequency signals and isolated spikes code over a broad frequency range (Oswald et al., 2004). The finding that SK channels oppose burst firing by counteracting the DAP raised the question: do SK channels, through their ability to reduce burst firing, have an effect on the frequency tuning of pyramidal cells? To address this question, cells were stimulated with random amplitude modulated (RAMs; 0–60 Hz Gaussian noise) current injections (Oswald et al., 2004). These stimulations are within the frequency range, and representative of, sensory input that the fish encounters during electrolocation and electrocommunication. As well, in vivo intracellular recordings (Chacron et al., 2003; Middleton et al., 2006) have demonstrated that the membrane potential of a pyramidal cell can faithfully track synaptically transmitted sensory input within this frequency range. The current injections that we used are therefore a reasonable mimic of natural signals.
To quantify the frequency response, a coherence ratio (ratio of the area under the coherence curve between 30 and 50 Hz to that under 0 and 20 Hz) was calculated. Labeled E-cells (Fig. 4A) were identified in terms of their segment (CMS, CLS, LS) and position within the pyramidal cell layer (superficial or intermediate). All cells from the LS (n = 3) and CLS (n = 7) along with CMS intermediate cells (n = 4) were broadband to high pass with a mean coherence ratio of 1.27 ± 0.2 (Fig. 6A, broadband cell) (n = 14). These cell types were all SK channel positive based on their responses to apamin and EBIO. In contrast, labeled I-cells (Fig. 3A, all segments) had coherence ratios of 0.68 ± 0.02 (Fig. 6B) (n = 13) with an upper limit to the 95% confidence interval of 0.86. Although the broadband/high-pass cells of the SK group do not fall within this range, the superficial E-cells in the CMS do (0.79 ± 0.02) (Fig. 6C) (n = 3). We use this value to define low-pass cells (coherence ratios, <0.86); cells above this value are classified as broadband to high pass. We conclude that the frequency response characteristics of ELL pyramidal neurons can be grouped into two classes, with the I-type and CMS superficial E-type cells in the low-pass non-SK group, and the E-types in the LS, CLS, and intermediate CMS in the broadband–high-pass SK group.
Figure 6.
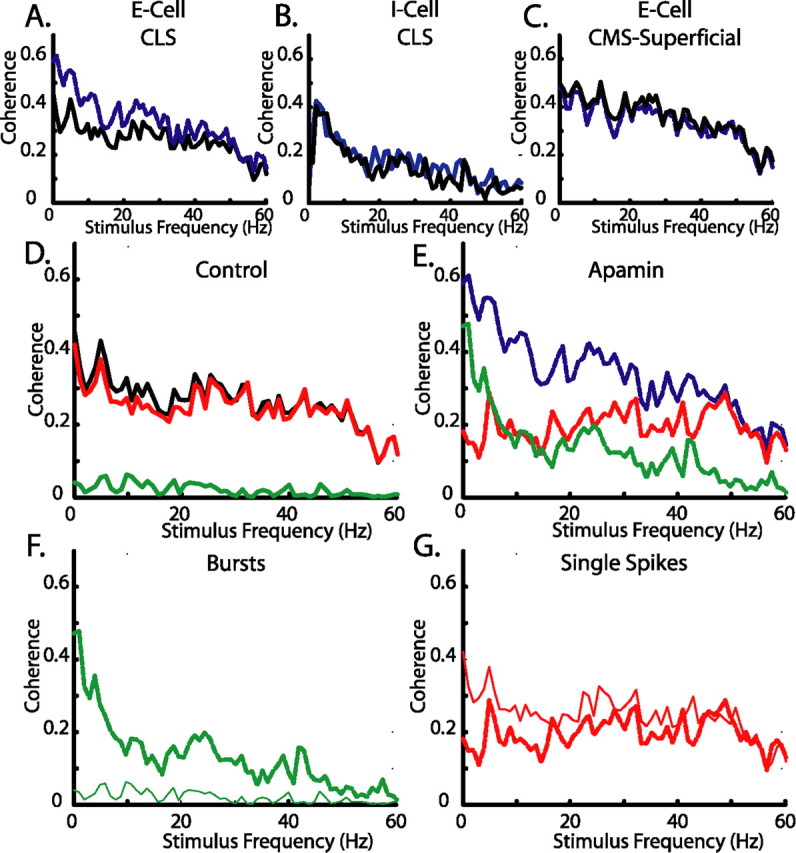
Increased response to low-frequency stimuli follow SK channel block. Neurons were given a RAM current injection of 0–60 Hz Gaussian noise representative of naturalistic stimuli. A, Coherence plot of a representative broadband CLS cell showing an increased response to low frequencies after apamin (blue). B, C, Neither I-cells (B) nor CMS superficial cells (C) show frequency–response changes to the RAM after application of apamin (1 μm; blue). D, E, Separation of the coherence response of the CLS cell from A under control conditions (D; black;) and apamin (E; blue) into components attributable to single spikes (red) or bursts (green). F, Overlay of burst component from D (thin trace) and E (thick trace) showing an increased burst response to low frequencies. G, Overlay of the isolated spike component from D (thin trace) and E (thick trace) showing only minor response changes.
These differences allowed cells to subsequently be identified based on their frequency tuning alone (e.g., without Neurobiotin labeling). We grouped cells into a functional SK group (presumptive E cells in CLS, LS, and intermediate E cells in CMS) when their coherence ratios were >0.86; when the ratio was <0.86, the cells were classified as belonging to the non-SK group, presumptive superficial E cells in CMS and all I cells.
When analyzing the effects of RAM stimulation, we used the burst fraction (ratio of burst spikes to all spikes) as a measure of changes in bursting, because the CV is as strongly influenced by the noise input as by the intrinsic dynamics of the neuron. Bursts are defined as events with ISIs <8 ms (corresponding to the first peak of the ISI histogram in Fig. 5B) and are counted as single events based on the first spike in the group. The non-SK group had a coherence ratio of 0.69 ± 0.025 and a burst fraction of 0.19 ± 0.017 (n = 13). In contrast, the SK group (made up of a combination of high-pass and broadband cells) had an average coherence ratio of 1.31 ± 0.21 and a significantly lower burst fraction of 0.092 ± 0.02 (n = 15; p < 0.05, paired t test). The difference in coherence of the non-SK (low-pass) and SK (broadband/high-pass) groups can therefore be associated with increased bursting within the non-SK group as measured from both the RAM (burst fraction) and step current injection (CV) (see above).
When apamin was applied to the non-SK (low-pass) group, there was no significant change in the burst fraction (112 ± 8% of control; 0.192 ± 0.04 to 0.228 ± 0.02; p > 0.05, paired t test; n = 13) or coherence ratio (Fig. 6B,C) (0.690 ± 0.025 to 0.677 ± 0.024; p > 0.05, paired t test; n = 13). However, when apamin was applied to the SK group (broadband/high pass), the burst fraction increased to 210 ± 30% of control values (0.127 ± 0.025 to 0.206 ± 0.015; p < 0.05, paired t test; n = 13) and the coherence ratio was decreased from 1.31 ± 0.21 to 0.89 ± 0.05 (Fig. 6A) (p < 0.05, paired t test; n = 15), demonstrating that the cells were bursting more and responding better to low frequencies when SK channels are blocked. This change was not attributable to a decreased response to high frequencies, but rather an increase in the response to low frequencies (Fig. 6A).
It was previously shown that ELL pyramidal cell bursts are good detectors of low-frequency signals (Oswald et al., 2004). To evaluate whether the apamin-induced increase in bursting (SK group) was responsible for the improvement in response to low-frequency input, we first separated the spike train into bursts and isolated spikes (Fig. 6D,E; broadband cell from Fig. 6A). We then computed coherence estimates for both bursts and isolated spikes as described previously (Oswald et al., 2004). The increase in burst fraction was associated with an increase in the mean burst coherence of the low-frequency component of the input (0–20 Hz) to 175 ± 7% of control (p < 0.05, paired t test; n = 14) (Fig. 6F). The isolated spike coherence remained unchanged (Fig. 6G) and isolated spikes coded equally well for all frequencies. We conclude that an SK-generated mAHP contributes to frequency tuning in LS and CMS cells by reducing the magnitude of the DAP; this in turn increases the burst threshold and subsequently decreases the response of the pyramidal cell to low-frequency input. Conversely, the lack of SK currents in the superficial cells of the CMS and in all I-type cells permits them to generate burst responses and respond well to low-frequency input.
Discussion
Sensory systems are tuned to the natural environmental and communication signals that have shaped their evolution. In senses such as audition and vision, a key feature of such signals is their frequency. Tuning to the frequency content of tones is a fundamental aspect of auditory physiology. Visual cortex neurons are tuned to both temporal and spatial frequencies and, as a consequence, to stimulus velocity (Priebe et al., 2006). Models of frequency tuning in the CNS generally invoke network and synaptic dynamics to account for frequency tuning (Krukowski and Miller, 2001). However, the potential contribution of single-cell dynamics as determined by ionic conductances, such as Ca2+-activated K+ channels, has not been investigated in as much detail (Stocker and Pedarzani, 2000). The electrosensory system of A. leptorhynchus is adapted to detect AMs arising from communication signals and the motion of prey. This requires tuning to AM frequencies ranging from ∼1 to 300 Hz (Nelson and Maciver, 1999; Benda and Herz, 2003) and spatial frequencies of 0.2–2 cycles/cm (Nelson and Maciver, 1999). We demonstrated that SK channels are required for high-frequency tuning of ELL pyramidal neurons. We show that SK channels oppose burst firing in a subset of these neurons, resulting in a selective reduction in low-frequency tuning. This allows for control of the relative sensitivity of ELL pyramidal cells to the low (prey detection)- and high (electrocommunication)-frequency signals.
SK channels are expressed in the mammalian CNS and mediate a Ca2+-dependent mAHP that becomes activated within 1–5 ms and can persist for up to 200 ms (Xia et al., 1998). Their activity has been reported to affect numerous apparently unrelated neuronal processes, which may reflect differences in the Ca2+ source or may be the result of the concurrent activity of other voltage- and/or ligand-gated channels (Marder and Goaillard, 2006). We cloned the SK2 channel from A. leptorhynchus and demonstrated evolutionary conservation with respect to the amino acid sequences involved in K+ ion selectivity, calmodulin binding, and apamin sensitivity. The distribution of AptSK2 mRNA in pyramidal neurons of the ELL was polarized, with high levels expressed in pyramidal neurons that detect high-frequency communication signals (LS, CLS E-type cells) in comparison with the low levels expressed in the cell types specialized for low frequencies (CMS superficial E-type cells and I-type cells in all segments). In vivo I-cells, which do not express SK channels, are also tuned to lower frequencies than E-type cells (CLS, LS) (Chacron et al., 2005). This strengthens the notion that the cellular properties found in vitro contribute to the functional properties of the intact circuitry in vivo. In particular, our results suggest that frequency tuning of pyramidal cells might be controlled in part by AptSK2 channels.
An analysis of the properties of the spike-induced AHPs confirmed the differential expression of AptSK2 channels indicated by the localization of its mRNA. An apamin- and EBIO-sensitive mAHP was detected in the pyramidal neurons that express the AptSK2 mRNA. In contrast, all I-type and CMS superficial E-type pyramidal neurons failed to respond to SK channel modulation. Thus, the differential expression of AptSK2 mRNA results in a nonuniform distribution of functional SK channels in pyramidal neurons of the ELL.
The functional significance of these differences in SK channel expression became evident when the frequency response properties of these neurons were analyzed. Neurons were stimulated with RAM current injections, and the frequency dependence of their spike responses was analyzed. The results showed that AptSK2-positive pyramidal cells were responsive to a broad range of frequencies (0–60 Hz), whereas AptSK2-negative cells were more responsive to low frequencies. Furthermore, in AptSK2-positive neurons, the response of the cell to low frequencies could be increased after apamin application, whereas the response to high frequencies was not affected. Thus, SK channels are required to limit the low-frequency response in these cells and the absence of SK channel activity biases their response to low frequencies.
The ability of SK channels to reduce the low-frequency response is accomplished through their action of opposing burst firing in these cells. We previously demonstrated that bursts are caused by DAPs that arise from actively backpropagating spikes in ELL pyramidal cell apical dendrites (Turner et al., 1994; Lemon and Turner, 2000; Fernandez et al., 2005) and that bursts are selectively tuned for low-frequency stimuli (Oswald et al., 2004, 2007; Doiron et al., 2007). We now showed that the SK-mediated mAHP temporally overlaps and opposes the DAP, reducing burst firing. In this way, SK channels selectively decrease the low-frequency response by increasing the threshold for burst firing. As predicted, apamin treatment had no effect on the AHPs or frequency tuning of SK2-negative pyramidal cells of the CMS or I-type cells. Consistent with this mechanism, measurement of the burst fractions of pyramidal cells demonstrated a negative correlation with SK2 expression and apamin sensitivity. Apamin-sensitive cells showed a significantly lower burst fraction (9.2 ± 2%) than apamin-insensitive cells (19 ± 1.7%; p < 0.05, paired t test). These results demonstrate that the differential expression of SK channels plays an important role in determining the frequency selectivity of ELL pyramidal neurons.
It is likely that there are numerous network and biophysical mechanisms that regulate the relative size of the DAP and mAHP, allowing them to control bursting and thus low-frequency tuning. At the network level, it has already been established in vivo that frequency tuning is controlled by feedback input to ELL pyramidal cells (Chacron et al., 2005). Additional support for this comes from in vitro studies showing that the DAP amplitude and bursting can be regulated by these feedback pathways (Mehaffey et al., 2005). The necessity for cell-intrinsic regulation of bursting is suggested by the greater prominence of the DAP in LS (Fig. 4A). Thus, to prevent bursting in the LS, a large opposing SK current would be required, as is seen in Figure 4B. An additional player in the balancing act between the mAHP and DAP are persistent Na+ currents (INaP), which have previously been implicated in the production of DAPs and control of bursting (Azouz et al., 1996; Yue et al., 2005). INaP is prominent in ELL pyramidal cells (Turner et al., 1994; Berman et al., 2001; Doiron et al., 2003). Therefore, as recently discussed (Izhikevich, 2006; Marder and Goaillard, 2006), the function of SK channels cannot be predicted from their dynamics alone. Rather, in this case, information transmission by ELL pyramidal cells likely depends on the complex dynamical interactions of at least SK channels, DAPs generated by dendritic Na+ channels, somatic persistent Na+ channels, and feedback from synaptic input.
The regulation of bursting through the interplay of the mAHP and DAP is not unique to the ELL. It has previously been shown that apamin blockade of a mAHP can lead to bursting through an unmasking of a DAP (Ping and Shepard, 1999). In mammalian neurons, the DAP has been attributed to a number of active ionic currents, which may include backpropagation of dendritic spikes (Nishimura et al., 2001). The regulation of DAP amplitude by an SK current may therefore be a common mechanism through which neurons can regulate bursting. Burst regulation in these neurons has not, however, been linked to specific neural computations such as frequency tuning. Here, we showed that control of bursting plays a specific role in the higher order processing abilities of a neuron, and possibly an animal's subsequent response to specific sets of environmental stimuli (prey).
In ELL pyramidal cells, bursts are believed to function as feature detectors for low-frequency/jamming stimuli (Gabbiani et al., 1996). Previous in vivo work (Shumway, 1989; Metzner and Juranek, 1997; Chacron et al., 2005) along with our results suggest that CMS pyramidal cells (E and I) will be tuned to the low frequencies induced by these signals, whereas the LS (E cells) will be tuned to high-frequency communication signals. However, LS pyramidal cells are also the most sensitive to weak signals (Shumway, 1989), which suggests that they are essential in detecting distant prey (Nelson and Maciver, 1999). The velocity (V), and spatial (SF) and temporal (TF) frequencies associated with prey capture are simply related as follows: TF (cycles/second) = SF (cycles/centimeter) × V (centimeters/second). Therefore a reduction in the fish's speed from >20 to <1 cm/s during prey acquisition will result in a concomitant reduction in the temporal frequencies produced by prey (down to ∼1 Hz) (Nelson and Maciver, 1999). Electroreceptors are not very sensitive to such low frequencies (Chacron et al., 2005). We therefore hypothesize that, when the fish engages in low speed scanning, enhancing the detection of the weak low-frequency signals could occur through the inhibition of SK channels, which would cause an upregulation of burst firing. This could be accomplished through a number of second messenger systems (Nicoll, 1988; Grunnet et al., 2004; Ren et al., 2006). Preliminary results suggest that serotonergic (5-HT) and cholinergic (Maler et al., 1981; Phan and Maler, 1983) input to the ELL can regulate bursting (Ellis, unpublished observations), although direct links to SK channels have not yet been established.
The fact that cortical pyramidal cells strongly express SK2 channels (Stocker and Pedarzani, 2000; Sailer et al., 2002; Villalobos et al., 2004) and that at least a subset of these are bursty, suggests that similar mechanisms to those described here may be operative in the control of velocity tuning of pyramidal cells in visual cortex (Priebe et al., 2006). Direct evidence with regard to SK channel control of frequency tuning is currently lacking for mammalian neurons expressing SK channels (including cortical pyramidal cells). The work presented here strongly suggests that the differential expression of SK channels may help to regulate frequency-dependent higher order sensory processing and, more generally, information processing via spike bursts.
Footnotes
This work was supported by Canadian Institutes of Health Research (CIHR) grants (R.J.D., L.M., R.W.T.) and by CIHR and Alberta Heritage Foundation for Medical Research (AFHMR) studentships (W.H.M.). R.W.T. is an AHFMR scientist. We thank Bill Ellis for technical support in the localization of the AptSK2 channels and Mathieu Lachance for technical assistance. We also thank Dr. Rudiger Krahe for the housing and maintenance of our fish.
References
- Andermann ML, Ritt J, Neimark MA, Moore CI. Neural correlates of vibrissa resonance; band-pass and somatotopic representation of high-frequency stimuli. Neuron. 2004;42:451–463. doi: 10.1016/s0896-6273(04)00198-9. [DOI] [PubMed] [Google Scholar]
- Azouz R, Jensen MS, Yaari Y. Ionic basis of spike after-depolarization and burst generation in adult rat hippocampal CA1 pyramidal cells. J Physiol (Lond) 1996;492:211–223. doi: 10.1113/jphysiol.1996.sp021302. [DOI] [PMC free article] [PubMed] [Google Scholar]
- Bair W, Koch C, Newsome W, Britten K. Power spectrum analysis of bursting cells in area MT in the behaving monkey. J Neurosci. 1994;14:2870–2892. doi: 10.1523/JNEUROSCI.14-05-02870.1994. [DOI] [PMC free article] [PubMed] [Google Scholar]
- Bastian J, Courtright J. Morphological correlates of pyramidal cell adaptation rate in the electrosensory lateral line lobe of weakly electric fish. J Comp Physiol A Neuroethol Sens Neural Behav Physiol. 1991;168:393–407. doi: 10.1007/BF00199600. [DOI] [PubMed] [Google Scholar]
- Bastian J, Chacron MJ, Maler L. Receptive field organization determines pyramidal cell stimulus-encoding capability and spatial stimulus selectivity. J Neurosci. 2002;22:4577–4590. doi: 10.1523/JNEUROSCI.22-11-04577.2002. [DOI] [PMC free article] [PubMed] [Google Scholar]
- Bastian J, Chacron MJ, Maler L. Plastic and nonplastic pyramidal cells perform unique roles in a network capable of adaptive redundancy reduction. Neuron. 2004;41:767–779. doi: 10.1016/s0896-6273(04)00071-6. [DOI] [PubMed] [Google Scholar]
- Behnisch T, Reymann KG. Inhibition of apamin-sensitive calcium dependent potassium channels facilitate the induction of long-term potentiation in the CA1 region of rat hippocampus in vitro. Neurosci Lett. 1998;253:91–94. doi: 10.1016/s0304-3940(98)00612-0. [DOI] [PubMed] [Google Scholar]
- Bell CC, Maler L. Central neuroanatomy of electrosensory systems in fish. In: Bullock TH, Hopkins CD, Popper AN, Fay RR, editors. Springer handbook of auditory research: electroreception. New York: Springer; 2005. pp. 68–111. [Google Scholar]
- Benda J, Herz AV. A universal model for spike-frequency adaptation. Neural Comput. 2003;15:2523–2564. doi: 10.1162/089976603322385063. [DOI] [PubMed] [Google Scholar]
- Berman N, Dunn RJ, Maler L. Function of NMDA receptors and persistent sodium channels in a feedback pathway of the electrosensory system. J Neurophysiol. 2001;86:1612–1621. doi: 10.1152/jn.2001.86.4.1612. [DOI] [PubMed] [Google Scholar]
- Berman NJ, Maler L. Neural architecture of the electrosensory lateral line lobe: adaptations for coincidence detection, a sensory searchlight and frequency-dependent adaptive filtering. J Exp Biol. 1999;202:1243–1253. doi: 10.1242/jeb.202.10.1243. [DOI] [PubMed] [Google Scholar]
- Berman NJ, Hincke MT, Maler L. Inositol 1,4,5-trisphosphate receptor localization in the brain of a weakly electric fish (Apteronotus leptorhynchus) with emphasis on the electrosensory system. J Comp Neurol. 1995;361:512–524. doi: 10.1002/cne.903610313. [DOI] [PubMed] [Google Scholar]
- Bottai D, Dunn RJ, Ellis W, Maler L. N-Methyl-d-aspartate receptor 1 mRNA distribution in the central nervous system of the weakly electric fish Apteronotus leptorhynchus. J Comp Neurol. 1997;389:65–80. doi: 10.1002/(sici)1096-9861(19971208)389:1<65::aid-cne5>3.0.co;2-c. [DOI] [PubMed] [Google Scholar]
- Carr CE, Maler L, Taylor B. A time-comparison circuit in the electric fish midbrain. II. Functional morphology. J Neurosci. 1986;6:1372–1383. doi: 10.1523/JNEUROSCI.06-05-01372.1986. [DOI] [PMC free article] [PubMed] [Google Scholar]
- Chacron MJ, Doiron B, Maler L, Longtin A, Bastian J. Non-classical receptive field mediates switch in a sensory neuron's frequency tuning. Nature. 2003;423:77–81. doi: 10.1038/nature01590. [DOI] [PubMed] [Google Scholar]
- Chacron MJ, Maler L, Bastian J. Feedback and feedforward control of frequency tuning to naturalistic stimuli. J Neurosci. 2005;25:5521–5532. doi: 10.1523/JNEUROSCI.0445-05.2005. [DOI] [PMC free article] [PubMed] [Google Scholar]
- Cloues RK, Sather WA. Afterhyperpolarization regulates firing rate in neurons of the suprachiasmatic nucleus. J Neurosci. 2003;23:1593–1604. doi: 10.1523/JNEUROSCI.23-05-01593.2003. [DOI] [PMC free article] [PubMed] [Google Scholar]
- Doiron B, Noonan L, Lemon N, Turner RW. Persistent Na+ current modifies burst discharge by regulating conditional backpropagation of dendritic spikes. J Neurophysiol. 2003;89:324–337. doi: 10.1152/jn.00729.2002. [DOI] [PubMed] [Google Scholar]
- Doiron B, Oswald AM, Maler L. Interval coding II: dendrite dependent mechanisms. J Neurophysiol. 2007;97:2744–2757. doi: 10.1152/jn.00988.2006. [DOI] [PubMed] [Google Scholar]
- Elhilali M, Fritz JB, Klein DJ, Simon JZ, Shamma SA. Dynamics of precise spike timing in primary auditory cortex. J Neurosci. 2004;24:1159–1172. doi: 10.1523/JNEUROSCI.3825-03.2004. [DOI] [PMC free article] [PubMed] [Google Scholar]
- Faber ES, Delaney AJ, Sah P. SK channels regulate excitatory synaptic transmission and plasticity in the lateral amygdala. Nat Neurosci. 2005;8:635–641. doi: 10.1038/nn1450. [DOI] [PubMed] [Google Scholar]
- Fernandez FR, Mehaffey WH, Turner RW. Dendritic Na+ current inactivation can increase cell excitability by delaying a somatic depolarizing afterpotential. J Neurophysiol. 2005;94:3836–3848. doi: 10.1152/jn.00653.2005. [DOI] [PubMed] [Google Scholar]
- Gabbiani F, Metzner W, Wessel R, Koch C. From stimulus encoding to feature extraction in weakly electric fish. Nature. 1996;384:564–567. doi: 10.1038/384564a0. [DOI] [PubMed] [Google Scholar]
- Grunnet M, Jespersen T, Perrier JF. 5-HT1A receptors modulate small-conductance Ca2+-activated K+ channels. J Neurosci Res. 2004;78:845–854. doi: 10.1002/jnr.20318. [DOI] [PubMed] [Google Scholar]
- Heiligenberg W, Dye J. Labelling of electroreceptive afferents in a gymnotoid fish by intracellular injection of HRP: the mystery of multiple maps. J Comp Physiol A Neuroethol Sens Neural Behav Physiol. 1982;148:287–296. [Google Scholar]
- Hudspeth AJ. Hearing. In: Kandel ER, Schwartz JH, Jessell TM, editors. Principles of neural science. Ed 4. New York: McGraw-Hill; 2000. pp. 590–613. [Google Scholar]
- Ishii TM, Maylie J, Adelman JP. Determinants of apamin and d-tubocurarine block in SK potassium channels. J Biol Chem. 1997;272:23195–23200. doi: 10.1074/jbc.272.37.23195. [DOI] [PubMed] [Google Scholar]
- Izhikevich EM. Cambridge, MA: MIT; 2006. Dynamic systems in neuroscience: the geometry of excitability and bursting. [Google Scholar]
- Kohler M, Hirschberg B, Bond CT, Kinzie JM, Marrion NV, Maylie J, Adelman JP. Small-conductance, calcium-activated potassium channels from mammalian brain. Science. 1996;273:1709–1714. doi: 10.1126/science.273.5282.1709. [DOI] [PubMed] [Google Scholar]
- Kramar EA, Lin B, Lin CY, Arai AC, Gall CM, Lynch G. A novel mechanism for the facilitation of theta-induced long-term potentiation by brain-derived neurotrophic factor. J Neurosci. 2004;24:5151–5161. doi: 10.1523/JNEUROSCI.0800-04.2004. [DOI] [PMC free article] [PubMed] [Google Scholar]
- Krukowski AE, Miller KD. Thalamocortical NMDA conductances and intracortical inhibition can explain cortical temporal tuning. Nat Neurosci. 2001;4:424–430. doi: 10.1038/86084. [DOI] [PubMed] [Google Scholar]
- Lancaster B, Hu H, Ramakers GM, Storm JF. Interaction between synaptic excitation and slow afterhyperpolarization current in rat hippocampal pyramidal cells. J Physiol (Lond) 2001;536:809–823. doi: 10.1111/j.1469-7793.2001.00809.x. [DOI] [PMC free article] [PubMed] [Google Scholar]
- Lee WS, Ngo-Anh TJ, Bruening-Wright A, Maylie J, Adelman JP. Small conductance Ca2+-activated K+ channels and calmodulin: cell surface expression and gating. J Biol Chem. 2003;278:25940–25946. doi: 10.1074/jbc.M302091200. [DOI] [PubMed] [Google Scholar]
- Lemon N, Turner RW. Conditional spike backpropagation generates burst discharge in a sensory neuron. J Neurophysiol. 2000;84:1519–1530. doi: 10.1152/jn.2000.84.3.1519. [DOI] [PubMed] [Google Scholar]
- Maler L. The posterior lateral line lobe of certain gymnotoid fish: quantitative light microscopy. J Comp Neurol. 1979;183:323–363. doi: 10.1002/cne.901830208. [DOI] [PubMed] [Google Scholar]
- Maler L, Collins M, Mathieson WB. The distribution of acetylcholinesterase and choline acetyl transferase in the cerebellum and posterior lateral line lobe of weakly electric fish (Gymnotidae) Brain Res. 1981;226:320–325. doi: 10.1016/0006-8993(81)91106-9. [DOI] [PubMed] [Google Scholar]
- Marder E, Goaillard JM. Variability, compensation and homeostasis in neuron and network function. Nat Rev Neurosci. 2006;7:563–574. doi: 10.1038/nrn1949. [DOI] [PubMed] [Google Scholar]
- Mathieson WB, Maler L. Morphological and electrophysiological properties of a novel in vitro preparation: the electrosensory lateral line lobe brain slice. J Comp Physiol A Neuroethol Sens Neural Behav Physiol. 1988;163:489–506. doi: 10.1007/BF00604903. [DOI] [PubMed] [Google Scholar]
- Mehaffey WH, Doiron B, Maler L, Turner RW. Deterministic multiplicative gain control with active dendrites. J Neurosci. 2005;25:9968–9977. doi: 10.1523/JNEUROSCI.2682-05.2005. [DOI] [PMC free article] [PubMed] [Google Scholar]
- Mehaffey WH, Fernandez FR, Rashid AJ, Dunn RJ, Turner RW. Distribution and function of potassium channels in the electrosensory lateral line lobe of weakly electric apteronotid fish. J Comp Physiol A Neuroethol Sens Neural Behav Physiol. 2006;192:637–648. doi: 10.1007/s00359-006-0103-z. [DOI] [PubMed] [Google Scholar]
- Metzner W, Juranek J. A sensory brain map for each behavior? Proc Natl Acad Sci USA. 1997;94:14798–14803. doi: 10.1073/pnas.94.26.14798. [DOI] [PMC free article] [PubMed] [Google Scholar]
- Metzner W, Koch C, Wessel R, Gabbiani F. Feature extraction by burst-like spike patterns in multiple sensory maps. J Neurosci. 1998;18:2283–2300. doi: 10.1523/JNEUROSCI.18-06-02283.1998. [DOI] [PMC free article] [PubMed] [Google Scholar]
- Middleton JW, Longtin A, Benda J, Maler L. The cellular basis for parallel neural transmission of a high-frequency stimulus and its low-frequency envelope. Proc Natl Acad Sci USA. 2006;103:14596–14601. doi: 10.1073/pnas.0604103103. [DOI] [PMC free article] [PubMed] [Google Scholar]
- Nelson ME, Maciver MA. Prey capture in the weakly electric fish Apteronotus albifrons: sensory acquisition strategies and electrosensory consequences. J Exp Biol. 1999;202:1195–1203. doi: 10.1242/jeb.202.10.1195. [DOI] [PubMed] [Google Scholar]
- Ngo-Anh TJ, Bloodgood BL, Lin M, Sabatini BL, Maylie J, Adelman JP. SK channels and NMDA receptors form a Ca2+-mediated feedback loop in dendritic spines. Nat Neurosci. 2005;8:642–649. doi: 10.1038/nn1449. [DOI] [PubMed] [Google Scholar]
- Nicoll RA. The coupling of neurotransmitter receptors to ion channels in the brain. Science. 1988;241:545–551. doi: 10.1126/science.2456612. [DOI] [PubMed] [Google Scholar]
- Nishimura Y, Asahi M, Saitoh K, Kitagawa H, Kumazawa Y, Itoh K, Lin M, Akamine T, Shibuya H, Asahara T, Yamamoto T. Ionic mechanisms underlying burst firing of layer III sensorimotor cortical neurons of the cat: an in vitro slice study. J Neurophysiol. 2001;86:771–781. doi: 10.1152/jn.2001.86.2.771. [DOI] [PubMed] [Google Scholar]
- Oswald AM, Chacron MJ, Doiron B, Bastian J, Maler L. Parallel processing of sensory input by bursts and isolated spikes. J Neurosci. 2004;24:4351–4362. doi: 10.1523/JNEUROSCI.0459-04.2004. [DOI] [PMC free article] [PubMed] [Google Scholar]
- Oswald AM, Doiron B, Maler L. Interval coding I: burst interspike intervals as indicators of stimulus intensity. J Neurophysiol. 2007;97:2731–2743. doi: 10.1152/jn.00987.2006. [DOI] [PubMed] [Google Scholar]
- Pedarzani P, Mosbacher J, Rivard A, Cingolani LA, Oliver D, Stocker M, Adelman JP, Fakler B. Control of electrical activity in central neurons by modulating the gating of small conductance Ca2+-activated K+ channels. J Biol Chem. 2001;276:9762–9769. doi: 10.1074/jbc.M010001200. [DOI] [PubMed] [Google Scholar]
- Pedarzani P, McCutcheon JE, Rogge G, Jensen BS, Christophersen P, Hougaard C, Strobaek D, Stocker M. Specific enhancement of SK channel activity selectively potentiates the afterhyperpolarizing current I(AHP) and modulates the firing properties of hippocampal pyramidal neurons. J Biol Chem. 2005;280:41404–41411. doi: 10.1074/jbc.M509610200. [DOI] [PubMed] [Google Scholar]
- Phan M, Maler L. Distribution of muscarinic receptors in the caudal cerebellum and electrosensory lateral line lobe of gymnotiform fish. Neurosci Lett. 1983;42:137–143. doi: 10.1016/0304-3940(83)90396-8. [DOI] [PubMed] [Google Scholar]
- Ping HX, Shepard PD. Blockade of SK-type Ca2+-activated K+ channels uncovers a Ca2+-dependent slow afterdepolarization in nigral dopamine neurons. J Neurophysiol. 1999;81:977–984. doi: 10.1152/jn.1999.81.3.977. [DOI] [PubMed] [Google Scholar]
- Priebe NJ, Lisberger SG, Movshon JA. Tuning for spatiotemporal frequency and speed in directionally selective neurons of macaque striate cortex. J Neurosci. 2006;26:2941–2950. doi: 10.1523/JNEUROSCI.3936-05.2006. [DOI] [PMC free article] [PubMed] [Google Scholar]
- Ren Y, Barnwell LF, Alexander JC, Lubin FD, Adelman JP, Pfaffinger PJ, Schrader LA, Anderson AE. Regulation of surface localization of the small conductance Ca2+-activated potassium channel, Sk2, through direct phosphorylation by cAMP-dependent protein kinase. J Biol Chem. 2006;281:11769–11779. doi: 10.1074/jbc.M513125200. [DOI] [PubMed] [Google Scholar]
- Sailer CA, Hu H, Kaufmann WA, Trieb M, Schwarzer C, Storm JF, Knaus HG. Regional differences in distribution and functional expression of small-conductance Ca2+-activated K+ channels in rat brain. J Neurosci. 2002;22:9698–9707. doi: 10.1523/JNEUROSCI.22-22-09698.2002. [DOI] [PMC free article] [PubMed] [Google Scholar]
- Saunders J, Bastian J. The physiology and morphology of two classes of electrosensory neurons in the weakly electric fish Apteronotus leptorhynchus. J Comp Physiol. 1984;154:199–209. [Google Scholar]
- Shadlen MN, Newsome WT. The variable discharge of cortical neurons: implications for connectivity, computation, and information coding. J Neurosci. 1998;18:3870–3896. doi: 10.1523/JNEUROSCI.18-10-03870.1998. [DOI] [PMC free article] [PubMed] [Google Scholar]
- Shumway CA. Multiple electrosensory maps in the medulla of weakly electric gymnotiform fish. I. Physiological differences. J Neurosci. 1989;9:4388–4399. doi: 10.1523/JNEUROSCI.09-12-04388.1989. [DOI] [PMC free article] [PubMed] [Google Scholar]
- Softky WR, Koch C. The highly irregular firing of cortical cells is inconsistent with temporal integration of random EPSPs. J Neurosci. 1993;13:334–350. doi: 10.1523/JNEUROSCI.13-01-00334.1993. [DOI] [PMC free article] [PubMed] [Google Scholar]
- Stackman RW, Hammond RS, Linardatos E, Gerlach A, Maylie J, Adelman JP, Tzounopoulos T. Small conductance Ca2+-activated K+ channels modulate synaptic plasticity and memory encoding. J Neurosci. 2002;22:10163–10171. doi: 10.1523/JNEUROSCI.22-23-10163.2002. [DOI] [PMC free article] [PubMed] [Google Scholar]
- Stocker M, Pedarzani P. Differential distribution of three Ca2+-activated K+ channel subunits, SK1, SK2, and SK3, in the adult rat central nervous system. Mol Cell Neurosci. 2000;15:476–493. doi: 10.1006/mcne.2000.0842. [DOI] [PubMed] [Google Scholar]
- Turner RW, Maler L. Oscillatory and burst discharge in the apteronotid electrosensory lateral line lobe. J Exp Biol. 1999;202:1255–1265. doi: 10.1242/jeb.202.10.1255. [DOI] [PubMed] [Google Scholar]
- Turner RW, Maler L, Deerinck T, Levinson SR, Ellisman MH. TTX-sensitive dendritic sodium channels underlie oscillatory discharge in a vertebrate sensory neuron. J Neurosci. 1994;14:6453–6471. doi: 10.1523/JNEUROSCI.14-11-06453.1994. [DOI] [PMC free article] [PubMed] [Google Scholar]
- Turner RW, Plant JR, Maler L. Oscillatory and burst discharge across electrosensory topographic maps. J Neurophysiol. 1996;76:2364–2382. doi: 10.1152/jn.1996.76.4.2364. [DOI] [PubMed] [Google Scholar]
- Villalobos C, Shakkottai VG, Chandy KG, Michelhaugh SK, Andrade R. SKCa channels mediate the medium but not the slow calcium-activated afterhyperpolarization in cortical neurons. J Neurosci. 2004;24:3537–3542. doi: 10.1523/JNEUROSCI.0380-04.2004. [DOI] [PMC free article] [PubMed] [Google Scholar]
- Wilbur WJ, Rinzel J. A theoretical basis for large coefficient of variation and bimodality in neuronal interspike interval distributions. J Theor Biol. 1983;105:345–368. doi: 10.1016/s0022-5193(83)80013-7. [DOI] [PubMed] [Google Scholar]
- Wolfart J, Neuhoff H, Franz O, Roeper J. Differential expression of the small-conductance, calcium-activated potassium channel SK3 is critical for pacemaker control in dopaminergic midbrain neurons. J Neurosci. 2001;21:3443–3456. doi: 10.1523/JNEUROSCI.21-10-03443.2001. [DOI] [PMC free article] [PubMed] [Google Scholar]
- Womack MD, Khodakhah K. Somatic and dendritic small-conductance calcium-activated potassium channels regulate the output of cerebellar Purkinje neurons. J Neurosci. 2003;23:2600–2607. doi: 10.1523/JNEUROSCI.23-07-02600.2003. [DOI] [PMC free article] [PubMed] [Google Scholar]
- Woolley SM, Fremouw TE, Hsu A, Theunissen FE. Tuning for spectro-temporal modulations as a mechanism for auditory discrimination of natural sounds. Nat Neurosci. 2005;8:1371–1379. doi: 10.1038/nn1536. [DOI] [PubMed] [Google Scholar]
- Xia XM, Fakler B, Rivard A, Wayman G, Johnson-Pais T, Keen JE, Ishii T, Hirschberg B, Bond CT, Lutsenko S, Maylie J, Adelman JP. Mechanism of calcium gating in small-conductance calcium-activated potassium channels. Nature. 1998;395:503–507. doi: 10.1038/26758. [DOI] [PubMed] [Google Scholar]
- Yue C, Remy S, Su H, Beck H, Yaari Y. Proximal persistent Na+ channels drive spike afterdepolarizations and associated bursting in adult CA1 pyramidal cells. J Neurosci. 2005;25:9704–9720. doi: 10.1523/JNEUROSCI.1621-05.2005. [DOI] [PMC free article] [PubMed] [Google Scholar]
- Zakon H, Oestreich J, Tallarovic S, Triefenbach F. EOD modulations of brown ghost electric fish: JARs, chirps, rises, and dips. J Physiol (Paris) 2002;96:451–458. doi: 10.1016/S0928-4257(03)00012-3. [DOI] [PubMed] [Google Scholar]