

Abstract
Myosin Va (MyoVa) is a prime candidate for controlling actin-based organelle motion in neurons and neuroendocrine cells. Its function in secretory granule (SG) trafficking was investigated in enterochromaffin cells by wide-field and total internal reflection fluorescence microscopy. The distribution of endogenous MyoVa partially overlapped with SGs and microtubules. Impairing MyoVa function by means of a truncated construct (MyoVa tail) or RNA interference prevented the formation of SG-rich regions at the cell periphery and reduced SG density in the subplasmalemmal region. Individual SG trajectories were tracked to analyze SG mobility. A wide distribution of their diffusion coefficient, Dxy, was observed. Almost immobile SGs (Dxy < 5 × 10⁻⁴ μm2 · s−1) were considered as docked at the plasma membrane based on two properties: (1) SGs that undergo exocytosis have a Dxy below this threshold value for at least 2 s before fusion; (2) a negative autocorrelation of the vertical motion was found in subtrajectories with a Dxy below the threshold. Using this criterion of docking, we found that the main effect of MyoVa inhibition was to reduce the number of docked granules, leading to reduced secretory responses. Surprisingly, this reduction was not attributable to a decreased transport of SGs toward release sites. In contrast, MyoVa silencing reduced the occurrence of long-lasting, but not short-lasting, docking periods. We thus propose that, despite its known motor activity, MyoVa directly mediates stable attachment of SGs at the plasma membrane.
Keywords: myosin V, actin, exocytosis, docking, secretory vesicle, TIRFM
Introduction
Many hormones and neuropeptides are stored in secretory granules (SGs) and released by calcium-triggered exocytosis. SNARE (soluble N-ethylmaleimide-sensitive factor attachment protein receptor) proteins have a key role in membrane fusion (Jahn and Scheller, 2006), but little is known about upstream events (i.e., the recruitment of SGs at release sites and their docking at the plasma membrane). SGs are transported along microtubules from the trans-Golgi network to the cell periphery (Rudolf et al., 2001; Varadi et al., 2002) where they accumulate in the actin-rich cortex, a dense meshwork of filaments that restricts their mobility and is thought to hinder their access to the cell surface (Trifaro et al., 2000).
The GTPase Rab27a is associated with SGs and recruits Myrip (Fukuda and Kuroda, 2002; Desnos et al., 2003; Waselle et al., 2003), which in turn interacts with the actin-based motor molecules myosin VIIa or myosin Va (MyoVa) (Fukuda and Kuroda, 2002; Desnos et al., 2003; Kuroda and Fukuda, 2005). Rab27a and Myrip control the mobility of SGs within the actin cortex and their capacity to undergo exocytosis (Desnos et al., 2003; Waselle et al., 2003; Ivarsson et al., 2005). MyoVa, which has been identified on SGs (Rose et al., 2003; Rudolf et al., 2003; Ivarsson et al., 2005; Varadi et al., 2005), might cooperate with Rab27 and Myrip to control intracellular distribution of SGs and their recruitment at release sites (for review, see Desnos et al., 2007).
Because MyoVa functions as a processive actin-based motor molecule in vitro (Mehta et al., 1999; Vale, 2003; Sellers and Veigel, 2006; Ali et al., 2007), it may promote the recruitment of SGs at release sites by powering the transport of SGs toward the plasma membrane. Impairing the function of MyoVa induced SG clustering and reduced the density of SGs beneath the plasma membrane (Rudolf et al., 2003; Varadi et al., 2005). These observations were interpreted as resulting from the inhibition of MyoVa-dependent transport of granules within the actin cortex and toward the plasma membrane. However, there is no direct evidence that MyoVa actively transports SGs and it is not clear whether the highly branched filaments of the actin meshwork can serve as tracks to guide the motion of SGs. Moreover, Myrip itself binds actin and may thus oppose MyoVa-driven motion (Desnos et al., 2003). Another possibility is that MyoVa acts as a factor attaching SGs to the plasma membrane, in addition to, or instead of its role as a motor. This possibility was suggested by the observed interaction between MyoVa and syntaxin-1 (Watanabe et al., 2005).
To discriminate between these possibilities, we characterized the mobility of SGs using total internal reflection fluorescence microscopy (TIRFM). Based on their diffusion coefficient, we determined whether SGs were docked or not. We found that MyoVa inhibition reduced the number of docked vesicles and thereby the number of exocytotic events. We did not find direct evidence for a MyoVa-driven transport of SGs. Interestingly, the number of long-lasting (>15 s) docking events was reduced by MyoVa silencing, whereas short-lasting docking events remained unaffected suggesting that, despite its actin-based motor activity, MyoVa acts as a docking factor.
Materials and Methods
Materials
The anti-myosin Va (Espreafico et al., 1992) used in Western blotting was a generous gift from R. E. Cheney (University of North Carolina, Chapel Hill, NC), and the one used in immunocytochemistry (LF-18) was from Sigma (Cambridge, UK). The polyclonal antibody against the protein disulfide isomerase was kindly provided by D. Ferrari (R. Jahn Laboratory, Göttingen, Germany). We used anti-Rab27A, anti-EEA1, anti-GM130, and anti-cytochrome c (6H2B4) monoclonal antibodies from BD Biosciences (Franklin Lakes, NJ); polyclonal anti-chromogranin A/B from Abcam (Cambridge, UK) and anti-actin (AC-74) and anti-β-tubulin (TUB 2.1) monoclonal antibodies from Sigma; myc-Tag 9B11 antibody from Cell Signaling Technology (Beverly, MA) and anti-TGN46 from Serotec (Oxford, UK); and anti-Lamp-1 antibody (H4A3) was obtained from the Developmental Studies Hybridoma Bank (Iowa City, IA) developed under the auspices of the National Institute of Child Health and Human Development and maintained by University of Iowa.
Cell culture reagents were obtained from PAA Laboratories (Linz, Austria). DNA purifications were done using kits from Macherey-Nagel (Duren, Germany). Enzymes for molecular biology were from New England Biolabs (Ipswich, MA). Fluorescein isothiocyanate dextran (molecular weight, 150,000) and other chemicals were from Sigma.
Constructs
The plasmid encoding neuropeptide Y (NPY)–green fluorescent protein (GFP) (pNPY-GFP) was kindly provided by Dr. W. Almers (Portland, OR); pRSET-monomeric red fluorescent protein (mRFP) was a gift from Dr. R. Y. Tsien (San Diego, CA); vectors encoding GFP-sialin (Morin et al., 2004) and GalNacT2-GFP (Storrie et al., 1998) were kindly provided by B. Gasnier (Paris, France) and F. Perez (Paris, France), respectively. pEGFP-C1 was from BD Clontech (Basingstoke, UK).
Different myosin Va constructs were generated by PCR using human cDNA clones obtained from RZPD Deutsches Ressourcenzentrum für Genomforschung GmbH (Berlin, Germany). IMAGp998C0410088Q3 was amplified with Myo5aP1F0 (5′-CGGAAGGCAGCCATCACCAT) and Myo5aP2RE (5′-GTATTGTGGAATCTGTCATTG) and IMAGp998H1610421Q3 with Myo5aP3FO (5′-GAATACAATGACAGATTCCAC) and Myo5aP4RE (5′-AATGCTGCCAGCTGAAGACA). The products were mixed and amplified with Myo5aP5FO (5′-GAATTCCGAGGCTCGCTCAGTGGAGCGCTATAA) and Myo5aP6RE (5′-GTCGACACGGTACCTAGTTGGTTAAG). The product was cloned into PCR-TOPO vector (Invitrogen, Carlsbad, CA), digested with EcoRI and SalI and subcloned into pEGFP-C1 vector or pCMV-Tag2A vector (Stratagene, La Jolla, CA) to generate vectors encoding MyoVa LT tagged with GFP (pEGFP-MyoVaLT) or Flag (pFlag-MyoVaLT). In a similar manner, MyoVa tail was generated by PCR using IMAGp998H1610421Q3 and the primers Myo5aP13FO (5′-GAATTCCCGTCAAGAACTAGAATCAGAAAAC) and Myo5aP6RE (5′-GTCGACACGGTACCTAGTTGGTTAAG). MyoVa GT was generated from the same clone using Myo5aP9FO-4592 (5′-GAATTCGATGGAGAACATATCCCCAGGACAG) and Myo5aP6RE-6054 (5′-GTCGACACGGTACCTAGTTGGTTAAG). MyoVa long tail starts at amino acid 911, MyoVa tail at position 1208 (beginning of exon A), and MyoVA GT at position 1448 (numbering refers to the sequence of human MyoVa) (accession number NM_000259). These fragments were cloned into PCR-TOPO vector, digested with EcoRI and SalI, and subcloned into pEGFP-C1 or pCMV-Tag2A. To generate a vector encoding mRFP-tagged MyoVa tail, a PCR was performed using pRSETb-mRFP as a template and the primers mRFP-NheI (5′-TTTGCTAGCAATGGCCTCCTCCGAGGACG) and mRFP-XhoI (5′-TTTCTCGAGAGGCGCCGGTGGAGTGGCG). The PCR product was purified, digested with NheI and XhoI and inserted into pEGFP-MyoVaLT to replace GFP encoding sequences.
To generate a plasmid encoding mRFP-tagged NPY, pRSET-mRFP was digested using BamHI/EcoRI and subcloned into pCDNA.3.1(+). The resultant plasmid was cut with BamHI/NotI and the fragment was used to replace the BamHI–NotI fragment in pNPY-GFP to generate an in-frame fusion between NPY and mRFP. The sequence of inserts was confirmed by automated DNA sequencing.
Cell culture, transfection, and silencing
Human BON cells (Evers et al., 1991) were provided by C. M. Townsend (University of Texas Medical Branch, Galveston, TX). Cells were cultured in Ham's F12/DMEM with 10% FBS at 37°C under 5% CO2. Cells were plated onto collagen-coated glass coverslips and transfected using Lipofectamine 2000 (Invitrogen) or by electroporation. In brief, 1.5 × 10⁶ cells were collected in 50 μl of PBS containing vector DNAs (5 μg), electroporated (600 V/cm; eight times for 3 ms each time) using a PS10 electropulsator (Jouan, Saint Herblain, France), recovered in warm culture medium, and plated onto 5 μg/ml collagen-coated glass bottom dishes (MatTEK, Ashland, MA; World Precision Instruments, Sarasota, FL). Experiments were performed 1 or 2 d after transfection. For TIRFM observation, cells were immersed in Locke's solution (glucose, 5.6 mm; HCO3−, 3.6 mm; Cl−, 159.6 mm; Na+, 157.6 mm; K+, 5.6 mm; HEPES-NaOH, 5 mm; CaCl2, 2.5 mm; MgCl2, 1.2 mm).
Silencing RNA duplexes (siRNAs) were provided by Dharmacon (Chicago, IL) or Sigma. Two siRNAs were directed against human MyoVa [RNA interference 1 (RNAi-1), 5′-GAACAAAUGUGCACUCUUUUU; RNAi-2, 5′-AAAGUAAGGUCGUUGCUAAUU]. The following siRNAs were used as controls: siGLO Lamin A/C from Dharmacon, a siRNA targeting EGFP, 5′-GCAAGCUGACCCUGAAGUUCAU, and a siRNA targeting rat MyoVa, 5′-CGGCAUAUAUCUUGUUUAUTT. Transfection of siRNAs (100 nm) was done with Dharmafect (0.25 μl/50,000 cells; Dharmacon). Cells were daily transfected for 3 d. When required, the second transfection was done with Lipofectamine 2000 to cotransfect pNPY-GFP or pNPY-mRFP. Cell extracts were prepared in parallel for Western blot analysis of MyoVa expression. The blots were scanned and quantified using Image J software (http://rsb.info.nih.gov/ij/). Levels of actin were used to normalize the results from different samples.
Immunofluorescence microscopy
Immunocytochemistry was performed as described previously (Desnos et al., 2003). Secondary antibodies were coupled to Cy-3 (Jackson ImmunoResearch Laboratories, West Grove, PA), Alexa Fluor 488, Alexa Fluor 555, or Alexa Fluor 350 (Invitrogen). Cells were visualized using a z-motorized Nikon (Tokyo, Japan) inverted microscope TE2000E equipped with a 100× objective (numerical aperture, 1.4) and Coolsnap ES CCD camera (Roper Scientific, Tucson, AZ). When indicated, Z-series were acquired with Δz = 200 nm, and image stacks were restored using the MetaMorph PSF-based deconvolution software (Molecular Devices, Downingtown, PA).
Evanescent wave fluorescence microscopy (TIRFM)
TIRFM setup.
TIRF imaging was performed on a custom setup described previously (Huet et al., 2006). This setup allows to vary the penetration depth δ of the evanescent wave used to excite the fluorophores. The value of δ has been calibrated experimentally as explained previously (Huet et al., 2006). Under the conditions of observation used, one pixel corresponded to 107.5 nm. In the present work, frames were acquired at 4–10 Hz in stacks of 300–700 images. Exposure times were of 100–200 ms.
In this study, the microscope has been modified to allow two-color imaging. Selective observation of the fluorophores was achieved using a custom setup (Errol, Paris, France). Selective excitation was obtained using argon laser lines at 488 and 514 nm, and optical filters (bandpass, 500–540 nm; high pass, >565 nm) were used for the emission (Melles Griot Industrie, Voisins Le Bretonneux, France). After a separation of the laser lines via a holographic grating, lines at 488 and 514 nm were selected using two pinholes, and then were spatially recombined. An oscillating slat, synchronized with the emission filters, allowed line selection. For two-color acquisitions, the two channels were then imaged sequentially and finally superimposed to obtain the two color sequences.
Cell stimulation by Ca2+ uncaging or ionomycine perfusion.
Cells were stimulated either by Ca2+ uncaging or ionomycine perfusion. For Ca2+ uncaging, cells were incubated 60 min in Locke's buffer with 30 μm o-nitrophenyl-EGTA-AM (Invitrogen) followed by 60 min incubation in the culture medium, and then illuminated by flashes of UV light generated with a xenon arc flash lamp (Rapp Optoelectronic, Hamburg, Germany). The UV lamp was coupled to the epifluorescence illumination device of the microscope using a liquid light guide. During a stimulation sequence, UV flashes were delivered every 10 s. Exocytosis was also elicited by perfusing the cells locally with 10 μm ionomycine (Sigma) during 60 s.
Analysis of secretory granule dynamics
Secretory granule counting.
To evaluate their density in the subplasmalemmal region, labeled SGs were either counted manually or using Multidimensional Image Analysis (MIA) (Racine et al., 2006), a custom segmentation algorithm software based on wavelets (Starck et al., 1998) (see Fig. 3). The two approaches gave similar results.
Figure 3.
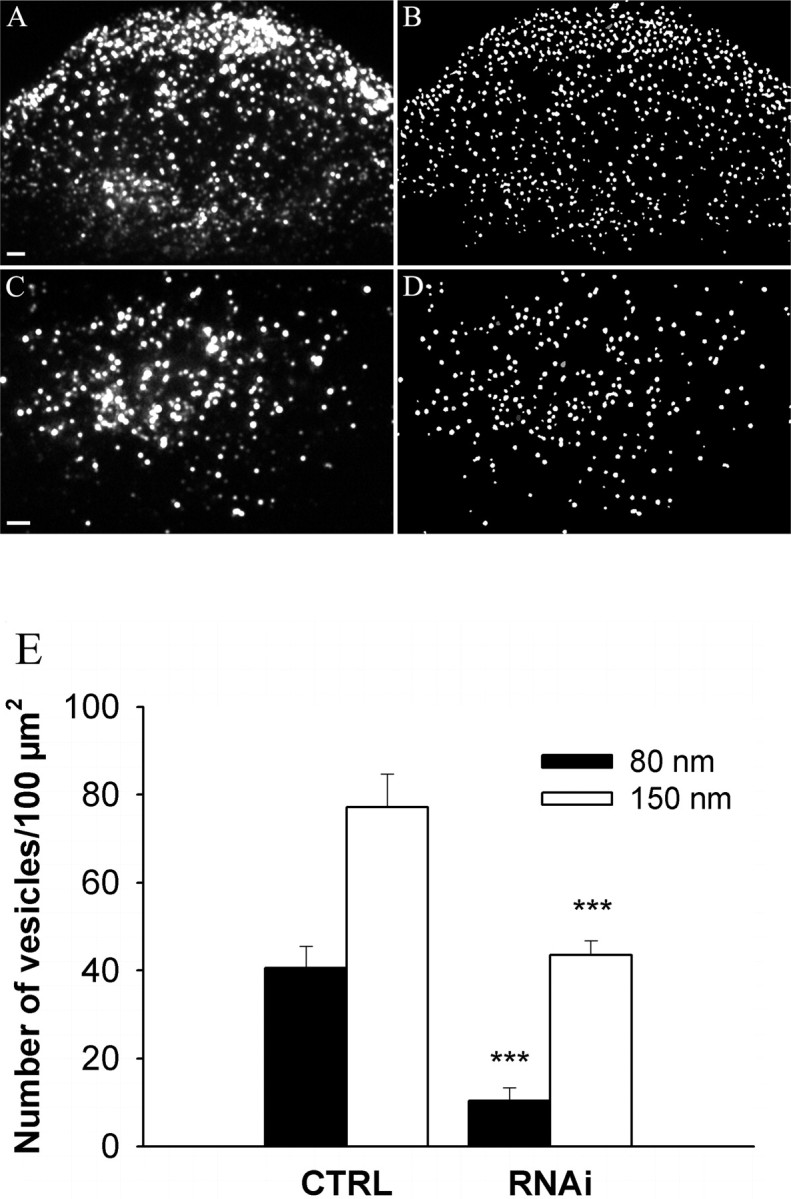
Myosin Va controls the cortical density of SGs. A–D, BON cells were transfected with a control siRNA duplex (A, B) (20 cells) or MyoVa RNAi-1 (C, D) (19 cells) and cotransfected with pNPY-GFP. NPY-GFP-containing SGs were imaged by TIRFM (A, C). Note in A that SGs are not homogenously distributed but are enriched at the periphery of the cell footprint. The density of SGs was reduced by MyoVa silencing (C) and the areas enriched in SGs disappeared. To quantify the number of SGs, images were segmented using Multidimensional Image Analysis software (B, D). Scale bars, 2 μm. E, Quantification of the data. For each cell, the density of SGs in the subplasmalemmal region was determined by dividing the number of SGs observed in the evanescent field by the size of the cell footprint. The penetration depth δ was set to 80 nm (filled bars) or 150 nm (open bars). Shown is the result of one experiment (mean ± SE). Similar results were obtained in two other ones. ***p < 0.001.
Single particle tracking and calculation of the diffusion coefficients.
From the time lapse experiments, two-dimensional SG trajectories were obtained by single-particle tracking using MIA software (Racine et al., 2006). SG mobility was then evaluated by calculating their mean diffusion coefficient Dxy as follows. For each SG trajectory, the mean square displacement (MSD) in the x,y plane was calculated according to Steyer and Almers (1999). The diffusion coefficient Dxy was then calculated as Dxy = s/4 with s being the slope of the linear fit of the first 15 points of the MSD curve. To measure Dxy variations along a given trajectory, this parameter was calculated along this trajectory using a rolling analysis window whose width was set to 25 points (2.5 s). For each position of the window, Dxy is calculated as described above and the obtained value is assigned to each point of the trajectory included in this window. Because each point of the trajectory appears in different windows, several Dxy values are assigned to it and finally averaged. Under our experimental conditions, the minimum detectable diffusion coefficient was ∼10−5 μm2/s (Huet et al., 2006).
Calculation of the autocorrelation function.
As the intensity of the evanescent wave exciting fluorescence decreases exponentially with a known penetration depth in the direction orthogonal to the coverslip (the z-axis), displacements of a fluorescent SG along this axis can be obtained by measuring variations of its intensity. The SG intensity as a function of time I(t) was obtained as described previously (Huet et al., 2006). SG z-coordinate (relative to the initial position) at time point ti was then evaluated using the following relationship: z(ti) = −δln(I(ti)/I(0)).
To characterize SG z-motions, the step size Δz between two successive z-positions (Δz(ti) = z(ti + 1) − z(ti)) was first evaluated. The time autocorrelation function G(τ) of these Δz values was then calculated as follows (Johns et al., 2001): G(τ) = 〈Δz(ti + τ)Δz(ti)〉.
The first two points of the time autocorrelation function (τ = 0 and τ = δt with δt the time interval between two successive frames) were excluded from the analysis as G(0) = 〈Δz2〉 and G(δt) = −Var(z), with Var referring to the variance (Allersma et al., 2006; Toonen et al., 2006). To minimize noise, the time autocorrelation functions for individual vesicles were three-point binned. For a purely diffusing vesicle, G(τ) should be equal to zero for all τ > δt. A negative value for G(τ) indicates that the SG motions tend to reverse with a characteristic time interval τ (Johns et al., 2001).
Analysis of the durations of transient docking periods.
The calculation of Dxy variations along SG trajectories was used to detect transient docking periods. The probability to get a docking period of a given duration during a trajectory (hereafter called the hit probability) was calculated for each docking duration. By multiplying this hit probability by the ratio between the docking duration and the mean trajectory duration, we could then evaluate the probability that, at any given time point of its trajectory, a SG experienced transient docking of a given duration (snapshot occurrence).
Statistical analyses
Values are given as mean ± SE. Significance of differences was calculated with Student's unpaired t test unless indicated; *p < 0.05; **p < 0.01; ***p < 0.001.
Results
Association of myosin Va with secretory granules
To characterize the function of MyoVa in organelle transport, we used BON cells that are derived from a carcinoid tumor (Evers et al., 1991). These enterochromaffin cells store various peptides in SGs and release them in response to external stimuli (Tran et al., 2004; Li et al., 2005; Huet et al., 2006). BON cells express Rab27a, Myrip (data not shown), and MyoVa (Fig. 1). First, the intracellular distribution of MyoVa was investigated by immunocytochemistry in BON cells using transfected GFP-tagged neuropeptide Y (NPY-GFP) as a marker of SGs. MyoVa was concentrated in cellular regions enriched in SGs (Fig. 1A) and single SGs were often decorated by anti-MyoVa antibodies (Fig. 1A, inset), in agreement with previous reports indicating that a fraction of MyoVa is associated with SGs in neuroendocrine cells (Rose et al., 2003; Rudolf et al., 2003; Varadi et al., 2005). We noticed also that MyoVa-positive spots were frequently aligned as beads along a string. Double-labeling experiments revealed that most of these MyoVa-positive structures were apposed onto microtubules (Fig. 1C,D) rather than being associated with actin tracks (data not shown).
Figure 1.

Association of myosin Va with secretory granules. A, B, The distribution of endogenous MyoVa in BON cells was analyzed using a polyclonal anti-MyoVa antibody and an Alexa Fluor 555-coupled secondary antibody (A) and compared with the distribution of SGs labeled by expressing NPY-GFP (B). The stacks of images of these two cells were restored by deconvolution. SGs and MyoVa appear as small individual dots enriched in cellular extensions. Zoomed-in regions are shown in inset with arrows depicting examples of MyoVa-positive SGs. C, D, Localization of MyoVa along microtubules. BON cells were double stained with anti-MyoVa (C) and anti-tubulin (D) antibodies and imaged by two-color TIRFM. Several MyoVa-positive dots are aligned along microtubules (see zoomed-in regions in inset). E, F, BON cells expressing GFP-MyoVa tail (E) and NPY-mRFP (F) were imaged successively in red and green channels at 4 Hz by two-color TIRFM. Most of the GFP-MyoVa tail-labeled structures (E) codistributed with NPY-mRFP-labeled SGs (F). G, H, A single granule displaying a directed motion (depicted with arrows) is shown in successive frames. Note that GFP-MyoVa tail (G) and NPY-mRFP (H) moved together. Scale bars, 1 μm.
A construct comprising the globular tail region of human MyoVa and the exons A, C, E, and F (MyoVa tail) was fused to GFP and expressed in BON cells. Such truncated MyoVa constructs lacking the actin-binding domain have been previously used to inhibit endogenous MyoVa function (Wu et al., 1998; Rudolf et al., 2003; Varadi et al., 2005). GFP-MyoVa tail was primarily colocalized with the SG markers chromogranin A/B and Rab27a (data not shown). To confirm this observation, the distribution of GFP-MyoVa tail and of NPY-mRFP was investigated by TIRFM (Fig. 1E,F). This method allows selective imaging of a thin region of the cell adjacent to the glass interface on which cells are grown (Axelrod, 1981; Steyer et al., 1997; Oheim et al., 1998). Approximately 80% of the structures decorated by GFP-MyoVa tail corresponded to SGs (400 structures from 10 cells). Many GFP-MyoVa tail structures followed the same trajectories as NPY-mRFP-positive SGs, indicating that GFP-MyoVa tail was bound to SGs (Fig. 1G,H; supplemental movie, available at www.jneurosci.org as supplemental material). These results are consistent with the observations made with anti-MyoVa antibodies (Fig. 1A,B). We thus conclude that an important fraction of MyoVa is associated with SGs.
The intracellular distribution of secretory granules depends on myosin Va
We then characterized the effect of MyoVa inhibition on intracellular SG distribution. As observed previously in PC12 cells (Rudolf et al., 2003) and insulin-secreting cells (Varadi et al., 2005), the expression of MyoVa tail induced a pronounced clustering of SGs that developed progressively after transfection (supplemental Fig. 1, available at www.jneurosci.org as supplemental material). In contrast, the distribution of several other intracellular compartments was not affected (supplemental Fig. 2, available at www.jneurosci.org as supplemental material). The function of MyoVa was also investigated by means of siRNA duplexes. The amount of MyoVa was reduced by 73 ± 10% (n = 4 experiments) after a 3 d treatment with MyoVa siRNAs (Fig. 2A). MyoVa silencing did not induce SG clustering as observed on expression of MyoVa tail but had profound effects on SG distribution. Whereas SGs accumulate in cellular extensions or in specialized areas at the periphery of control cells (Figs. 1B, 2B, top panel), this was not the case in most of the cells treated with MyoVa RNAi. In contrast, SGs were scattered in the cytoplasm (Fig. 2B, middle panel) or even concentrated in the perinuclear region (Fig. 2B, bottom panel). Data are quantified in Figure 2C. Similar results were obtained using another siRNA duplex (data not shown). This effect is reminiscent to the one observed for melanosomes in MyoVa-deficient cells (Wu et al., 1998), suggesting that MyoVa is involved in the capture of SGs at the cell periphery and in specialized regions of the cell. Presently, it is not known whether these specialized areas result from a peculiar organization of F-actin, from a polarity of the microtubule network, or from local enrichment in docking molecules.
Figure 2.

Myosin Va silencing impairs SG distribution. A, BON cells were transfected with different siRNA duplexes for 3 d. Levels of MyoVa were analyzed by immunoblotting in nontransfected cells (NT), in cells treated with a control siRNA (CTRL), and in cells treated with siRNAs directed to MyoVa (RNAi-1). Shown is the result of a typical experiment. B, Different patterns of SG distribution. SGs, here labeled with anti-Rab27a antibodies, are generally enriched at the cell periphery and in cellular extensions (top panel). On MyoVa silencing, SGs are frequently scattered in the cell (middle panel) or concentrated in the perinuclear region (bottom panel). Scale bar, 10 μm. C, Quantification of the effect of MyoVa silencing on SG distribution. BON cells were stained with anti-Rab27a or chromogranin A/B antibodies and classified into three categories according to the distribution of SGs: enriched at the periphery of the cell footprint, scattered, or concentrated in the perinuclear region as depicted in B. Shown is the mean percentage of cells observed for each category in nontransfected cells (NT) (n = 3; 652 cells) and in cells treated with control siRNA (CTRL) (n = 4; 777 cells) or MyoVa RNAi-1 (n = 4; 843 cells). Error bars indicate SE. * p < 0.05; ***p < 0.001.
To characterize the effect of MyoVa on SG recruitment at the cell periphery in more detail, BON cells were transfected with NPY-mRFP and imaged by TIRFM. The penetration depth δ (the distance along the z-axis over which fluorescence declines e-fold) of the evanescent field was set to 150 nm (see Materials and Methods). Under these conditions, most of the observed SGs are localized within the actin-rich cortex or at the plasma membrane (Lang et al., 2000; our unpublished data). The density of NPY-mRFP-positive SGs in the evanescent field was measured using Multidimensional Image Analysis software (Fig. 3A–D). It was relatively constant in control cells (∼40 and ∼70 SGs/100 μm2 1 and 2 d after transfection of NPY-mRFP, respectively) but reduced by GFP-MyoVa tail. The effect of MyoVa tail was very pronounced 2 or 3 d after transfection (data not shown) but was accompanied by massive SG clustering; 20–24 h after transfection, when cells displayed little SG clustering, SG density was 24.6 ± 3.7 × 100 μm−2 (n = 41 cells from two independent experiments) in cells expressing GFP-MyoVa tail, and 37.3 ± 3.0 × 100 μm−2 (n = 37 cells) in control cells (p = 0.013). MyoVa silencing also reduced the density of SGs at the cell periphery (Fig. 3C–E). These data are consistent with the idea that MyoVa promotes the retention of SGs within the actin-rich cortex. We also varied the penetration depth δ from 150 to 80 nm by changing the angle of the incident beam. As expected, at δ = 80 nm, the number of SGs visible in the evanescent field was lower than at δ = 150 nm (Fig. 3E). Interestingly, the effect of MyoVa silencing on SG density was higher at δ = 80 nm (∼75%) than at 150 nm (∼50%) (Fig. 3E), suggesting that MyoVa may contribute to the transport of SGs through the actin meshwork or to their retention at the plasma membrane. To exclude the possibility that MyoVa silencing reduced the apparent SG density by increasing the distance between the cell membrane and the glass interface, cells were incubated with fluorescent dextran and imaged by TIRFM. Dextran molecules diffused slowly below cells. An increase in the distance between cells and glass coverslips would have increased the mean fluorescence intensity of the cell footprint. However, we did not detect any change in the fluorescence intensity between siRNA-treated cells and control ones (data not shown) and concluded that the distance between cells and coverslips remained unchanged.
Myosin Va controls the mobility of secretory vesicles in the subplasmalemmal region
Within the evanescent field, some granules moved rapidly but most of them displayed slow diffusive movements or were almost immobile (supplemental movie, available at www.jneurosci.org as supplemental material). According to our previous studies (Huet et al., 2006), SGs with a directed motion are propelled along microtubules, immobile or constrained SGs are docked at the plasma membrane, and SGs with an apparent Brownian motion diffuse within the actin cortex. To characterize further the effect of MyoVa on SG motion, a detailed analysis of the mobility of SGs was carried out. Unstimulated BON cells were imaged by TIRFM for 75 s at 4 Hz. The x, y trajectories were monitored using a single particle tracking software (MIA) and the mean diffusion coefficient (Dxy) was derived from mean square displacement analysis (see Materials and Methods). The mean Dxy was increased in GFP-MyoVa tail-expressing cells (40.7 ± 5.9 × 10⁻⁴ μm2 · s−1; 280 SGs from eight cells) compared with control ones (25.5 ± 2.9 × 10⁻⁴ μm2 · s−1; 326 SGs from eight cells; p = 0.037, t test on averaged values from different cells). MyoVa silencing also increased Dxy values from 25.4 ± 6.3 × 10⁻⁴ μm2 · s−1 (20 control cells from two independent experiments; 1391 SGs) to 47.8 ± 7.8 × 10⁻⁴ μm2 · s−1 (n = 20 cells from two experiments; 1431 SGs; p = 0.031). The distribution of Dxy values is shown in Figure 4, A and B. The major effect of both MyoVa tail and MyoVa silencing was to reduce the percentage of SGs with a very low Dxy (<5 × 10⁻⁴ μm2 · s−1) probably corresponding to SGs tethered or docked at the plasma membrane (see below). We also observed an increased proportion of SGs with a very high Dxy (>100 × 10−4 μm2 · s−1). Similar findings were obtained under stimulating conditions (supplemental Fig. 3, available at www.jneurosci.org as supplemental material).
Figure 4.
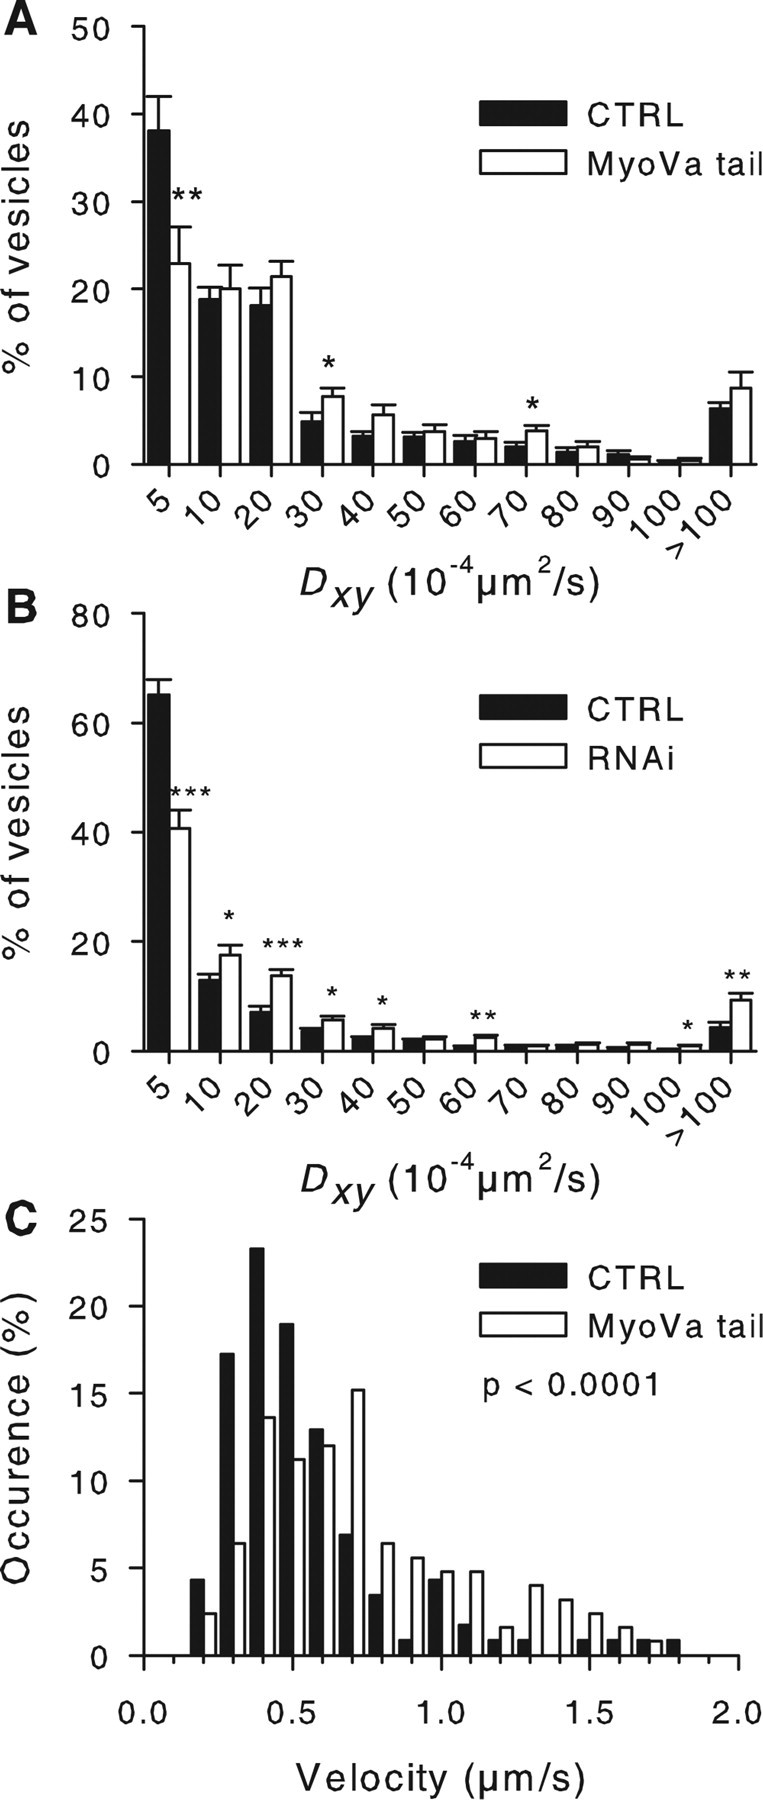
MyoVa inhibition modifies SG mobility in the subplasmalemmal region. A, BON cells were transfected with pNPY-mRFP (CTRL; filled bars) or with pNPY-mRFP and pEGFP-MyoVa-tail (MyoVa tail; open bars) and imaged by TIRFM for 75 s at 4 Hz. To characterize the mobility of SGs, their trajectories (CTRL, 832 SGs; MyoVa tail, 653 SGs) were tracked and mean diffusion coefficient Dxy was computed (see Materials and Methods). The distribution of Dxy values was then calculated in each cell. Shown is the mean ± SE of the values obtained for each bin in the different cells (13 cells from 2 independent experiments in each group). Note the diminution of the percentage of SGs with Dxy < 5 × 10⁻⁴ μm2/s that are presumably docked. Similar effects were observed under stimulating conditions (supplemental Fig. 3, available at www.jneurosci.org as supplemental material). B, MyoVa silencing had an effect on the distribution of Dxy values similar to that of MyoVa tail [CTRL, 20 cells (1391 SGs); MyoVa RNAi, 20 cells (1431 SGs) from two independent experiments]. C, SGs moving in a directed manner (supplemental Fig. 4, available at www.jneurosci.org as supplemental material) were tracked to measure their velocity. Shown is the distribution of SG velocities in control cells (CTRL, 112 granules from 7 cells) or in MyoVa tail-expressing cells (MyoVa tail, 126 granules from 9 cells). The distribution is shifted to the right by MyoVa tail. *p < 0.05; **p < 0.01; ***p < 0.001.
The velocity of granules moving rapidly was further analyzed. We selected for this analysis SGs that appeared as a string of aligned vesicles when 10 successive frames were superimposed (supplemental Fig. 4, available at www.jneurosci.org as supplemental material). The number of highly mobile vesicles represented ∼10% of the whole population of SGs in control conditions and ∼15% in MyoVa tail-expressing cells. The mean velocity of these SGs was increased in MyoVa tail-expressing cells (0.74 ± 0.04 μm/s) compared with control ones (0.52 ± 0.03 μm/s; p < 0.0001, Mann–Whitney test on individual SG values; p < 0.05, t test on averaged values from different cells). As illustrated in Figure 4C, the distribution of velocities was shifted toward higher values. The number of highly mobile granules was reduced by 86% by a 20 min treatment with 30 μm nocodazole, indicating that these SGs were moving along microtubules (Huet et al., 2006). A simple explanation of this finding would be that full-length MyoVa slows down the motion of SGs along microtubules, most probably by interacting with actin.
A potential role for MyoVa in secretory granule docking
The observed reduction in the number of SGs with a Dxy < 5 × 10⁻⁴ μm2 · s−1 (Fig. 4) suggest that MyoVa may be involved in SG docking. To test this possibility, we tried to establish a criterion of docking. Previous studies (Steyer et al., 1997; Oheim and Stühmer, 2000; Johns et al., 2001; Huet et al., 2006) showed a strong reduction in the lateral mobility of SGs before fusion, most presumably because of SG docking at the plasma membrane. Therefore, the mobility of SGs before fusion was characterized. Exocytosis of NPY-mRFP-labeled SGs was elicited by UV flash photolysis of caged calcium. Fusion events have a characteristic signature on TIRF sequences: the abrupt disappearance of a SG is preceded by a transient increase in its fluorescence and accompanied by a transient cloud of fluorescence corresponding to the diffusion of the fluorophore in the external medium (Steyer et al., 1997). SGs that underwent fusion were tracked and their Dxy was measured as a function of time using a rolling window (see Materials and Methods). In control cells, the majority (28 of 35 SGs) of SGs remained almost immobile for at least 15 s before fusion. Interestingly, SGs that were initially mobile suddenly stopped moving and remained confined for at least 2 s before exocytosis (Fig. 5A). Immobilization of SGs most likely reflects docking at the plasma membrane. In cells expressing MyoVa tail, the mobility of SGs that underwent fusion was also restricted in the last 2 s (Fig. 5B). However, in these cells, six of the nine fusing SGs that were tracked displayed significant mobility during the 10 s sequence, and the pool of immobile SGs, which represents the major pool of releasable vesicles in control cells, seemed depleted by MyoVa tail.
Figure 5.
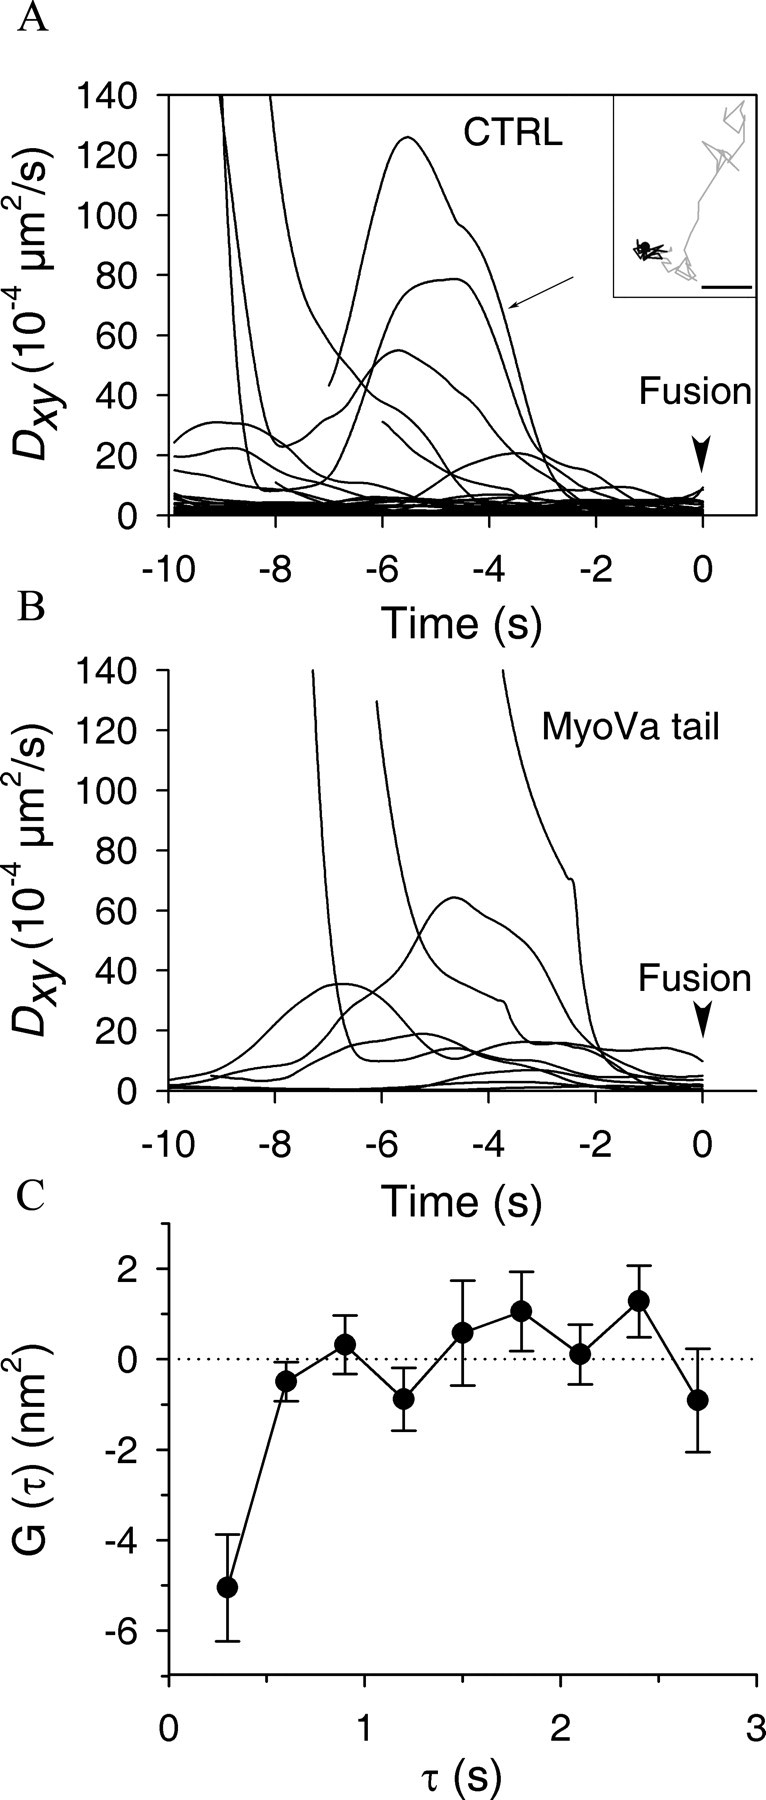
Behavior of SGs before fusion. A, B, BON cells were cotransfected with pNPY-mRFP and an empty vector (CTRL) (A) or pEGFP-MyoVa-tail (MyoVa tail) (B). Two days after transfection, they were stimulated to secrete by UV flash photolysis of caged calcium and imaged by TIRFM at 10 Hz. Exocytotic events were detected by visual inspection of image stacks. SGs that underwent exocytosis were tracked, and their diffusion coefficient Dxy was measured as a function of time. Times shown are relative to the fusion event (arrowhead). Several granules remained almost immobile during the 10 s sequence, as indicated by their very low Dxy. Others were highly mobile and then suddenly stopped moving ∼2 s before fusion. The two-dimensional trajectory corresponding to the curve depicted by an arrow in A is shown in the inset and shows this transition from an apparently directed motion (in gray) to a docking period (in black). The end of the trajectory is depicted with a filled circle. Scale bar: Inset, 0.1 μm. Note that, whereas the majority of SGs that fuse in A were almost immobile during the whole sequence, this was not the case in B. The reduced number of stably docked SGs may account for the inhibitory effect of MyoVa tail on exocytosis (Table 1). C, Autocorrelation functions of z-motion have a negative component during docking periods. Docking periods (Dxy < 5 × 10⁻⁴ μm2/s) were detected using a rolling window to calculate Dxy along SG trajectories from CTRL cells. The relative motion of SGs in the z-axis orthogonal to the plasma membrane was calculated and the time sequence of Δz displacements was autocorrelated (see Materials and Methods). Shown is G(τ) ± SEM measured in CTRL cells for docking periods. The negative component of G(τ) at short τ reflects the tendency of SGs to reverse their direction, an indicator of caging or tethering.
Quantitative criteria of secretory granule docking
During the last 2 s before exocytosis, the mean value of Dxy was 2.26 ± 0.44 × 10⁻⁴ μm2 · s−1, in good agreement with values found in adrenal chromaffin cells (Steyer et al., 1997; Oheim and Stühmer, 2000) and with the mean Dxy value of the “cage” that restricts the mobility of docked SGs in BON cells (Huet et al., 2006). More than 95% of SGs have a Dxy < 5 × 10⁻⁴ μm2 · s−1 in the last 2 s before fusion. We thus considered SGs with Dxy below this value as docked.
Previous studies reported that docked granules are characterized by a negative component in averaged autocorrelation functions of their motion in the z-axis (Toonen et al., 2006), reflecting the fact that docked SGs tend to reverse their direction near the target membrane within a characteristic time <1 s. These changes in the z direction reflect the fact that diffusion is biased by the link attaching the SGs to the plasma membrane. Because of the exponential decay of the evanescent field, vertical displacement of SGs along the z-axis can be measured with high precision [∼10 nm in our setup (Huet et al., 2006)] by monitoring changes in fluorescence intensity. We detected transient periods of docking by measuring Dxy along trajectories using a 2.5 s rolling window, as described in Materials and Methods, and subsequently analyzed z-motions in these subtrajectories. A negative autocorrelation of the z-motion was found during these docking periods (Fig. 5C), further confirming that our criterion is valid.
One might argue that these almost immobile SGs are anchored to actin filaments and not docked at the plasma membrane. To address this possibility, we imaged actin structures by TIRFM in BON cells expressing actin-GFP and found that actin structures were moving with a mean Dxy of 14.9 ± 2.1 × 10⁻⁴ μm2 · s−1 (data not shown). Therefore, actin is not immobile and the association of SGs with actin cannot account for such highly restricted motion. In addition, SGs that diffuse randomly with or within actin are characterized by a mean Dxy of 22 ± 8 × 10⁻⁴ μm2 · s−1 and are thus more mobile than those considered to be docked (Huet et al., 2006).
We thus conclude that a Dxy < 5 × 10⁻⁴ μm2 · s−1 is a reliable criterion to identify docked granules in BON cells.
Lowering MyoVa levels reduces the duration of docking periods
We next used this criterion to analyze the effect of MyoVa on docking. According to this criterion, ∼37% of SGs detected in the evanescent field (at δ = 150 nm, 1 d after transfection of NPY-GFP) were docked in control cells (Fig. 4A, Table 1). This percentage rose to ∼65% 2 d after transfection of NPY-GFP (Fig. 4B, Table 1). The proportion of docked SGs was decreased from ∼37 to ∼24% by MyoVa tail and from ∼65 to ∼40% by MyoVa silencing (Fig. 4, Table 1). Note that MyoVa silencing diminished the number of SGs present in the evanescent field and the proportion of docked SGs; the overall reduction in the number of docked SGs is ∼70%.
Table 1.
Impairment of myosin Va function reduces SG docking and exocytosis
| Fusion (%) | p value | N | Docking (%) | p value | N | Days after transfection | |
|---|---|---|---|---|---|---|---|
| CTRL RNAi | 7.9 ± 2.9 | 28 | 65.0a ± 2.8 | 20 | 2 | ||
| MyoVa RNAi | 2.4 ± 1.1 | 0.003 | 30 | 40.6a ± 3.3 | <0.0001 | 20 | 2 |
| CTRL | 3.1 ± 0.7 | 22 | 37.4a ± 3.9 | 13 | 1 | ||
| 59.2b ± 7.6 | 6 | 2 | |||||
| MyoVa tail | 1.1 ± 0.8 | 0.013 | 18 | 24.0a ± 3.7 | 0.029 | 13 | 1 |
| 31.2b ± 2.6 | 0.010 | 6 | 2 |
Shown are, for each experimental condition, the percentage of SGs present in the evanescent field that underwent fusion, the percentage of docked granules (i.e., with a Dxy <5 × 10⁻⁴ μm2/s), the number of cells N, the Mann–Whitney U test p values, as well as the time after NPY transfection since the percentage of docked SG increased with time. In silencing experiments, BON cells were stimulated to secrete by local application of 10 μm ionomycine (3 independent experiments). In the case of MyoVa tail, cells were stimulated by UV flash photolysis of caged calcium. Errors are given in mean ± SE.
aNonstimulating conditions.
bStimulating conditions.
Because MyoVa is a molecular motor, its effect on SG docking may be interpreted as an indirect consequence of a role in driving SGs through the actin meshwork toward the cell surface. However, our analysis of Dxy on entire trajectories (Fig. 4) revealed that MyoVa inhibition led to increased, rather than decreased, SG mobility and thus did not provide evidence for a MyoVa-powered motion of SGs. Because transient, short-range motions may not be detected by this approach, we looked for transient motions just before the onset of docking periods detected using a 2.5 s rolling window. However, the mean value of Dxy in the 2 or 4 s preceding the onset of docking periods was not affected by MyoVa silencing. Moreover, the MSD versus Δt plot had a linear shape indicating random, rather than directed, motion (data not shown). Visual inspection of the vertical motion of SGs before docking did not reveal significant difference between control cells and cells treated with MyoVa RNAi. Finally, the data shown in Figure 5B indicate that SGs can reach the plasma membrane, most likely by diffusion, and undergo exocytosis in MyoVa tail-expressing cells. Therefore, these observations suggest that the motor activity of MyoVa is not required for delivering SGs to release sites.
Alternatively, MyoVa may be directly involved in the attachment of SGs at the plasma membrane. To test this possibility, docking periods along SG trajectories were monitored using a rolling window, as described above. We found that the mean duration of docking periods was decreased by MyoVa silencing (5.8 ± 0.3 s, n = 20 cells, compared with 7.7 ± 0.4 s, n = 20 cells from two experiments; p = 0.002). We also calculated the probability that, at any given time point of its trajectory, a SG experienced a docking period of a given duration (snapshot occurrence) (see Materials and Methods). In Figure 6, we plotted this snapshot occurrence as a function of the docking duration. The figure shows a very significant decrease in docking periods >15 s, whereas short lasting immobilization periods were not affected. Similar findings were obtained with MyoVa tail under stimulating and nonstimulating conditions (data not shown). These data are consistent with the traces shown in Figure 5B, indicating that few stably docked SGs are available for release in MyoVa tail-expressing cells. Of note is the fact that these representations are not biased by the reduction in SG density caused by MyoVa inhibition. From these observations, we conclude that MyoVa functions as an attachment factor that promotes and stabilizes SG docking at the plasma membrane.
Figure 6.

MyoVa silencing decreases the frequency of long-lasting immobilization periods. BON cells were treated with control siRNAs (CTRL, 20 cells; filled bars) or with MyoVa targeting siRNAs (MyoVa RNAi, 20 cells; open bars) as described in Figure 4. A rolling window of 2.5 s was used to calculate Dxy along SG trajectories and to determine docking periods (Dxy < 5 × 10⁻⁴ μm2/s). Shown is the probability that, at any given time point of its trajectory, a SG experienced a docking period of a given duration (snapshot occurrence) (see Materials and Methods). Errors are given as the mean ± SE of 20 cells. ***p < 0.001.
Impairment of MyoVa function reduced granule exocytosis by inhibiting docking
Finally, we investigated the effect of inhibiting MyoVa on the secretory activity of BON cells. This activity was first determined at the cell population level by measuring the release of 5-[3H]hydroxytryptamine; after 5 d of MyoVa silencing, the secretory response was inhibited by ∼90% (data not shown). We then detected the number of fusion events by TIRFM during a 1 min stimulation and also found a severe reduction by MyoVa inhibition. The percentage of SGs present in the evanescent field that underwent exocytosis was reduced from 7.9 ± 2.4 to 2.4 ± 1.1 by MyoVa silencing (Table 1). Similarly, the secretory response measured by TIRFM was reduced from 3.1 ± 0.7 to 1.1 ± 0.8% (−65%) by MyoVa tail. Under similar conditions (i.e., on stimulation of secretion), docking was reduced from 59.2 ± 7.6 to 31.2 ± 2.6% by MyoVa tail (−48%) (Table 1). Therefore, we conclude that most of the observed reduction in secretory responses can be accounted for by the consequence of MyoVa inhibition on SG docking.
Discussion
A role for MyoVa in the capture of granules at the cell periphery
Previous studies have shown that MyoVa is involved in the peripheral retention of melanosomes (Hammer and Wu, 2002; Seabra and Coudrier, 2004) and SGs (Rudolf et al., 2003; Varadi et al., 2005). We confirm these observations and suggest that MyoVa favors the accumulation of SGs beneath the plasma membrane (1) by facilitating the transfer from microtubules to actin and (2) by promoting the attachment of SGs at the plasma membrane.
Previously, we showed that microtubule-bound SGs cannot undergo direct docking: they must first dissociate from microtubules and interact with F-actin (Huet et al., 2006). Such combination of long-range transport along microtubules and of short-range motion of SGs controlled by actin dynamics could optimize the search of a docking site by SGs (Huet et al., 2006). MyoVa may assist this process by mediating the transfer of microtubule-bound SGs to actin. It was suggested that MyoVa exerts a force opposed to microtubule-based motors and thus dissociates melanosomes from microtubules (Wu et al., 1998; Gross et al., 2002). Accordingly, MyoVa tail increased the velocity of SGs moving along microtubules, suggesting that the association of SG-bound MyoVa with actin counteracts microtubule-based motors. We found a fraction of endogenous MyoVa associated with microtubules. This is consistent with the fact that melanophilin, the receptor of MyoVa on melanosomes, recruits MyoVa at microtubule plus-ends (Wu et al., 2005). Moreover, MyoVa can diffuse along microtubules, at least in vitro (Ali et al., 2007). The binding of MyoVa to microtubules probably facilitates the search for a kinesin-driven cargo and thus the capture process. In the absence of MyoVa, SGs would redistribute according to the balance of microtubule-based motors, leading to the observed loss of cortical restriction of SGs. These observations indicate that the actin cortex is not merely a barrier restricting SG motion (Trifaro et al., 2000; Malacombe et al., 2006; Desnos et al., 2007) but has an essential role in the accumulation of SGs near release sites.
MyoVa mediates secretory granule docking at the plasma membrane
The main conclusion of our work is that MyoVa has a role in SG docking at the plasma membrane. Varadi et al. (2005) previously suggested such a role. However, their conclusion was based on the assumption that all SGs detected by TIRFM are docked, an assumption that is not consistent with several studies, including ours (Lang et al., 2000; Oheim and Stühmer, 2000; Johns et al., 2001; Desnos et al., 2003; Huet et al., 2006). To distinguish docked and nondocked SGs within the evanescent field, we characterized the mobility of individual SGs by calculating their mean diffusion coefficient Dxy. The observed restriction of SG mobility in the 2 s preceding exocytosis was used to define a threshold value (Dxy < 5 × 10⁻⁴ μm2/s) below which SGs are considered to be docked. For comparison, 200-nm-diameter spheres freely diffusing in water display a Dxy ∼5000 times larger than those of docked SGs (∼2 μm2/s; calculated by Stokes' law for a water viscosity of 1 × 10⁻³ kg · m−1 · s−1). Granules with such low Dxy values are obviously constrained and we showed previously that constrained SGs are attached at the plasma membrane (Huet et al., 2006). The validity of this criterion is supported by the fact that SGs classified as docked display a negative autocorrelation of their motion in the vertical axis, a property that was previously used to define docking (Toonen et al., 2006). In addition, because the diffusion coefficient characterizing the mobility of the bulk of actin beneath the plasma membrane is much higher than 5 × 10⁻⁴ μm2/s, we also ruled out that SGs considered to be docked may instead correspond to SGs anchored on actin filaments. Immobile SGs are necessarily attached to another structure, and attachment to the plasma membrane represents the simplest explanation. Using this criterion on Dxy to detect docking, we found that impairing MyoVa function reduced SG docking. This effect of MyoVa on docking mostly accounts for its role in secretion.
How does MyoVa promote SG docking? A first possibility is that it acts upstream of docking by powering SG movement along actin tracks toward docking sites. Rudolf et al. (2003) reported that MyoVa tail decreases SG motion and suggested that SGs are propelled by MyoVa. In contrast, we found that MyoVa tail and MyoVa silencing increase SG mobility. This apparent discrepancy may be attributable to the fact that we imaged mature SGs beneath the plasma membrane by TIRFM, and not immature granules in the whole cytoplasm as did Rudolf et al. (2003). Nevertheless, we addressed the possibility that the effect of MyoVa on docking is related to its motor activity. Several observations argue against this possibility: (1) the Dxy of SGs in the 2 or 4 s period before docking is not changed by MyoVa silencing, (2) the arrival of SGs at the plasma membrane was not impaired by MyoVa silencing because the occurrence of short-lasting immobilization periods was not modified, and (3) a significant number of SGs can reach the plasma membrane and exocytose in cells with impaired MyoVa (Fig. 5B). In addition, it is not known whether the orientation of actin filaments beneath the plasma membrane permits such directed motion toward docking sites. However, we do not fully exclude a partial contribution of actin-based transport of SGs, because MyoVa-driven steps may be rare and transient and thus difficult to detect (Levi et al., 2006). Because the motor activity of MyoVa is calcium dependent, it will be important in the future to characterize the effect of MyoVa on SG motion under stimulating conditions.
Our data clearly support the alternative view that MyoVa directly participates to the docking process. Indeed, we measured Dxy along the trajectory and found that MyoVa silencing reduced the duration of immobilization periods. In a recent study, Toonen et al. (2006) measured the dwell time of SGs in the evanescent field and found that SGs can be classified as visitors, weakly tethered (1 s < dwell time < 10 s) or strongly tethered (dwell time >10 s) at the plasma membrane. The fact that MyoVa inhibition reduced selectively the occurrence of long-lasting (>15 s) immobilization periods also supports the concept that SG attachment at the membrane is a multistep process: a short-lasting association step (hereafter called tethering) is followed by a long-lasting attachment step (hereafter termed docking).
Munc18 and syntaxin-1 also control docking but not tethering of SGs (Toonen et al., 2006). MyoVa, munc18, and syntaxin-1 may thus cooperate to mediate SG docking. This hypothesis is consistent with the reported interaction of MyoVa with syntaxin-1 (Watanabe et al., 2005), although this binding occurred at calcium concentrations unlikely to be found under resting conditions. Noteworthy, syntaxin-1 binding involves the neck region of MyoVa and not the motor head domain. The effect of MyoVa in docking may thus be completely independent of its motor activity.
Mobility of synaptic vesicles and role of MyoVa in neurons
Mutations in MYO5A cause Griscelli syndrome in humans (Pastural et al., 1997) and a dilute phenotype in mice (Mercer et al., 1991) combining partial albinism and severe neurological impairment. Are these symptoms attributable to impaired synaptic vesicle recruitment and docking at the synapse? This does not seem to be the case because clusters of synaptic vesicles are observed at the active zone of dilute neurons (Takagishi et al., 1996; Miyata et al., 2000) and because neurotransmission and plasticity are normal in cultured hippocampal neurons (Schnell and Nicoll, 2001) and SCG neurons (Takagishi et al., 2005) from dilute mice. Abnormal traffic of other cargos, such as SGs, mRNAs, and Ca2+ stores may account for the neurological symptoms observed in Griscelli syndrome (for review, see Desnos et al., 2007).
The mobility of synaptic vesicles is extremely variable from one synapse to another (Schweizer and Ryan, 2006). Vesicles are almost immobile in central synapses but highly mobile in ribbon synapses of sensory neurons. Actin has little impact on synaptic vesicle clusters and on the rate of refilling of the readily releasable pool (Dillon and Goda, 2005). The mobility of synaptic vesicles displays little dependence on actin and myosin motors but is controlled by synapsin-1, which can tether synaptic vesicles together in a stimulus-dependent manner and by vesicle packing density (Jordan et al., 2005; Gaffield et al., 2006; Schweizer and Ryan, 2006). Vesicle supply to release sites seems to be primarily governed by diffusion, a conclusion that we propose to extend to the case of SGs. Nevertheless, actin modulates the recovery from synaptic depression at the calyx of Held (Sakaba and Neher, 2003) and controls the exchange of synaptic vesicles between different boutons (Darcy et al., 2006). Actin, which is concentrated at the periphery of clusters, could thus participate in the retention of synaptic vesicles arriving from the axon or from the presynaptic membrane via the recycling pathway. It will be important in the future to investigate the potential role of MyoVa in such processes.
Footnotes
This work was supported by the Centre National de la Recherche Scientifique and by the Direction Générale de l'Armement. S.H. was supported by a fellowship from the Direction Générale de l'Armement and the Association pour la Recherche contre le Cancer, and C.B. was supported by a fellowship from the Deutscher Akademischer Austauschdienst. F.D. was supported by Institut National de la Santé et de la Recherche Médicale. We thank R. E. Cheney for anti-MyoVa antibodies and for helpful discussion and E. Karatekin and B. Gasnier for critical reading of this manuscript.
References
- Ali MY, Krementsova EB, Kennedy GG, Mahaffy R, Pollard TD, Trybus KM, Warshaw DM. From the cover: myosin Va maneuvers through actin intersections and diffuses along microtubules. Proc Natl Acad Sci USA. 2007;104:4332–4336. doi: 10.1073/pnas.0611471104. [DOI] [PMC free article] [PubMed] [Google Scholar]
- Allersma MW, Bittner MA, Axelrod D, Holz RW. Motion matters: secretory granule motion adjacent to the plasma membrane and exocytosis. Mol Biol Cell. 2006;17:2424–2438. doi: 10.1091/mbc.E05-10-0938. [DOI] [PMC free article] [PubMed] [Google Scholar]
- Axelrod D. Cell-substrate contacts illuminated by total internal reflection fluorescence. J Cell Biol. 1981;89:141–145. doi: 10.1083/jcb.89.1.141. [DOI] [PMC free article] [PubMed] [Google Scholar]
- Darcy KJ, Staras K, Collinson LM, Goda Y. Constitutive sharing of recycling synaptic vesicles between presynaptic boutons. Nat Neurosci. 2006;9:315–321. doi: 10.1038/nn1640. [DOI] [PubMed] [Google Scholar]
- Desnos C, Schonn JS, Huet S, Tran VS, El-Amraoui A, Raposo G, Fanget I, Chapuis C, Menasche G, De Saint Basile G, Petit C, Cribier S, Henry JP, Darchen F. Rab27A and its effector MyRIP link secretory granules to F-actin and control their motion towards release sites. J Cell Biol. 2003;163:559–570. doi: 10.1083/jcb.200302157. [DOI] [PMC free article] [PubMed] [Google Scholar]
- Desnos C, Huet H, Darchen F. “Should I stay or should I go?”: myosin V function in secretory vesicle trafficking. Biol Cell. 2007;99:411–423. doi: 10.1042/BC20070021. [DOI] [PubMed] [Google Scholar]
- Dillon C, Goda Y. The actin cytoskeleton: integrating form and function at the synapse. Annu Rev Neurosci. 2005;28:25–55. doi: 10.1146/annurev.neuro.28.061604.135757. [DOI] [PubMed] [Google Scholar]
- Espreafico EM, Cheney RE, Matteoli M, Nascimento AA, De Camilli PV, Larson RE, Mooseker MS. Primary structure and cellular localization of chicken brain myosin-V (p190), an unconventional myosin with calmodulin light chains. J Cell Biol. 1992;119:1541–1557. doi: 10.1083/jcb.119.6.1541. [DOI] [PMC free article] [PubMed] [Google Scholar]
- Evers BM, Townsend CM, Jr, Upp JR, Allen E, Hurlbut SC, Kim SW, Rajaraman S, Singh P, Reubi JC, Thompson JC. Establishment and characterization of a human carcinoid in nude mice and effect of various agents on tumor growth. Gastroenterology. 1991;101:303–311. doi: 10.1016/0016-5085(91)90004-5. [DOI] [PubMed] [Google Scholar]
- Fukuda M, Kuroda TS. Slac2-c (synaptotagmin-like protein homologue lacking C2 domains-c), a novel linker protein that interacts with Rab27, myosin Va/VIIa, and actin. J Biol Chem. 2002;277:43096–43103. doi: 10.1074/jbc.M203862200. [DOI] [PubMed] [Google Scholar]
- Gaffield MA, Rizzoli SO, Betz WJ. Mobility of synaptic vesicles in different pools in resting and stimulated frog motor nerve terminals. Neuron. 2006;51:317–325. doi: 10.1016/j.neuron.2006.06.031. [DOI] [PubMed] [Google Scholar]
- Gross SP, Tuma MC, Deacon SW, Serpinskaya AS, Reilein AR, Gelfand VI. Interactions and regulation of molecular motors in Xenopus melanophores. J Cell Biol. 2002;156:855–865. doi: 10.1083/jcb.200105055. [DOI] [PMC free article] [PubMed] [Google Scholar]
- Hammer JA, III, Wu XS. Rabs grab motors: defining the connections between Rab GTPases and motor proteins. Curr Opin Cell Biol. 2002;14:69–75. doi: 10.1016/s0955-0674(01)00296-4. [DOI] [PubMed] [Google Scholar]
- Huet S, Karatekin E, Tran VS, Fanget I, Cribier S, Henry JP. Analysis of transient behavior in complex trajectories: application to secretory vesicle dynamics. Biophys J. 2006;91:3542–3559. doi: 10.1529/biophysj.105.080622. [DOI] [PMC free article] [PubMed] [Google Scholar]
- Ivarsson R, Jing X, Waselle L, Regazzi R, Renstrom E. Myosin 5a controls insulin granule recruitment during late-phase secretion. Traffic. 2005;6:1027–1035. doi: 10.1111/j.1600-0854.2005.00342.x. [DOI] [PubMed] [Google Scholar]
- Jahn R, Scheller RH. SNAREs—engines for membrane fusion. Nat Rev Mol Cell Biol. 2006;7:631–643. doi: 10.1038/nrm2002. [DOI] [PubMed] [Google Scholar]
- Johns LM, Levitan ES, Shelden EA, Holz RW, Axelrod D. Restriction of secretory granule motion near the plasma membrane of chromaffin cells. J Cell Biol. 2001;153:177–190. doi: 10.1083/jcb.153.1.177. [DOI] [PMC free article] [PubMed] [Google Scholar]
- Jordan R, Lemke EA, Klingauf J. Visualization of synaptic vesicle movement in intact synaptic boutons using fluorescence fluctuation spectroscopy. Biophys J. 2005;89:2091–2102. doi: 10.1529/biophysj.105.061663. [DOI] [PMC free article] [PubMed] [Google Scholar]
- Kuroda TS, Fukuda M. Identification and biochemical analysis of Slac2-c/MyRIP as a Rab27A-, myosin Va/VIIa-, and actin-binding protein. Methods Enzymol. 2005;403:431–444. doi: 10.1016/S0076-6879(05)03038-7. [DOI] [PubMed] [Google Scholar]
- Lang T, Wacker I, Wunderlich I, Rohrbach A, Giese G, Soldati T, Almers W. Role of actin cortex in the subplasmalemmal transport of secretory granules in PC-12 cells. Biophys J. 2000;78:2863–2877. doi: 10.1016/S0006-3495(00)76828-7. [DOI] [PMC free article] [PubMed] [Google Scholar]
- Levi V, Gelfand VI, Serpinskaya AS, Gratton E. Melanosomes transported by myosin-V in Xenopus melanophores perform slow 35 nm steps. Biophys J. 2006;90:L07–L09. doi: 10.1529/biophysj.105.075556. [DOI] [PMC free article] [PubMed] [Google Scholar]
- Li N, Wang Q, Li J, Wang X, Hellmich MR, Rajaraman S, Greeley GH, Jr, Townsend CM, Jr, Evers BM. Inhibition of mitochondrial gene transcription suppresses neurotensin secretion in the human carcinoid cell line BON. Am J Physiol. 2005;288:G213–G220. doi: 10.1152/ajpgi.00043.2004. [DOI] [PubMed] [Google Scholar]
- Malacombe M, Bader MF, Gasman S. Exocytosis in neuroendocrine cells: new tasks for actin. Biochim Biophys Acta. 2006;1763:1175–1183. doi: 10.1016/j.bbamcr.2006.09.004. [DOI] [PubMed] [Google Scholar]
- Mehta AD, Rock RS, Rief M, Spudich JA, Mooseker MS, Cheney RE. Myosin-V is a processive actin-based motor. Nature. 1999;400:590–593. doi: 10.1038/23072. [DOI] [PubMed] [Google Scholar]
- Mercer JA, Seperack PK, Strobel MC, Copeland NG, Jenkins NA. Novel myosin heavy chain encoded by murine dilute coat colour locus. Nature. 1991;349:709–713. doi: 10.1038/349709a0. [DOI] [PubMed] [Google Scholar]
- Miyata M, Finch EA, Khiroug L, Hashimoto K, Hayasaka S, Oda SI, Inouye M, Takagishi Y, Augustine GJ, Kano M. Local calcium release in dendritic spines required for long-term synaptic depression. Neuron. 2000;28:233–244. doi: 10.1016/s0896-6273(00)00099-4. [DOI] [PubMed] [Google Scholar]
- Morin P, Sagne C, Gasnier B. Functional characterization of wild-type and mutant human sialin. EMBO J. 2004;23:4560–4570. doi: 10.1038/sj.emboj.7600464. [DOI] [PMC free article] [PubMed] [Google Scholar]
- Oheim M, Stühmer W. Tracking chromaffin granules on their way through the actin cortex. Eur Biophys J. 2000;29:67–89. doi: 10.1007/s002490050253. [DOI] [PubMed] [Google Scholar]
- Oheim M, Loerke D, Stuhmer W, Chow RH. The last few milliseconds in the life of a secretory granule. Docking, dynamics and fusion visualized by total internal reflection fluorescence microscopy (TIRFM) Eur Biophys J. 1998;27:83–98. doi: 10.1007/s002490050114. [DOI] [PubMed] [Google Scholar]
- Pastural E, Barrat FJ, Dufourcq-Lagelouse R, Certain S, Sanal O, Jabado N, Seger R, Griscelli C, Fischer A, de Saint Basile G. Griscelli disease maps to chromosome 15q21 and is associated with mutations in the myosin-Va gene. Nat Genet. 1997;16:289–292. doi: 10.1038/ng0797-289. [DOI] [PubMed] [Google Scholar]
- Racine V, Hertzog A, Jouanneau J, Salamero J, Kervrann C, Sibarita J-B. Multiple-target tracking of 3D fluorescent objects based on simulated annealing. 2006 IEEE International Symposium on Biomedical Imaging (ISBI 2006); April 6–9, 2006; Arlington, VA. 2006. Paper presented at. [Google Scholar]
- Rose SD, Lejen T, Casaletti L, Larson RE, Pene TD, Trifaro JM. Myosins II and V in chromaffin cells: myosin V is a chromaffin vesicle molecular motor involved in secretion. J Neurochem. 2003;85:287–298. doi: 10.1046/j.1471-4159.2003.01649.x. [DOI] [PubMed] [Google Scholar]
- Rudolf R, Salm T, Rustom A, Gerdes HH. Dynamics of immature secretory granules: role of cytoskeletal elements during transport, cortical restriction, and F-actin-dependent tethering. Mol Biol Cell. 2001;12:1353–1365. doi: 10.1091/mbc.12.5.1353. [DOI] [PMC free article] [PubMed] [Google Scholar]
- Rudolf R, Kogel T, Kuznetsov SA, Salm T, Schlicker O, Hellwig A, Hammer JA, III, Gerdes HH. Myosin Va facilitates the distribution of secretory granules in the F-actin rich cortex of PC12 cells. J Cell Sci. 2003;116:1339–1348. doi: 10.1242/jcs.00317. [DOI] [PubMed] [Google Scholar]
- Sakaba T, Neher E. Involvement of actin polymerization in vesicle recruitment at the calyx of Held synapse. J Neurosci. 2003;23:837–846. doi: 10.1523/JNEUROSCI.23-03-00837.2003. [DOI] [PMC free article] [PubMed] [Google Scholar]
- Schnell E, Nicoll RA. Hippocampal synaptic transmission and plasticity are preserved in myosin Va mutant mice. J Neurophysiol. 2001;85:1498–1501. doi: 10.1152/jn.2001.85.4.1498. [DOI] [PubMed] [Google Scholar]
- Schweizer FE, Ryan TA. The synaptic vesicle: cycle of exocytosis and endocytosis. Curr Opin Neurobiol. 2006;16:298–304. doi: 10.1016/j.conb.2006.05.006. [DOI] [PubMed] [Google Scholar]
- Seabra MC, Coudrier E. Rab GTPases and myosin motors in organelle motility. Traffic. 2004;5:393–399. doi: 10.1111/j.1398-9219.2004.00190.x. [DOI] [PubMed] [Google Scholar]
- Sellers JR, Veigel C. Walking with myosin V. Curr Opin Cell Biol. 2006;18:68–73. doi: 10.1016/j.ceb.2005.12.014. [DOI] [PubMed] [Google Scholar]
- Starck J-L, Murtagh FD, Bijaoui A. Image processing and data analysis: the multiscale approach. Cambridge, UK: Cambridge UP; 1998. [Google Scholar]
- Steyer JA, Almers W. Tracking single secretory granules in live chromaffin cells by evanescent-field fluorescence microscopy. Biophys J. 1999;76:2262–2271. doi: 10.1016/S0006-3495(99)77382-0. [DOI] [PMC free article] [PubMed] [Google Scholar]
- Steyer JA, Horstmann H, Almers W. Transport, docking and exocytosis of single secretory granules in live chromaffin cells. Nature. 1997;388:474–478. doi: 10.1038/41329. [DOI] [PubMed] [Google Scholar]
- Storrie B, White J, Rottger S, Stelzer EH, Suganuma T, Nilsson T. Recycling of Golgi-resident glycosyltransferases through the ER reveals a novel pathway and provides an explanation for nocodazole-induced Golgi scattering. J Cell Biol. 1998;143:1505–1521. doi: 10.1083/jcb.143.6.1505. [DOI] [PMC free article] [PubMed] [Google Scholar]
- Takagishi Y, Oda S, Hayasaka S, Dekker-Ohno K, Shikata T, Inouye M, Yamamura H. The dilute-lethal (dl) gene attacks a Ca2+ store in the dendritic spine of Purkinje cells in mice. Neurosci Lett. 1996;215:169–172. doi: 10.1016/0304-3940(96)12967-0. [DOI] [PubMed] [Google Scholar]
- Takagishi Y, Futaki S, Itoh K, Espreafico EM, Murakami N, Murata Y, Mochida S. Localization of myosin II and V isoforms in cultured rat sympathetic neurones and their potential involvement in presynaptic function. J Physiol (Lond) 2005;569:195–208. doi: 10.1113/jphysiol.2005.095943. [DOI] [PMC free article] [PubMed] [Google Scholar]
- Toonen RF, Kochubey O, de Wit H, Gulyas-Kovacs A, Konijnenburg B, Sorensen JB, Klingauf J, Verhage M. Dissecting docking and tethering of secretory vesicles at the target membrane. EMBO J. 2006;25:3725–3737. doi: 10.1038/sj.emboj.7601256. [DOI] [PMC free article] [PubMed] [Google Scholar]
- Tran VS, Marion-Audibert AM, Karatekin E, Huet S, Cribier S, Guillaumie K, Chapuis C, Desnos C, Darchen F, Henry JP. Serotonin secretion by human carcinoid BON cells. Ann NY Acad Sci. 2004;1014:179–188. doi: 10.1196/annals.1294.019. [DOI] [PubMed] [Google Scholar]
- Trifaro J, Rose SD, Lejen T, Elzagallaai A. Two pathways control chromaffin cell cortical F-actin dynamics during exocytosis. Biochimie. 2000;82:339–352. doi: 10.1016/s0300-9084(00)00193-0. [DOI] [PubMed] [Google Scholar]
- Vale RD. Myosin V motor proteins: marching stepwise towards a mechanism. J Cell Biol. 2003;163:445–450. doi: 10.1083/jcb.200308093. [DOI] [PMC free article] [PubMed] [Google Scholar]
- Varadi A, Ainscow EK, Allan VJ, Rutter GA. Involvement of conventional kinesin in glucose-stimulated secretory granule movements and exocytosis in clonal pancreatic beta-cells. J Cell Sci. 2002;115:4177–4189. doi: 10.1242/jcs.00083. [DOI] [PubMed] [Google Scholar]
- Varadi A, Tsuboi T, Rutter GA. Myosin Va transports dense core secretory vesicles in pancreatic MIN6 beta-cells. Mol Biol Cell. 2005;16:2670–2680. doi: 10.1091/mbc.E04-11-1001. [DOI] [PMC free article] [PubMed] [Google Scholar]
- Waselle L, Coppola T, Fukuda M, Iezzi M, El-Amraoui A, Petit C, Regazzi R. Involvement of the Rab27 binding protein Slac2c/MyRIP in insulin exocytosis. Mol Biol Cell. 2003;14:4103–4113. doi: 10.1091/mbc.E03-01-0022. [DOI] [PMC free article] [PubMed] [Google Scholar]
- Watanabe M, Nomura K, Ohyama A, Ishikawa R, Komiya Y, Hosaka K, Yamauchi E, Taniguchi H, Sasakawa N, Kumakura K, Ushiki T, Sato O, Ikebe M, Igarashi M. Myosin-Va regulates exocytosis through the submicromolar Ca2+-dependent binding of syntaxin-1A. Mol Biol Cell. 2005;16:4519–4530. doi: 10.1091/mbc.E05-03-0252. [DOI] [PMC free article] [PubMed] [Google Scholar]
- Wu X, Bowers B, Rao K, Wei Q, Hammer JA., III Visualization of melanosome dynamics within wild-type and dilute melanocytes suggests a paradigm for myosin V function In vivo. J Cell Biol. 1998;143:1899–1918. doi: 10.1083/jcb.143.7.1899. [DOI] [PMC free article] [PubMed] [Google Scholar]
- Wu XS, Tsan GL, Hammer JA., III Melanophilin and myosin Va track the microtubule plus end on EB1. J Cell Biol. 2005;171:201–207. doi: 10.1083/jcb.200503028. [DOI] [PMC free article] [PubMed] [Google Scholar]