

Abstract
Inner hair cells (IHCs) are the true sensory receptors in the cochlea; they transmit auditory information to the brain. IHCs respond to basilar membrane (BM) vibration by producing a transducer current through mechanotransducer (MET) channels located at the tip of their stereocilia when these are deflected. The IHC MET current has not been measured from adult animals. We simultaneously recorded IHC transducer currents and BM motion in a gerbil hemicochlea to examine relationships between these two variables and their variation along the cochlear length. Results show that although maximum transducer currents of IHCs are uniform along the cochlea, their operating range is graded and is narrower in the base. The MET current displays adaptation, which along with response magnitude depends on extracellular calcium concentration. The rate of adaptation is invariant along the cochlear length. We introduce a new method of measuring adaptation using sinusoidal stimuli. There is a phase lead of IHC transducer currents relative to sinusoidal BM displacement, reflecting viscoelastic coupling of their cilia and their adaptation process.
Keywords: mechanotransduction, inner hair cells, stereocilia, adaptation, gerbils, cochlear mechanics
Introduction
The organ of Corti in the mammalian cochlea, situated between the basilar membrane (BM) and the tectorial membrane (TM), is a matrix of sensory and supporting cells. The organ transforms transversal BM vibration into a radial shear stimulus at the apices of the sensory hair cells (ter Kuile, 1900; Hu et al., 1999). There are two types of sensory receptor cells in the mammalian organ of Corti: the inner hair cells (IHCs) and the outer hair cells (OHCs). Both types of hair cell have elongated actin-based villi named stereocilia emerging from their apical surface. The deflection of the ciliary bundle during BM vibration and the subsequent flow of transducer current through the mechanotransducer (MET) channels at the tips of the stereocilia (Hudspeth, 1982; Denk et al., 1995; Lumpkin and Hudspeth, 1995) produce the receptor potential in both IHCs and OHCs (Russell and Sellick, 1978; Dallos et al., 1982; Dallos, 1985). The receptor potential generated by IHCs facilitates the release of neurotransmitters at their synaptic end (for review, see Sewell, 1996). The receptor potential produced by OHCs, however, provides the stimulus to their motor activity (Brownell et al., 1985; Kachar et al., 1986; Ashmore, 1987), which is believed to power the cochlear amplifier (Dallos, 1992).
Although IHC receptor potentials have been recorded with sharp electrodes from adult animals in vivo (Russell and Sellick, 1978; Dallos, 1985) and culture preparations of neonatal mice (Russell et al., 1986a,b), the MET current has not been measured from the IHCs of adult animals. Therefore, knowledge of the basic properties of IHC transducer currents, quantitative relationships between them and BM displacements, as well as their variation along the cochlear length are still lacking. We simultaneously recorded IHC transducer currents and BM motion in an excised and bisected cochlea, the hemicochlea (Richter et al., 1998; Hu et al., 1999), in the same way that OHC transducer currents were measured previously (He et al., 2004). This preparation permits recordings from adult hair cells in situ at various cochlear locations while the BM is mechanically stimulated. A preliminary report on this work was presented previously (Jia et al., 2005).
Materials and Methods
Preparation of the hemicochlea.
Details of preparing the gerbil (Meriones unguiculatus) hemicochlea and its quality control were described previously (Richter et al., 1998; Hu et al., 1999). In brief, gerbils ranging in age from 25 to 35 d after birth were used for the experiments. After intraperitoneal injection of a lethal dose of sodium pentobarbital (150 mg/kg), the cochleae were dissected out and placed in artificial perilymph [Leibovitz's (L-15) medium; Invitrogen, San Diego, CA]. The cochlea was glued onto the surface of a small metal block. The block was immersed in the cutting bath of a standard Vibratome (series 1000; TPI, St. Louis, MO) filled with L-15 medium after the glue had hardened (∼5 min). The cochlea was aligned with the cutting edge of the blade until all cochlear-turn boundaries were perpendicular to the blade. After speed and amplitude were selected for cutting, the vibrating blade cut the cochlea into two parts from apex to base along the modiolar axis. Either of the resulting hemicochleae can be used for the experiments. Hair cells started to become swollen in <25 min after the cochlear wall was open and the organ of Corti was exposed to the L-15 medium. Therefore, all of the data presented were collected within 20 min. Experiments were done at room temperature (22 ± 2°C).
Whole-cell voltage clamp.
The hemicochlea was bathed in L-15 medium in an experimental chamber mounted on the stage of an upright microscope (DMLFSA; Leica, Nussloch, Germany) with a Burleigh Instruments (Fishers, NY) platform. The L-15 medium contained the following (in mm): 136 NaCl, 5.8 NaH2PO4, 5.4 KCl, 1.4 CaCl2, 0.9 MgCl2, 0.4 MgSO4, 10 HEPES-NaOH, at pH 7.4 and 300 mOsm L−1. In many experiments, the L-15 medium with 1.4 mm calcium was used as extracellular solution. When the input–output function of the IHC transducer current was determined, the hemicochlea was prepared and bathed in L-15 medium with 50 μm calcium in the extracellular solution. This solution was prepared separately and contained the following (in mm): 136 NaCl, 5.8 NaH2PO4, 5.4 KCl, 0.05 CaCl2, 2 Na-pyruvate, 10 glucose, and 10 HEPES-NaOH, at pH 7.4 and 300 mOsm L−1. To determine the effect of calcium on adaptation, low calcium (50 μm) perilymph was perfused to the bath solution by a perfusion pump after transducer currents were first measured at a 1.4 mm calcium concentration. The pipette solution contained the following (in mm): 140 CsCl, 0.1 CaCl2, 3.5 MgCl2, 2.5 MgATP, 5 EGTA-KOH, 5 HEPES-KOH, at pH 7.4 and 300 mOsm L−1. Pipette resistances were 3–4 MΩ. Recordings were made in whole-cell voltage-clamp mode, using an Axopatch 200B patch-clamp amplifier (Molecular Devices, Palo Alto, CA). Series resistance was 8–12 MΩ, and ∼75% of the series resistance was compensated. Currents were filtered at either 2 or 5 kHz and digitized at 10 or 20 kHz with a 16-bit A/D converter (Digidata 1322A) and pClamp 9.2 software (Molecular Devices). The cells were held at −70 mV.
Mechanical stimulation.
To evoke MET current from IHCs in the hemicochlea, BM displacement was produced by a vibrating paddle. A thin glass fiber was used as a paddle. The glass paddle was pulled from a 1.5 mm outer diameter glass tubing to a tip diameter of 20 μm. The tip was then heat polished and fused to a 60 μm spherule. The paddle was mounted on a piezoelectric actuator (Driver/Amplifier, PZ-150M; Burleigh Instruments), which was mounted on another three-dimensional Narashige micromanipulator (MHW-3). The paddle was positioned below the middle point of the pectinate zone of the BM. Upward motion of the paddle would result in the BM moving toward the scala vestibuli. To determine the relationship between the BM motion and MET current, 500 or 100 Hz sinusoidal voltage bursts with different amplitudes were used. Paddle vibration was coupled through the fluid to the BM, because the paddle was not in direct contact with the BM. To measure adaptation of the MET currents, the paddle was loaded onto the top surface of the TM underneath Reissner's membrane. Fiber-driven downward motion of the TM presumably engaged the stereociliary bundle with the underside of the TM, making it possible to deflect it with a constant displacement. To reduce transients at onset and offset of the step, the DC voltage step was low-pass filtered at either 2.1 or 4 kHz before being fed to the piezoelectric actuator. Because the frequency response of the paddle motion affects the ability to measure fast adaptation, we measured the rise time of paddle motion in response to DC voltage steps by the photodiode displacement measurement system after the paddle was loaded onto the TM. The rise time (between 10 and 90% of the steady-state value) was 0.165 or 0.085 ms, corresponding to a cutoff frequency of ∼2.1 or 4 kHz.
Measurements of BM displacement.
The preparation was obliquely illuminated by a 100 W lamp. The BM was imaged using a 40× water-immersion objective and magnified by an additional 20× relay lens. The magnified image of the edge of the BM was projected onto the photodiode (Hammamatsu, Shizuoka, Japan) through a slit. During measurements, the magnified image of the edge of the BM was positioned near the edge of the slit. The output signal from the photodiode amplifier represented the BM displacement. The photodiode system had a cutoff (3 dB) frequency of 1100 Hz at the highest gain of the amplifier and 4300 Hz at the reduced gain. The signal was then amplified by a 60 dB fixed-gain DC-coupled amplifier. The amplified signal was then low-pass filtered (at 1.1, 2.1, and 4.1 kHz at 60 dB/octave) before being delivered to one of the A/D inputs of a Digidata (1322A; Molecular Devices) signal processor. Calibration of motion was obtained by moving the slit a known amount (0.5 μm) using a piezo driver attached to it (Jia and He, 2005).
Results
Input–output functions of IHC transducer currents
The BM displacement shows shallow and broad tonotopic tuning in the hemicochlea (Richter et al., 1998), probably reflecting the local resonance properties of the cochlear partition. The approximate recording locations were 2.7–3.2 and 8.6–8.9 mm from the base of the cochlea, representing 18–13 and 1–0.6 kHz of the best frequencies in vivo (Müller, 1996). The corresponding best frequencies in the passive hemicochlea are between 0.5 and 1 octave lower (C. P. Richter and P. Dallos, personal communication). Sinusoidal signals at 500 Hz were used to evoke BM vibration. This stimulating frequency is close to the characteristic frequency for the recording location in the apex but is well below the characteristic frequency of the measured location in the base. This frequency is, however, high enough to minimize the effect of adaptation on the magnitude of the transducer currents even at an extracellular calcium concentration of 1.4 mm (see Results). Furthermore, unless otherwise noted, the hemicochleae were bathed in L-15 medium containing 50 μm calcium, a concentration that is close to the calcium concentration of endolymph in vivo (Bosher and Warren, 1978). Lowering the calcium concentration has been demonstrated to significantly slow the rate of adaptation in both mammalian and nonmammalian hair cells (Ricci et al., 2000, 2005; Kennedy et al., 2003).
Transducer currents were recorded using the tight-seal whole-cell voltage-clamp technique from IHCs in hemicochleae that showed no obvious signs of damage or deterioration under the light microscope. Recordings were all made from IHCs two to three layers down from the cutting edge. The criteria for a “good hemicochlea” were described previously (Richter et al., 1998; He et al., 2004). We measured from >90 cells from healthy-looking preparations. The magnitude of the maximal current response varied significantly. We assumed that small responses signified damage to the MET apparatus during preparation. Therefore, we only included data from IHCs with the largest responses for analysis and comparison. Figure 1, A and B, shows an example of simultaneous recordings of the MET current and BM displacement from one IHC each from the apical and basal locations. The BM displacement was essentially symmetrical and linear in magnitude within the range of stimulation. The transducer current at a holding potential of −70 mV was, however, highly asymmetric; BM motion toward scala vestibuli (plotted upward) produced a large increase in inward current, whereas BM displacement toward scala tympani yielded a small decrease in inward current. Similar asymmetry of the transducer current was observed in all cells with large current responses. The upward motion of BM toward scala vestibuli and the subsequent excitation of hair cells are consistent with the general assumption that BM movement toward scala vestibuli rotates the hair bundle in the direction of the tallest stereocilia and thus open transducer channels (Flock, 1965; Hudspeth and Corey, 1977; Kros et al., 1992).
Figure 1.

 |
In Figure 1C, magnitudes of transducer currents, slopes of the current plots, and estimated conductances are presented as a function of BM displacement for the two examples shown in Figure 1, A and B. Current data are fit with first-order Boltzmann functions (see figure legend) for the example shown in Figure 1, A and B. The derivatives (slope functions) of the Boltzmann fits are also shown (dotted lines). To determine whether the magnitude of IHC transducer currents varies along the longitudinal axis of the cochlea, as it does for OHCs (He et al., 2004), we measured IHC transducer currents from 23 cells. Data from 10 cells (5 cells from each location) with the largest responses are included in Figure 1C. These data show that IHC currents saturate at 2088 ± 148.9 and 2025 ± 177.9 pA (mean ± SD) for the apical- and basal-turn IHCs, respectively. Student's t test indicates that the means are not significantly different (p = 0.13). Maximal MET conductance is 29.8 ± 0.26 and 28.9 ± 0.65 nS for the apical- and basal-turn IHCs, respectively. The present numbers from adult IHCs are considerably in excess of those obtained from immature mouse IHCs measured in high calcium (1.4 mm) perilymph in vitro of 4.2 nS (Kros et al., 1992). Although maximum MET currents are very similar, the slopes of the functions differ between apical and basal IHCs. The mean maximal slopes for the basal and apical IHCs are 28.6 ± 3.6 and 15.1 ± 1.1 pA/nm, respectively. The difference, which is significant at the 1% level, simply reflects their different operating ranges: transducer currents of apical cells saturate at ∼200 nm BM displacement and those of basal cells saturate at approximately one-half of that. As a consequence, the slopes also differ by approximately a factor of 2. The operating ranges of IHCs are similar to those of OHCs at a given cochlear location (He et al., 2004). We also measured MET currents from another 12 IHCs (six from each location) in perilymph with 1.4 mm calcium using 100 Hz sinusoidal signals. These measurements showed that the current saturated at 1244.5 ± 45.2 and 1234.9 ± 70.4 pA for the apical- and basal-turn IHCs, respectively. Student's t test shows that the means are not significantly different (p = 0.78). This again demonstrates that magnitude of IHC transducer currents is uniform along the length of the cochlea. The mean maximal slopes for the basal and apical IHCs are 26.5 ± 4.9 pA/nm (n = 6) and 14.7 ± 3.4 pA/nm (n = 6), respectively. Again, the mean maximal slopes differ by approximately a factor of 2.
IHC transducer currents were asymmetrical in response to symmetrical BM displacement (Fig. 1A,B). There was considerable resting current when the preparation was bathed in L-15 medium with 50 μm calcium; ∼13.7 and 12.9% of the transducer channels were open for those apical and basal cells illustrated in Fig. 1, A and B. In L-15 medium with 1.4 mm calcium, the response was more asymmetrical, with ∼2.2 and 2.6% of the transducer channels open at rest for apical and basal cells (data not shown). The asymmetry seen at low calcium concentration appears to approach that in receptor potentials recorded from IHCs in vivo (Russell and Sellick, 1978; Dallos, 1985, 1986; Cheatham and Dallos, 1993). However, the MET currents measured from neonatal IHCs (Kros et al., 1992) and in adult OHCs (He et al., 2004) are more asymmetrical. The explanation is sought from the differences in calcium levels. As we show above (Crawford et al., 1991; Ricci et al., 2005), resting open probability of the MET channels is greater in low external Ca2+ (Ricci et al., 1998).
IHC receptor potentials recorded in vivo using sharp electrodes show a phase lead relative to BM displacement (Nuttall et al., 1981; Russell and Sellick, 1983; Dallos, 1985). We examined the phase relationship between the transducer current and BM displacement. To best study response phases, measurements were made at the 100 Hz stimulus frequency. Phase was determined from the time difference between response and BM displacement peaks. Figure 2 shows an example of such recording from an apical-turn IHC. To reveal the phase relationship between the transducer current and BM displacement, both of these variables are plotted on an expanded time scale for low and high stimulus level signals in Figure 2. It is apparent that the MET current phase leads to BM displacement. The phase lead persisted at all stimulus levels. Among the cells measured, the phase lead was always seen at 100 Hz, but its magnitude was variable between 0.1 and 0.25 cycles at low input levels. The average phase lead at the lowest stimulus level was 0.15 cycle, or 54° (±0.036 cycles SD; n = 11). We measured the phase relationship from six apical- and six basal-turn IHCs at 100 Hz with 1.4 mm calcium. The basal and apical cells did not show different behavior. IHC receptor potentials recorded in vivo using sharp electrodes also show a phase lead approaching 0.25 cycle (90°) relative to BM displacement (Nuttall et al., 1981; Russell and Sellick, 1983; Dallos, 1985). These results are consistent with the notion that the IHC hair-bundle displacement is related to BM velocity at low frequencies (Dallos et al., 1972). The variability and occasional level dependence of the phase lead probably reflect subtly different apposition from experiment to experiment between ciliary bundle and the TM (Freeman and Weiss, 1990; Fridberger et al., 2004). In vivo data obtained with sharp electrodes also reveal significant variability of the IHC phase lead (Cheatham and Dallos, 1999). As we show below, the operation of the adaptation machinery may also contribute to the recorded phase.
Figure 2.

A, Transducer current and BM motion measured using 100 Hz sinusoidal stimulation to reveal phase relationship between BM motion and transducer current. BM motion (dotted lines) and transducer current (solid lines) are plotted on an expanded time scale for the lowest and highest stimulation levels applied. Upward-plotted displacement represents the BM moving toward the scala media. This preparation was bathed in perilymph with 1.4 mm calcium. The recording was made from an apical-turn IHC. Note that the current responses show a phase lead relative to the BM displacements. B, A video image of an IHC hair bundle and the TM from a gerbil hemicochlea in the basal turn is shown. The bundle is closely apposed to the Hensen's stripe on the underside of the TM but not in direct contact with it. Scale bar, 10 μm.
Adaptation of the MET currents
For a sustained deflection of the hair bundle, the response in most types of hair cell adapts; the transduction current decays with time constants from tens of microseconds to tens of milliseconds (Eatock et al., 1987; Ohmori, 1987; Assad et al., 1989; Crawford et al., 1989; Holt et al., 1997; Ricci et al., 2000; Kennedy et al., 2003). The adaptation may be a means of ensuring that the sensitivity of the transducer is always maximized at the resting position of the bundle (Eatock, 2000; Holt and Corey, 2000). To determine whether IHC transducer currents also display adaptation and whether the adaptation rate is cochlear location dependent, as it is in nonmammalian hair cells and OHCs (Ricci et al., 2005), we measured this current in response to a sustained deflection of the hair bundles from apical- and basal-turn IHCs. To accomplish this, a different stimulation approach was required. To provide a steady displacement of the cilia within the hemicochlea environment, firm coupling between them and the TM needed to be established. To this end, the driving fiber was loaded onto the upper side of the TM. Under this condition, the IHC hair bundle was deflected by direct contact with the TM during the downward motion of the latter. This presumably engaged the stereociliary bundle with the underside of the TM, probably with Hensen's stripe (Fig. 2B), making it possible to deflect it with a constant displacement. To assess the frequency-dependent properties of the adaptation process, the magnitude of the MET currents was obtained when the TM motion was driven by the paddle (in contact mode). A series of sinusoidal bursts from 20 to 2000 Hz was used to drive the paddle. MET currents were monitored to examine the frequency response obtained with such an approach. The cells were held at −70 mV, and the hemicochlea was bathed in perilymph with 1.4 mm calcium content (to maximize adaptation). Figure 3 shows an example of such recordings. As Figure 3A demonstrates, the magnitude of the MET current increases as the vibration frequency of the paddle increases. The current magnitude reaches a plateau around 500 Hz. The magnitude plots (Fig. 3B) clearly reflect a high-pass character, but with both low- and high-frequency slopes approaching zero. The figure shows fitting the normalized magnitude data with a pole-zero pair having respective corner frequencies at 455 and 25 Hz. It is also apparent that at the intermediate frequencies there is a phase lead with respect to the driving stimulus. The maximal phase lead varies between 23 and 63° in four cells that were included in the analysis (these cells had the largest transducer currents). Using the appropriate phase function computed to correspond to the magnitude of fit (i.e., its Hilbert pair), good agreement with the phase data is obtained. We emphasize that curve fitting was done for the magnitude of data, whereas the good fit of the phase data occurred automatically with the theoretically derived phase function. The data presented are the first frequency-domain description of hair cell MET channel adaptation. The plateau seen in the MET current response, between 500 and 2000 Hz, indicates that our approach of deflecting the IHC bundle by fiber-driven downward motion of the TM is appropriate for examining adaptation with minimal influence of viscoelastic properties of the TM. It also indicates that the use of a sinusoidal stimulus at 500 Hz (Fig. 1) is adequate to describe the properties of the IHC MET channel without significant influence by the adaptation process. To extend these observations, we measured three additional basal- and three apical-turn IHCs with stimulating frequencies up to 4 kHz. Two examples from such recordings are presented in Figure 3D. It is apparent that the plateau in the MET current response is maintained at 4 kHz in both apical- and basal-turn IHCs. The undiminished MET current responses at 4 kHz suggest that the interposed TM itself does not significantly modify (i.e., slow down) the force delivered to the cilia.
Figure 3.

 |
In our next set of experiments, step stimuli with a duration of 20 ms were used to drive the fiber. This is the conventional way of assessing adaptation with steady deflection of the stereocilia. Transducer currents were recorded at the holding potential of −70 mV in the whole-cell voltage-clamp mode. Figure 4A shows an example of such recordings. The transducer current responded to the step stimuli with rapid onset followed by decay. Similar to that seen in mammalian hair cells (Holt et al., 1997; Kennedy et al., 2003; Ricci et al., 2005) and nonmammalian hair cells (Eatock et al., 1987; Ohmori, 1987; Assad et al., 1989; Crawford et al., 1989; Ricci et al., 2000, 2005), the decay of the current responses occurs on two time scales. For the two examples shown in Figure 4, the dominant shorter time constants vary between 0.42 and 1.66 ms (apical) and between 0.41 and 1.55 ms (basal) from smaller to larger current. We measured the adaptation rate from 15 additional cells (a total of 8 cells from the apex and 7 cells from the base) at the lowest stimulus level. These cells had the largest transducer currents, indicating that their MET channels suffered the least damage. The shortest time constants are 0.55 ± 0.12 ms (n = 8) and 0.58 ± 0.14 ms (n = 7) for the apical- and basal-turn IHCs, respectively. Student's t test shows that there is no statistically significant difference between them (p = 0.62). Although it is usual to fit adaptation with two exponential functions, for most of our IHCs, curve fitting with a single exponential would have been adequate. For example, for the heavy black curve in Figure 3C, the ratio of magnitudes of the two fitting exponentials is 6.5. Thus, the shorter time constant accounts for much of the response behavior.
Figure 4.
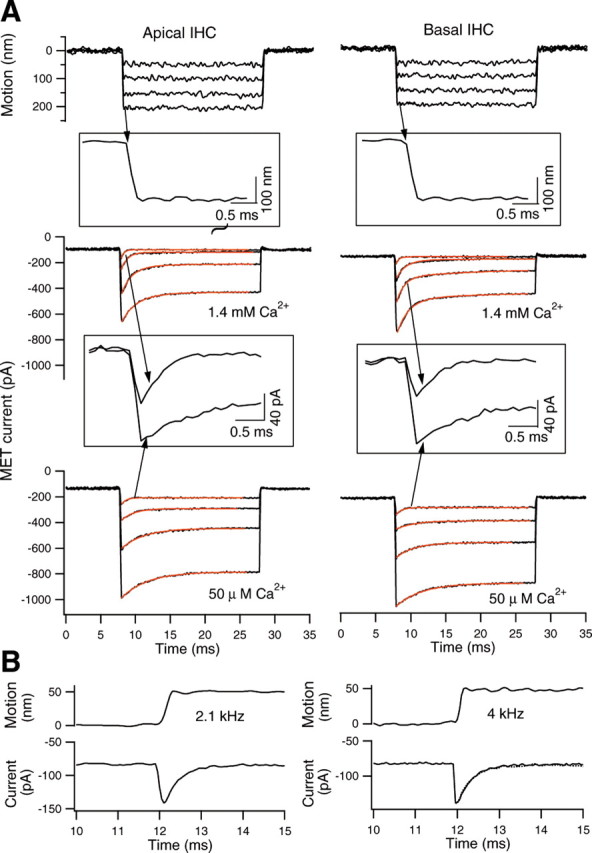
A, Adaptation of the transducer current obtained from apical- and basal-turn IHCs. Glass fiber was loaded onto the top of the TM, and step stimuli with durations of 20 ms were applied. The motion of the fiber (measured by the photodiode technique) is plotted in the top panels. Downward deflections of fiber motions resulted in the downward motion of the TM and thereby deflected the hair bundle in the excitatory direction. The photodiode signal was low-pass filtered at 2.5 kHz. As shown in the inset, the rise time of the step displacement is ∼0.165 ms, corresponding to a cutoff frequency of ∼2.1 kHz. The IHCs were voltage clamped at −70 mV. The current displays rapid activation and adaptation. The adaptation time constants increase from small to large current. Time constants were calculated using a double-exponential fit (red lines). The shorter time constants are 0.41, 0.93, 1.18, and 1.65 ms (apical-turn IHC) and 0.42, 0.83, 1.0, and 1.52 ms (basal-turn IHC), from small to large currents. The time constants significantly increased (response decay slowed down) after the calcium concentration in the bath medium was reduced to ∼50 μm. In the insets, MET currents at the lowest stimulation levels are plotted on expanded time scales to demonstrate the change in magnitude and adaptation of the MET current between the calcium concentrations of 1.4 mm and 50 μm. B, Effect of onset speed (rise time) on the fast time constant of adaptation. The recording was made from a basal-turn IHC. The driving voltage step to the piezoelectric actuator was low-pass filtered with an eight-pole Bessel filter set at either 2.1 or 4 kHz. MET current and TM-loaded fiber motion were measured and plotted on the expanded time scale. The rise times of fiber motion were ∼0.165 and 0.085 ms, respectively. For the sake of comparison, the current response obtained with the low-pass filter set at 2.1 kHz was superimposed (dotted line; only the decay response is plotted) on the response obtained with a 4 kHz cutoff frequency (solid line in the right panel). Note that no significant difference in the current magnitude and adaptation rate was observed with the two different rise times.
We also examined adaptation when calcium concentration was altered. Figure 4A shows examples recorded from apical and basal IHCs when the calcium concentration in the bath was reduced from 1.4 mm to ∼50 μm. Lowering extracellular calcium increased the maximum current by a factor of 1.62 ± 0.23 (n = 5) and slowed the low-level adaptation time constant by approximately twofold (2.1 ± 0.78-fold; n = 5 from apical-turn IHCs). The demonstrated susceptibility of adaptation to the calcium content of the medium is another argument in favor of the adequacy of the method of stimulation used here. To explain, if the dynamic properties of the response were dominated by the properties of the TM interposed between the driving fiber and cilia, a change in response with altered calcium would be less likely.
An important experimental variable that can influence the magnitude and rate of adaptation is the onset speed of the displacement step (Wu et al., 1999). In the data presented in Figure 4A, the driving voltage to the piezoelectric stimulator was low-pass filtered with an eight-pole Bessel filter set at 2.1 kHz. This yielded a rise time (10–90%) in the TM-loaded fiber motion of 0.165 ms. To confirm that this is adequate for examining the rate of adaptation, we measured the magnitude and adaptation rate of the MET current from three basal-turn IHCs when the rise time was changed from 0.165 to 0.085 ms. An example is presented in Figure 4B. Despite the fact that current activation was more rapid with the shortened rise time, no significant difference in magnitude and rate of adaptation (0.42 vs 0.44 ms) was observed. This result clearly shows that our stimuli are fast enough to accurately portray fast adaptation in IHCs.
Finally, it is possible to use the measured frequency response (Fig. 3B) to predict the corresponding time response. To this end, the derived frequency response function (shown in the legend of Fig. 3) was generalized from the harmonic representation to a general Laplace transform. The time response of this function (inverse Laplace transform) was then computed with a step input. The obtained linear time response was modified by the Boltzmann function representing the transducer (as in Fig. 1) to account for the nonlinearity of the MET process. The resulting predicted time pattern is superimposed on a set of adaptation functions obtained with DC displacement of the TM. This is shown in Figure 3C (circles and heavy lines). It is apparent that measuring adaptation with sinusoidal inputs yields results very similar to those obtained with the conventional DC displacement of the cilia. The harmonic method of measuring adaptation should allow for a more controllable and precise determination of the frequency-dependent properties of adaptation than the commonly used method that relies on step stimuli. We note that even if the input transducer has a relatively narrow bandwidth, it is possible to adjust its output signal at higher frequencies to provide constant magnitude drive to the hair cells. This is the principal advantage of the steady-state harmonic method.
Discussion
We have used the hemicochlea preparation previously to obtain transducer currents and receptor potentials from adult gerbil OHCs (He et al., 2004). In the present work, the same approach is used to record these variables from IHCs. In the hemicochlea, hair cells are stimulated through the naturally occurring sequence of BM displacement, organ of Corti micromechanical movements, and shearing motions between the reticular lamina and TM, resulting in ciliary deflection. In other preparations, the stereocilia are usually directly deflected mechanically. We consider the hemicochlea approach to be less susceptible to damage to the transduction apparatus and stimulation artifacts.
We find that for both locations, transducer currents approach 2 nA at large BM displacements toward scala vestibuli, the excitatory direction. The maximum transducer conductance obtained in the present study is 30.1 nS in low Ca2+. This value is 7.1 times greater than that seen from immature IHCs in culture, using 100 Hz stimuli and high Ca2+ (Kros et al., 1992). The differences are likely because of lowering calcium, minimal influence by adaptation (at 500 Hz), possible maturation effects, and the more in vivo-like stimulation in the hemicochlea compared with organotypic cultures. The uniformity of maximum transducer currents and conductances between basal- and apical-turn IHCs is consistent with the morphological data showing that the total number of stereocilia of IHCs is essentially the same along the cochlear length (Lim, 1986). The uniformity of transducer conductance of IHCs is in contrast to OHCs, which show a twofold change in conductance, being larger in the base (He et al., 2004), and to changes seen along the papilla in turtle and OHCs (Ricci et al., 2003, 2005).
When currents are measured using sinusoidal stimulation, it is important to take into account possible adaptation effects. To explain, because of its finite reaction time, the adaptation machinery has a high-pass filter effect on the signal (Fig. 3A). If the stimulus period is long compared with the adaptation time, the latter will influence the response. To consider this in a different light, assume that the signal is very fast, as in a transient or a high-frequency sinusoid. Because the adaptation process has a definite activation time, if the signal is faster than this time, adaptation cannot take place. As the frequency of the input decreases, the rise time (one-quarter cycle) becomes commensurate with the adaptation time and the current–displacement (I–X) curve shifts somewhat along the stimulus axis. This yields a reduced response. As stimulus frequency is further lowered, the shift of the I–X curves becomes complete, and full adaptation ensues, with a concomitant reduction in the response. We are describing here the progression along the function of Figure 3B, from high frequency to low frequency. In the example in Figure 3, the lead–lag network representing the frequency response has a pole at 455 Hz. This frequency is equivalent to the fast time constant that is usually obtained from step responses, which in this example is 0.35 ms. Because even at full adaptation, step responses show nonzero magnitude during the sustained portion of the input, the corresponding frequency-domain representation is an obligatory low-frequency plateau. As we see in the example of Figure 3B, the 500 Hz stimulus used for obtaining the data in Figure 1 is above the corner frequency and the corresponding response should be minimally affected by adaptation. However, the OHC data reported in our previous study were obtained at 100 Hz (He et al., 2004), a frequency below the cutoff frequency. Moreover, adaptation in OHCs appears to be faster and location dependent (Kennedy et al., 2003; Ricci et al., 2005). The consequence of this is that MET channel conductances were significantly underestimated in our previous work, on account of the high calcium in the bathing medium and the low-frequency harmonic stimuli.
If we take our maximal 30.1 nS IHC conductance and the measured single MET channel conductance (Géléoc et al., 1997) of ∼112 pS obtained in 1.3 mm Ca2+ medium, one can estimate the number of channels per tip link. We measured IHC stereocilia numbers in three gerbils, at three cochlear locations: base, middle, and apex. Stereocilia are arranged in three rows with numerous additional microvilli that were not counted. We find no difference in stereocilia numbers along the cochlea. The average number of stereocilia is 68. D. Furness (personal communication) finds an average of 46 cilia for both basal and apical locations of CD-1 mice. Taking our average of 68 cilia in three rows, the number of tip links is 45. From 30.1 nS conductance, 45 tip links, and an assumed 181.2 pS unitary conductance that was obtained by correcting the 112 pS conductance found by Géléoc et al. (1997) from calculating the ratio of low/high calcium bundle conductance, or 112 × 30.1/18.6 = 181.2 pS, one computes 3.7 channels per tip link. Alternatively, if we start from the assumption of two channels per tip link (Denk et al., 1995; Lumpkin and Hudspeth, 1995), yielding 90 channels, we compute a unitary conductance of 344 pS for IHC transducer channels.
Whereas the transducer conductance and maximum IHC transducer current appear uniform along the length of the cochlea, the operating range of the cells is not. As Figure 1 demonstrates, it requires approximately twice as large BM displacement in the apex to reach a given level of excitation. This finding is the same as was shown before for OHCs (He et al., 2004). Thus, the sensitivities (slope, in picoamperes per nanometer) are different for basal and apical IHCs (Fig. 1C). The reason for the difference is found in BM–organ of Corti geometry; a given BM displacement produces larger cilia displacement in the base than in the apex (Dallos, 2003). Because IHC stereocilia are not firmly imbedded in the TM (Lindeman et al., 1971; Lim, 1980), their angular rotation, corresponding to BM displacement, is frequency dependent and difficult to estimate.
We now address the different phase measurements reported here. When the cilia are displaced by direct contact with the TM, this mode of stimulation reveals the dynamic effects of adaptation. In the frequency domain, these are manifested as a modest phase lead between ∼50 and 200 Hz. Because the time constant of adaptation is level dependent, so is the cutoff frequency. We do note here the apparent consistency of measuring adaptation with DC or sinusoidal displacement of the ciliary bundle (Fig. 3C). In addition to the phase lead inherent in the adaptation process, there is a phase lead resulting from the viscoelastic coupling of the cilia to the TM. Because IHC cilia are not imbedded in the bottom surface of the TM (Fig. 2B), under normal stimulating conditions, as in Figure 1, they are displaced by viscous drag of the surrounding fluid. As a result, they respond to some function of BM velocity (Dallos et al., 1972) and thus show a phase lead. When the mechanical stimulus is coupled to the BM, the cilia bundle is stimulated via its normal micromechanical route. In this situation, both the viscoelastic coupling and the adaptation process should produce phase leads. This combined phase is revealed when transducer currents are compared with BM displacement (Fig. 2A). It is remarked that because a derivative relationship was first suggested 34 years ago (Dallos et al., 1972), a large literature has accumulated on assessing relationships between IHC response and BM displacement. When phase leads are obtained and used to support the idea of viscoelastic coupling, it has not been appreciated that the phase also includes that because of adaptation. In fact, we demonstrate here that a frequency-domain description of adaptation yields a low-frequency phase lead of the IHC transducer current. Similar phase lead should be measurable for any hair cell that expresses the adaptation process.
The fastest adaptation rate is always seen for the smallest stimulus. In the present sample, the smallest time constant measured with step inputs was 0.38 ms, corresponding to a cutoff frequency of 419 Hz. Time constants of adaptation in IHCs appear to be longer than those of OHCs, or ∼0.083 ms in the apical turn (Kennedy et al., 2003; Ricci et al., 2005). Although the time constant may be shorter in vivo after adjusting for differences in temperature and the driving force (Kennedy et al., 2003), the time constant of adaptation is uniform along the cochlea, as shown here. This is in contrast to OHCs and turtle hair cells, the adaptation rate of which is cochlear location dependent (Ricci et al., 2003, 2005). It is conceivable that IHCs have a different isoform of MET channels than those in OHCs. IHCs do not require rapid adaptation that is on the same time scale as found in OHCs. Because they are fluid coupled to the TM, their input is already high-pass filtered. Furthermore, if indeed rapid adaptation of OHCs were linked to amplifier action (Chan and Hudspeth, 2005; Kennedy et al., 2005), their need for speed is not duplicated in IHCs, which are not proposed to be active elements in the amplifying feedback loop. It is apparent from this work that, in contrast to amplifying OHCs, MET channel properties of IHCs appear uniform along the cochlear length.
Recently, Beurg et al. (2006) reported that the fast adaptation time constant of neonatal 1HCs was ∼0.45 ms and was invariant at two cochlear locations. Our data are consistent with their findings. However, the maximal amplitude of MET current is significantly larger in the present study, probably reflecting less damage to the mechanotransduction apparatus in the hemicochlea preparation.
Footnotes
This work was supported by National Institutes of Health–National Institute on Deafness and Other Communication Disorders Grants R01 DC 004696 and R21 DC 006039 (D.Z.Z.H.) and R01 DC00089 (P.D.), by the Health Future Foundation of Creighton University, and by the 2005 Sandy and David Marshall Grant in Auditory Science from the National Organization for Hearing Research Foundation. We thank Dr. David Furness for providing mouse inner hair cell (IHC) cilia counts and Ben Currall for providing gerbil IHC cilia counts. Preliminary work was presented in February 2005 at the annual meeting of the Association for Research in Otolaryngology in New Orleans, Louisiana.
References
- Ashmore JF. A fast motile response in guinea-pig outer hair cells: the cellular basis of the cochlear amplifier. J Physiol (Lond) 1987;388:323–347. doi: 10.1113/jphysiol.1987.sp016617. [DOI] [PMC free article] [PubMed] [Google Scholar]
- Assad JA, Hacohen N, Corey DP. Voltage dependence of adaptation and active bundle movement in bullfrog saccular hair cells. Proc Natl Acad Sci USA. 1989;86:2918–2922. doi: 10.1073/pnas.86.8.2918. [DOI] [PMC free article] [PubMed] [Google Scholar]
- Beurg M, Evans MG, Hackney CM, Fettiplace R. A large-conductance calcium-selective mechanotransducer channel in mammalian cochlear hair cells. J Neurosci. 2006;26:10992–110000. doi: 10.1523/JNEUROSCI.2188-06.2006. [DOI] [PMC free article] [PubMed] [Google Scholar]
- Bosher SK, Warren RL. Very low calcium content of cochlear endolymph, an extracellular fluid. Nature. 1978;273:377–378. doi: 10.1038/273377a0. [DOI] [PubMed] [Google Scholar]
- Brownell WE, Bader CR, Bertrand D, de Ribaupierre Y. Evoked mechanical responses in isolated cochlear outer hair cells. Science. 1985;227:194–196. doi: 10.1126/science.3966153. [DOI] [PubMed] [Google Scholar]
- Chan DK, Hudspeth AJ. Ca(2+) current-driven nonlinear amplification by the mammalian cochlea in vitro. Nat Neurosci. 2005;8:149–155. doi: 10.1038/nn1385. [DOI] [PMC free article] [PubMed] [Google Scholar]
- Cheatham MA, Dallos P. Longitudinal comparisons of IHC ac and dc receptor potentials recorded from the guinea pig cochlea. Hear Res. 1993;68:107–114. doi: 10.1016/0378-5955(93)90069-d. [DOI] [PubMed] [Google Scholar]
- Cheatham MA, Dallos P. Response phase: a view from the inner hair cell. J Acoust Soc Am. 1999;105:799–810. doi: 10.1121/1.426269. [DOI] [PubMed] [Google Scholar]
- Crawford AC, Evans MG, Fettiplace R. Activation and adaptation of transducer currents in turtle hair cells. J Physiol (Lond) 1989;419:405–434. doi: 10.1113/jphysiol.1989.sp017878. [DOI] [PMC free article] [PubMed] [Google Scholar]
- Crawford AC, Evans MG, Fettiplace R. The actions of calcium on the mechano-electrical transducer current of turtle hair cells. J Physiol (Lond) 1991;434:369–398. doi: 10.1113/jphysiol.1991.sp018475. [DOI] [PMC free article] [PubMed] [Google Scholar]
- Dallos P. Response characteristics of mammalian cochlear hair cells. J Neurosci. 1985;5:1591–1608. doi: 10.1523/JNEUROSCI.05-06-01591.1985. [DOI] [PMC free article] [PubMed] [Google Scholar]
- Dallos P. Neurobiology of cochlear inner and outer hair cells: intracellular recordings. Hear Res. 1986;22:185–198. doi: 10.1016/0378-5955(86)90095-x. [DOI] [PubMed] [Google Scholar]
- Dallos P. The active cochlea. J Neurosci. 1992;12:4575–4585. doi: 10.1523/JNEUROSCI.12-12-04575.1992. [DOI] [PMC free article] [PubMed] [Google Scholar]
- Dallos P. Organ of Corti kinematics. J Assoc Res Otolaryngol. 2003;4:416–421. doi: 10.1007/s10162-002-3049-z. [DOI] [PMC free article] [PubMed] [Google Scholar]
- Dallos P, Billone MC, Durrant JD, Wang C, Raynor S. Cochlear inner and outer hair cells: functional differences. Science. 1972;177:356–358. doi: 10.1126/science.177.4046.356. [DOI] [PubMed] [Google Scholar]
- Dallos P, Santos-Sacchi J, Flock Å. Intracellular recordings from cochlear outer hair cells. Science. 1982;218:582–584. doi: 10.1126/science.7123260. [DOI] [PubMed] [Google Scholar]
- Denk W, Holt JR, Shepherd GM, Corey DP. Calcium imaging of single stereocilia in hair cells: localization of transduction channels at both ends of tip links. Neuron. 1995;15:1311–1321. doi: 10.1016/0896-6273(95)90010-1. [DOI] [PubMed] [Google Scholar]
- Eatock RA. Adaptation in hair cells. Annu Rev Neurosci. 2000;23:285–314. doi: 10.1146/annurev.neuro.23.1.285. [DOI] [PubMed] [Google Scholar]
- Eatock RA, Corey DP, Hudspeth AJ. Adaptation of mechanoelectrical transduction in hair cells of the bullfrog's sacculus. J Neurosci. 1987;7:2821–2836. doi: 10.1523/JNEUROSCI.07-09-02821.1987. [DOI] [PMC free article] [PubMed] [Google Scholar]
- Flock Å. Transducing mechanisms in the lateral line canal organ receptors. Cold Spring Harb Symp Quant Biol. 1965;30:133–145. doi: 10.1101/sqb.1965.030.01.016. [DOI] [PubMed] [Google Scholar]
- Freeman DM, Weiss TF. Hydrodynamic forces on hair bundles at low frequencies. Hear Res. 1990;48:17–30. doi: 10.1016/0378-5955(90)90196-v. [DOI] [PubMed] [Google Scholar]
- Fridberger A, de Monvel JB, Zheng JF, Hu N, Zou Y, Ren TY, Nuttall A. Organ of Corti potentials and the motion of the basilar membrane. J Neurosci. 2004;24:10057–10063. doi: 10.1523/JNEUROSCI.2711-04.2004. [DOI] [PMC free article] [PubMed] [Google Scholar]
- Géléoc GS, Lennan GW, Richardson GP, Kros CJ. A quantitative comparison of mechanoelectrical transduction in vestibular and auditory hair cells of neonatal mice. Proc Biol Sci. 1997;264:611–621. doi: 10.1098/rspb.1997.0087. [DOI] [PMC free article] [PubMed] [Google Scholar]
- He DZZ, Jia SP, Dallos P. Mechanoelectrical transduction of adult outer hair cells studied in a gerbil hemicochlea. Nature. 2004;429:766–770. doi: 10.1038/nature02591. [DOI] [PubMed] [Google Scholar]
- Holt JR, Corey DP. Two mechanisms for transducer adaptation in vertebrate hair cells. Proc Natl Acad Sci USA. 2000;97:11730–11735. doi: 10.1073/pnas.97.22.11730. [DOI] [PMC free article] [PubMed] [Google Scholar]
- Holt JR, Corey DP, Eatock RA. Mechanoelectrical transduction and adaptation in hair cells of the mouse utricle, a low-frequency vestibular organ. J Neurosci. 1997;17:8739–8748. doi: 10.1523/JNEUROSCI.17-22-08739.1997. [DOI] [PMC free article] [PubMed] [Google Scholar]
- Hu XT, Evans BN, Dallos P. Direct visualization of organ of Corti kinematics in a hemicochlea. J Neurophysiol. 1999;82:2798–2807. doi: 10.1152/jn.1999.82.5.2798. [DOI] [PubMed] [Google Scholar]
- Hudspeth AJ. Extracellular current flow and the site of transduction by vertebrate hair cells. J Neurosci. 1982;2:1–10. doi: 10.1523/JNEUROSCI.02-01-00001.1982. [DOI] [PMC free article] [PubMed] [Google Scholar]
- Hudspeth AJ, Corey DP. Sensitivity, polarity and conductance change in the response of vertebrate hair cells to controlled mechanical stimuli. Proc Natl Acad Sci USA. 1977;74:2407–2411. doi: 10.1073/pnas.74.6.2407. [DOI] [PMC free article] [PubMed] [Google Scholar]
- Jia S, He DZ. Motility-associated hair bundle motion of outer hair cells. Nat Neurosci. 2005;8:1028–1034. doi: 10.1038/nn1509. [DOI] [PubMed] [Google Scholar]
- Jia S, Dallos P, He D. Mechanoelectrical transduction in adult inner hair cells. Assoc Res Otolaryngol Abstr. 2005;28:169. [Google Scholar]
- Kachar B, Brownell WE, Altschuler R, Fex J. Electrokinetic shape changes of cochlear outer hair cells. Nature. 1986;322:365–368. doi: 10.1038/322365a0. [DOI] [PubMed] [Google Scholar]
- Kennedy HJ, Evans MG, Crawford AC, Fettiplace R. Fast adaptation of mechanoelectrical transducer channels in mammalian cochlear hair cells. Nat Neurosci. 2003;6:832–836. doi: 10.1038/nn1089. [DOI] [PubMed] [Google Scholar]
- Kennedy HJ, Crawford AC, Fettiplace R. Force generation by mammalian hair bundles supports a role in cochlear amplification. Nature. 2005;433:880–883. doi: 10.1038/nature03367. [DOI] [PubMed] [Google Scholar]
- Kros CJ, Rüsch A, Richardson GP. Mechano-electrical transducer currents in hair cells of the cultured neonatal mouse cochlea. Proc R Soc Lond B Biol Sci. 1992;249:185–193. doi: 10.1098/rspb.1992.0102. [DOI] [PubMed] [Google Scholar]
- Lim DJ. Cochlear anatomy related to cochlear micromechanics. A review. J Acoust Soc Am. 1980;67:1686–1695. doi: 10.1121/1.384295. [DOI] [PubMed] [Google Scholar]
- Lim DJ. Functional structure of the organ of Corti: a review. Hear Res. 1986;22:117–146. doi: 10.1016/0378-5955(86)90089-4. [DOI] [PubMed] [Google Scholar]
- Lindeman HH, Ades HW, Bredberg G, Engstrom H. The sensory hairs and the tectorial membrane in the development of the cat s organ of Corti. A scanning electron microscopic study. Acta Otolaryngol. 1971;72:229–242. doi: 10.3109/00016487109122478. [DOI] [PubMed] [Google Scholar]
- Lumpkin EA, Hudspeth AJ. Detection of Ca2+ entry through mechanosensitive channels localizes the site of mechanoelectrical transduction in hair cells. Proc Natl Acad Sci USA. 1995;92:10297–10301. doi: 10.1073/pnas.92.22.10297. [DOI] [PMC free article] [PubMed] [Google Scholar]
- Müller M. The cochlear place-frequency map of the adult and developing Mongolian gerbil. Hear Res. 1996;94:148–156. doi: 10.1016/0378-5955(95)00230-8. [DOI] [PubMed] [Google Scholar]
- Nuttall AL, Brown MC, Masta RI, Lawrence M. Inner hair cell responses to the velocity of basilar membrane motion in the guinea pig. Brain Res. 1981;211:171–174. doi: 10.1016/0006-8993(81)90078-0. [DOI] [PubMed] [Google Scholar]
- Ohmori H. Gating properties of the mechano-electrical transducer channel in the dissociated vestibular hair cell of the chick. J Physiol (Lond) 1987;387:589–609. doi: 10.1113/jphysiol.1987.sp016590. [DOI] [PMC free article] [PubMed] [Google Scholar]
- Ricci AJ, Wu YC, Fettiplace R. The endogenous calcium buffer and the time course of transducer adaptation in auditory hair cells. J Neurosci. 1998;18:8261–8277. doi: 10.1523/JNEUROSCI.18-20-08261.1998. [DOI] [PMC free article] [PubMed] [Google Scholar]
- Ricci AJ, Crawford AC, Fettiplace R. Active hair bundle motion linked to fast transducer adaptation in auditory hair cells. J Neurosci. 2000;20:7131–7142. doi: 10.1523/JNEUROSCI.20-19-07131.2000. [DOI] [PMC free article] [PubMed] [Google Scholar]
- Ricci AJ, Crawford AC, Fettiplace R. Tonotopic variation in the conductance of the hair cell mechanotransducer channel. Neuron. 2003;40:983–990. doi: 10.1016/s0896-6273(03)00721-9. [DOI] [PubMed] [Google Scholar]
- Ricci AJ, Kennedy HJ, Crawford AC, Fettiplace R. The transduction channel filter in auditory hair cells. J Neurosci. 2005;25:7831–7839. doi: 10.1523/JNEUROSCI.1127-05.2005. [DOI] [PMC free article] [PubMed] [Google Scholar]
- Richter CP, Evans BN, Edge R, Dallos P. Basilar membrane vibration in the gerbil hemicochlea. J Neurophysiol. 1998;79:2255–2264. doi: 10.1152/jn.1998.79.5.2255. [DOI] [PubMed] [Google Scholar]
- Russell IJ, Sellick PM. Intracellular studies of hair cells in the mammalian cochlea. J Physiol (Lond) 1978;284:261–290. doi: 10.1113/jphysiol.1978.sp012540. [DOI] [PMC free article] [PubMed] [Google Scholar]
- Russell IJ, Sellick PM. Low-frequency characteristics of intracellularly recorded receptor potentials in guinea-pig cochlear hair cells. J Physiol (Lond) 1983;338:179–206. doi: 10.1113/jphysiol.1983.sp014668. [DOI] [PMC free article] [PubMed] [Google Scholar]
- Russell IJ, Cody AR, Richardson GP. The responses of inner and outer hair cells in the basal turn of the guinea-pig cochlea and in the mouse cochlea grown in vitro. Hear Res. 1986a;22:199–216. doi: 10.1016/0378-5955(86)90096-1. [DOI] [PubMed] [Google Scholar]
- Russell IJ, Richardson GP, Cody AR. Mechanosensitivity of mammalian auditory hair cells in vitro. Nature. 1986b;321:517–519. doi: 10.1038/321517a0. [DOI] [PubMed] [Google Scholar]
- Sewell WF. Neurotransmitters and synaptic transmission. In: Dallos P, Popper AN, Fay RR, editors. The cochlea. New York: Springer; 1996. pp. 503–533. [Google Scholar]
- ter Kuile E. Die uebertragung der energie von der grundmembran auf die haarzellen. Pflügers Arch. 1900;79:146–157. [Google Scholar]
- Wu YC, Ricci AJ, Fettiplace R. Two components of transducer adaptation in auditory hair cells. J Neurophysiol. 1999;82:2171–2181. doi: 10.1152/jn.1999.82.5.2171. [DOI] [PubMed] [Google Scholar]