

Abstract
We tested for cortical shape abnormalities using surface-based morphometry across a range of autism spectrum disorders (7.5–18 years of age). We generated sulcal depth maps from structural magnetic resonance imaging data and compared typically developing controls to three autism spectrum disorder subgroups: low-functioning autism, high-functioning autism, and Asperger's syndrome. The low-functioning autism group had a prominent shape abnormality centered on the pars opercularis of the inferior frontal gyrus that was associated with a sulcal depth difference in the anterior insula and frontal operculum. The high-functioning autism group had bilateral shape abnormalities similar to the low-functioning group, but smaller in size and centered more posteriorly, in and near the parietal operculum and ventral postcentral gyrus. Individuals with Asperger's syndrome had bilateral abnormalities in the intraparietal sulcus that correlated with age, intelligence quotient, and Autism Diagnostic Interview-Revised social and repetitive behavior scores. Because of evidence suggesting age-related differences in the developmental time course of neural alterations in autism, separate analyses on children (7.5–12.5 years of age) and adolescents (12.75–18 years of age) were also carried out. All of the cortical shape abnormalities identified across all ages were more pronounced in the children. These findings are consistent with evidence of an altered trajectory of early brain development in autism, and they identify several regions that may have abnormal patterns of connectivity in individuals with autism.
Keywords: autism spectrum disorders, MRI, Asperger's syndrome, intraparietal sulcus, inferior frontal gyrus, cortex, connectivity
Introduction
Autism spectrum disorders are characterized by abnormal social behavior, impaired communication, and repetitive interests and behaviors (American Psychiatric Association, 1994). Asperger's syndrome is a subtype of autism spectrum disorders that is differentiated from high-functioning autism based on normal development of cognitive and language skills before 3 years of age. Although not a diagnostic distinction, high- and low-functioning autism are often distinguished based on intelligence quotient (IQ) scores and reflect differences in educational needs and outcomes (Volkmar and Klin, 2005).
The neuropathology of autism remains poorly understood, although structural magnetic resonance imaging (MRI) studies have provided important information about gross structural abnormalities. Volumetric studies have revealed differences in both cerebral gray and white matter (Piven et al., 1996; Carper et al., 2002; Hazlett et al., 2005a,b; Hendry et al., 2005; McAlonan et al., 2005) as well as specific regional abnormalities in the amygdala, hippocampus, cerebellum, and frontal lobes (Aylward et al., 1999; Carper et al., 2002; Sparks et al., 2002; Schumann et al., 2004; Carper and Courchesne, 2005). There is converging evidence that the time course of brain development is altered in autism (Carper et al., 2002; Schumann et al., 2004), with a precocious period of early growth that may be idiosyncratic for different brain regions.
In contrast to volumetric studies of various brain regions, cortical folding patterns have not been studied extensively using structural imaging. Abnormalities in cortical folding may arise from altered patterns of connectivity (Van Essen, 1997) and would be consistent with existing evidence of increased white matter (Herbert et al., 2003, 2004) and aberrant white matter structure (Barnea-Goraly et al., 2004; Hendry et al., 2005) in autism. Three studies of cortical shape characteristics in autism, each using a different approach, report abnormalities in the cortical surface (Piven et al., 1990; Levitt et al., 2003; Hardan et al., 2004). Piven et al. (1990) examined cortical shape characteristics in a group of adults with high-functioning autism by qualitatively rating high-resolution MRI scans for various cortical malformations. Relative to a group of age- and IQ-matched controls, individuals with autism were reported to have a significantly higher incidence of cortical abnormalities such as polymicrogyria, schizencephaly, and macrogyria. In a preliminary study, Hardan et al. (2004) reported that children and adolescents with autism had a higher left frontal gyrification index than controls, but that adults did not. Levitt et al. (2003), using manually traced three-dimensional (3-D) sulcal trajectories, reported an anterior and superior shift in the Sylvian fissure, superior temporal sulcus, and inferior frontal sulcus in children with high-functioning autism. Here, using a surface-based approach involving sulcal depth maps that previously revealed dozens of folding abnormalities in Williams Syndrome (Van Essen et al., 2006), we identify and characterize significant folding abnormalities in each autism spectrum subgroup.
Materials and Methods
Subjects
Participants in this study included 75 male volunteers, ages 7.5–18.5, divided into four diagnostic groups: low-functioning autism (LFA) (full-scale IQ <70), high-functioning autism (HFA) (full-scale IQ ≥70), Asperger's syndrome (ASP), and typically developing controls (TD). All participants with an autism spectrum disorders (ASD) diagnosis were recruited through the UC Davis M.I.N.D. Institute. Diagnostic assessments included the Autism Diagnostic Observation Schedule-Generic (ADOS-G) (DiLavore et al., 1995; Lord et al., 2000) and the Autism Diagnostic Interview-Revised (ADI-R) (Lord et al., 1994). Children diagnosed with Asperger's syndrome met DSM-IV criteria and had developed phrase language before 36 months. IQ scores were obtained using the Wechsler Intelligence Scale for Children (Wechsler, 1991) or the Wechsler Abbreviated Scale of Intelligence (Wechsler, 1999) for high-functioning children. The Leiter International Performance Scale-Revised (Roid and Miller, 1997) was used to assess IQ in nonverbal children (including all children in the low-functioning autism group). IQ scores for all ASD participants and 19 typically developing controls were obtained. Subject demographics and ADI-R domain scores for the ASD participants are provided in Table 1.
Table 1.
Subject demographics
| LFA | HFA | ASP | TD | |
|---|---|---|---|---|
| n | 17 | 14 | 15 | 29 |
| Age | 13.3 (2.9) | 11.4 (3.1) | 12.3 (3.2) | 11.8 (2.6) |
| Full-scale IQ | 56 (10)* | 89 (16)* | 97 (17)* | 115 (12) |
| Verbal IQ | — | 87 (21)* | 105 (23) | 113 (14) |
| Performance IQ | — | 92 (13)* | 91 (16)* | 114 (13) |
| ADI-R Social | 23 (6) | 19 (6) | 18 (4) | — |
| Communication | 16 (4) | 16 (3) | 14 (4) | — |
| Repetitive behavior | 7 (3) | 6 (2) | 7 (4) | — |
Data are expressed as mean (SD). Verbal and performance IQ scores are not available for LFA subjects. IQ scores are available for 19 TD subjects. *p < 0.01, significantly different from TD controls.
Typically developing controls were recruited from the UC Davis M.I.N.D. Institute, through newspaper advertisements in the greater Sacramento area, and through word of mouth. Participants were excluded from the study if they had a diagnosis of fragile X, seizure disorder, tuberous sclerosis, obsessive compulsive disorder, bipolar disorder, or any other major neurological disorder. Typically developing controls were also excluded if they had a family member with an autism spectrum disorder. All protocols for this study were approved by the UC Davis Institutional Review Board. Informed consent was obtained by the parent or guardian of each participant, and the study participant gave their assent when possible. Some of the subjects in this study (all ASD subjects and 14 typically developing controls) were also included in previous reports (Lotspeich et al., 2004; Schumann et al., 2004).
MRI protocol
All subjects were scanned at the UC Davis Medical Center. Participants requiring general anesthesia were scanned at the UC Davis Hospital using a 1.5 T GE Signa Horizon imaging system (17 LFA, 13 HFA, and 7 ASP), and all other participants (including all TD controls) were scanned at the UC Davis Imaging Research Center using a 1.5 T GE Signa NV/I system. Validation of the comparability of images from the two different scanners was performed previously (Lotspeich et al., 2004). A high-resolution three-dimensional T1-weighted scan was used for surface-based analysis of each participant. For most subjects (n = 60; all ASD subjects and 14 TD controls), the T1-weighted sequence was a 3D spoiled gradient recalled echo (SPGR) sequence with the following parameters: repetition time (TR), 35 ms; echo time (TE), 6 ms; flip angle (FA), 45°; field of view (FOV), 24 cm; matrix, 256 × 256; slice thickness, 1.5 mm; 124 slices. Data for some of the TD controls (n = 15) were obtained as part of a functional MRI (fMRI) study (S. M. Rivera, M. L. Henry, E. A. Crone, A. M. Herrera, and J. L. Langer, submitted manuscript) using a different 3D SPGR T1-weighted sequence: TR 75 ms, TE minimum, FA 15°, FOV 22 cm, matrix 256 × 256, slice thickness 1.3 mm, 128 slices. Using two different SPGR sequences to acquire the TD control data increased heterogeneity within the TD control group, but an extensive set of validation analyses indicate that systematic differences between the two sets of TD data do not account for the main findings reported below (see supplemental material, available at www.jneurosci.org).
Image processing
All images were resampled to 1 mm3 isotropic voxels and oriented along a horizontal line through the anterior and posterior commissures. To reduce variability arising from differences in total brain size, images were spatially normalized to the standardized MNI-152 template (average of 152 T1-weighted images from the International Consortium of Brain Mapping project) using FLIRT (FMRIB's Linear Image Registration Tool; http://www.fmrib.ox.ac.uk/fsl/flirt/index.html) (Jenkinson and Smith, 2001).
Cortical surfaces and sulcal depth maps for each hemisphere were generated and registered to the PALS-B12 (Population-average, landmark- and surface-based) atlas target (Van Essen, 2005) using Caret 5.4 and Caret 5.5 software, as summarized below and illustrated in Figure 1. For each hemisphere, a segmentation boundary running midway through cortical gray matter (approximating cortical layer 4) was generated using the SureFit method (Van Essen et al., 2001) (Fig. 1B). An automated error correction algorithm followed by manual editing removed topological errors and other surface irregularities. The raw cortical surface enclosing the segmentation boundary was slightly smoothed to generate a 3D fiducial surface (Fig. 1C). A cerebral hull boundary was created by applying dilation and erosion operations to the initial cortical segmentation (Fig. 1D), and a resulting cerebral hull surface was also generated (Fig. 1E). Sulcal depth was computed as the distance from each node on the fiducial surface to the nearest node on the cerebral hull surface. When displayed on an inflated surface (Fig. 1F), the map of sulcal depth allows detailed information about the native cortical shape to be viewed on an extensively smoothed surface.
Figure 1.
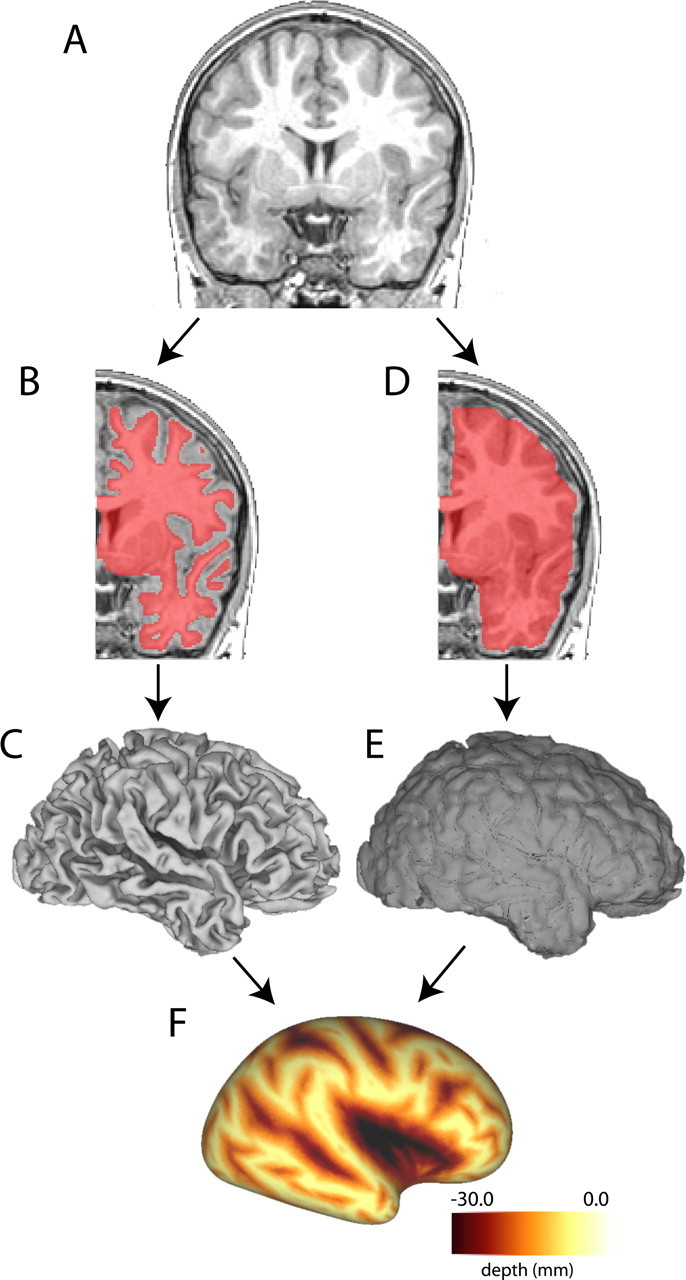
Method for generating sulcal depth maps. A, Coronal section through a high-resolution T1-weighted MRI for an individual subject. Hemispheres are cropped and analyzed separately. B, A segmentation boundary running midway through cortical gray matter (shown overlaid on the MRI in pink) is used to generate a fiducial surface (C). D, A cerebral hull boundary is created by dilating and expanding the segmentation boundary and a cerebral hull surface is generated (E). F, Sulcal depth maps are generated by calculating the distance from each node on the fiducial surface to the nearest node on the cerebral hull surface. Darker areas represent deeper sulcal depth measurements.
Registration and standard-mesh surface representation
Cortical surfaces and sulcal depth maps for each hemisphere were registered to the PALS-B12 atlas using landmark-based registration. Six highly consistent anatomical landmarks were drawn on each individual's flattened cortical surface and used to register each individual sphere to the PALS-B12 atlas sphere. The landmarks consisted of the central sulcus, calcarine sulcus, Sylvian fissure, anterior half of the superior temporal gyrus, and the dorsal and ventral segments of the medial wall [compare Fig. 2, Van Essen (2005); http://brainvis.wustl.edu/help/landmarks_core6/landmarks_core6.html]. Two trained raters (C.W.N. and I.M.) performed segmentations and landmark assignments. To minimize the effects of inter-rater differences, all segmentations and landmarks were evaluated and revised by a third highly trained individual.
Figure 2.
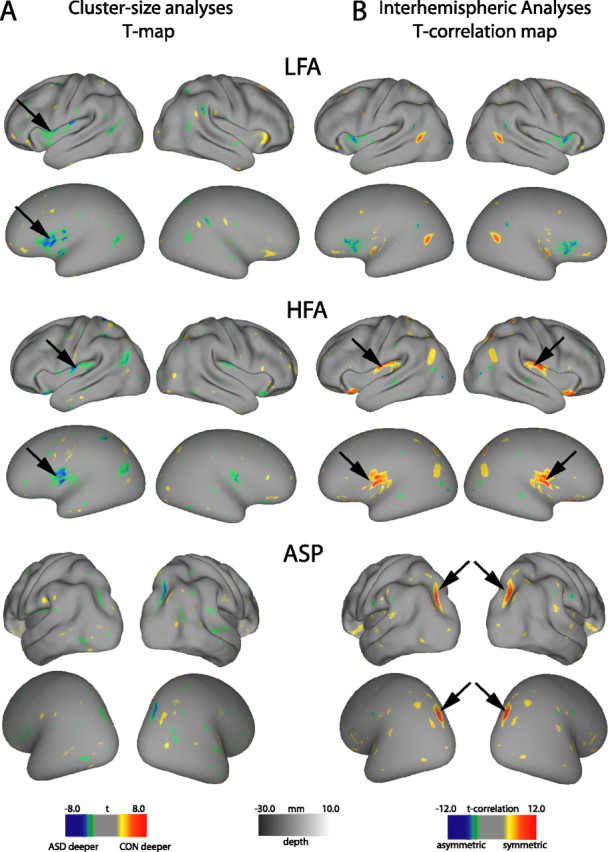
T-maps for cluster size analyses (A) and interhemispheric correlation analyses (B) for each subgroup comparison across all ages overlaid on the PALS-B12 inflated and very inflated surfaces. A, T-statistic maps are thresholded to p = 0.01. Clusters that surpass the size threshold for significance are identified by arrows (left parietal operculum in HFA group and left frontal operculum in LFA group). B, T-correlation maps are thresholded to twice the t-value (p = 0.01) used in corresponding single hemisphere analyses. Bilateral clusters that surpass the size threshold are identified by arrows (intraparietal sulcus in the ASP group and parietal operculum in the HFA group).
The registration process allowed each individual fiducial surface to be represented as a “standard-mesh” representation (Van Essen, 2005) that facilitates concurrent visualization of corresponding locations in either hemisphere from different individuals. This was essential for making quantitative surface-based comparisons between hemispheres and within and across groups. Standard-mesh fiducial surfaces within each group were averaged across subjects to generate average fiducial surfaces for each group.
Data analyses
Overview.
Group differences were evaluated across all ages (7.5–18.5 years) for each ASD subgroup relative to TD controls (LFA vs TD, HFA vs TD, ASP vs TD). Because of existing evidence suggesting an altered neurodevelopmental time course in autism, a secondary set of analyses was performed in which children (7.5–12.5 years) and adolescents (12.75–18.5) were evaluated separately. Clusters identified as significantly different between groups were viewed on group-average and individual fiducial surfaces to discern the anatomical basis of the difference in sulcal depth. For clusters identified across all ages, correlational analyses were performed to determine whether sulcal depth measurements within areas that showed a group difference were related to age, full-scale IQ, and ADI-R domain scores.
Statistical analyses.
For each group comparison, a t-statistic value (assuming unequal variance) was computed at each node using the individual depth values within each group (see also Van Essen et al., 2006). Two statistical methods, a cluster-size analysis and an interhemispheric correlation analysis, were used to test for significant differences in sulcal depth across groups. Cluster-size analyses tested for unilateral group differences separately for the left and right hemispheres. The t-statistic maps were thresholded at p = 0.01 for each node, which was low enough to yield clusters of a biologically plausible size, yet not so low as to merge clearly distinct regions. To account for multiple comparisons, permutation analyses (2500 iterations) were then applied to determine a cluster size threshold for statistically significant group differences (p < 0.05) (Nichols and Holmes, 2002). Separate permutation analyses and cluster size cutoffs were determined for each comparison. Bonferroni corrections were applied for each subgroup analysis (LFA vs TD, HFA vs TD, ASP vs TD) to control for the comparison of multiple t-maps using the same group of control subjects (p values were multiplied by 3).
Interhemispheric correlation analyses tested for bilateral group differences in sulcal depth. Although a size threshold was still applied, these analyses could detect smaller clusters than the unilateral cluster size analyses provided that the pattern was bilateral. In brief, the product of t-statistic values for left and right hemispheres was computed at each node. The resulting t-correlation map was thresholded to a level equal to double the p = 0.01 threshold for the corresponding single hemisphere test, and permutation analyses (2500 iterations of shuffled t-maps) were performed to identify significant interhemispheric clusters. As with the cluster-size analyses, Bonferroni corrections were applied to the subgroup analyses to account for the comparison of multiple t-maps using the same group of control subjects (p value multiplied by 3).
Visualization and validation of sulcal depth differences.
The location of each significant cluster revealed by the statistical analyses was visualized on individual and group-average fiducial surfaces to assess the underlying biological abnormality. Group-average fiducial surfaces were also overlaid onto the MNI-152 template MRI volume to facilitate visualization of sulcal depth differences on MRI slices. In some instances, pronounced anatomical differences were apparent in a nearby gyral region but not in the immediate vicinity of the cluster identified by the sulcal depth analysis (see Results, Fig. 3). Probabilistic maps were generated to objectively visualize and validate these gyral shape abnormalities associated with nearby sulcal depth differences (for methodological detail, see supplemental material, available at www.jneurosci.org).
Figure 3.

A, Schematic of a fiducial surface contour and the overlying cerebral hull. The sulcal depth measurement, denoted by the dotted line, is the distance from a single node on the fiducial surface to the nearest node on the cerebral hull. B, C, Schematics of two different anatomical configurations that could give rise to differences in sulcal depth measurements between groups. The gray lines represent the control scenario. B, Deeper sulcus: the relative position of the gyri and sulcus are the same, but the red fiducial surface has a deeper fundus than the control. C, More prominent gyrus: the difference in height of one gyrus causes the cerebral hulls to diverge. The green fiducial surface has a deeper sulcal depth measurement than the control, but the region associated with the depth difference is in the neighboring gyrus, not in the fundus of the sulcus. No depth difference appears on the gyrus itself in C because sulcal depth is always zero at the crown of a gyrus.
Correlational analyses.
For each ASD subgroup comparison with TD controls across all ages, correlation analyses were performed using Fisher's r-to-z transformation to determine the relationship between mean sulcal depth within each significant cluster with age, full-scale IQ, and ADI-R domain scores (social, communication, and restricted, repetitive and stereotyped behavior). Correlations of sulcal depth with age and full-scale IQ were examined separately for the TD group and the ASD subgroups. Correlations between sulcal depth and ADI-R domain scores were limited to ASD participants. No corrections were made for multiple comparisons because these were follow-up analyses on regions previously determined to be significant.
Data access.
These data are available for additional visualization and analysis via the SumsDB database http://sumsdb.wustl.edu/sums/directory.do?id=6612230.
Results
Group differences: cluster size and interhemispheric analyses
Across all ages (7.5–18.5 years)
Figure 2 shows t-statistic maps (t-maps) for the cluster size analyses and interhemispheric correlation analyses displayed on inflated and very inflated surfaces of the PALS-B12 atlas. Numerous clusters exceeded the t-map thresholds, but only those identified with arrows were statistically significant after correction for multiple comparisons (see Materials and Methods). Table 2 provides additional information about the location and characteristics of the significant regions.
Table 2.
Significant clusters for group comparisons made across all ages and in children only
| Cluster location | t-map threshold | Cluster size threshold (mm2) | Cluster size in mm2 (p value) | Stereotaxic coordinates |
Depth difference (mm) | % Difference relative to TD average sulcal depth | |||
|---|---|---|---|---|---|---|---|---|---|
| x | y | z | |||||||
| All ages | |||||||||
| LFA (n = 17) | L frontal operculum | −2.69 | 316 | 793 (0.01) | −37 | 4 | 9 | 2.6 | 13 |
| HFA (n = 14) | Bilateral parietal operculum | 5.40 | 162 | 420 (0.005) | ±43 | −12 | 16 | 1.7 | 8 |
| ASP (n = 15) | Bilateral intraparietal sulcus | 5.40 | 158 | 278 (0.017) | ±28 | −67 | 37 | 4.5 | 41 |
| Children (7.5–12.5 years) | |||||||||
| LFA (n = 8) | L operculum | −2.78 | 407 | 1568 (<0.0001) | −38 | −3 | 5 | 3.5 | |
| HFA (n = 8) | Bilateral parietal operculum | 5.56 | 205 | 402 (0.006) | ±44 | −14 | 18 | 2.1 | 9 |
| ASP (n = 8) | Bilateral intraparietal sulcus | 5.56 | 195 | 496 (0.0012) | ±27 | −69 | 37 | 5.6 | 52 |
No significant clusters were identified in the analyses restricted to adolescents (12.75–18.5 years). Bilateral clusters were identified by interhemispheric correlation analyses, and unilateral clusters were identified by cluster size analyses. Different t-values (corresponding to p < 0.01) were used to generate t-maps for each comparison. Separate permutation analyses to determine significant cluster size thresholds were carried out for each comparison. Actual cluster sizes all surpassed the size thresholds and corresponding p values were corrected for multiple comparisons to the same TD control group. For each cluster, the depth difference reflects how much deeper the ASD group was relative to the TD controls. The depth difference is also depicted as the percentage difference relative to TD controls average depth. Cluster size refers to surface area of the cluster on the PALS average fiducial surface compensated for the average distortion relative to individual fiducial surfaces. L, Left.
The top two rows of Figure 2 show results for the LFA group. The unilateral cluster-size analysis (left columns) revealed that sulcal depth was significantly deeper (p = 0.01) in the left frontal operculum and anterior insula of LFA compared with the TD group (blue–green patch next to arrows in the left hemisphere). The average depth difference in this region was 2.6 mm (Table 2, top row). In the right hemisphere, the corresponding frontal opercular region showed the opposite trend: sulcal depth was on average slightly (albeit not significantly) deeper for TD than for LFA, and the interhemispheric t-correlation map was negative (i.e., anti-correlated) in this region (blue–green patches in top right panels). This indicates that the sulcal depth abnormality in the frontal operculum of the LFA group is genuinely restricted to the left hemisphere, rather than being bilateral.
For the HFA group (Fig. 2, middle rows), the cluster-size analysis revealed that sulcal depth was significantly deeper (p = 0.01) in the left parietal operculum for HFA compared with the TD group. In the corresponding location in the right hemisphere, the interhemispheric correlation analysis revealed that the HFA sulcal depth abnormality is symmetric across the two hemispheres (p = 0.005). In the left hemisphere, the HFA and LFA sulcal depth abnormalities are separated by 12 mm (center-to-center).
For the ASP group (Fig. 2, bottom rows), the cluster-size analysis did not reveal any significant abnormalities, but the interhemispheric correlation analysis revealed a significant bilateral cluster in the intraparietal sulcus (p = 0.02) in which the ASP group was on average 4.5 mm deeper than the TD group (Table 2). Although this cluster passed statistical significance, it should be interpreted with caution because of heterogeneity in the TD control group (see supplemental material, available at www.jneurosci.org).
Children (7.5–12.5 years)
Analyses restricted to the younger age range revealed a similar but more pronounced pattern of significant clusters for each ASD subgroup comparison. For the LFA and ASP subgroups, the surface area of the significant clusters was larger and the depth differences were greater, although the sample sizes were smaller (Table 2). More specifically, the LFA group cluster in the frontal operculum and anterior insula was more highly significant (p < 0.0001) in the younger group, about twice the size of the cluster identified in the comparison made across all ages (15.7 vs 7.9 cm2 for LFA children vs all ages), and the depth difference between groups was greater (3.5 vs 2.6 mm for LFA children vs all ages). For the HFA group, similar to the comparison made across all ages, interhemispheric correlation analyses revealed a significant bilateral cluster in the parietal operculum (p = 0.006). This cluster was similar in size to the clusters identified in the comparison across all ages (4.0 vs 4.2 cm2 for HFA children vs all ages), but the depth difference between HFA and TD controls was slightly greater in the younger comparison (2.1 vs 1.7 mm for HFA children vs all ages). The center-to-center separation of the HFA vs LFA depth abnormalities in the left hemisphere was greater (18 mm) than with the all-age analysis. For the ASP group, the cluster size analyses identified a significant cluster in the left intraparietal sulcus (p = 0.04), and the interhemispheric correlation analysis revealed a spatially symmetric cluster in the right hemisphere (p = 0.0012) that was larger (5.0 vs 2.8 cm2 for ASP children vs all ages) and showed a greater depth difference (5.6 vs 4.5 mm for ASP children vs all ages).
Adolescents (12.75–18.5 years)
There were no significant differences between any of the ASD subgroups relative to TD controls. However, the statistical power to detect significant differences was considerably lower in the adolescent age group because of smaller sample sizes, particularly in the TD controls (9 adolescent TD controls vs 20 children TD controls).
The statistical tests used here are relatively conservative. Our results provide hints of several additional candidate folding abnormalities that may prove to be significant using larger sample sizes or alternative statistical methods (see supplemental material, available at www.jneurosci.org).
Localization of folding abnormalities
Although sulcal depth t-maps were critical for identifying significant differences between groups, the anatomical underpinnings of those differences are not necessarily discernible from the t-maps alone. A group difference revealed by the sulcal depth analysis may, in principle, arise from a number of anatomical configurations. Two conceptually distinct possibilities (deeper sulcus vs more prominent gyrus) illustrated schematically in Figure 3 represent situations encountered in the present study.
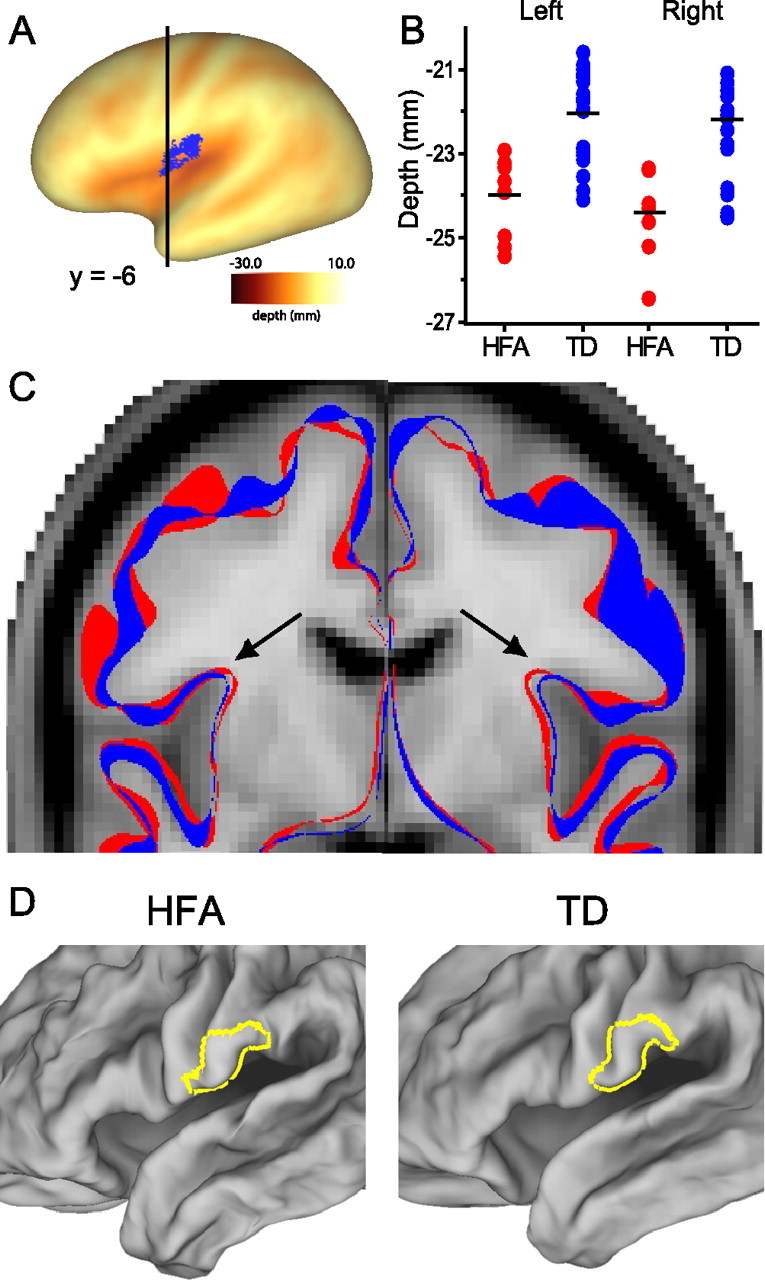
Figure 4 shows results for the cluster identified in the LFA children group comparison. Data from the younger age groups is used for visualization purposes because the sulcal depth differences were generally greater in magnitude and of higher statistical significance. Figure 4A shows the sulcal depth abnormality from the young LFA vs TD cluster-size analysis (blue) displayed on a very inflated left hemisphere. Plots of average sulcal depth within the significant cluster for each individual subject show that there is very little overlap between the LFA and TD groups (Fig. 4B). Figure 4C shows coronal slices through the average fiducial surface for the LFA (red contour) and TD (blue contour) groups, displayed on the MNI-152 MRI template. In the region of significant depth differences in the operculum (black arrow, Fig. 4C), the slight depth difference (<1 mm) is much smaller than the observed 3.5 mm sulcal depth difference between groups (see Table 2). The nearby gyral cortex is more prominent in the LFA compared with TD average fiducial surface (yellow arrow, Fig. 4C), but only in the left hemisphere (analogous to the schematic depicted in Fig. 3C). A probabilistic map of the gyral region that contributed to the sulcal depth measurements in the significant cluster revealed a region centered on the pars opercularis of the inferior frontal gyrus and extending into ventral portions of the neighboring precentral and postcentral gyri (Fig. 4D), high and low thresholds in green and yellow, respectively. Within this region, a significant difference in the z-direction of average coordinate values was detected (p = 0.048, corrected for multiple comparisons of x, y, and z directions), with the LFA group extending more ventrally than the TD group. Comparison with cytoarchitectonic cortical areas reveals that the LFA folding abnormality is centered on ventral BA 44 and extends into ventral BA 4 and BA 6, as well as BA 43 (Fig. 4E) (Brodmann, 1909; Amunts et al., 1999; Van Essen, 2005).
Figure 4.

Visualization of the folding abnormality in the LFA group in children. A, The LFA cluster in the frontal operculum identified by the cluster size analysis is shown on the PALS-B12 very inflated surface. The black line denotes the location of the coronal slice depicted in C. B, Plots of individual mean depths within the significant cluster for LFA and TD groups. C, Outlines of group-averaged fiducial surfaces (LFA in red; TD in blue) are overlaid onto the MNI-152 MRI template. The black arrow indicates the location of the cluster in the frontal operculum. Note that the red and blue surfaces overlap almost completely at this location. In contrast, the yellow arrow depicts the gyral region in the inferior frontal gyrus that is different between groups. The LFA group extends more ventrally than the TD group. This difference occurs only in the left hemisphere. D, The green outlines on the group-averaged LFA and TD fiducial surfaces depict the gyral region most strongly associated with the sulcal depth abnormality. The yellow outlines depict a more liberal estimation of the location of the gyral shape abnormality for the LFA group (pars opercularis of the inferior frontal gyrus and ventral portions of the precentral and postcentral gyri). E, The affected area for the LFA group is overlaid onto the PALS-B12 inflated surface with Brodmann areas identified.
For the bilateral HFA abnormality identified in the younger children (Fig. 5A), plots of individual depth measurements for the left and right clusters (Fig. 5B) show an average depth difference of ∼2 mm in each hemisphere. Figure 5C (black arrows) shows the depth difference within the operculum on the MNI-152 MRI template. The HFA (red) fiducial surface is deeper than the TD (blue) bilaterally by ∼1 mm. Because this depth difference is only one-half of the 2.1 mm depth difference between groups (see Table 2), the remaining difference may reflect a gyral abnormality. Figure 5D shows the probabilistic map of the affected gyral region, centered on the ventral portion of the postcentral gyrus, on averaged HFA and TD left hemisphere fiducial surfaces. A subtle shape difference is discernible in the ventral postcentral gyrus, but there were no significant differences between the average x-, y-, and z-coordinate values. Further analyses will be required to ascertain the relative contributions of gyral versus sulcal folding abnormalities to the significant HFA sulcal depth difference.
Figure 5.
Visualization of the folding abnormality in the HFA group in children. A, The HFA cluster in the parietal operculum identified by the cluster size analysis is shown on the left hemisphere PALS-B12 very inflated surface. The black line denotes the location of the coronal slice depicted in C. B, Plots of individual mean depths within the left and right significant clusters for HFA and TD groups. C, Outlines of group-averaged fiducial surfaces (HFA in red; TD in blue) are overlaid onto the MNI-152 MRI template. The black arrow indicates the location of the cluster in the parietal operculum. The HFA surface is deeper than the TD surface by ∼1 mm. D, The yellow outline overlaid onto group-averaged HFA and TD fiducial surfaces depicts the location of the putative gyral shape abnormality in ventral postcentral gyrus. Note that although the right hemisphere is not depicted in A or D, the abnormality is bilateral, and the corresponding region in the right hemisphere is also affected.
Figure 6 shows a similar analysis for the folding abnormality identified in the intraparietal sulcus (IPS) of the ASP group. Posterior views of the average fiducial surfaces show the ASP (Fig. 6A) deeper than TD (Fig. 6B) within the significant cluster (black contour). The average depth difference in this region is close to 6 mm (Table 2) as is evident in Figure 6C, which shows coronal slices through the average fiducial surfaces for ASP (red) and TD controls (blue) overlaid on a coronal slice of the MRI template. The IPS in the ASP group is in approximately the same location but is markedly deeper than the TD controls (corresponding to the schematic illustrated in Fig. 3B). Comparison to previously defined cortical areas (Fig. 5D,E) indicates that the IPS folding abnormality overlaps extensively with visuotopic area V7 (Press et al., 2001; Van Essen, 2005) and occupies a small portion of BA 19 (Brodmann, 1909; Van Essen, 2005).
Figure 6.
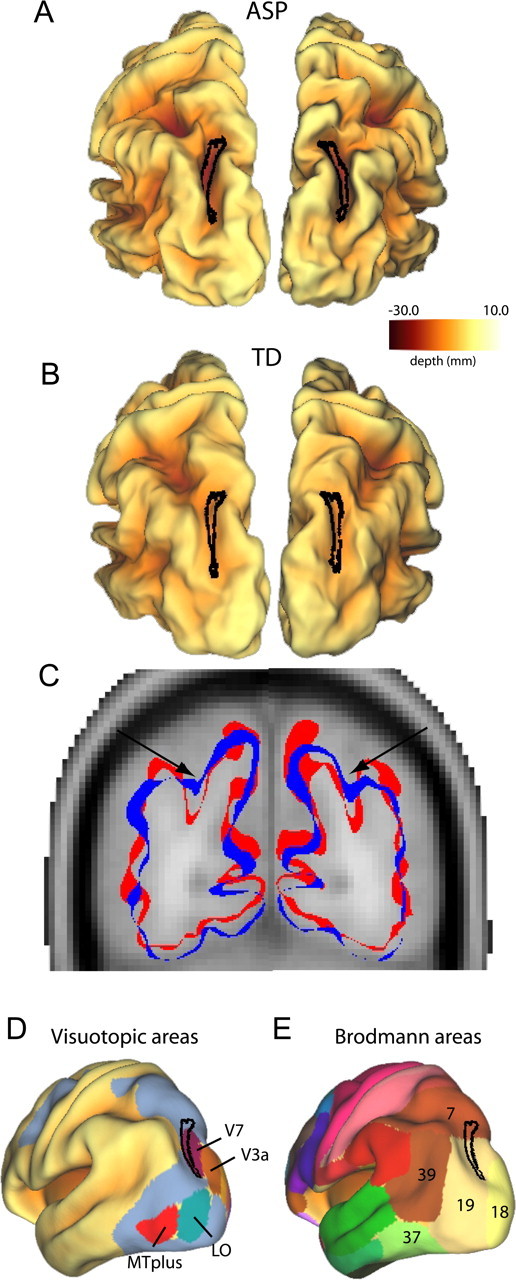
Visualization of a folding abnormality in the intraparietal sulcus of children in ASP group. A, B, Bilateral clusters identified from the intrahemispheric correlation analyses are projected on to left and right group-averaged fiducial surfaces for the ASP group (A) and TD control group (B). The intraparietal sulcus is deeper in the ASP group than the TD control group. C, Outlines of group-averaged fiducial surfaces are overlaid on an MRI template. Arrows depict the intraparietal sulcus. The ASP fiducial surface (red) is significantly deeper in the intraparietal sulcus than the TD fiducial surface (blue). D, E, Left hemisphere clusters are projected onto the PALS-B12 inflated surfaces with visuotopic areas (D) and Brodmann areas (E) identified (Van Essen, 2005).
Correlational analyses
Age and full-scale IQ
The folding abnormality identified in the left intraparietal sulcus of the ASP group across all ages showed significant correlations between mean depth and age (Fig. 7A, filled circles) (r = −0.72, p = 0.002) but not for the corresponding region in the TD group (open circles, r = 0.03, p = 0.86). Figure 7B shows that mean depth in the left IPS was also correlated with IQ in both the ASP (filled circles, r = −0.55, p = 0.03) and TD (open circles, r = −0.47, p = 0.04) groups. Mean depth in the right IPS was not correlated with age or IQ in either ASP or TD groups. Nor were there any significant correlations between the LFA or the HFA groups and age or IQ.
Figure 7.
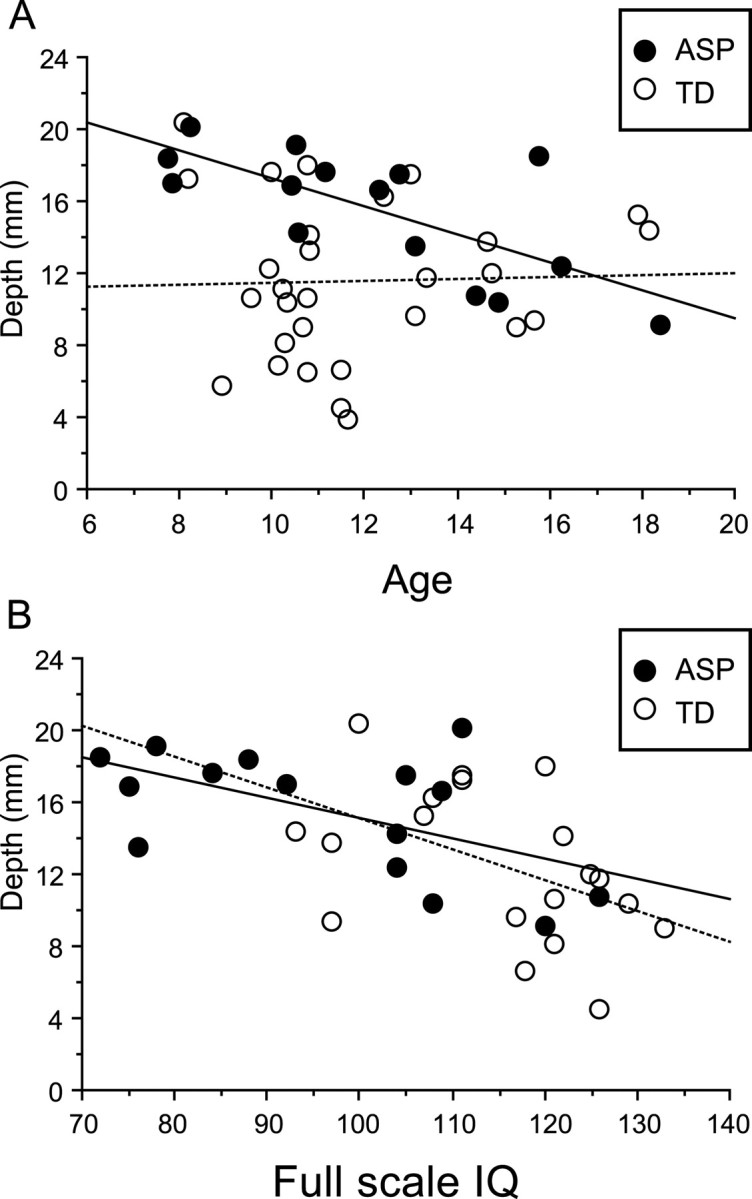
Correlations between sulcal depth and age (A) and full-scale IQ (B) for the left intraparietal sulcus cluster identified in the ASP group across all ages. Depth is correlated with age in the ASP group but not the TD group. Depth is correlated with full-scale IQ in both ASP and TD groups.
ADI-R domain scores
Correlation coefficients for each comparison are depicted in Table 3. For the ASP group, mean depth in the left IPS cluster was correlated with the restricted, repetitive, and stereotyped behaviors score (p = 0.002), and mean depth in the right IPS cluster was correlated with the social domain score (p = 0.01). There was a marginally significant correlation between mean depth in the right IPS with the restricted, repetitive, and stereotyped behaviors score (p = 0.05). There were no correlations between any of the ADI-R domain scores with mean depth in clusters identified in the LFA and HFA group comparisons.
Table 3.
Correlation coefficients for ADI-R scores and mean depth in each significant cluster for each ASD group in the comparisons made across all ages
| ADI-R |
|||
|---|---|---|---|
| Social | Communication | Repetitive behaviors | |
| LFA | |||
| Left operculum | 0.43 | 0.30 | 0.01 |
| HFA | |||
| Left operculum | −0.10 | 0.07 | −0.22 |
| Right operculum | −0.22 | −0.10 | 0.01 |
| ASP | |||
| Left IPS | −0.10 | 0.14 | 0.73** |
| Right IPS | 0.63* | −0.15 | 0.52 |
*p < 0.05; **p < 0.01.>
Discussion
This is the first study to use surface-based morphometry to test for cortical folding abnormalities in children and adolescents with a range of autism spectrum disorders. Across all ages, we observed abnormalities in each ASD subgroup. LFA individuals had a prominent shape abnormality centered on the pars opercularis of the left inferior frontal gyrus that accounts for a sulcal depth difference in the anterior insula and frontal operculum. The HFA group had bilateral sulcal depth differences in the parietal operculum that may in part reflect shape abnormalities in the ventral postcentral gyrus. Individuals with ASP had deeper intraparietal sulci bilaterally, and abnormal depth was correlated with age, IQ, and ADI-R social and repetitive behavior domain scores. When analyses were performed in children and adolescents separately, the LFA and ASP differences were more pronounced in the younger age group.
Comparison with previous studies
Widespread neuroanatomical abnormalities of the cerebral cortex in autism have been reported in previous neuroimaging studies using different analytic methods. Gray matter abnormalities have been reported in frontal and temporal regions, as well as in the fusiform gyri in HFA and ASP individuals (Abell et al., 1999; Boddaert et al., 2004; Salmond et al., 2005). Levitt et al. (2003) analyzed sulcal patterns in HFA children by drawing the trajectories of 11 major sulci on 3-D models of the external cortical surface. They reported significantly abnormal trajectories for seven sulci in the left hemisphere and six sulci in the right, in a largely symmetric pattern. The bilateral sulcal trajectory abnormalities they reported for the Sylvian fissure and the superior temporal sulcus may be related to the bilateral folding abnormality we found in comparably aged HFA children, which included depth differences in the parietal operculum and shape differences in the ventral postcentral gyrus.
Mechanistic perspective: folding abnormalities may reflect abnormal connectivity
Cortical folding patterns may reflect early patterns of connectivity in the developing brain. A leading theory of how the cortex folds during development invokes mechanical tension along long-distance axons (Van Essen, 1997). By this theory, strongly connected cortical regions are pulled together, with gyri forming in between; weakly connected regions are allowed to drift apart, with sulci forming in between; and aggregate axonal length approaches a global minimum. Although still unproven, this hypothesis is supported by recent observations (Hilgetag and Barbas, 2005, 2006).
A pathological perturbation during cortical development might alter the size of particular areas and/or the pattern of connectivity between areas. This in turn could lead to systematic abnormalities in cortical folding patterns, as suggested for Williams Syndrome (Van Essen et al., 2006). In autism, the specific perturbations that underlie folding abnormalities are unknown. It is possible that the folding abnormalities identified in the intraparietal sulcus in the ASP group and the inferior frontal, precentral, and postcentral gyri in the LFA and HFA groups reflect alterations in the size of cortical areas and/or abnormal connectivity. Courchesne and Pierce (2005) suggest that neuroinflammation and abnormalities in cortical microcircuitry in the frontal lobes during early development may lead to alterations in both local and long distance frontocortical projections. Our findings are consistent with abnormalities in connectivity of restricted portions of frontal and parietal cortex. It is now feasible to test for correlations between abnormalities in functional organization and cortical folding using diffusion tractography (Johansen-Berg and Behrens, 2006), functional connectivity analysis (Fox et al., 2005; Vincent et al., 2007), and other noninvasive neuroimaging methods.
Significance of folding abnormalities in different subtypes and age groups of ASD
Neuroanatomical differences between the different diagnostic subgroups of ASD have rarely been studied systematically. Our finding of different cortical shape abnormalities in LFA, HFA, and ASP suggests that ASD subgroups are not simply a continuum in severity of a single neurobiological abnormality. The functional relevance of differences between the subgroups is not yet clear however, and additional studies with larger sample sizes and careful distinction between various diagnostic groups are needed to explore the different patterns of cortical shape abnormalities between the major subtypes of ASD. It will also be important to compare children with low-functioning autism to nonautistic children matched for IQ to determine whether these cortical shape abnormalities are specific to autism. It will be equally important to examine cortical shape characteristics in a sample that includes females with autism to explore potential gender-related differences.
In our analyses of age-related differences, we found that cortical shape differences were more pronounced in the younger children and were not discernible in older adolescents. This is consistent with previous reports of increases in cerebral white matter in young children with autism, but not in adolescents (Courchesne et al., 2001; Herbert et al., 2003; Hazlett et al., 2005a,b). We also found a positive relationship between sulcal depth and age in the intraparietal sulcus in individuals with ASP that was not evident in TD controls, suggesting age-related differences between groups. Because the smaller sample sizes in our adolescent age group provided less power to detect group differences, the apparent age dependence in our analysis is suggestive but not compelling in its own right. Furthermore, our study was cross-sectional, involving comparisons between different groups of children and adolescents. A longitudinal study of cortical development would be more sensitive in determining whether and how cortical shape characteristics change over time in autism.
Functional significance of regional folding abnormalities
The prominent shape abnormality identified in individuals with LFA is centered on the pars opercularis of the inferior frontal gyrus. It includes part of Broca's area (BA 44 and 45), a region that has long been associated with language and speech production (see Amunts et al., 1999; Amunts et al., 2004). Current interest in this region also stems from its role in the putative human mirror neuron system (Iacoboni and Dapretto, 2006). In nonhuman primates, mirror neurons fire during execution of an action as well as during observation of the same action performed by another individual (Gallese et al., 1996). In humans, putative mirror neuron regions are hypothesized to be involved in various higher-order functions involved in social cognition, including imitation, empathy, and theory of mind (Williams et al., 2001; Carr et al., 2003; Gallese et al., 2004), and there is evidence that the mirror neuron system is dysfunctional in individuals with autism spectrum disorders (Oberman et al., 2005; Dapretto et al., 2006; Hadjikhani et al., 2006; Williams et al., 2006). Dapretto et al. (2006) reported reduced activation bilaterally in the pars opercularis of the inferior frontal gyrus in children with autism spectrum disorders while testing for imitation of emotional expressions. Hadjikhani et al. (2006) reported cortical thinning in a number of frontal, parietal, and temporal regions in adults with autism spectrum disorders, including the pars opercularis of the inferior frontal gyrus and other mirror-neuron regions.
Hadjikhani et al. (2006) also reported cortical thinning in ventral portions of the precentral and postcentral gyri, in the vicinity of the candidate shape abnormality in HFA individuals in the present study. Although the functional significance of this abnormality is unknown, it may be related to the generation of facial expressions. In individuals with autism, the core deficit in social communication often includes flat affect and lack of appropriate use of facial expressions (Yirmiya et al., 1989; American Psychiatric Association, 1994). The parietal operculum, or secondary somatosensory cortex (SII), is implicated in numerous complex functions related to multimodal sensory and motor integration (Caselli, 1993; Bremmer et al., 2001; Disbrow et al., 2003). The shape abnormality in this region may be related to the unusual responses to sensory stimuli that are commonly observed in individuals with autism (Rogers and Ozonoff, 2005; Iarocci and McDonald, 2006).
The intraparietal sulcus, which appears to be abnormal bilaterally in individuals with ASP, is implicated in many aspects of visual attention and visuomotor control (Culham and Kanwisher, 2001; Astafiev et al., 2003; Schluppeck et al., 2005; Silver et al., 2005). Deficits in visual attention occur in young children with autism (Landry and Bryson, 2004) and may be among the first abnormalities detectable in infants who are subsequently diagnosed with autism (Zwaigenbaum et al., 2005). Abnormal connectivity in parietal cortex is consistent with the weak central coherence theory of autism, which proposes that individuals with autism are biased toward local or detail-focused perceptual processing that interferes with perception of global patterns (Frith and Happe, 1994). In an fMRI study of adults with autism, activation was abnormally high in the left intraparietal sulcus during suppression of unattended stimuli (Belmonte and Yurgelun-Todd, 2003), consistent with abnormal information flow that might contribute to weak central coherence.
The intraparietal sulcus abnormalities observed in the present study were not asymmetric as might be expected based on clinical evidence suggesting hemispheric asymmetry for local (left) versus global (right) processing (Robertson et al., 1988). We did, however, observe differences in how average sulcal depth for the left and right intraparietal sulcus regions correlate with ADI-R scores. In individuals with ASP, abnormal depth in the left intraparietal sulcus was related to an increase in the restricted, repetitive, and stereotyped patterns of behavior. In contrast, abnormal depth in the right intraparietal sulcus was related to impairments on the reciprocal social interaction score. Additional studies of connectivity within the intraparietal sulcus and surrounding parietal cortex are warranted, particularly in the context of recent studies that suggest that the temporo-parietal junction is critical for theory of mind (Saxe and Kanwisher, 2003).
Recent functional neuroimaging studies have identified abnormalities in broad networks of regions that are “active” during rest (Kennedy et al., 2006) as well as abnormalities in specific brain regions associated with particular deficits in autism, such as the amygdala and fusiform gyrus in eye-gaze and face/emotion processing (Dalton et al., 2005). Although the location of the cortical shape abnormalities identified in this study appear to be spatially distinct from these areas, future studies using integration of functional and diffusion tensor imaging with surface-based morphometry will be useful in discerning the precise abnormalities in the patterns of connectivity and functional consequences in autism.
Conclusion
We have identified different patterns of cortical folding abnormalities in low- and high-functioning autism and Asperger's syndrome, particularly in children. Cortical shape abnormalities in restricted regions of parietal and frontal cortex may reflect abnormal patterns of connectivity that can be further explored using a combination of neuroimaging techniques and surface-based analytic approaches.
Footnotes
This work was supported by National Institutes of Health Grants T32 MH073124, R01 MH60974, and R01 MH41479 and by the University of California, Davis Medical Investigation of Neurodevelopmental Disorders Institute. We thank E. Reid and J. Harwell for excellence in data analysis and software development, respectively. We especially appreciate the children and their families for their participation in the study.
References
- Abell F, Krams M, Ashburner J, Passingham R, Friston K, Frackowiak R, Happe F, Frith C, Frith U. The neuroanatomy of autism: a voxel-based whole brain analysis of structural scans. NeuroReport. 1999;10:1647–1651. doi: 10.1097/00001756-199906030-00005. [DOI] [PubMed] [Google Scholar]
- Amunts K, Schleicher A, Burgel U, Mohlberg H, Uylings HB, Zilles K. Broca's region revisited: cytoarchitecture and intersubject variability. J Comp Neurol. 1999;412:319–341. doi: 10.1002/(sici)1096-9861(19990920)412:2<319::aid-cne10>3.0.co;2-7. [DOI] [PubMed] [Google Scholar]
- Amunts K, Weiss PH, Mohlberg H, Pieperhoff P, Eickhoff S, Gurd JM, Marshall JC, Shah NJ, Fink GR, Zilles K. Analysis of neural mechanisms underlying verbal fluency in cytoarchitectonically defined stereotaxic space—the roles of Brodmann areas 44 and 45. NeuroImage. 2004;22:42–56. doi: 10.1016/j.neuroimage.2003.12.031. [DOI] [PubMed] [Google Scholar]
- American Psychiatric Association, editor. Ed 4. Washington, DC: American Psychiatric Association; 1994. Diagnostic and statistical manual of mental disorders. [Google Scholar]
- Astafiev SV, Shulman GL, Stanley CM, Snyder AZ, Van Essen DC, Corbetta M. Functional organization of human intraparietal and frontal cortex for attending, looking, and pointing. J Neurosci. 2003;23:4689–4699. doi: 10.1523/JNEUROSCI.23-11-04689.2003. [DOI] [PMC free article] [PubMed] [Google Scholar]
- Aylward EH, Minshew NJ, Goldstein G, Honeycutt NA, Augustine AM, Yates KO, Barta PE, Pearlson GD. MRI volumes of amygdala and hippocampus in non-mentally retarded autistic adolescents and adults. Neurology. 1999;53:2145–2150. doi: 10.1212/wnl.53.9.2145. [DOI] [PubMed] [Google Scholar]
- Barnea-Goraly N, Kwon H, Menon V, Eliez S, Lotspeich L, Reiss AL. White matter structure in autism: preliminary evidence from diffusion tensor imaging. Biol Psychiatry. 2004;55:323–326. doi: 10.1016/j.biopsych.2003.10.022. [DOI] [PubMed] [Google Scholar]
- Belmonte MK, Yurgelun-Todd DA. Functional anatomy of impaired selective attention and compensatory processing in autism. Brain Res Cogn Brain Res. 2003;17:651–664. doi: 10.1016/s0926-6410(03)00189-7. [DOI] [PubMed] [Google Scholar]
- Boddaert N, Chabane N, Gervais H, Good CD, Bourgeois M, Plumet MH, Barthelemy C, Mouren MC, Artiges E, Samson Y, Brunelle F, Frackowiak RS, Zilbovicius M. Superior temporal sulcus anatomical abnormalities in childhood autism: a voxel-based morphometry MRI study. NeuroImage. 2004;23:364–369. doi: 10.1016/j.neuroimage.2004.06.016. [DOI] [PubMed] [Google Scholar]
- Bremmer F, Schlack A, Shah NJ, Zafiris O, Kubischik M, Hoffmann K, Zilles K, Fink GR. Polymodal motion processing in posterior parietal and premotor cortex: a human fMRI study strongly implies equivalencies between humans and monkeys. Neuron. 2001;29:287–296. doi: 10.1016/s0896-6273(01)00198-2. [DOI] [PubMed] [Google Scholar]
- Brodmann K. Leipzig, Germany: Barth, J.A.; 1909. Vergleichende Lokalisationslehre der Grosshirnrinde in ihren Prinzipien dargestellt aurf Grund des Zellenbaues. [Google Scholar]
- Carper RA, Courchesne E. Localized enlargement of the frontal cortex in early autism. Biol Psychiatry. 2005;57:126–133. doi: 10.1016/j.biopsych.2004.11.005. [DOI] [PubMed] [Google Scholar]
- Carper RA, Moses P, Tigue ZD, Courchesne E. Cerebral lobes in autism: early hyperplasia and abnormal age effects. NeuroImage. 2002;16:1038–1051. doi: 10.1006/nimg.2002.1099. [DOI] [PubMed] [Google Scholar]
- Carr L, Iacoboni M, Dubeau MC, Mazziotta JC, Lenzi GL. Neural mechanisms of empathy in humans: a relay from neural systems for imitation to limbic areas. Proc Natl Acad Sci USA. 2003;100:5497–5502. doi: 10.1073/pnas.0935845100. [DOI] [PMC free article] [PubMed] [Google Scholar]
- Caselli RJ. Ventrolateral and dorsomedial somatosensory association cortex damage produces distinct somesthetic syndromes in humans. Neurology. 1993;43:762–771. doi: 10.1212/wnl.43.4.762. [DOI] [PubMed] [Google Scholar]
- Courchesne E, Pierce K. Why the frontal cortex in autism might be talking only to itself: local over-connectivity but long-distance disconnection. Curr Opin Neurobiol. 2005;15:225–230. doi: 10.1016/j.conb.2005.03.001. [DOI] [PubMed] [Google Scholar]
- Courchesne E, Karns CM, Davis HR, Ziccardi R, Carper RA, Tigue ZD, Chisum HJ, Moses P, Pierce K, Lord C, Lincoln AJ, Pizzo S, Schreibman L, Haas RH, Akshoomoff NA, Courchesne RY. Unusual brain growth patterns in early life in patients with autistic disorder: an MRI study. Neurology. 2001;57:245–254. doi: 10.1212/wnl.57.2.245. [DOI] [PubMed] [Google Scholar]
- Culham JC, Kanwisher NG. Neuroimaging of cognitive functions in human parietal cortex. Curr Opin Neurobiol. 2001;11:157–163. doi: 10.1016/s0959-4388(00)00191-4. [DOI] [PubMed] [Google Scholar]
- Dalton KM, Nacewicz BM, Johnstone T, Schaefer HS, Gernsbacher MA, Goldsmith HH, Alexander AL, Davidson RJ. Gaze fixation and the neural circuitry of face processing in autism. Nat Neurosci. 2005;8:519–526. doi: 10.1038/nn1421. [DOI] [PMC free article] [PubMed] [Google Scholar]
- Dapretto M, Davies MS, Pfeifer JH, Scott AA, Sigman M, Bookheimer SY, Iacoboni M. Understanding emotions in others: mirror neuron dysfunction in children with autism spectrum disorders. Nat Neurosci. 2006;9:28–30. doi: 10.1038/nn1611. [DOI] [PMC free article] [PubMed] [Google Scholar]
- DiLavore PC, Lord C, Rutter M. The pre-linguistic autism diagnostic observation schedule. J Autism Dev Disord. 1995;25:355–379. doi: 10.1007/BF02179373. [DOI] [PubMed] [Google Scholar]
- Disbrow E, Litinas E, Recanzone GH, Padberg J, Krubitzer L. Cortical connections of the second somatosensory area and the parietal ventral area in macaque monkeys. J Comp Neurol. 2003;462:382–399. doi: 10.1002/cne.10731. [DOI] [PubMed] [Google Scholar]
- Fox MD, Snyder AZ, Vincent JL, Corbetta M, Van Essen DC, Raichle ME. The human brain is intrinsically organized into dynamic, anticorrelated functional networks. Proc Natl Acad Sci USA. 2005;102:9673–9678. doi: 10.1073/pnas.0504136102. [DOI] [PMC free article] [PubMed] [Google Scholar]
- Frith U, Happe F. Autism: beyond “theory of mind”. Cognition. 1994;50:115–132. doi: 10.1016/0010-0277(94)90024-8. [DOI] [PubMed] [Google Scholar]
- Gallese V, Fadiga L, Fogassi L, Rizzolatti G. Action recognition in the premotor cortex. Brain. 1996;119:593–609. doi: 10.1093/brain/119.2.593. [DOI] [PubMed] [Google Scholar]
- Gallese V, Keysers C, Rizzolatti G. A unifying view of the basis of social cognition. Trends Cogn Sci. 2004;8:396–403. doi: 10.1016/j.tics.2004.07.002. [DOI] [PubMed] [Google Scholar]
- Hadjikhani N, Joseph RM, Snyder J, Tager-Flusberg H. Anatomical differences in the miror neuron system and social cognition network in autism. Cereb Cortex. 2006;16:1276–1282. doi: 10.1093/cercor/bhj069. [DOI] [PubMed] [Google Scholar]
- Hardan AY, Jou RJ, Keshavan MS, Varma R, Minshew NJ. Increased frontal cortical folding in autism: a preliminary MRI study. Psychiatry Res. 2004;131:263–268. doi: 10.1016/j.pscychresns.2004.06.001. [DOI] [PubMed] [Google Scholar]
- Hazlett HC, Poe MD, Gerig G, Smith RG, Piven J. Cortical gray and white brain tissue volume in adolescents and adults with autism. Biol Psychiatry. 2005a;59:1–6. doi: 10.1016/j.biopsych.2005.06.015. [DOI] [PubMed] [Google Scholar]
- Hazlett HC, Poe M, Gerig G, Smith RG, Provenzale J, Ross A, Gilmore J, Piven J. Magnetic resonance imaging and head circumference study of brain size in autism: birth through age 2 years. Arch Gen Psychiatry. 2005b;62:1366–1376. doi: 10.1001/archpsyc.62.12.1366. [DOI] [PubMed] [Google Scholar]
- Hendry J, Devito T, Gelman N, Densmore M, Rajakumar N, Pavlosky W, Williamson PC, Thompson PM, Drost DJ, Nicolson R. White matter abnormalities in autism detected through transverse relaxation time imaging. NeuroImage. 2005 doi: 10.1016/j.neuroimage.2005.08.039. [DOI] [PubMed] [Google Scholar]
- Herbert MR, Ziegler DA, Deutsch CK, O'Brien LM, Lange N, Bakardjiev A, Hodgson J, Adrien KT, Steele S, Makris N, Kennedy D, Harris GJ, Caviness VS., Jr Dissociations of cerebral cortex, subcortical and cerebral white matter volumes in autistic boys. Brain. 2003;126:1182–1192. doi: 10.1093/brain/awg110. [DOI] [PubMed] [Google Scholar]
- Herbert MR, Ziegler DA, Makris N, Filipek PA, Kemper TL, Normandin JJ, Sanders HA, Kennedy DN, Caviness VS., Jr Localization of white matter volume increase in autism and developmental language disorder. Ann Neurol. 2004;55:530–540. doi: 10.1002/ana.20032. [DOI] [PubMed] [Google Scholar]
- Hilgetag CC, Barbas H. Developmental mechanics of the primate cerebral cortex. Anat Embryol (Berl) 2005;210:411–417. doi: 10.1007/s00429-005-0041-5. [DOI] [PubMed] [Google Scholar]
- Hilgetag CC, Barbas H. Role of mechanical factors in the morphology of the primate cerebral cortex. PLoS Comput Biol. 2006;2:e22. doi: 10.1371/journal.pcbi.0020022. [DOI] [PMC free article] [PubMed] [Google Scholar]
- Iacoboni M, Dapretto M. The mirror neuron system and the consequences of its dysfunction. Nat Rev Neurosci. 2006;7:942–951. doi: 10.1038/nrn2024. [DOI] [PubMed] [Google Scholar]
- Iarocci G, McDonald J. Sensory integration and the perceptual experience of persons with autism. J Autism Dev Disord. 2006;36:77–90. doi: 10.1007/s10803-005-0044-3. [DOI] [PubMed] [Google Scholar]
- Jenkinson M, Smith S. A global optimisation method for robust affine registration of brain images. Med Image Anal. 2001;5:143–156. doi: 10.1016/s1361-8415(01)00036-6. [DOI] [PubMed] [Google Scholar]
- Johansen-Berg H, Behrens TE. Just pretty pictures? What diffusion tractography can add in clinical neuroscience. Curr Opin Neurol. 2006;19:379–385. doi: 10.1097/01.wco.0000236618.82086.01. [DOI] [PMC free article] [PubMed] [Google Scholar]
- Kennedy DP, Redcay E, Courchesne E. Failing to deactivate: resting functional abnormalities in autism. Proc Natl Acad Sci USA. 2006;103:8275–8280. doi: 10.1073/pnas.0600674103. [DOI] [PMC free article] [PubMed] [Google Scholar]
- Landry R, Bryson SE. Impaired disengagement of attention in young children with autism. J Child Psychol Psychiatry. 2004;45:1115–1122. doi: 10.1111/j.1469-7610.2004.00304.x. [DOI] [PubMed] [Google Scholar]
- Levitt JG, Blanton RE, Smalley S, Thompson PM, Guthrie D, McCracken JT, Sadoun T, Heinichen L, Toga AW. Cortical sulcal maps in autism. Cereb Cortex. 2003;13:728–735. doi: 10.1093/cercor/13.7.728. [DOI] [PubMed] [Google Scholar]
- Lord C, Rutter M, Le Couteur A. Autism Diagnostic Interview-Revised: a revised version of a diagnostic interview for caregivers of individuals with possible pervasive developmental disorders. J Autism Dev Disord. 1994;24:659–685. doi: 10.1007/BF02172145. [DOI] [PubMed] [Google Scholar]
- Lord C, Risi S, Lambrecht L, Cook EH, Jr, Leventhal BL, DiLavore PC, Pickles A, Rutter M. The autism diagnostic observation schedule-generic: a standard measure of social and communication deficits associated with the spectrum of autism. J Autism Dev Disord. 2000;30:205–223. [PubMed] [Google Scholar]
- Lotspeich LJ, Kwon H, Schumann CM, Fryer SL, Goodlin-Jones BL, Buonocore MH, Lammers CR, Amaral DG, Reiss AL. Investigation of neuroanatomical differences between autism and Asperger syndrome. Arch Gen Psychiatry. 2004;61:291–298. doi: 10.1001/archpsyc.61.3.291. [DOI] [PubMed] [Google Scholar]
- McAlonan GM, Cheung V, Cheung C, Suckling J, Lam GY, Tai KS, Yip L, Murphy DG, Chua SE. Mapping the brain in autism. A voxel-based MRI study of volumetric differences and intercorrelations in autism. Brain. 2005;128:268–276. doi: 10.1093/brain/awh332. [DOI] [PubMed] [Google Scholar]
- Nichols TE, Holmes AP. Nonparametric permutation tests for functional neuroimaging: a primer with examples. Hum Brain Mapp. 2002;15:1–25. doi: 10.1002/hbm.1058. [DOI] [PMC free article] [PubMed] [Google Scholar]
- Oberman LM, Hubbard EM, McCleery JP, Altschuler EL, Ramachandran VS, Pineda JA. EEG evidence for mirror neuron dysfunction in autism spectrum disorders. Brain Res Cogn Brain Res. 2005;24:190–198. doi: 10.1016/j.cogbrainres.2005.01.014. [DOI] [PubMed] [Google Scholar]
- Piven J, Berthier ML, Starkstein SE, Nehme E, Pearlson G, Folstein S. Magnetic resonance imaging evidence for a defect of cerebral cortical development in autism. Am J Psychiatry. 1990;147:734–739. doi: 10.1176/ajp.147.6.734. [DOI] [PubMed] [Google Scholar]
- Piven J, Arndt S, Bailey J, Andreasen N. Regional brain enlargement in autism: a magnetic resonance imaging study. J Am Acad Child Adolesc Psychiatry. 1996;35:530–536. doi: 10.1097/00004583-199604000-00020. [DOI] [PubMed] [Google Scholar]
- Press WA, Brewer AA, Dougherty RF, Wade AR, Wandell BA. Visual areas and spatial summation in human visual cortex. Vision Res. 2001;41:1321–1332. doi: 10.1016/s0042-6989(01)00074-8. [DOI] [PubMed] [Google Scholar]
- Robertson LC, Lamb MR, Knight RT. Effects of lesions of temporal-parietal junction on perceptual and attentional processing in humans. J Neurosci. 1988;8:3757–3769. doi: 10.1523/JNEUROSCI.08-10-03757.1988. [DOI] [PMC free article] [PubMed] [Google Scholar]
- Rogers SJ, Ozonoff S. Annotation: what do we know about sensory dysfunction in autism? A critical review of the empirical evidence. J Child Psychol Psychiatry. 2005;46:1255–1268. doi: 10.1111/j.1469-7610.2005.01431.x. [DOI] [PubMed] [Google Scholar]
- Roid GH, Miller LJ. Wood Dale, IL: Stoelting; 1997. Leiter International Performance Scale-Revised. [Google Scholar]
- Saad ZS, Reynolds RC, Argall RC, Japee S, Cox RW. UMA:an interface for surface-based intra- and inter-subject analysis with AFNI. Proceedings of the 2004 IEEE international symposium on biomedical imaging; 2004. pp. 1510–1513. [Google Scholar]
- Salmond CH, Ashburner J, Connelly A, Friston KJ, Gadian DG, Vargha-Khadem F. The role of the medial temporal lobe in autistic spectrum disorders. Eur J Neurosci. 2005;22:764–772. doi: 10.1111/j.1460-9568.2005.04217.x. [DOI] [PubMed] [Google Scholar]
- Saxe R, Kanwisher N. People thinking about thinking people. The role of the temporo-parietal junction in “theory of mind”. NeuroImage. 2003;19:1835–1842. doi: 10.1016/s1053-8119(03)00230-1. [DOI] [PubMed] [Google Scholar]
- Schluppeck D, Glimcher P, Heeger DJ. Topographic organization for delayed saccades in human posterior parietal cortex. J Neurophysiol. 2005;94:1372–1384. doi: 10.1152/jn.01290.2004. [DOI] [PMC free article] [PubMed] [Google Scholar]
- Schumann CM, Hamstra J, Goodlin-Jones BL, Lotspeich LJ, Kwon H, Buonocore MH, Lammers CR, Reiss AL, Amaral DG. The amygdala is enlarged in children but not adolescents with autism; the hippocampus is enlarged at all ages. J Neurosci. 2004;24:6392–6401. doi: 10.1523/JNEUROSCI.1297-04.2004. [DOI] [PMC free article] [PubMed] [Google Scholar]
- Silver MA, Ress D, Heeger DJ. Topographic maps of visual spatial attention in human parietal cortex. J Neurophysiol. 2005;94:1358–1371. doi: 10.1152/jn.01316.2004. [DOI] [PMC free article] [PubMed] [Google Scholar]
- Sparks BF, Friedman SD, Shaw DW, Aylward EH, Echelard D, Artru AA, Maravilla KR, Giedd JN, Munson J, Dawson G, Dager SR. Brain structural abnormalities in young children with autism spectrum disorder. Neurology. 2002;59:184–192. doi: 10.1212/wnl.59.2.184. [DOI] [PubMed] [Google Scholar]
- Van Essen DC. A tension-based theory of morphogenesis and compact wiring in the central nervous system. Nature. 1997;385:313–318. doi: 10.1038/385313a0. [DOI] [PubMed] [Google Scholar]
- Van Essen DC. A Population-Average, Landmark- and Surface-based (PALS) atlas of human cerebral cortex. NeuroImage. 2005;28:635–662. doi: 10.1016/j.neuroimage.2005.06.058. [DOI] [PubMed] [Google Scholar]
- Van Essen DC, Drury HA, Dickson J, Harwell J, Hanlon D, Anderson CH. An integrated software suite for surface-based analyses of cerebral cortex. J Am Med Inform Assoc. 2001;8:443–459. doi: 10.1136/jamia.2001.0080443. [DOI] [PMC free article] [PubMed] [Google Scholar]
- Van Essen DC, Dierker D, Snyder AZ, Raichle ME, Reiss AL, Korenberg J. Symmetry of cortical folding abnormalities in Williams syndrome revealed by surface-based analyses. J Neurosci. 2006;26:5470–5483. doi: 10.1523/JNEUROSCI.4154-05.2006. [DOI] [PMC free article] [PubMed] [Google Scholar]
- Vincent JL, Patel GH, Fox MD, Snyder AZ, Baker JT, Van Essen DC, Zempel JM, Snyder LH, Corbetta M, Raichle ME. Intrinsic functional architecture in the anesthetized monkey brain. Nature. 2007;447:83–86. doi: 10.1038/nature05758. [DOI] [PubMed] [Google Scholar]
- Volkmar FR, Klin A. Issues in the classification of autism and related conditions. In: Volkmar FR, Paul R, Klin A, Cohen D, editors. Handbook of autism and pervasive developmental disorders. Ed 3. Hoboken, NJ: Wiley; 2005. pp. 5–41. [Google Scholar]
- Wechsler D. Wechsler Intelligence Scale for Children. Ed 3. San Antonio, TX: The Psychological Corporation; 1991. [Google Scholar]
- Wechsler D. San Antonio, TX: The Psychological Corporation; 1999. Wechsler Abbreviated Scale of Intelligence. [Google Scholar]
- Williams JH, Whiten A, Suddendorf T, Perrett DI. Imitation, mirror neurons and autism. Neurosci Biobehav Rev. 2001;25:287–295. doi: 10.1016/s0149-7634(01)00014-8. [DOI] [PubMed] [Google Scholar]
- Williams JH, Waiter GD, Gilchrist A, Perrett DI, Murray AD, Whiten A. Neural mechanisms of imitation and ‘mirror neuron’ functioning in autistic spectrum disorder. Neuropsychologia. 2006;44:610–621. doi: 10.1016/j.neuropsychologia.2005.06.010. [DOI] [PubMed] [Google Scholar]
- Yirmiya N, Kasari C, Sigman M, Mundy P. Facial expressions of affect in autistic, mentally retarded and normal children. J Child Psychol Psychiatry. 1989;30:725–735. doi: 10.1111/j.1469-7610.1989.tb00785.x. [DOI] [PubMed] [Google Scholar]
- Zwaigenbaum L, Bryson S, Rogers T, Roberts W, Brian J, Szatmari P. Behavioral manifestations of autism in the first year of life. Int J Dev Neurosci. 2005;23:143–152. doi: 10.1016/j.ijdevneu.2004.05.001. [DOI] [PubMed] [Google Scholar]