

Abstract
Many pathways have been proposed as contributing to Huntington's disease (HD) pathogenesis, but generally the in vivo effects of their perturbation have not been compared with reference data from human patients. Here we examine how accurately mechanistically motivated and genetic HD models recapitulate the striatal gene expression phenotype of human HD. The representative genetic model was the R6/2 transgenic mouse, which expresses a fragment of the huntingtin protein containing a long CAG repeat. Pathogenic mechanisms examined include mitochondrial dysfunction; profiled in 3-nitropropionic acid-treated rats, 1-methyl-4-phenyl-1,2,3,6-tetrahydropyridine-treated mice, and PGC-1α knock-out mice; and depletion of brain-derived neurotrophic factor (BDNF) using heterozygous and forebrain-specific BDNF-knock-out mice (BDNF HET, Emx-BDNF KO). Based on striatal gene expression, we find the BDNF models, both heterozygous and homozygous knock-outs, to be more like human HD than the other HD models. This implicates reduced trophic support as a major pathway contributing to striatal degeneration in HD. Because the majority of striatal BDNF is synthesized by cortical neurons, the data also imply that cortical dysfunction contributes to HD's hallmark effects on the basal ganglia. Finally, the results suggest that striatal lesions caused by mitochondrial toxins may arise via pathways different from those that drive neurodegeneration in HD. Based on these findings, we present a testable model of HD pathogenesis that, unlike most models, begins to account for regional specificity in human HD and the absence of such specificity in genetic mouse models of HD.
Keywords: Huntington's disease, neurotrophin, microarray, polyglutamine, striatum, neurodegeneration, BDNF
Introduction
Collaborative efforts by the HD research community have defined the striatal gene expression phenotype of human HD and mouse genetic HD models (Hodges et al., 2006; Kuhn et al., 2007). This resource provides gold-standard human data against which animal models must be reconciled, plus comparative data on genetic HD models. Comparative studies found that genetic models correspond well with patient profiles, particularly for mRNAs that are decreased in HD striatum. Surprisingly, mice containing CAG repeats knocked into the endogenous huntingtin (htt) locus (Lin et al., 2001) and transgenic R6/2 mice that merely express mutant exon-1 of htt (Mangiarini et al., 1996) develop nearly indistinguishable striatal profiles (Kuhn et al., 2007).
It is important to note that expression profiling genetic models does not test hypotheses regarding pathophysiology downstream from expression of mutant htt, nor does it reveal whether observed transcriptional changes are causal or responsive. However, the detailed molecular phenotype provided by expression profiling is potentially very powerful. We hypothesize that the human HD expression phenotype will be most closely replicated in vivo by models based on manipulation of early pathogenic events. Here we begin assessing potential pathogenic mechanisms of HD by comparing striatal gene expression from mechanistically motivated models to human HD and genetic models.
One mechanistic hypothesis suggests that medium spiny neurons (MSNs) are vulnerable to metabolic compromise (Browne and Beal, 2004). Thus, we examine a HD model in which striatal degeneration is induced by systemic administration of 3-nitropropionic acid (3NP), an inhibitor of the mitochondrial electron transport chain (Brouillet et al., 2005). For contrast, we reanalyze expression in a Parkinson's disease (PD) model based on another mitochondrial inhibitor, 1-methyl-4-phenyl-1,2,3,6-tetrahydropyridine (MPTP) (Miller et al., 2005).
Several proposed HD mechanisms involve brain-derived neurotrophic factor (BDNF) depletion (Zuccato and Cattaneo, 2007). Wild-type htt regulates BDNF expression by sequestering the transcriptional repressor, neuron restrictive silencing factor (NRSF/REST), in the cytoplasm (Zuccato et al., 2001). Mutant htt allows translocation of REST into the nucleus with attendant suppression of BDNF transcription (Zuccato et al., 2003). Mutating htt also reduces efficiency of axonal transport (Gunawardena et al., 2003; Szebenyi et al., 2003; Gauthier et al., 2004; Trushina et al., 2004). Because BDNF is primarily supplied to the striatum via anterograde transport down corticostriatal axons (Altar et al., 1997), MSNs may be particularly sensitive to disrupted axonal transport. To explore the relevance of BDNF depletion to HD, we examine gene expression of Emx-BDNF mice, in which BDNF is conditionally deleted in cortical neurons (Gorski et al., 2003).
Our analysis first compares HD and HD models to their appropriate controls to establish measures of differential gene expression. We then explore concordance of differential expression across models and species using a variety of statistical and bioinformatic techniques. This is done at the biological-pathway and gene-to-gene levels. Finally, we formally address whether levels of similarity with human HD are significantly different between the models overall and for several select groups of genes. Surprisingly, the BDNF knock-out model profiles are more similar to human HD than the other profiles, including those of mouse genetic HD models.
Materials and Methods
Tissue and arrays.
Postmortem human tissue was gathered with ethical approval and permissions, dissected, and processed as specified (Hodges et al., 2006). Four types of arrays were used in this study. The human samples were hybridized to HG-U133A arrays containing 22,283 probe sets (Affymetrix, Santa Clara, CA). The R6/2 and BDNF mouse samples were hybridized to Affymetrix MOE430A 2.0 arrays containing 22,690 probe sets. 3NP-treated rat samples were hybridized to Affymetrix RAE230 2.0 arrays containing 31,099 probe sets. The MPTP-treated mouse samples were hybridized to Affymetrix U74Av2 arrays containing 12,488 probe sets. Both the unprocessed array data and analysis for these systems are available at http://hdbase.org/cgi-bin/welcome.cgi or upon request. Image data for the human arrays can also be obtained from the GEO database GEO accession number GSE3790 (http://www.ncbi.nlm.nih.gov/geo/) or the EBI database Array Express accession number E-AFMX-6 (http://www.ebi.ac.uk/arrayexpress/). Affymetrix Microarray Suite 5 signals from PGC-1-α knock-out mouse data were downloaded from the GEO database, GEO accession number GSE5786 (Cui et al., 2006).
Treatment of 12-week-old Lewis rats with 3NP was via subcutaneous osmotic minipump, 54 mg/kg/d for 7 d. MPTP mice were treated, dissected, and hybridized as described (Miller et al., 2005). The data from the 7 d posttreatment time point were used in our analysis because this time point provided a more robust expression phenotype than the 4 d posttreatment time point. Striatal tissue from 3NP-treated and untreated rats, R6/2 mice at 9 weeks of age, and BDNF mice at 5 weeks of age was dissected and placed into 5 ml polypropylene Falcon tubes, frozen on dry ice or liquid nitrogen, and stored at −80°C before RNA isolation.
Total RNA was isolated by adding 1 ml of Qiazol reagent (Qiagen, Valencia, CA) to each frozen sample and homogenizing the tissue with a Polytron for 40 s at medium speed. After precipitation and resuspension of the total RNA, residual salt and protein was removed with a Qiagen RNeasy kit per the manufacturer's instructions. RNA concentrations were determined by spectrophotometer. Two micrograms of rodent total RNA was used to synthesize biotinylated-cRNA for R6/2, BDNF, and 3NP samples using the Affymetrix single-cycle probe synthesis kit per the manufacturer's instructions.
Analysis of differential expression in HD.
Affymetrix microarrays were normalized using Robust Multi-array Averaging. Analysis was performed using R version 2.3 and the Bioconductor packages affy and limma (http://www.bioconductor.org) (Gentleman et al., 2004; Smyth, 2005; Irizarry et al., 2006; R Development Core Team, 2006). Differential gene expression in each system was assessed relative to unaffected or untreated controls using paired t tests. From the original HD and control human caudate samples, 26 Vonsattel grade 0–2 cases and 26 controls were matched on age, RNA quality, and source (Hodges et al., 2006). Random matching generated six transgenic–control pairs for R6/2 and BDNF models. One rat array failed to meet quality control standards; thus, the reported 3NP analysis consists of five random treated–untreated pairings. The MPTP analysis used random pairings of the four control and four 7 d posttreatment time point samples. Because the PGC1 mouse image files were not available for reanalysis, differential expression was examined using a two-sided t test applied to the MicroArray Suite 5 signal numbers, GEO accession number GSE5786.
Gene ontology analysis.
For all array types, the gene ontology (GO) categories associated with each gene can be found in the supplemental material (available at www.jneurosci.org and http://hdbase.org/cgi-bin/welcome.cgi). To determine p values for overrepresentation of GO categories, the number of differentially expressed probes (p < 0.001) in each experiment pertaining to each GO category was tabulated. The tally of differentially expressed probe sets was evaluated relative to the total number of probe sets on the array pertaining to the GO category. A p value for overrepresentation was calculated using Fisher's exact test if the number of probe sets pertaining to the GO category was <10; otherwise a Pearson's χ2 test was used.
To examine the intersection of GO categories between any two particular systems, analysis was restricted to the GO categories common to both array types. The number of categories significantly (p < 0.05) overrepresented in the first system, N 1, and the second system, N 2, was tabulated for all changes, then separately for HD increases and decreases. The statistical significance of the intersection between N 1 and N 2 was assessed as follows: for each system, 1000 random lists of probes of equal length to the number of significantly (p < 0.001) differentially expressed probes in that system were generated. p values for overrepresentation of GO categories in these random lists were calculated as above, using Fisher's exact test or Pearson's χ2 test. These calculated p values were used to rank GO categories in the random lists. The N 1 and N 2 most significant categories were selected from the ranked lists, and their intersection was tabulated. This process was repeated for each of the 1000 × 1000 pairs of simulated probe lists to create a distribution of intersections. The p values reported in Table 2 and supplemental dataset 6 (available at www.jneurosci.org as supplemental material and at http://hdbase.org/cgi-bin/welcome.cgi) represent the proportion of simulations with an intersection larger than the observed intersection of the model and human HD.
Table 2.
Summary statistics for overrepresented GO categories in each system and intersection between human HD caudate and models
| N 1: common GO categories overrepresented at p < 0.05 in human HD | N 2: common GO categories overrepresented at p < 0.05 in model | Intersection of N 1 and N 2 | p value | # GO categories with summed ranks ≤ 20 | # GO categories with summed ranks ≤ 200 | |
|---|---|---|---|---|---|---|
| Increasing genes | ||||||
| R6/2 | 166 | 127 | 14 | 0.036 | 2 | 12 |
| BDNF HET | 166 | 90 | 14 | 0.016 | 1 | 10 |
| BDNF KO | 166 | 196 | 22 | 0.014 | 0 | 10 |
| 3NP | 186 | 347 | 34 | 0.006 | 0 | 13 |
| MPTP | 148 | 81 | 4 | 0.726 | 0 | 4 |
| Decreasing genes | ||||||
| R6/2 | 294 | 230 | 50 | <0.001 | 1 | 20 |
| BDNF+/− | 294 | 94 | 22 | 0.009 | 0 | 15 |
| BDNF KO | 294 | 206 | 53 | <0.001 | 2 | 30 |
| 3NP | 327 | 101 | 11 | 0.405 | 0 | 4 |
| MPTP | 271 | 79 | 20 | <0.001 | 0 | 16 |
GO categories common to the separate human and model system pairs were identified. N 1 is the number of these common GO categories significantly increased or decreased in human caudate. N 2 is the number of common GO categories significantly affected in the indicated model. The number of common GO categories significantly over represented in both human HD and the indicated model is shown. p values for intersections were estimated by computer simulation. The number of GO categories in the intersections with summed ranks less than two arbitrary criteria are also shown.
To give more weight to intersections of highly overrepresented GO categories, we ranked the common human and model GO categories by their p values for overrepresentation. The human and model ranks were then summed. Smaller summed ranks thus represent GO categories that are more significantly affected in the two systems under consideration. Table 2 shows the numbers of GO categories meeting two different summed-rank criteria. Summed-rank analysis was used because the different numbers of genes on the microarrays and the different N values in the model systems affect the p value calculations for overrepresentation in complex ways, thus preventing easy implementation of a single p value cutoff to identify common, highly overrepresented GO categories.
Gene-to-gene cross-species analysis.
A complication of Affymetrix array design is that there is often more than one probe set associated with a gene. To simplify cross-species comparisons in those situations, only the statistics from the probe with the greatest evidence for differential expression in HD were retained. To facilitate contrasting of HD across species boundaries and array types, human, mouse, and rat gene orthologs were identified by using gene symbols supplied in the Affymetrix annotation build of July, 2006. These procedures condensed and merged the array data to 4992 genes common to the four array types.
In Figure 1, the 4992 common genes were colored yellow if they increased in a system and met p < 0.001, blue if they decreased with p < 0.001, and black if they did not meet the p value criterion. Taking each system sequentially, separately considering increases and decreases in a system, all genes were ordered by their p value for differential expression.
Figure 1.
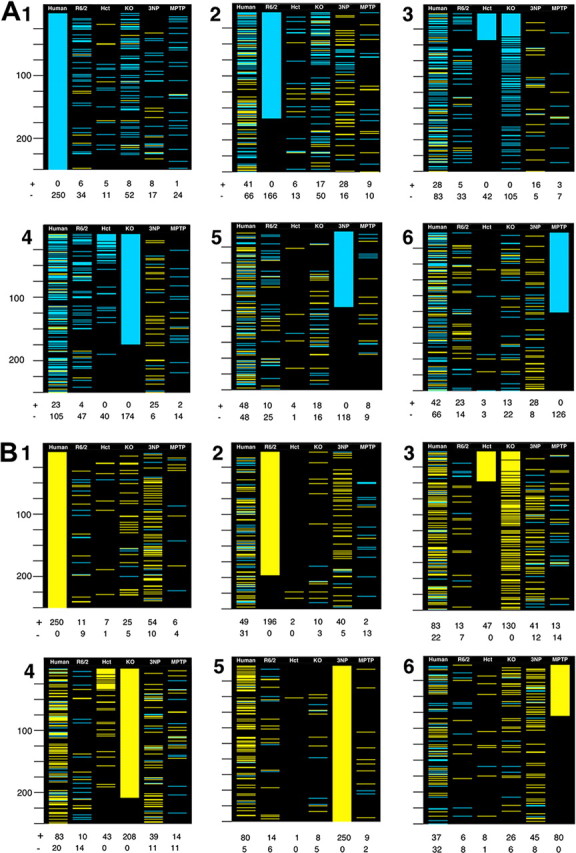
Visualization of concordance and symmetry between the most statistically significant changes in human HD caudate and HD models. To give visual weight to the genes with the greatest evidence for differential expression, genes meeting p < 0.001 for differential expression are colored blue if they decrease in human or model HD and colored yellow if they increase in human or model HD. In A, the top decreasing genes in each system are considered. In B, the top increasing genes in each system are considered. In 1–6 of A and B, genes common to all four array types are sequentially ranked by the p values for differential expression in human HD caudate and HD models. 1, Sorted by human HD; 2, sorted by R6/2 mouse; 3, sorted by BDNF HET mouse; 4, sorted by Emx-BDNF KO mouse; 5, sorted by 3NP-treated rat; 6, sorted by MPTP-treated mouse. Below each 250-gene column is a count of the number of genes that meet the p < 0.001 criteria in that column, with + signifying increased and − signifying decreased in HD relative to controls. Twenty-five-gene intervals are marked on the left side of each panel.
In Figure 2, the 4992 common genes are ordered by the p value for differential expression in the human HD expression profile. The most significant change was ranked n = 1. Arbitrarily starting with the genes n ≤ 25, the Pearson's correlation coefficient between human HD log ratios and HD model log ratios was computed and plotted for n ≤25–4992.
Figure 2.
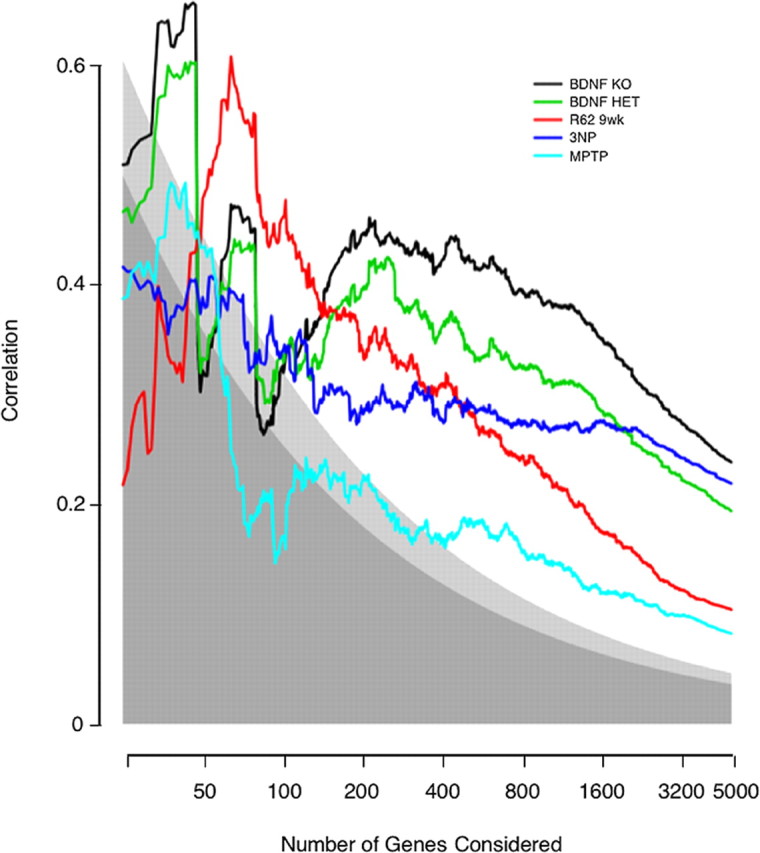
Correlation between effects in human HD caudate and effects in HD models. Genes were ranked by their p values for differential expression in human HD caudate. Then, separately for each model, Pearson's correlation coefficients between human and HD-model log ratios were computed for the top x genes, where x ranges from 25 genes to all 4992 genes common to the four array types. Correlation is plotted on the y-axis, and the number of genes under consideration is plotted on the x-axis. Shading indicates the statistical significance of the observed correlation. Points falling within the darkest gray have a statistical significance of p > 0.01; within the lightest gray, p between 0.01 and 0.001; within the area of no shading, p < 0.001.
In Table 4, human striatal genes were identified by paired comparisons of non-HD caudate to cerebellum and motor cortex (Strand et al., 2007). Genes meeting criteria of p < 0.001 for differential expression plus showing log ratios >0.6 in both comparisons were flagged as enriched in human caudate.
Table 4.
Statistical significance of differences between strength of resemblance to human HD caudate in various sets of genes: Emx-BDNF KO versus all other models
| System | Top 200 human changes | Top 400 human changes | Top 400 human decreases | Top 400 human increases | 127 Human striatal genes | Top 400 R6/2 changes |
|---|---|---|---|---|---|---|
| R6/2 | 1.17 (1.03–1.50) | 1.23 (1.07–1.62) | 1.31 (1.03–1.97) | 1.47 (1.29–1.87) | 1.20 (1.02–1.68) | 2.79 (1.81–4.53) |
| BDNF HET | 1.10 (1.02–1.17) | 1.09 (1.02–1.14) | 1.12 (1.04–1.18) | 0.99 (0.96–1.01) | 1.11 (0.99–1.19) | 1.04 (0.95–1.11) |
| 3NP | 1.19 (0.85–1.92) | 1.17 (0.89–1.77) | 0.94 (0.74–1.49) | 1.78 (1.35–2.58) | 1.56 (1.00–2.66) | 1.64 (1.21–2.53) |
| MPTP | 1.13 (1.03–1.24) | 1.12 (1.03–1.22) | 1.09 (1.01–1.16) | 1.13 (1.03–1.23) | 1.21 (1.05–1.37) | 1.11 (0.99–1.21) |
For each indicated set of gene, ratios of variances and 95% confidence intervals are reported. Numbers are bold if the model is less like human HD than the Emx-BDNF KO model and unity falls outside the 95% confidence interval. In those cases, the indicated model is significantly less like human HD than the Emx-BDNF KO model. Numbers are lightface if unity falls within the 95% confidence interval. In those cases, differences are considered indeterminate. It is important to note that there were no cases of a model being significantly more like human HD than the Emx-BDNF KO model.
Empirical Bayesian analysis.
Expression data from HD and PD models were combined by merging on the 4992 orthologs common to all four types of Affymetrix arrays and then performing a quantile-normalization between arrays. The differences between human and model log ratios were then computed. These differences of expression log ratios were analyzed using the linear model y ijk = βi 0 + βij · I (j > 0) + εijk. Here, y ijk is the difference of the log2 ratios of the ith common gene, on the jth animal model (j = 0–6 for human, R/2, BDNF HET, Emx-BDNF KO, 3NP, or MPTP, respectively), on the kth biological replicate. The term βi 0 is the effect of human HD (i.e., human HD vs human control) on the ith gene, and the βij are random deviations of the jth animal model where βij ∼ N(0, αj), αj > 0 is a species-specific variance parameter, and all βij are independent. Informally, species for which αj is smaller are more similar to human HD than species for which αj is larger. The εijk are assumed to be normally distributed with uncorrelated errors, mean zero, and variance σ2. Our model is an empirical Bayes model in that we put a prior distribution on βij, estimating some of the parameters of this prior distribution based on the data at hand. Empirical Bayes methods have been used previously with microarray data, although usually to distinguish between genes that are or are not differentially expressed (Kendziorski et al., 2003). In our model the estimation is much simpler, and, except for the size of the problem, estimation could be performed using standard mixed-effects models (Pinheiro and Bates, 2000).
Statistical inference.
An estimate α̂j of αj, which measures how similar the expression pattern of species j is to human HD, can be taken by the average of the squared β̂ij, which is the mixed-model estimate of the βij. In this study, we present the ratio of α̂j with Emx-BDNF KO as the denominator. A ratio greater than unity implies that a particular animal model is less similar to human HD than the Emx-BDNF KO, and a ratio less than unity implies that a particular animal model is more similar to human HD. Bootstrapped 95% confidence intervals are presented. Note that the lth bootstrap estimates α̂j (l) for all species are obtained simultaneously, so that they involve the same bootstrap sample of human arrays.
Results
The human HD profile used as the reference for the HD models was based on reanalysis of data obtained from postmortem samples of low pathological grades (Hodges et al., 2006). The motivation for reanalysis was to establish a uniform analytical approach for human HD and HD models. Reanalysis results were essentially identical to the original analysis, with Pearson's correlations of log ratios r = 0.99 and t-statistics r = 0.98 (data not shown).
As a representative genetic model of HD, we chose the commonly used R6/2 mouse. Of all mouse genetic HD models analyzed to date, it provides the clearest gene expression phenotype at an early age. Although it expresses only the first exon of the htt protein and has an accelerated disease course, the R6/2 expression phenotype is not significantly different from the expression phenotype that full-length knock-in HD models develop late in life (Kuhn et al., 2007). The R6/2 model was profiled at 9 weeks of age, approximately midway through disease progression. Profiling was done using newer generation microarrays at higher statistical power than the initial exploratory studies (Luthi-Carter et al., 2000, 2002).
To test the ability of metabolic compromise to mimic HD, we profiled striata from rats treated with 3NP. To determine the impact of a metabolic insult with less severe effects on the striatum, we also reanalyzed a published profile of MPTP-treated mice (Miller et al., 2005). MPTP is an inhibitor of mitochondrial electron transport complex I that preferentially kills dopaminergic neurons in the substantia nigra pars compacta (Smeyne and Jackson-Lewis, 2002). This causes parkinsonism as a result of depletion of dopamine in the striatum. MPTP is thus used to model PD. Both the mitochondrial inhibition and depletion of dopamine may affect striatal gene expression.
Finally, to assess the role attenuation of BDNF signaling may play in HD, we generated striatal profiles from 5-week-old Emx-BDNF KO mice having the BDNF gene genetically ablated specifically in the cortex through cre-lox recombination, and BDNF HET mice heterozygous for a BDNF null mutation (Gorski et al., 2003; Baquet et al., 2004). BDNF is a neurotrophic factor that modulates neuronal survival, differentiation, and synaptic function (Bibel and Barde, 2000; Huang and Reichardt, 2001; Lu, 2003). It is important to note that the Emx-BDNF KO mice show some phenotypic similarities to HD such as early MSN dendritic changes, late loss of striatal MSNs, and early onset of clasping without significant deficits in other tests of motor function (Gorski et al., 2003; Baquet et al., 2004).
The complete analysis of differential expression in each system can be found in supplemental datasets 1–5 (these and all other supplemental data are available at www.jneurosci.org as supplemental material and at http://hdbase.org/cgi-bin/welcome.cgi). An overview of differential expression is presented in Table 1. Several general observations can be made from Table 1. First, there were significant effects on the expression phenotype in every system. It was therefore possible to consider in each system large numbers of gene expression changes at a low false-discovery rate. Second, the effects in the BDNF model were proportional to gene dosage, with the homozygous knock-outs showing more differentially expressed genes than the heterozygotes. Finally, changes in the 3NP-treated rats were skewed toward increases, whereas there were roughly equal proportions of increases and decreases in the other profiles.
Table 1.
Summary statistics for differential expression in human HD caudate and HD models
| Human HD | R6/2 | BDNF HET | BDNF KO | 3NP | MPTP | |
|---|---|---|---|---|---|---|
| Array type | HG-U133A | MOE430_2 | MOE430_2 | MOE430_2 | RAE230_2 | U74Av_2 |
| n HD:controls | 26:26 | 6:6 | 6:6 | 6:6 | 5:5 | 4:4 |
| # probe sets | 22,284 | 22,690 | 22,690 | 22,690 | 31,099 | 12,488 |
| % Inc. | 10.5 | 2.2 | 0.5 | 2.3 | 4.5 | 1.1 |
| % Dec. | 8.3 | 1.9 | 0.4 | 2.2 | 2.1 | 1.5 |
Using a consistent analysis method, human HD, HD model, and PD model arrays were separately compared to matched controls to generate profiles of differential gene expression in each system. The type of Affymetrix array, the number of probe sets, and the percentage of probe sets meeting an arbitrary criteria of p < 0.001 for differential expression are displayed for each system. At this level of significance, the expected percentage of false positives would be ∼0.1%. Inc., Increase; Dec., decrease.
In the analyses that follow, increasing and decreasing mRNAs and their associated gene ontology categories are often considered separately. This is because we are ultimately interested in the concordance between human HD and HD model. Furthermore, this begins to organize the mRNA changes identified in homogenized tissue. Because even low pathological grades of human HD are characterized by significant neuronal loss and astrocytosis in the striatum (Vonsattel et al., 1985), intuitively mRNAs that appear to decrease in human HD are likely to be associated with neurons and neuronal functions. Similarly, mRNAs that increase in HD should tend to be associated with neuroinflammatory cells or cell types that are largely spared in HD, such as oligodendrocytes. The biological attributes implied in the expression phenotypes are of interest because they can be viewed in light of several hypotheses: mRNA changes may be pathogenic in and of themselves; they may be direct effects of a pathogenic mechanism such as transcriptional dysregulation; or they may be homeostatic and compensatory. Another valid hypothesis is that most of the expression changes are irrelevant byproducts removed from the primary pathogenic event(s). In this study, we do not attempt to categorize the mRNA changes according to these hypotheses; instead, gene expression changes are simply treated as a parts of a global molecular phenotype.
Gene ontology of differentially expressed genes in human HD and HD models
Biological themes in the profiles were objectively identified using GO. GO is a controlled vocabulary to describe attributes of gene products in terms of biological functions, processes, and cellular compartments (Ashburner et al., 2000). Table 2 summarizes the total number of significantly affected GO categories in each system. Statistical significance of GO category overrepresentation in genes meeting a criterion of p < 0.001 for differential expression was assessed relative to what would be expected in equally sized, randomly produced lists of genes. Complete lists of statistically overrepresented GO categories for each system are found in supplemental datasets 1–5 (available at www.jneurosci.org as supplemental material and at http://hdbase.org/cgi-bin/welcome.cgi).
The main goal of this study is to compare the different models to human HD, but we briefly mention a few of the most significantly affected GO categories in the separate models. Table 3 shows the most highly overrepresented GO categories in each system. Themes in the categories overrepresented by genes having decreased expression in human HD include synaptic transmission, calcium/calmodulin signaling, mitochondrial function, and CNS development. Themes in categories overrepresented in genes having increased expression include mRNA splicing, transcription-related processes, and positive regulation of the I-κ β/NF-κ β cascade. Within the R6/2 profile, decreased-expression themes include cholesterol/lipid biosynthesis, signal transduction, and calcium/calmodulin signaling, whereas increased-expression themes include mRNA splicing, proteasome, lipoprotein biosynthesis, and cholesterol transport. The BDNF model shows decreased expression in calcium binding, signal transduction, ion transport, and ion channel categories, whereas increased expression categories include cholesterol/lipid biosynthesis and myelination. The 3NP profile is consistent with neuroinflammation, showing increases in immune response, response to wounding, defense response, and inflammatory response. The MPTP profile shows decreases in synaptic vesicle and exocytosis-related processes, and increases of mitochondrial components and complex I subunits. The latter may reflect compensatory mechanisms to counter the effects of the respiration-inhibiting toxin.
Table 3.
The most highly overrepresented upregulated and downregulated gene ontology functions and processes in human HD caudate and model systems
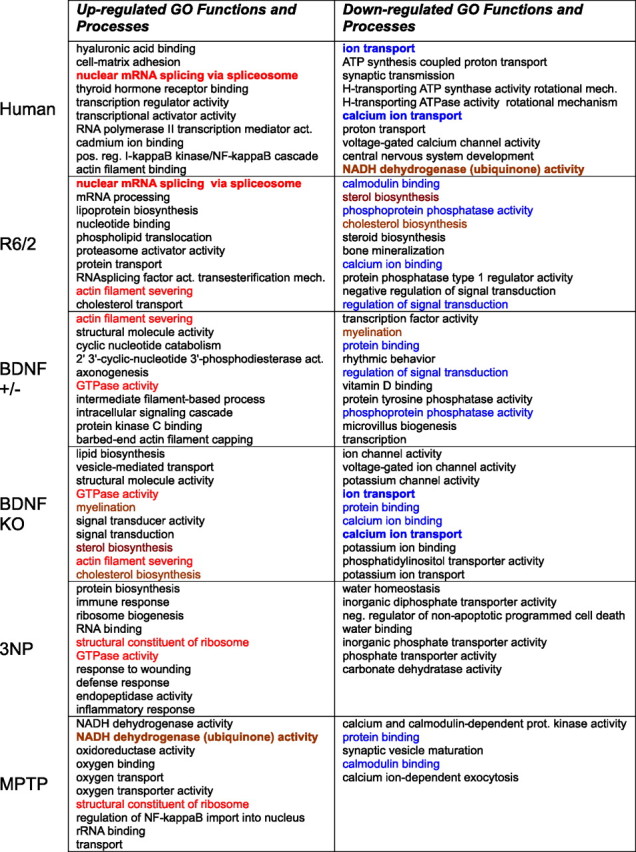
Categories were ranked by p value for overrepresentation. The top 10 categories, as ranked by p value, meeting p < 0.001 for overrepresentation are shown. Less than 10 categories are shown if fewer met the p < 0.001 criterion. Red type indicates congruent upregulated categories appearing in the table in two or more systems. Blue type indicates congruent downregulated categories. Brown type indicates incongruent changes. Bold type indicates intersection between human HD and a model.
Comparison of human HD and HD models considering significantly affected GO categories
We next examined the intersection of significantly affected GO categories in human HD and the models, considering upregulated and downregulated categories separately. A discussion of statistical issues pertaining to intersections of significantly affected GO categories and differentially expressed genes can be found in supplemental text (available at www.jneurosci.org as supplemental material and at http://hdbase.org/cgi-bin/welcome.cgi). The complete list of pairwise human–model GO-category intersections is presented in supplemental dataset 6 (available at www.jneurosci.org as supplemental material and at http://hdbase.org/cgi-bin/welcome.cgi). A simple count of categories in the intersection of GO categories represented by downregulated genes orders Emx-BDNF KO ∼ R6/2 > BDNF HET ∼ MPTP >3NP (Table 2). A simulation-based method to assess the statistical significance of the intersections of downregulated GO categories showed that all models except the 3NP model attained statistical significance (i.e., p < 0.05 that intersections were larger than expected by chance given the number of overrepresented categories in each model). GO category comparisons using upregulated mRNAs revealed fewer significant functional overlaps than did downregulated mRNAs (Table 2). Counts of GO categories common with human HD increases ranked 3NP > Emx-BDNF KO > R6/2 = BDNF HET > MPTP. Here all of the models were significantly similar to human HD, except the MPTP model.
The above analysis treats intersections between highly overrepresented GO categories as biologically and statistically equivalent to intersections between less overrepresented GO categories. A summed-rank analysis was therefore used to examine which model had more highly overrepresented GO categories in common with human HD. The number of GO categories with summed-ranks less than two arbitrary criteria are displayed in Table 2. This analysis revealed that human HD and Emx-BDNF KO have more highly ranked downregulated GO categories in common than the other human–model pairs (Table 2, supplemental dataset 6, available at www.jneurosci.org as supplemental material and at http://hdbase.org/cgi-bin/welcome.cgi). Human–model intersection totals among upregulated GO categories were not significantly different between the R6/2, 3NP, and Emx-BDNF KO models. The GO categories increasing both in human HD and the R6/2 model do contain two very high-ranking categories: cellular compartment, nucleus; and biological process, nuclear mRNA splicing via spliceosome (see Table 3). The summed-rank analysis also highlighted NADH dehydrogenase (ubiquinone) activity, which relates to electron transport chain complex I, as a category decreased in human HD but discordantly increased in the MPTP model (Table 3). Concordance between MPTP and human HD tended to be in less highly ranked decreased GO categories (supplemental dataset 6, available at www.jneurosci.org as supplemental material and at http://hdbase.org/cgi-bin/welcome.cgi).
Comparing GO overlap between the models without regard for human HD shows, as might be expected, that the most significant overlaps are between the BDNF HET and Emx-BDNF KO models (supplemental dataset 6, available at www.jneurosci.org as supplemental material and at http://hdbase.org/cgi-bin/welcome.cgi). By these analyses, it appears that the 3NP and MPTP models are outliers, whereas the two BDNF mutant genotypes and the R6/2 model are more similar to one another. Furthermore, the BDNF and R6/2 models all reflect changes seen in human HD striatum, with essentially the same functional categories driving the similarity (supplemental dataset 6, available at www.jneurosci.org as supplemental material and at http://hdbase.org/cgi-bin/welcome.cgi). In summary, when considered as GO categories, the changes in gene expression observed in human HD caudate are best reflected by the snapshots of the BDNF and R6/2 models.
Similarity of differential expression in human and model HD on a gene-to-gene basis
Gene ontology is a useful tool for organizing and understanding expression profiles biologically. However, its annotations are made on the basis of incomplete knowledge about gene functions. GO may improperly group changes in the tissue profiles that actually occur in different cell types, although treating increases and decreases separately partially addresses this problem. Finally, because genes are often linked to multiple functional categories, GO may overstate the resemblance between two systems by counting items more than once. To mitigate these issues, we considered the expression profiles on a gene-to-gene basis.
One simple approach to comparing gene expression patterns is to identify genes that show the greatest statistical evidence for differential expression in a reference system and note whether changes in the other systems are concordant. After collapsing the array data to a common set of 4992 genes identifiable as orthologous (supplemental dataset 7, available at www.jneurosci.org as supplemental material and at http://hdbase.org/cgi-bin/welcome.cgi), we separately consider the top 250 (an arbitrary number) decreasing or increasing genes in each system and show whether those genes met criteria of p < 0.001 for differential expression in the other systems (Fig. 1). In Figure 1, A1 and B1, the reference system is human HD. All of the models show concordance with the most significant decreases in human HD but it is clear that the greatest similarity is seen in the Emx-BDNF KO and R6/2 mice (Fig. 1 A1). Regarding the most significant increases in human HD, only the 3NP and Emx-BDNF KO models show obvious concordance (Fig. 1 B1).
In the other panels of Figure 1, we examine whether the expression changes in the rodent models are symmetric with either human HD or the other models. Considering the most statistically significant decreases in the R6/2 mouse, initially they are concordant with human HD decreases but this concordance decays after the top 100 genes (Fig. 1 A2). Comparing R6/2 with the other models, the BDNF model shows similarity in the decreasing genes and the 3NP model shows similarity in the increasing genes (Fig. 1 A2,B2). Moving to the BDNF model, both the heterozygous and homozygous knock-out mice are strong predictors of human HD decreases and good predictors of human HD increases (Fig. 1 A3,A4,B3,B4). The 3NP model profile predicts only human increases (Fig. 1 A5,B5). The MPTP Parkinson's disease model had little predictive power for human HD or the HD models (Fig. 1 A6,B6), an observation that tends to discount its similarity in the GO categories.
The above analysis gave particular weight to genes that met a p < 0.001 criteria for differential expression and ignores trends within less significantly affected genes. A more flexible approach evaluates the correlation between changes in human HD and HD models. Because we take the human profile as the reference, we ranked genes by their statistical significance of differential expression in human HD. This placed the HD changes in which we have the greatest confidence at the top of the list of genes. Beginning at the top and moving down, progressively increasing the set of genes considered, a correlation coefficient was calculated for the log ratios of expression in human HD and the models. In Figure 2, it can be seen that all of the models showed positive correlation with human HD, indicating again that they all capture aspects of the expression changes occurring in HD. When more than a few hundred genes are considered, the statistical significances of the highest correlations in Figure 2 are extreme (p < 10−12). More importantly, as we consider more genes, and hundreds of genes may be considered in most models while still maintaining a low false-discovery rate (Table 1), presumably the biological significance of the correlation with human HD increases as well. It is apparent from Figure 2 that within small lists of genes correlation is variable and no dominant model arises. However, after approximately the top 150 genes, correlation stabilizes, and the Emx-BDNF KO and BDNF HET animals emerge as having the strongest overall correlation with human HD. This pattern persists as correlations are calculated down the entire set of orthologs.
The same analysis was performed considering pairwise human–model correlations, because intersecting genes on only two types of arrays yields a larger set of orthologous genes than intersecting four types of arrays. This gave identical conclusions (data not shown). Finally, to put each model system in its best possible light, we considered the pure pairwise correlation with human HD when genes were ranked by the significance in the model system. Even then, when considering >200 genes, the BDNF system showed greater resemblance to the expression profile of human HD than the other systems (supplemental Fig. 1, available at www.jneurosci.org as supplemental material).
Statistical significance of the difference between models
Because each of the previous analyses indicated that gene expression in the Emx-BDNF KO model was as similar, if not more similar, to human HD than the other models, we formally tested all the models against the Emx-BDNF KO model to see whether the differences between models were statistically significant. Our method is applicable to any specified set of genes and is based on a comparison of ratios of estimates of variance parameters. A ratio >1 implies that a particular animal model is less similar to human HD than the Emx-BDNF KO model in that set of genes. A ratio <1 implies that a particular animal model is more similar to human HD. The statistical significance of the difference between the Emx-BDNF KO and the other model was assessed using an empirical Bayesian method to generate 95% confidence intervals for the ratio (Kendziorski et al., 2003).
In Figure 2, three points can be identified where the Emx-BDNF KO model may or may not be more similar to human HD than the other models. These are at approximately the top 50, 100, and 200 genes. Considering the top 50 or 100 human HD changes, as ranked by p values, the differences between the Emx-BDNF KO and the other models were not statistically significant (data not shown). At and beyond the top 200 human changes, the Emx-BDNF KO was the model most correlated with human HD (Fig. 2). This correlation was statistically distinct from the R6/2 and MPTP models' correlation with human HD (Table 4). Differences between the 3NP and Emx-BDNF KO model were indeterminate with this test in these sets of genes. Generally, the Emx-BDNF KO model had a greater resemblance to human HD than the other models when large sets of significant human HD changes were considered, and this held true whether increasing and decreasing genes were considered separately or together (Table 4).
It could be argued that the profile of human HD, although of low pathological grades, still relies on samples with significant cellular pathology and loss. The human profile may thus contain mRNA changes unrelated to pathogenic mechanisms that obscure a more HD-proximal expression signature. Therefore, we examined several sets of genes that can be hypothesized to be more purely HD-etiologic. Because the classic pathology associated with HD is degeneration of MSNs, we examined the similarity between human HD and models within a list of 127 genes that showed enriched expression in human caudate, thus likely MSN markers (supplemental dataset 7, available at www.jneurosci.org as supplemental material and at http://hdbase.org/cgi-bin/welcome.cgi) (Strand et al., 2007). Considering these genes, we found that the Emx-BDNF KO was significantly more similar to human HD than all of the other models except the BDNF HET (Table 4). The last set of genes we examined were the top 400 changes found in the R6/2 mouse, as these might be construed as earlier and more direct HD effects than those in the postmortem human profile. Surprisingly, even in this group of genes, the Emx-BDNF KO model was a better fit to human HD than the R6/2 model (Table 4).
Discussion
The classical hallmark of HD is degeneration of the striatum. Neuroimaging reveals a more complex picture, showing that cortical sensorimotor degeneration occurs early in disease (Rosas et al., 2002, 2005). Consistent with this, microarray analysis of human HD found many expression changes in HD motor cortex, whereas frontal cortex and cerebellum showed, respectively, no and very slight differences from controls (Hodges et al., 2006). Mechanistic hypotheses about HD must reconcile these patterns of neurodegeneration and dysfunction with the fact that huntingtin is homogeneously expressed throughout the brain (Strong et al., 1993).
Most mechanistic studies have focused on cell-autonomous pathways of polyglutamine toxicity. However, confining mutant htt expression to MSNs does not lead to behavioral or neuropathological changes seen in other HD models (Gu et al., 2005, 2007). This suggests a role for cell–cell interactions in HD pathogenesis. Our data indicate that depletion of cortical BDNF evokes major aspects of the expression phenotype of HD in the striatum. Importantly, even partial BDNF depletion is sufficient, because BDNF protein is reduced ∼50% in the cortex of BDNF HET mice compared with wild-type (Gorski et al., 2003), yet gene expression in P35 BDNF HET striatum is as good a match to human HD as the R6/2 model.
In adult-onset human HD, modest BDNF deprivation might occur over decades, perhaps becoming more severe with age, whereas the BDNF mutants lack BDNF from embryonic stages onward. Normally, BDNF expression is present at very low levels during and before the first postnatal week in the rodent anterior cortex but then increases rapidly during the second postnatal week (Baquet et al., 2004), coincident with a major wave of corticostriatal synaptogenesis (Sharpe and Tepper, 1998). Lacking this surge of BDNF expression, decrements of MSN dendritic length, spines, and soma size develop by P35 in the BDNF mutants (Baquet et al., 2004). It is intriguing that the P35 expression profiles, presumably reflecting a blend of diminished corticostriatal connectivity and trophic deprivation, model the profile of the middle-aged HD brain. The similar mRNA expression changes argue that the MSNs in HD and BDNF-deprived environments suffer from similar insults.
It is possible that diverse stressors could lead to similar transcriptional responses in MSNs. To explore the specificity of our findings, we examined profiles of mitochondrial dysfunction, another proposed mechanism of HD pathogenesis. The 3NP profile appears substantially attributable to astrocytosis, a common component of HD, but not HD-specific or necessarily a significant feature of early HD (Vonsattal et al., 1985). Because the 3NP regimen has been optimized to produce striatal lesions, it was surprising that reductions in striatum-enriched mRNAs associated with MSN dysfunction failed to appear. This may indicate that 3NP lesions arise via rapid apoptotic mechanisms. With only a small fraction of dysfunctional neurons present at one time, their contribution to the 3NP profile may be too small to detect. In the MPTP Parkinson's disease model, mitochondrial inhibition plus possible contributions from striatal dopamine depletion also failed to produce the changes in MSN markers repeatedly seen in HD expression profiles.
Recent studies have suggested that mutant htt interferes with the function of PGC-1α, a transcriptional coactivator with a major role in regulating cellular metabolism (Puigserver and Spiegelman, 2003). In a model linking transcriptional and metabolic hypotheses of HD pathogenesis, disruption of PGC-1α-driven transcription leads to mitochondrial dysfunction and striatal neurodegeneration (Cui et al., 2006; Weydt et al., 2006). We examined the published striatal gene expression profile from 6-month-old homozygous PGC-1α-knock-out mice, which may also have a developmental component to their phenotype, and confirmed reductions in mRNAs encoding mitochondrial proteins and electron transport chain components seen in human and mouse HD (supplemental dataset 8, available at www.jneurosci.org as supplemental material and at http://hdbase.org/cgi-bin/welcome.cgi) (Cui et al., 2006). However, like the 3NP and MPTP profiles, it lacks effects on mRNAs associated with MSNs. The 3NP, MPTP, and PGC-1α profiles examined here suggest that mitochondrial dysfunction alone is insufficient to elicit the striatal gene expression phenotype of HD. In addition, the results indicate that diverse MSN stresses lead to distinct expression profiles, although additional work is required to fully explore this issue.
Manipulation of downstream pathways may only lead to partial similarity with the expression profile of human HD, whereas a model based on expression of mutant htt could reasonably be expected to comprehensively recapitulate HD. Indeed, there is significant similarity between R6/2 and human HD striatum (Kuhn et al., 2007). This is just one of many observations supporting the relevance of mouse genetic HD models. However, reduction of cortical BDNF yields a more accurate striatal phenocopy than the R6/2 genetic model. To more thoroughly test this surprising observation, human–model correlations using 6- and 12-week-old R6/2 mice plus 22-month-old CHL2 knock-in mice were also examined (Kuhn et al., 2007). Again, the heterozygous and homozygous BDNF mutants were more similar to human HD (supplemental Fig. 2, available at www.jneurosci.org as supplemental material). Thus, our conclusions are not dependant on our choice of model or R6/2 age.
Looking beyond the striatum, data from many studies indicate that mouse genetic HD models do not recapitulate several features of human HD. Mice do not develop easily recognized phenotypes unless their CAG repeat greatly exceeds sizes seen in adult-onset human HD. In R6/2 mice, mRNA changes are equally abundant in cerebellum and striatum (Luthi-Carter et al., 2002). This is clearly not the case in human HD (Hodges et al., 2006). Finally, neither htt-fragment nor knock-in models exhibit preferential striatal degeneration to the degree seen in human HD (Menalled and Chesselet, 2002; Menalled, 2005). Possible reasons for discrepancies between mouse and human HD include htt expression levels, physiological differences, and the size of the CAG repeat. These factors may shift the relative importance of cell-autonomous and intercellular pathogenic pathways. Mice with large CAG-expansions may more closely model human juvenile HD, which arises from longer CAG-expansions, tends to progress more rapidly, and shows wider pathology than the more common adult-onset HD (Squitieri et al., 2006).
Although our studies do not address the relative influence of impaired BDNF transcription and transport caused by mutant htt, a model of striatal pathogenesis incorporating impaired axonal transport may explain the preferential neurodegeneration of MSNs observed in typical human HD and lack thereof in mice. A transport model is consistent with many identified protein–protein interactions of huntingtin (Kaltenbach et al., 2007), its likely function in vesicle trafficking (Velier et al., 1998), and observations that mutant htt can disrupt axonal transport (Gunawardena et al., 2003; Szebenyi et al., 2003; Gauthier et al., 2004; Trushina et al., 2004). If mutant htt reduces efficiency of axonal transport, the net effect is likely to be influenced by axon length, analogous to electrical resistance in a wire. Thus, BDNF-depletion pathways may contribute more to HD etiology in large human brains than in small mouse brains, perhaps explaining the greater relative striatal vulnerability in human HD.
We predict that as brain size increases, the striatal specificity of mutant huntingtin models will rise, and the length of the CAG repeat necessary to provoke HD-like pathology will fall. It is interesting that rats, which are several times larger than mice but not significantly more evolutionarily similar to humans, appear to show behavioral and neuropathological phenotypes with just 50 CAG repeats (Von Horsten et al., 2003). Surveys of gene expression in the rat HD model and the sheep model under development would provide a direct test of this prediction.
A substantial literature argues that HD pathology develops via multiple pathways that may act synergistically. Our data support the hypothesis that reduced trophic support contributes importantly to striatal degeneration in human HD. The obvious clinical implication is that augmenting BDNF levels or activating downstream signaling pathways may be of therapeutic benefit. The abnormal phenotypes of young BDNF mutant mice make these, or similar lines, promising systems in which to develop BDNF delivery and augmentation methods, particularly because their phenotypes are not confounded by other pathogenic pathways. Canals et al. (2004) have shown that endogenous BDNF levels influence the onset and the severity of motor dysfunction in the R6/1 mouse HD model. They also demonstrated that administration of exogenous BDNF reversed the selective degeneration of enkephalin-positive neurons in the R6/1 striatum. A transport model of HD predicts that BDNF augmentation may have greater effects in human HD than preclinical studies on mice would indicate.
Expression profiling provides an objective method to compare and contrast animal models and human diseases, complementing more traditional methods for evaluating animal models based on neuropathology, biochemistry, and behavior. Given that diseases may undergo complex temporal progressions, assessment at different stages may be necessary to better understand both disease and the quality of a model. Nonetheless, expression profiling, coupled with the ability to perturb, in vivo, specific pathways hypothesized to play a role in disease via the creation of transgenic animals, chemical treatments, or silencing RNAs, should allow us to parse complex disease phenotypes into components arising from different pathogenic mechanisms. In vivo testing of which specific biochemical pathways are most relevant to disease will be useful in prioritizing therapeutic interventions for HD and other neurodegenerative diseases.
Footnotes
This work was supported by the Hereditary Disease Foundation (K.R.J., Z.C.B.); National Institutes of Health Grant R01 EY014998 (K.R.J.); Biotechnology and Biological Sciences Research Council UK (L.J., P.H.); Medical Research Council UK (L.J.); National Institutes of Health Grants R01 CA74841 (C.K., A.K.A.), R01 NS042157-04 (J.M.O.), and R21 NS0475098-01A1 (A.D.S., J.M.O.); and Hereditary Disease Foundation, Cure HD Initiative, and the High Q Foundation (J.M.O., A.D.S., A.K.A., C.K.). We thank Howard Federoff and Renee Miller for providing the MPTP data, Helen Marshall of the MCDB Microarray Facility, and Carl Johnson, Stephen Tapscott, and Miriam Rosenberg for their thoughtful comments.
References
- Altar CA, Cai N, Bliven T, Juhasz M, Conner JM, Acheson AL, Lindsay RM, Wiegand SJ. Anterograde transport of brain-derived neurotrophic factor and its role in the brain. Nature. 1997;389:856–860. doi: 10.1038/39885. [DOI] [PubMed] [Google Scholar]
- Ashburner M, Ball CA, Blake JA, Botstein D, Butler H, Cherry JM, Davis AP, Dolinski K, Dwight SS, Eppig JT, Harris MA, Hill DP, Issel-Tarver L, Kasarskis A, Lewis S, Matese JC, Richardson JE, Ringwald M, Rubin GM, Sherlock G. Gene ontology: tool for the unification of biology. The Gene Ontology Consortium. Nat Genet. 2000;25:25–29. doi: 10.1038/75556. [DOI] [PMC free article] [PubMed] [Google Scholar]
- Baquet ZC, Gorski JA, Jones KR. Early striatal dendrite deficits followed by neuron loss with advanced age in the absence of anterograde cortical brain-derived neurotrophic factor. J Neurosci. 2004;24:4250–4258. doi: 10.1523/JNEUROSCI.3920-03.2004. [DOI] [PMC free article] [PubMed] [Google Scholar]
- Bibel M, Barde YA. Neurotrophins: key regulators of cell fate and cell shape in the vertebrate nervous system. Genes Dev. 2000;14:2919–2937. doi: 10.1101/gad.841400. [DOI] [PubMed] [Google Scholar]
- Brouillet E, Jacquard C, Bizat N, Blum D. 3-Nitropropionic acid: a mitochondrial toxin to uncover physiopathological mechanisms underlying striatal degeneration in Huntington's disease. J Neurochem. 2005;95:1521–1540. doi: 10.1111/j.1471-4159.2005.03515.x. [DOI] [PubMed] [Google Scholar]
- Browne SE, Beal MF. The energetics of Huntington's disease. Neurochem Res. 2004;29:531–546. doi: 10.1023/b:nere.0000014824.04728.dd. [DOI] [PubMed] [Google Scholar]
- Canals JM, Pineda JR, Torres-Peraza JF, Bosch M, Martin-Ibanez R, Munoz MT, Mengod G, Ernfors P, Alberch J. Brain-derived neurotrophic factor regulates the onset and severity of motor dysfunction associated with enkephalinergic neuronal degeneration in Huntington's disease. J Neurosci. 2004;24:7727–7739. doi: 10.1523/JNEUROSCI.1197-04.2004. [DOI] [PMC free article] [PubMed] [Google Scholar]
- Cui L, Jeong H, Borovecki F, Parkhurst CN, Tanese N, Krainc D. Transcriptional repression of PGC-1alpha by mutant huntingtin leads to mitochondrial dysfunction and neurodegeneration. Cell. 2006;127:59–69. doi: 10.1016/j.cell.2006.09.015. [DOI] [PubMed] [Google Scholar]
- Gauthier LR, Charrin BC, Borrell-Pages M, Dompierre JP, Rangone H, Cordelieres FP, De Mey J, MacDonald ME, Lessmann V, Humbert S, Saudou F. Huntingtin controls neurotrophic support and survival of neurons by enhancing BDNF vesicular transport along microtubules. Cell. 2004;118:127–138. doi: 10.1016/j.cell.2004.06.018. [DOI] [PubMed] [Google Scholar]
- Gentleman RC, Carey VJ, Bates DM, Bolstad B, Dettling M, Dudoit S, Ellis B, Gautier L, Ge Y, Gentry J, Hornik K, Hothorn T, Huber W, Iacus S, Irizarry R, Leisch F, Li C, Maechler M, Rossini AJ, Sawitzki G, et al. Bioconductor: open software development for computational biology and bioinformatics. Genome Biol. 2004;5:R80. doi: 10.1186/gb-2004-5-10-r80. [DOI] [PMC free article] [PubMed] [Google Scholar]
- Gorski JA, Zeiler SR, Tamowski S, Jones KR. Brain-derived neurotrophic factor is required for the maintenance of cortical dendrites. J Neurosci. 2003;23:6856–6865. doi: 10.1523/JNEUROSCI.23-17-06856.2003. [DOI] [PMC free article] [PubMed] [Google Scholar]
- Gu X, Li C, Wei W, Lo V, Gong S, Li SH, Iwasato T, Itohara S, Li XJ, Mody I, Heintz N, Yang XW. Pathological cell-cell interactions elicited by a neuropathogenic form of mutant Huntingtin contribute to cortical pathogenesis in HD mice. Neuron. 2005;46:433–444. doi: 10.1016/j.neuron.2005.03.025. [DOI] [PubMed] [Google Scholar]
- Gu X, Andre VM, Cepeda C, Li SH, Li XJ, Levine MS, Yang XW. Pathological cell-cell interactions are necessary for striatal pathogenesis in a conditional mouse model of Huntington's disease. Mol Neurodegener. 2007;2:8. doi: 10.1186/1750-1326-2-8. [DOI] [PMC free article] [PubMed] [Google Scholar]
- Gunawardena S, Her LS, Brusch RG, Laymon RA, Niesman IR, Gordesky-Gold B, Sintasath L, Bonini NM, Goldstein LS. Disruption of axonal transport by loss of huntingtin or expression of pathogenic polyQ proteins in Drosophila . Neuron. 2003;40:25–40. doi: 10.1016/s0896-6273(03)00594-4. [DOI] [PubMed] [Google Scholar]
- Hodges A, Strand AD, Aragaki AK, Kuhn A, Sengstag T, Hughes G, Elliston LA, Hartog C, Goldstein DR, Thu D, Hollingsworth ZR, Collin F, Synek B, Holmans PA, Young AB, Wexler NS, Delorenzi M, Kooperberg C, Augood SJ, Faull RL, et al. Regional and cellular gene expression changes in human Huntington's disease brain. Hum Mol Genet. 2006;15:965–977. doi: 10.1093/hmg/ddl013. [DOI] [PubMed] [Google Scholar]
- Huang EJ, Reichardt LF. Neurotrophins: roles in neuronal development and function. Annu Rev Neurosci. 2001;24:677–736. doi: 10.1146/annurev.neuro.24.1.677. [DOI] [PMC free article] [PubMed] [Google Scholar]
- Irizarry RA, Gautier L, Bolstad BM, Miller C. affy: methods for Affymetrix oligonucleotide arrays. 2006. R package version 1100 ( http://www.bioconductor.org/)
- Kaltenbach LS, Romero E, Becklin RR, Chettier R, Bell R, Phansalkar A, Strand A, Torcassi C, Savage J, Hurlburt A, Cha GH, Ukani L, Chepanoske CL, Zhen Y, Sahasrabudhe S, Olson J, Kurschner C, Ellerby LM, Peltier JM, Botas J, et al. Huntingtin interacting proteins are genetic modifiers of neurodegeneration. PLoS Genet. 2007;3:e82. doi: 10.1371/journal.pgen.0030082. [DOI] [PMC free article] [PubMed] [Google Scholar]
- Kendziorski CM, Newton MA, Lan H, Gould MN. On parametric empirical Bayes methods for comparing multiple groups using replicated gene expression profiles. Stat Med. 2003;22:3899–3914. doi: 10.1002/sim.1548. [DOI] [PubMed] [Google Scholar]
- Kuhn A, Goldstein DR, Hodges A, Strand AD, Sengstag T, Kooperberg C, Becanovic K, Pouladi MA, Sathasivam K, Cha JH, Hannan AJ, Hayden MR, Leavitt BR, Dunnett SB, Ferrante RJ, Albin R, Shelbourne P, Delorenzi M, Augood SJ, Faull RL, et al. Mutant huntingtin's effects on striatal gene expression in mice recapitulate changes observed in human Huntington's disease brain and do not differ with mutant huntingtin length or wild-type huntingtin dosage. Hum Mol Genet. 2007;16:1845–1861. doi: 10.1093/hmg/ddm133. [DOI] [PubMed] [Google Scholar]
- Lin CH, Tallaksen-Greene S, Chien WM, Cearley JA, Jackson WS, Crouse AB, Ren S, Li XJ, Albin RL, Detloff PJ. Neurological abnormalities in a knock-in mouse model of Huntington's disease. Hum Mol Genet. 2001;10:137–144. doi: 10.1093/hmg/10.2.137. [DOI] [PubMed] [Google Scholar]
- Lu B. BDNF and activity-dependent synaptic modulation. Learn Mem. 2003;10:86–98. doi: 10.1101/lm.54603. [DOI] [PMC free article] [PubMed] [Google Scholar]
- Luthi-Carter R, Strand A, Peters NL, Solano SM, Hollingsworth ZR, Menon AS, Frey AS, Spektor BS, Penney EB, Schilling G, Ross CA, Borchelt DR, Tapscott SJ, Young AB, Cha JH, Olson JM. Decreased expression of striatal signaling genes in a mouse model of Huntington's disease. Hum Mol Genet. 2000;9:1259–1271. doi: 10.1093/hmg/9.9.1259. [DOI] [PubMed] [Google Scholar]
- Luthi-Carter R, Hanson SA, Strand AD, Bergstrom DA, Chun W, Peters NL, Woods AM, Chan EY, Kooperberg C, Krainc D, Young AB, Tapscott SJ, Olson JM. Dysregulation of gene expression in the R6/2 model of polyglutamine disease: parallel changes in muscle and brain. Hum Mol Genet. 2002;11:1911–1926. doi: 10.1093/hmg/11.17.1911. [DOI] [PubMed] [Google Scholar]
- Mangiarini L, Sathasivam K, Seller M, Cozens B, Harper A, Hetherington C, Lawton M, Trottier Y, Lehrach H, Davies SW, Bates GP. Exon 1 of the HD gene with an expanded CAG repeat is sufficient to cause a progressive neurological phenotype in transgenic mice. Cell. 1996;87:493–506. doi: 10.1016/s0092-8674(00)81369-0. [DOI] [PubMed] [Google Scholar]
- Menalled LB, Chesselet MF. Mouse models of Huntington's disease. Trends Pharmacol Sci. 2002;23:32–39. doi: 10.1016/s0165-6147(00)01884-8. [DOI] [PubMed] [Google Scholar]
- Menalled LB. Knock-in mouse models of Huntington's disease. NeuroRx. 2005;2:465–470. doi: 10.1602/neurorx.2.3.465. [DOI] [PMC free article] [PubMed] [Google Scholar]
- Miller RM, Chen LL, Kiser GL, Giesler TL, Kaysser-Kranich TM, Palaniappan C, Federoff HJ. Temporal evolution of mouse striatal gene expression following MPTP injury. Neurobiol Aging. 2005;26:765–775. doi: 10.1016/j.neurobiolaging.2004.12.002. [DOI] [PubMed] [Google Scholar]
- Pinheiro JC, Bates DM. New York: Springer; 2000. Mixed-effects models in S and S-PLUS. [Google Scholar]
- Puigserver P, Spiegelman BM. Peroxisome proliferator-activated receptor-gamma coactivator 1 alpha (PGC-1 alpha): transcriptional coactivator and metabolic regulator. Endocr Rev. 2003;24:78–90. doi: 10.1210/er.2002-0012. [DOI] [PubMed] [Google Scholar]
- R Development Core Team. R: A language and environment for statistical computing. R Foundation for Statistical Computing, Vienna. 2006. ISBN 3–900051-07–0 ( http://www.r-project.org/)
- Rosas HD, Liu AK, Hersch S, Glessner M, Ferrante RJ, Salat DH, van der Kouwe A, Jenkins BG, Dale AM, Fischl B. Regional and progressive thinning of the cortical ribbon in Huntington's disease. Neurology. 2002;58:695–701. doi: 10.1212/wnl.58.5.695. [DOI] [PubMed] [Google Scholar]
- Rosas HD, Hevelone ND, Zaleta AK, Greve DN, Salat DH, Fischl B. Regional cortical thinning in preclinical Huntington disease and its relationship to cognition. Neurology. 2005;65:745–747. doi: 10.1212/01.wnl.0000174432.87383.87. [DOI] [PubMed] [Google Scholar]
- Sharpe NA, Tepper JM. Postnatal development of excitatory synaptic input to the rat neostriatum: an electron microscopic study. Neuroscience. 1998;84:1163–1175. doi: 10.1016/s0306-4522(97)00583-6. [DOI] [PubMed] [Google Scholar]
- Smeyne RJ, Jackson-Lewis V. The MPTP model of Parkinson's disease. Brain Res Mol Brain Res. 2002;134:57–66. doi: 10.1016/j.molbrainres.2004.09.017. [DOI] [PubMed] [Google Scholar]
- Smyth GK. Limma: linear models for microarray data. In: Gentleman R, Carey V, Dudoit S, Irizarry R, Huber W, editors. Bioinformatics and computational biology solutions using R and bioconductor. New York: Springer; 2005. pp. 397–420. [Google Scholar]
- Squitieri F, Frati L, Ciarmiello A, Lastoria S, Quarrell O. Juvenile Huntington's disease: does a dosage-effect pathogenic mechanism differ from the classical adult disease? Mech Ageing Dev. 2006;127:208–212. doi: 10.1016/j.mad.2005.09.012. [DOI] [PubMed] [Google Scholar]
- Strand AD, Aragaki AK, Baquet ZC, Hodges A, Cunningham P, Holmans P, Jones KR, Jones L, Kooperberg C, Olson JM. Conservation of regional gene expression in mouse and human brain. PLoS Genet. 2007;3:e59. doi: 10.1371/journal.pgen.0030059. [DOI] [PMC free article] [PubMed] [Google Scholar]
- Strong TV, Tagle DA, Valdes JM, Elmer LW, Boehm K, Swaroop M, Kaatz KW, Collins FS, Albin RL. Widespread expression of the human and rat Huntington's disease gene in brain and nonneural tissues. Nat Genet. 1993;5:259–265. doi: 10.1038/ng1193-259. [DOI] [PubMed] [Google Scholar]
- Szebenyi G, Morfini GA, Babcock A, Gould M, Selkoe K, Stenoien DL, Young M, Faber PW, MacDonald ME, McPhaul MJ, Brady ST. Neuropathogenic forms of huntingtin and androgen receptor inhibit fast axonal transport. Neuron. 2003;40:41–52. doi: 10.1016/s0896-6273(03)00569-5. [DOI] [PubMed] [Google Scholar]
- Trushina E, Dyer RB, Badger JD, II, Ure D, Eide L, Tran DD, Vrieze BT, Legendre-Guillemin V, McPherson PS, Mandavilli BS, Van Houten B, Zeitlin S, McNiven M, Aebersold R, Hayden M, Parisi JE, Seeberg E, Dragatsis I, Doyle K, Bender A, et al. Mutant huntingtin impairs axonal trafficking in mammalian neurons in vivo and in vitro. Mol Cell Biol. 2004;24:8195–8209. doi: 10.1128/MCB.24.18.8195-8209.2004. [DOI] [PMC free article] [PubMed] [Google Scholar]
- Velier J, Kim M, Schwarz C, Kim TW, Sapp E, Chase K, Aronin N, DiFiglia M. Wild-type and mutant huntingtins function in vesicle trafficking in the secretory and endocytic pathways. Exp Neurol. 1998;152:34–40. doi: 10.1006/exnr.1998.6832. [DOI] [PubMed] [Google Scholar]
- Von Horsten S, Schmitt I, Nguyen HP, Holzmann C, Schmidt T, Walther T, Bader M, Pabst R, Kobbe P, Krotova J, Stiller D, Kask A, Vaarmann A, Rathke-Hartlieb S, Schulz JB, Grasshoff U, Bauer I, Vieira-Saecker AM, Paul M, Jones L, et al. Transgenic rat model of Huntington's disease. Hum Mol Genet. 2003;12:617–624. doi: 10.1093/hmg/ddg075. [DOI] [PubMed] [Google Scholar]
- Vonsattel JP, Myers RH, Stevens TJ, Ferrante RJ, Bird ED, Richardson EP., Jr Neuropathological classification of Huntington's disease. J Neuropathol Exp Neurol. 1985;44:559–577. doi: 10.1097/00005072-198511000-00003. [DOI] [PubMed] [Google Scholar]
- Weydt P, Pineda VV, Torrence AE, Libby RT, Satterfield TF, Lazarowski ER, Gilbert ML, Morton GJ, Bammler TK, Strand AD, Cui L, Beyer RP, Easley CN, Smith AC, Krainc D, Luquet S, Sweet IR, Schwartz MW, La Spada AR. Thermoregulatory and metabolic defects in Huntington's disease transgenic mice implicate PGC-1alpha in Huntington's disease neurodegeneration. Cell Metab. 2006;4:349–362. doi: 10.1016/j.cmet.2006.10.004. [DOI] [PubMed] [Google Scholar]
- Zuccato C, Cattaneo E. Role of brain-derived neurotrophic factor in Huntington's disease. Prog Neurobiol. 2007;81:294–330. doi: 10.1016/j.pneurobio.2007.01.003. [DOI] [PubMed] [Google Scholar]
- Zuccato C, Ciammola A, Rigamonti D, Leavitt BR, Goffredo D, Conti L, MacDonald ME, Friedlander RM, Silani V, Hayden MR, Timmusk T, Sipione S, Cattaneo E. Loss of huntingtin-mediated BDNF gene transcription in Huntington's disease. Science. 2001;293:493–498. doi: 10.1126/science.1059581. [DOI] [PubMed] [Google Scholar]
- Zuccato C, Tartari M, Crotti A, Goffredo D, Valenza M, Conti L, Cataudella T, Leavitt BR, Hayden MR, Timmusk T, Rigamonti D, Cattaneo E. Huntingtin interacts with REST/NRSF to modulate the transcription of NRSE-controlled neuronal genes. Nat Genet. 2003;35:76–83. doi: 10.1038/ng1219. [DOI] [PubMed] [Google Scholar]