

Abstract
Extracellular recording were performed from mushroom body-extrinsic neurons while the animal was exposed to differential conditioning to two odors, the forward-paired conditioned stimulus (CS+; the odor that will be or has been paired with sucrose reward) and the unpaired CS− (the odor that will be or has been specifically unpaired with sucrose reward). A single neuron, the pedunculus-extrinsic neuron number 1 (PE1), was identified on the basis of its firing pattern, and other neurons were grouped together as non-PE1 neurons. PE1 reduces its response to CS+ and does not change its response to CS−after learning. Most non-PE1 neurons do not change their responses during learning, but some decrease, and one neuron increases its response to CS+. PE1 receives inhibitory synaptic inputs, and neuroanatomical studies indicate closely attached GABA-immune reactive profiles originating at least partially from neurons of the protocerebral–calycal tract (PCT). Thus, either the associative reduction of odor responses originates within the PE1 via a long-term depression (LTD)-like mechanism, or PE1 receives stronger inhibition for the learned odor from the PCT neurons or from Kenyon cells. In any event, as the decreased firing of PE1 correlates with the increased probability of behavioral responses, our data suggest that the mushroom bodies exert general inhibition over sensory–motor connections, which relaxes selectively for learned stimuli.
Keywords: associative learning, associative plasticity, mushroom body, olfactory learning, extracellular recording, PE1 neuron
Introduction
Learning and memory formation lead to behavioral changes. Ideally, the search for the neural basis of learning and memory is performed in an animal that can directly report its behavioral change. Neural substrates of learning and memory are expected to be related to plasticity of neural functions that should thus be measured at the single-neuron level under conditions when the animal learns. For such measurements, extracellular recordings have been successfully used to monitor neural processes during learning and memory retrieval at the single-neuron level [e.g., place cells in the rodent hippocampus (Sutherland and McNaughton, 2000); prefrontal neurons and working memory in primates (Goldman-Rakic, 1995); orbitofrontal neurons in olfactory learning (Rolls et al., 1996); dopamine neurons in the ventral tegmentum of the monkey (Schultz, 1998)]. It is, however, usually rather difficult to assign neural activity to a particular type of neuron- or even to an identified single neuron. Insects provide conditions that allow us to overcome these limitations and to trace associative plasticity to single identified neurons when an animal learns a stimulus and subsequently responds to it. In only two cases, the ventral unpaired median neuron number 1 of the maxillary neuromere (VUMmx1) and the pedunculus-extrinsic neuron number 1 (PE1) in the bee brain (Hammer, 1993; Mauelshagen, 1993) has it so far been possible to return to the same individual neuron in subsequent recordings from different animals exposed to associative learning schedules, but in both cases the animal's behavior was considerably restricted and the recordings lasted only a few minutes. Here, we report on long-lasting extracellular recordings from mushroom body (mb)-extrinsic neurons during olfactory learning and retention, and particularly from the PE1 neuron.
The mb is devoted to higher-order processing in the insect brain. Ablating or genetically minimizing mb leads to hyperactivity and perseverance of motor patterns, indicating a release from a general inhibitory action of the mb on descending premotor commands (Huber, 1978; Heisenberg, 1998). Mbs are also implemented in olfactory learning and memory formation in both Drosophila (Heisenberg, 2003) and the honeybee (Menzel and Müller, 1996). In the bee, the transition from short-term memory (STM) to long-term memory (LTM) after appetitive olfactory learning requires normal functions of the mb (Menzel et al., 1974). Furthermore, the honeybee brain reward pathway contains one of the ventral unpaired median neurons (VUMmx1) whose axonal terminals converge with the olfactory pathway at the mb calyces and two other locations, the antennal lobe and the lateral horn (Hammer, 1993; Schröter et al., 2007). Little is known about the internal organization of the mb and the output neurons with respect to memory formation. In honeybees, the pedunculus-extrinsic neuron PE1 was found to change its responses during associative pairing of an odor with sucrose stimulation (Mauelshagen, 1993).
Recording extracellularly from PE1 over several hours, and training the animals to an odor, we found reduced responses of PE1 to the conditioned odor. This response reduction was seen in animals that learned to discriminate the conditioned from the unpaired odor. These associative effects were seen in animals that learned to discriminate the conditioned from the unpaired odor. Non-PE1 neurons showed associative upregulation or downregulation of odor responses or no associative plasticity. Because intrinsic neurons of the mb (Kenyon cells) change their responses to learned odors differently, it is concluded that either enhanced inhibition of the input to PE1, or associative LTD within the PE1 is responsible for the associative reduction.
Materials and Methods
Animals
Forager honeybees were collected at the entrance to the hive 1 d before the experiment (mostly between 4:00 and 6:00 P.M.), anesthetized on ice, and harnessed in a plastic tube. The heads were immobilized with wax and the scapi of the both antennae were fixed on the head with low-melting-point wax. The bees were fed with four or five drops of 1.25 m sucrose solution and kept at room temperature until the next day in a moist and dark environment.
Electrophysiology
Electrodes were manufactured as described previously (Mizunami et al., 1998; Okada et al., 1999). A polyurethane-coated copper wire, 14 μm in diameter (Electrisola, Escholzmatt, Switzerland) was used as an electrode. Two wires were glued together with wax onto a 2- to 3-cm-long tungsten wire (100 μm in diameter) that was attached to a glass capillary. The tips of the copper wires protruded from the tip of the tungsten wire by 1–2 cm. One copper wire was 50–70 μm longer at the tip than the other. The copper wires were connected to a differential amplifier (NPI, Tamm, Germany) after removing the insulation at the other end with a flame. The electrodes' resistance was ∼2 MΩ. A silver wire with a diameter of 50 μm (Nilaco, Tokyo, Japan) inserted into the right compound eye served as a ground electrode. A small window was cut between the compound eyes above the bases of both antennae, head glands were removed, and only the trachea sacks above one α-lobe were removed. No muscles were injured or stretched, and thus the bee could open its mandibles, extend its proboscis, drink sugar water, and freely move the flagellum of its antennae. The brain surface at the ventral border of the α-lobe, where the PE1 exits, was carefully scratched with a very fine tungsten needle to facilitate inserting the electrode. The electrode was inserted 150–250 μm beyond the surface. The cuticle removed from the head capsule was divided into two pieces and placed back onto the head capsule shortly (1–2 min) after electrode insertion. All gaps between the cuticle pieces were sealed with silicon (WPI, Sarasota, FL) to prevent the brain from drying out. The animal was left for 15–20 min to allow the silicon to harden, the recording to stabilize, and the animal to recover.
The electric signals were amplified by a differential amplifier (NPI) with a 10–10 kHz bandpass filter. Hum noise (50 Hz) was eliminated by a filter (HumBug; Digitimer, Hertfordshire, UK). Neural activity was stored at 20 kHz through an analog to digital converter (1401 micro MKII; Cambridge Electronic Design, Cambridge, UK) using Spike2 software (Cambridge Electronic Design), a software that was also used for controlling the stimulation devices.
After recordings ended, copper ions were released from the tip of the recording electrode by passing a positive current (typically 20–40 nA for 20 s) through the electrode. The copper ions were precipitated by Rubeanic acid. The bee's head was isolated, briefly immersed in 50% ethanol, dissected under saline, and then fixed in 4% paraformaldehyde in honeybee saline or Carnoy's fixative for 50 or 45 min, respectively. Dissected brains were hydrated and intensified with silver according to (Bacon and Altman, 1977). Subsequently, the specimens were embedded in 6–7% agarose (Sigma, St. Louis, MO), sectioned at 100 μm with a vibratome, and observed under a Nomarski interference or a conventional light microscope.
Intracellular recordings: Intracellular recording was performed according to the method described in (Menzel and Manz, 2005) with the following changes: glass electrodes were pulled by a Flaming/Brown microelectrode puller (Sutter Instruments, Novato, CA), filled with potassium acetate (2.5 m) or Lucifer yellow (4% in 0.1 m LiCl). Neurons were filled with Lucifer yellow by passing hyperpolarizing current of 2–4 nA. The brain was dissected and treated for histology as described below.
Odor conditioning
Three odors, peppermint, limonene, and 2-octanol (Sigma), were used as olfactory stimuli. Four microliters of each odor were applied to a 1 × 1 cm filter paper. An air pulse was applied, under constant air flow, to the antennae through a plastic syringe containing the odor-soaked filter paper for odor stimuli or a filter paper alone as control (blank). The outlet of the stimulation device (Galizia et al., 1997) was set 6–7 cm away from the bee's head to ensure free movement of the antennae and a turbulent odor stream. Stimulation was controlled by a computer. The odor was exhausted through a tube positioned behind the animal.
The experiment has three phases: pretest phase, conditioning phase (acquisition phase), and test phase (extinction phase). The pretest consisted of five 3-s-long repetitions of each of the three odors presented in a pseudorandom sequence. The first odor presented was always the one selected for conditioning in the second phase. The interstimulus interval was 1 min. Fifteen to twenty minutes after the pretest, the conditioning phase was started. The odor was selected as the conditioned stimulus (CS+; the odor that will be or has been paired with sucrose reward) and was applied for 3 s followed by an application of 1.25 m sucrose solution [unconditioned stimulus (US) for 3 s overlapping with the CS+ by 1 s] first to the antennae and then to the proboscis. Another odor was delivered for 3 s without sucrose as CS− (the odor that will be or has been specifically unpaired with sucrose reward). The interval between these two odor or odor/sucrose stimulations was 2.5 min. This form of differential conditioning was repeated 5 times. The third odor, a control odor (Ctr; the odor used for testing generalization), was not applied during the conditioning phase but only in the pretest and test phases. In the test phase, the animal was exposed to each of three odors once without sucrose for 5, 30, and 60 min after the last conditioning trial. Inter-stimulus interval was 2.5 min. The odor sequence was fixed during the conditioning phase and test-phase (CS+, CS−, Ctr). The animals were tested for intact unconditioned response to sucrose at the end of the experiment.
Control animals were exposed to the same sequence of odors as experimental animals, but they did not receive sucrose stimulation. The first odor applied to control animals is, for convenience, called CS+, the subsequent one CS−. Because the same procedure as in the experimental animals was applied during the test phase, the first odor tested (“CS+”) was the same odor as in the conditioning, keeping the sequence of odor stimulation the same in experimental and test animals.
For all animals, CS+, CS−, and Ctr were balanced, although not fully equally balanced, because animals were grouped (Table 1) (see below). Because bees could freely extend their probosces, and because the CS+ pulses during the conditioning phase preceded the US by 2 s, the response to the CS+ could be visually monitored and expressed as acquisition functions.
Table 1.
List of all animals and their behavioral responses in the course of olfactory conditioning
| Bee | Cell | Animal | 5 min | 30 min | 60 min |
|---|---|---|---|---|---|
| 1 | PE1 | Ex | D | D | D |
| 2 | PE1 | Ex | D | D | D |
| 3 | PE1 | Ex | D | R | R |
| 4 | PE1 | Ex | D | R | R |
| 5 | PE1 | Ex | D | n. R | n. R |
| 6 | PE1 | con | |||
| 7 | PE1 | con | |||
| 8 | non-PE1 | Ex | D | D | D |
| 9 | non-PE1 | Ex | D | D | D |
| 10 | non-PE1 | Ex | D | D | R |
| 11 | non-PE1 | Ex | D | D | n. R |
| 12 | non-PE1 | Ex | n. D | n. R | D |
| 13 | non-PE1 | Ex | n. D | n. R | n. R |
| 14 | non-PE1 | Ex | n. D | n. R | n. R |
| 15 | non-PE1 | Ex | n. D | n. R | n. R |
| 16 | non-PE1 | con | |||
| 17 | non-PE1 | con | |||
| 18 | non-PE1 | con | |||
| 19 | non-PE1 | con | |||
| 20 | non-PE1 | con |
Ex, Experimental animal; con, control animal; D, discriminator; n. D, nondiscriminator; R, responder; n. R, nonresponder.
Analysis
Behavior.
Based on behavioral responses to the respective odors [percentage of proboscis extension response (PER%)] during the first extinction test in the test phase (5 min test), bees could be classified as discriminators or nondiscriminators. A discriminator was defined as an animal which responded to CS+, but not CS−. The nondiscriminators responded either to both CS+ and CS−, or to neither CS+ nor CS−.
Electrophysiology.
In general, extracellular recordings show more than one unit simultaneously. Therefore, recorded units were separated from each other by the template-matching method provided by the Spike 2 program (Cambridge Electronic Design). The results of the method were inspected and visually confirmed afterward. Only reliably isolated units with large spikes were used for further analysis. All responses were converted to peristimulus time histograms (PSTHs) between 1 s before an onset of and 1 s after the termination of odor stimulation (bin width: 50 ms). Because the spontaneous activity fluctuated, activities during the 1 s before stimulation onset for each odor were calculated and subtracted from the odor response (normalized response designated as “rate difference”). The first bin after the onset of stimulation was defined as the response initiation time; spike frequency at this time was always at least twice spontaneous activity. We calculated separately the mean of rate differences in four different time windows in each of the 3 test phases for each odor: window 0 (W0) refers to 1 s before the onset of stimulation, window 1 (W1; phasic period) to 0–150 ms of the odor response as defined by the response initiation time, window 2 (W2; tonic period) to 150–650 ms of the odor response, and window 3 (W3; late tonic response) to 650–1050 ms of the odor response.
Statistics.
Behavior.
Animals which extended their probosces during the 3 s period of odor stimulation before sucrose stimulation were counted as showing the PER. The Wilcoxon matched-pair test was applied to examine the responses of the respective groups for homogeneity.
Electrophysiology.
The change as the consequence of conditioning was statistically evaluated by three procedures applied both for within-group comparisons (responses to CS+, CS−, and Ctr of the experimental animals) and between-group comparisons (experimental animals vs control animals, see Table 1): (1) rate difference was calculated for each of the three time windows and the respective values of these normalized responses to CS+, CS−, and Ctr were compared using one-way ANOVA and post hoc Tukey–Kramer test in all combinations separately for discriminators, nondiscriminators, PE1 neurons, and non-PE1 neurons using Statistica (Statsoft, Tulsa, UK). (2) The spike frequency of the neurons to CS+ (separately for PE1 and non-PE1 neurons) was normalized relative to CS− by calculating the ratio of spike rates, and these values were compared before and after conditioning, applying the same statistical test. Again, discriminators and nondiscriminators were treated separately. (3) A combined measure of the conditioning effect on spike activity was calculated by subtracting the spike rate differences during the pretest and test phases. This value is called Δ. Δ is calculated for each time window of the odor response and expressed as, e.g., Δw1 for time window W1. Again, Δ values were analyzed in all possible combinations by repeated ANOVA measures and post hoc Tukey–Kramer tests.
Neuroanatomy
Whole mounts of the brain.
To selectively stain α-lobe-extrinsic neurons, small amounts of tetra-methyl-rhodamin-biotin dextran (TMR-biotin; Micro-Ruby; Invitrogen, Eugene, OR) or 4% fluorescein-biotin dextran (FSC-biotin; Micro-Emerald; Invitrogen) were placed in defined regions of the α-lobe. A fine dye-coated wire (diameter 16 μm) was inserted either at the α-exit (entrance of the protocerebral–calycal tract (PCT) type A3 neurons (Rybak and Menzel, 1993; Grünewald, 1999a) or ventrally at ∼200 μm from the anterior brain surface (exit of the PE1 neuron). Dye was allowed to diffuse for 12–14 h. The brain was dissected and fixation with 4% formaldehyde (FA) and 0.2% glutaraldehyde (Sigma) in PBS. Glutaraldehyde, in combination with the intracellularly diffused dyes, created a neuropil counterstaining necessary for identifying neuropil borders and thus allows registrating neuronal structures into the Bee Standard Brain (for details, see: http://www.neurobiologie.fu-berlin.de/beebrain/) (Brandt et al., 2005). After fixation, brains were washed, dehydrated via an ascending ethanol series, and cleared in methysalicylate.
GABA immunohistology.
After visual inspection of the whole-mount preparations, 100-μm-thick vibratome sections were made from selected preparations, in which the PE1 was labeled, and then treated with anti-GABA antibody (Sigma) to analyze the close proximity of the PE1 to GABA-immunoreactive (IR)-like profiles in the central brain. Sections were preincubated in 2% bovine serum albumine in PBS containing 0.5% Triton X (PBS-Tx) for 1 h, and then incubated in primary antibody rabbit anti-GABA 1:500 in PBS-Tx for 5 d. Sections were washed six times in PBS-Tx for 1 h each, and then incubated in secondary antibody goat anti-rabbit conjugated with Cy5 fluorophore (1:200; Jackson ImmunoResearch Laboratories, West Grove, PA) in PBS-Tx. Vibratome sections were either cleared in 80% glycerol or dehydrated and cleared in methysalicylate. The GABA-immune profiles were excited with the 633 nm line of a HeNe laser, whereas TMR-biotin- or FSC-biotin-stained PE1 profiles costained in the same vibratome sections were excited using the 546 and 488 nm laser lines and analyzed in the confocal microscope.
Synapsin staining.
In another set of experiments, brains were fixed in 4% formaldehyde, vibratome sectioned, and then washed in PBS-Tx, treated with the anti-GABA antibody as described above, and then costained with a monoclonal antibody raised in mouse directed against the Drosophila synaptic vesicle-associated protein synapsin SYNORF1 (kindly provided by E. Buchner, University of Würzburg, Würzburg, Germany), which recognizes the synaptic vesicle-associated protein synapsin at presynaptic sites (Klagges et al., 1996). Therefore, sections were preincubated in 2% BSA and then incubated in primary antiserum (1:10; SYNORF1) for 5 d in PBS-Tx. After washing, they incubated with the secondary antibody, Cy3 conjugated goat anti-mouse (1:200), and Cy5 conjugated goat-anti-rabbit (1:200) in 2% BSA/PBS-Tx for 1 d. Sections were then washed and cleared in methylsalicylate.
Optical sectioning.
Whole-mount preparations were imaged with a confocal laser-scanning microscope (TCS SP2; Leica, Wetzlar, Germany) using a Leica HC PL CS APO UV 10×/0.4 numerical aperture, or a UV 20× dry lens for the whole-mount preparations. The excitation wavelength used for FSC-biotin was 488 nm and for TMR 568 nm. Optical sectioning was performed at intervals between 1 and 3 μm. High-resolution scans were done with the Leica 40× oil or 63× oil lenses on vibratome sections. The dye-filled neurons were excited using the 488 nm line of the ArKr laser or the 543 nm line of the HeNe laser, Cy3- and Cy5-labeled GABA-immune profiles were excited with the 543 and 633 nm line of a HeNe laser, respectively.
Neuron tracing.
All confocal scans were digitized as double channels and then separately analyzed using the three-dimensional imaging and tracing modules in Amira (version 4.1; Mercury Computer Systems, Merignac, France). Tracing and reconstruction of the neurons, including topology, lengths and diameters, were done with a custom module in Amira (Evers et al., 2005). The PE1 markings were traced using the NeuronTree module and visualized as a skeleton tree. A neuron surface was created and a proximity correlation between the PE1 dendritic trees and GABA profiles of the second channel were calculated (for details, see Evers et al., 2005).
Fitting neuronal structures into the Standard Bee Brain atlas.
When vibratome sections were scanned, the images were merged into the standard atlas using the procedures described by Brandt et al. (2005).
Results
General properties of mushroom body-extrinsic units and isolation of PE1
Extracellular recordings were performed with a pair of wire electrodes inserted into the ventral region of the α lobe, at a location where the PE1 neuron exits the α lobe at the borderline to the peduncle/β lobe at a depth of 150–250 μm (Fig. 1A,B). The electrodes were advanced to a depth of up to 250 μm until large amplitudes of extracellular spikes were detected. A total of 20 single units (in 20 animals, 13 animals of the experimental group, seven animals in the control group; a single unit was evaluated in each animal) (Table 1) were isolated in our recordings and analyzed. Because the PE1 neuron shows a double or triplet spike pattern (Mauelshagen, 1993), characteristic for only this neuron in the region of the α exit (Menzel and Manz, 2005), this neuron could be identified in extracellular recordings (Fig. 1D,E). The interspike interval histogram (ISIH) of spontaneous PE1 activity typically shows a characteristic feature: two peaks (one peak is 6–10 ms and the other is 30–40 ms) and one prominent dip between these two peaks (Fig. 1F, 1 ms bin width). The same double-peaked interval histograms were found in the analysis of earlier intracellular recordings for which the PE1 recordings were proven by intracellular staining (Menzel and Manz, 2005). An additional feature of the PE1 neuron is its spontaneous activity >15 Hz. When the ISIH of a given unit showed the three features of the ISIH, and spontaneous activity >15 Hz, we designated the unit as the putative PE1. Seven of 20 showed clear double and triple spikes during spontaneous activity (Fig. 1, Table 1), and spontaneous spike frequency of >15 Hz, indicating that the spikes were generated by the PE1 neuron. The 13 neurons not assigned as PE1 (non-PE1 neurons) cannot be related to any particular neuron in the α exit region. In seven of 20 recordings, more than one unit could be isolated (Table 1).
Figure 1.

Morphology and physiological characteristics of the PE1. A, A scheme of the left half of the honeybee brain with an intracellular marking of the PE1 neuron (after Rybak and Menzel, 1998). br, Basal ring; co, collar; li, lip region; LC, lateral calyx; MC, medial calyx; Pe, pedunculus; LH, lateral horn; LPL, lateral protocerebral lobe; mPL, median protocerebral lobe; β-L, β lobe. The arrow points to the ventral region of the α-lobe at which the integrating segment of the PE1 neuron can be found at a depth of ∼150–250 μm. d, Dorsal; m, medial. B, Locations of tips of electrodes as detected by the Cu2+ deposits. The line demarcates the ventral border of one α-lobe. Recorded sites are shown for different depths (open circles, 150–175 μm; open triangles, 175–200 μm; open rectangle, 200–240 μm). dor, Dorsal; med, medial. C, Representative example of a recording of a unit designated as a PE1 neuron according to the criteria described in the text. The time windows used in the data analysis are indicated by W0 (1 s before the onset of stimulation), W1 (phasic response, 0–150 ms of the odor response as defined by the response initiation time (see Materials and Methods), W2 (tonic period, 150–650 ms of the odor response), and W3 (late tonic response, 650–1050 ms of the odor response). A horizontal line shows a threshold for spike sorting. Inset, Average of spike frequency of all PE1 neurons with scatter bars after subtracting the spontaneous frequency as measured in time window W0. Notice the consistent odor response (here to peppermint). D, Spike activity during the period indicated by an asterisk (spontaneous discharge) at high temporal resolution (notice double or triple spikes; arrows). E, Intracellular recording of PE1. Notice the double and triple spikes during spontaneous activity. F, ISIH for a neuron designated as PE1. Notice the two peaks of interval frequencies, the larger one occurs at ∼6–8 ms, the lower one at ∼30 ms. The larger peak reflects the intervals between single spikes in double or triple spikes, and the smaller reflects intervals between double or triple spikes. G, ISIH for a neuron designated as non-PE1.
The spontaneous activity in all units varied between 6.8 and 44 Hz. Because odor responses were closely positively correlated with spontaneous activity (data not shown) we calculated the spike rate difference between odor responses in three time windows and the spontaneous activity immediately before odor stimulation (for spike rate difference, see Materials and Methods). As shown in Fig. 1C the phasic–tonic odor response was divided up into three response windows (W1, W2, W3), and response differences were calculated separately. Figure 1C (inset) also shows that responses (e.g., to peppermint) are rather stable in PE1 neurons recorded in different animals (after subtracting the spontaneous activity). Long-lasting recordings (>3 h) indicated that spontaneous activity fluctuated irregularly. There was a tendency that it increased after sensory stimulation, particularly when the spontaneous activity was rather low before stimulation, indicating a kind of arousal. At night spontaneous activity decreased to <7 Hz, interrupted by short periods of high activity (>30 Hz), and rose in the morning (data not shown). No odor stimulations or learning experiments were performed at night.
All α-lobe-extrinsic neurons responded to all test odors. The PE1 is known to be responsive to a large range of odors and other sensory modalities like mechanical stimulation of the antennae, sucrose stimulation to both the antennae and the proboscis, and light flashes. These observations were verified in our extracellular recordings. Other than during intracellular recordings from the PE1 (Menzel and Manz, 2005), no PE1 neuron was observed that did not respond to the stimuli tested (light, touch, sucrose, odors). The odors used in our study, peppermint, limonene, and 2-octanol, were equally effective in both the PE1 neuron and other nonidentified α-lobe-extrinsic neurons. The average response rate of PE1 in the two windows W1 and W2 were as follows: peppermint, W1, 86.7 Hz; W2, 49.2 Hz; limonene, W1, 94.5 Hz; W2, 55.9 Hz; 2-octanol, W1, 76.8 Hz; W2, 48.9 Hz. The respective values for the neurons classified as non-PE1 neurons were as follows: peppermint, W1, 70.7 Hz; W2, 37.9 Hz; limonene, W1, 70.2 Hz; W2, 37.5 Hz; 2-octanol, W1, 67.8 Hz; W2, 39.7 Hz. We do not know whether the lower odor responses in non-PE1 neurons is a significant feature or specific only to those that we recorded in this study. There is a tendency that spike rate difference declines in the course of multiple sequential odor stimulations, but the effect is not significant. Sucrose stimulation was applied in our experiments only during conditioning, after CS+ stimulation, and partially overlapping with it. The average response to sucrose of PE1 neurons was 56.0 Hz and of non-PE1 neurons, 61.1 Hz.
Differential conditioning: behavior
The paradigm applied here was differential conditioning combined with extinction and generalization tests (Fig. 2A). This procedure includes three odors (peppermint, limonene, and 2-octanol) and three functions [CS+ (odor forward-paired with sucrose stimulation at the antennae), CS− (the specifically unpaired odor presented in between CS+/US pairings), and Ctr (a test odor for generalization presented only during the pretest and the extinction phase)]. The three odors were balanced with respect to these three functions. Because no odor-specific effect was found in our conditioning experiments, we pooled the odors with respect to their functions. In the pretest phase, five repetitions of each CS+, CS−, and Ctr were presented in a pseudorandom sequence. The acquisition phase consisted of five trials with CS+ and CS− each. In the test phase (extinction tests) only a single stimulation with CS+, then CS− and then Ctr was given at 5, 30, and 60 min after the end of acquisition (see Materials and Methods). Because repeated exposures to the CS+ led to extinction, we applied only a single stimulation of each of the three odors at each of the three test intervals.
Figure 2.

Behavioral procedure and three learning curves. Behavioral response probability of all experimental animals (n = 13, the 7 control animals are not included here) during an initial pretest phase (5 stimulus repetitions), the acquisition phase (5 trials), and an extinction phase with tests at 5, 30, and 60 min after the end of acquisition. The three odors used were balanced with respect to their functions as CS+ (forward-paired with sucrose stimulation at the antennae during acquisition), CS− (presented in between CS+/US trials), and Ctr (control odor presented only during the pretest and the extinction phase). A, The behavioral protocol for conditioning. For the pretest phase, CS+ (black bar), CS− (light bar), Ctr (dark gray bar), and Blank (hatched bar, the animals were exposed to the air stream without odor), and these stimuli were applied in a pseudorandom sequence with a 1 min interval, as indicated in the figure schematically. At least 15 min after the last stimulation of the pretest phase, the acquisition phase (differential conditioning, see Materials and Methods) started. CS+ was followed by US with 1 s overlapping (see enlargement of time scale above). The CS+ and CS− were applied 5 times with a 2.5 min interval. The duration of all of CS+, CS−, and US was three seconds. Extinction tests were applied 5, 30, and 60 min after the last trial of the acquisition phase. B, Response probability (PER%) to CS+, CS−, and Ctr, respectively.
The acquisition process is plotted in Figure 2B. Acquisition is a fast process, reaching learning asymptote for CS+ already for the fourth conditioning trial (comparison of CS+ PER% between the pretests and the fourth acquisition trial, p < 0.01, Wilcoxon matched-pairs test). Extinction tests show significantly higher CS+ responses compared with the pretest (comparison of CS+ PER% during pretest and test at 5 min, p = 0.008; at 30 min, p = 0.012; at 60 min, p = 0.012), and no significant decrease during the three extinction tests (p > 0.5). A slight but not significant (p = 0.109) increase was found for responses to CS− during the three extinction tests. There is a strong generalization effect, indicated by a significant rise of Ctr responses between the pretest and the 5 min extinction test (p = 0.028). Generalization shows a tendency to drop during the three extinction tests but the effect is not significant (p = 0.22).
Because we shall compare the neural responses with the animal's behavior, we introduced the behavioral categories “discriminators” and “nondiscriminators” to deal with the different effects of learning: “discriminators” are defined by their responses to CS+, but not CS−, and “nondiscriminators” by their responses either to both CS+ and CS− or to neither CS+ nor CS−. The responses evaluated in assigning these two behavioral categories are the ones seen in the first extinction trial (5 min after the end of the acquisition phase). Of our 13 animals, nine belonged to the group of discriminators and four to the nondiscriminators, where all four animals responded neither to CS+ nor to CS−, and no animal responded to both CS+ and CS− (Table 1). Because repetition of extinction trials leads to decreased PER to CS+ and increased PER to CS− (Fig. 2), the respective numbers for the second extinction trial are six discriminators, seven nondiscriminators (five no CS+ or CS− response, two responses both to CS+ and CS−), and for the third extinction trial are five discriminators, eight nondiscriminators (of which five responded neither to CS+ nor to CS−, and three to both CS+ and CS−).
We have analyzed the behavioral responses to the three odors (peppermint, limonene, and 2-octanol) when each odor was used as CS+ or Ctr separately for the groups of discriminators and nondiscriminators. No bias was found for either of the three odors as CS+, CS−, or Ctr. Therefore, we pooled the data for the different odors according to their functions, and proceeded in the same way with the spike responses.
Response changes in the PE1
Mauelshagen (1993) exposed isolated honeybee heads to odor stimuli paired or unpaired with sucrose stimuli, and found an initial decrease in PE1 response to the forward-paired odor (CS+). This response change was lost within a few minutes, and was replaced by very large differences of responses to CS+, which finally disappeared in multitrial differential conditioning. An isolated bee head does not provide a behavioral monitor for learning, because no conditioned responses are seen. Thus, it has so far not been possible to correlate neural responses of PE1 with behavioral changes. Furthermore, intracellular recordings as performed by Mauelshagen (1993) were limited in time (up to 10 min), and it was unclear whether the loss of associative plasticity was attributable to deteriorating recording. The latter interpretation is supported by the finding that odor responses in Mauelshagen's (1993) recordings went up to 300 Hz, whereas we never found odor responses stronger than 160 Hz. Our extracellular recordings are stable over several hours, and learning as well as retention scores are similar to behavioral experiments in which the brain was not exposed for physiological studies (Bitterman et al., 1983; Menzel and Giurfa, 2001).
All experimental animals from which we recorded the PE1 neuron belonged to the group of discriminators (animals that responded to CS+ but not to CS− in the first extinction test) (Table 1). Therefore, all animals were included in the within-group comparison which we consider first. The response changes were statistically analyzed by three different procedures (see Materials and Methods, Statistics) which include as a first step subtraction of the spontaneous frequency from the rate response during odor stimulation (rate difference, determined separately for the three time windows W1, W2, W3). The first procedure directly compared the rate differences of CS+, CS−, and Ctr responses before and after conditioning separately. There were no significant differences in the respective values of responses to CS+, CS−, and Ctr before conditioning (all p values > 0.95). After conditioning, the rate differences were significantly reduced for CS+ compared with CS− in W1 at all three test intervals (5 min test, p = 0.0059; 30 min test, p = 0.0077; 60 min test, p = 0.0392). The respective p values for the comparison between CS+ and Ctr are as follows: 5 min test, p = 0.0394; 30 min test, p= 0. 0365; and 60 min test, p = 0.2773, indicating that generalization from CS+ to Ctr occurs very much the same as in the behavioral responses. In time windows W2 and W3 there are only significant differences for the 30 min test for CS+ versus CS− (W2: CS+ vs CS−, p = 0.0036; W3, CS+ vs CS−, p = 0.0294). The second statistical analysis procedure included the calculation of the ratio of normalized spike rates to CS+ and CS− (as well as to CS+ and Ctr) and a comparison of these values before and after conditioning. Again, there were no significant differences between the respective values of responses to CS+, CS−, and Ctr before conditioning (all p values > 0.95). After conditioning, we found significantly reduced values in W1 when comparing CS+ (p = 0.004, 0.007, and 0.039 for pretest vs 5 min, 30 min, and 60 min tests, respectively), whereas no significant reduction in responses to Ctr was seen (p > 0.6 in all of three extinction test). The third statistical analysis procedure is based on Δ, which refers to the normalized spike rate differences during the pretest and test phase and which was calculated for CS+, CS−, and Ctr and each for time windows W1, W2, and W3 (Δw1, Δw2, and Δw3, respectively) (see Materials and Methods). The responses in PE1 neurons to CS+ declined significantly in discriminators (statistics, during time window W1, p = 0.0059 in pretest vs 5 min test, p = 0.0154 in pretest vs 30 min test, p = 0.0528 in pretest vs 60 min test; during time window W2, the respective p values are 0.0068, 0.0011, and 0.0379) (Fig. 3) and did not change for CS− and Ctr (CS−: during time window W1, p = 0.9300 in pretest vs 5 min test, p = 0.4379 in pretest vs 30 min test, p = 0.9617 in pretest vs 60 min test; during time window W2, the respective p values are 0.3138, 0.4803, and 0.4708; Ctr: during the time window W1, p = 0.8108 in pretest vs 5 min test, p = 1.0000 in pretest vs 30 min test, p = 0.8724 in pretest vs 60 min test; during time window W2, the respective p values are 0.6611, 0.7917, and 0.9977). No significant differences in the odor responses were found during the time window W3, neither for CS+ nor for CS− or Ctr.
Figure 3.

Response changes Δw1 of neurons identified as PE1 neurons during the course of the experiment. A, Δw1 to CS+ of each animal (discriminators) plotted against experimental sequence (n = 5). All animals from which PE1 neurons were recorded belonged to the discriminator group (for statistics, see Materials and Methods). Each of five animals is indicated with different symbols. B, Average Δw1 of discriminators in responses to CS+, CS−, and Ctr for the three extinction tests at 5 min after the end of acquisition (black bar), at 30 min after the end of acquisition (white bar), and at 60 min after the end of acquisition (gray bar). Error bars are SEM (**p < 0.01; *p < 0.05). C, Δw1 of all responses to CS+ in five acquisition and three test phases in discriminators (ordinate) plotted against the probability of PER (abscissa). The PER% values come from the behavioral tests during acquisition and test, the Δw1 from the PE1 recordings of each animal separately. A negative correlation between Δw1 values and PER% was found (p = 0.025) with the regression line and correlation efficacy of Y = −0.26 × −18.86, r = −0.355, and R2 = 0.1261.
Because all animals in which we recorded the PE1 belonged to the group of discriminators, we have no values for nondiscriminators. Thus, the phasic and early tonic response rates decreased for CS+ but not CS− in animals that learned to respond to CS+, and no learning effect was seen in the late tonic response. To test whether behavioral CS+ response probability (PER%) relates to the response reduction of PE1 responses to CS+, we correlated these two parameters and found that such correlation exists (p = 0.025) (Fig. 3C). Because all animals from which we recorded the PE1 neuron were discriminators, we cannot say whether the response of PE1 to CS+ would also decline in nondiscriminators.
An analysis of the units was performed on an individual basis by comparing the average response rates before conditioning and during the three extinction trials. Because all the significant changes found were seen during the time windows W1 and W2, the following results apply for both W1 and W2. No PE1 neuron significantly enhanced the response to CS+ at any of the three test trial sessions. Four of five PE1 neurons significantly reduced their CS+ responses. The PE1 neuron that did not reduce its responses to CS+ enhanced its responses to CS−. Another PE1 neuron reduced its responses in time window W1 to both CS+ and CS−, but only in the 5 min test.
Because we did not record from a PE1 neuron in nondiscriminators (animals that did not show the conditioned PER response in the first extinction trial 5 min after conditioning, or gave the PER to both CS+ and CS−), we also grouped the animals according to their conditioned PER in the second and third test. In the second test (30 min after the last acquisition trial) the distribution was five discriminators, zero nondiscriminators and, in the third test (60 min after the last acquisition trial), two animals were discriminators and from the nondiscriminators, one responded neither to CS+ nor CS− (nonresponders), and two to both CS+ and CS− (responders). The average Δ values of PE1 responses to CS+ decreased and for CS− increased in the two discriminators of the third extinction test, but not in the three nondiscriminators; a statistical analysis is not appropriate because of the small numbers of animals involved. Thus, the PE1 response changes to CS− is opposite to that of CS+, a property which is not seen in non-PE1 neurons (see below).
Control animals did not show any significant response changes in either of the three time windows in the course of multiple odor stimulation. However, statistical evaluation is difficult because of the small number of animals (two animals) (Table 1). A comparison between PE1 response rate differences in experimental and control animals (between-group comparison) before and after conditioning shows no significant difference between experimental animals and control animals, although the results were close to significance. This is likely because of the small number of samples (experimental animals, n = 5; control animals, n = 2). In addition, there is a trend to decreasing responses during the pretests (Fig. 3), and this trend is compensated for if US is given during conditioning, leading to an increase of response to CS− and Ctr responses relative to the trend of decline.
Non-PE1 neurons
The same statistical analysis was applied to the responses of non-PE1 neurons. Averaging all responses from non-PE1 neurons (n = 8) (Table 1) and analyzing the effect of conditioning according to the three within-group comparison procedures (see above), we found no significant changes in their responses to CS+, neither in discriminators, nor in nondiscriminators (all p values in any of the three test procedures and in time windows W1 and W2 are >0.4) (Fig. 4). The same applies for CS− and Ctr. Control animals (n = 5) in which we recorded non-PE1 neurons showed no change in their responses to CS+ and CS− (most p values > 0.7, otherwise, CS− response in W1 in T3, p = 0.2001; CS− response in W2 in T3, p = 0.2665). A between-group comparison (experimental animals vs control animals) also shows no significant differences, neither for W1 nor for W2 (p > 0.5).
Figure 4.

Response changes Δw1 of neurons identified as non-PE1 neurons during the course of the experiment. A, Response changes to CS+ in neuron plotted against the experimental sequence. Δw1 to CS+ of the discriminators (black circle; n = 4), nondiscriminators (open circles; n = 4), and control animals (triangles; n = 5). B, Δw1 of discriminators in responses to CS+, CS−, and Ctr for the three tests at 5 min after the end of acquisition (black bar), at 30 min after the end of acquisition (white bar), and at 60 min after the end of acquisition (gray bar). Error bars are SEM. No significant differences are found between the three groups (for statistics, see Materials and Methods, Statistics, Electrophysiology). C, Δw1 of responses to CS+ of three groups of animals (ordinate) plotted against the probability of PER (abscissa) in discriminators (black circle), nondiscriminators (open circles), and control animals (triangles). The PER% values come from the behavioral tests during acquisition, the Δw1 from the recordings of non-PE1 neurons in each animal separately. Negative correlation between Δ values and PER% was found in discriminators (p = 0.016), but not in nondiscriminators or control animals. Regression lines and correlation efficiency of each group are Y = −0.246 × +9.28, r = −0.423, and R2 = 0.1787 in discriminators; Y = −0.26 × −5.66, r = −0.214, and R2 = 0.0459 in nondiscriminators; and Y = 0.34 × −4.48, r = 0.173, and R2 = 0.0301 in control animals.
Analyzing individual non-PE1 neurons separately for the three test trials we found significant reductions of CS+ responses at the following test sessions using the statistical procedure based on the Δ values: the 5 min test, one neuron (of four); 30 min test, two neurons (of four); 60 min test, one neuron (of four). These CS+ response reductions appeared only in discriminators. More specifically, one non-PE1 neuron from one animal showed a significant reduction in all three test trials, two other animals reduced their responses significantly only in the second test, and two other animals did not show any significant reduction. One of these two non-PE1 neurons responded significantly more strongly at the tests after 30 and 60 min.
Because on average no significant CS+ response changes were seen in non-PE1 neurons, the few significant CS+ response reductions appear to be compensated for by one neuron showing a significant enhancement (Fig. 4). It thus appears that the non-PE1 neurons comprise a heterogenic group of neurons with respect to their response changes in course of olfactory learning although their odor responses did not differ among themselves nor in comparison with the PE1 neuron.
Inhibitory input to the PE1 neuron
The PE1 neuron receives excitatory synaptic input from the Kenyon cells indicated by synapses between Kenyon cells and PE1 (Rybak and Mauelshagen, 1994), and large EPSPs if the recording electrode is placed in the region where the dendrites fuse, which has been considered a passive membrane region of the integrating part of the dendrites (Fig. 5) (Mauelshagen, 1993; Menzel and Manz, 2005). IPSPs appear at a low rate during spontaneous activity and periodically during odor stimulation (Fig. 5). These inhibitory inputs are prolonged for CS+ after conditioning [Mauelshagen (1993), her Figs. 6, 7]. The excitatory responses to odors in PE1 resemble the responses to electric stimulation of Kenyon cells because, in both cases, large summing EPSPs and spikes are elicited (Menzel and Manz, 2005). Therefore, the Kenyon cells reached with the electrical stimulation are less likely to be the source of the inhibitory input to PE1. The associative response reduction of spike activity in the PE1 neuron as found by Mauelshagen (1993) and here may thus result from an inhibitory input, which may be the source of associative plasticity.
Figure 5.

Intracellular recordings of PE1 from the integrating segment where the responses appear to be characterized by passive membrane properties. Arrows indicate IPSPs during spontaneous activity.
Figure 6.
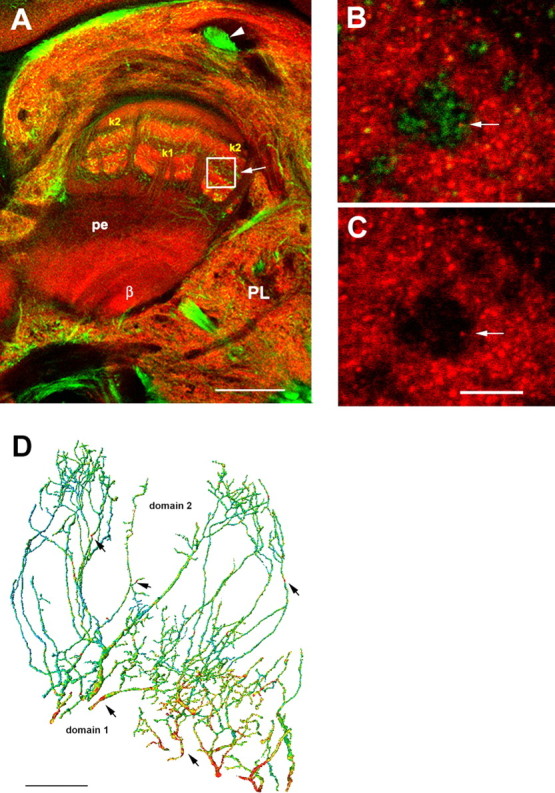
PE1 and GABA-IR in the bee brain. A, Double labeling of GABA-IR-like (green) and synapsin staining (synorf1, red) in the mb and protocerebral lobe of the bee. The optical section cuts the mb at the transition zone between the α-lobe, peduncle (pe) and β-lobe (β). The midline of the brain is to the right, and the right lower corner shows the region of the lateral horn of the left side of the brain (as seen from the animal). Axons entering the mb at its lateral side (on the right side of the mb) derive from the PCT (arrow head) and run longitudinally or transversely within the peduncle (pe). k1, k2, Zones within the dorsal peduncle. The white box indicates the approximate location of high-resolution scans in B and C. B, Transverse section within the k2 region of the peduncle with GABA-IR like profiles (green). Red dots indicate presynaptic synapsin patches (synorf1, red); the arrow indicates a synapsin spot costained with GABA. C, GABA-IR like axon (without the GABA-IR) with a synapsin spot (arrow) indicate a presynaptic density within the profile. D, The finger-like dendritic protrusions of the PE1 branch all over the cross-section of the mb at the borderline between α lobe and peduncle (see Fig. 1A). The intracellularly marked PE1 neuron shown here was reconstructed for most of its median dendritic branches. These branches are organized in two regions where the PE1 is postsynaptic, the proximal domain 1 and the distal domain 2. Red spots indicate close appositions of GABA-IR profiles (arrows), which are more numerous in domain 1. Scale bars: A, 100 μm; C, 5 μm; D, 20 μm.
Figure 7.

A model of the circuit as it relates to the PE1 neuron and its reduction of responses to the learned odor. The olfactory information is transmitted via the projection neurons from the antennal lobe to the mb calyx where they terminate on Kenyon cells in the lip region (KCo). The projection neurons also project collaterals to the lateral horn. These projection neurons also read out the associative changes within the antennal lobe. The reinforcing signal is transmitted by the VUMmx1 neuron that converges with the projection neurons and the mb Kenyon cells in the calyx of the mb (oval light gray box). In addition, sucrose-related excitation is transmitted to the calyx via an ascending gustatory pathway terminating at a subpopulation of Kenyon cells (KCs) (Schröter and Menzel, 2003). Both KCo and KCs feed the peduncle- and α-lobe-extrinsic neurons, the PE1 and PCT neurons. The PE1 also receives input from PCT neurons and projects to the lateral horn via inhibitory interneuron, e.g., those projection neurons that are GABA immunoreactive and project from the antennal lobe to the lateral horn [running in the mediolateral antennocalycal tract (mlACT)]. Descending neurons control the animal's behavior. The arrows pointing to potential sites of associative plasticity: 1: Associative plasticity in the Kenyon cells is transmitted to the PE1 neuron. In this case Kenyon cells would either have to reduce their responses to CS+ or Kenyon cells acting inhibitorily on PE1 would increase their responses to CS+; 2: associative plasticity in PCT neurons. If PCT neurons would develop a stronger response to CS+ and not change their response to CS− the PE1 would respond less to CS+ because of the putative inhibitory input from PCT neurons; 3: PE1 develops intrinsically associative plasticity, e.g., associative LTD.
We have traced the origin of the putative inhibitory input by localizing GABA-IR profiles in the immediate (<0.3 μm) vicinity of marked PE1 neurons (Fig. 6D, red dots). Such close contacts were found in the peduncle of the mb where they are more numerous in the more proximal domain 1 of spiny regions of the PE1 dendrites (Fig. 6D). This domain is located in the ventral α lobe close to the PE1 large integrating segment (Brandt et al., 2005). In this area, very small collaterals emanate from the large basal PE1 segment. Alpha lobe-extrinsic type A3 neurons belonging to the PCT were found to stain with an antibody against GABA (Fig. 6A). PCT neurons usually form fine horizontal bands within the anterior-dorsal α-lobe and project back to the input region (calyx) of the mb via the PCT (Schäfer and Bicker, 1986). Some of the collaterals running down the α lobe into the β lobe and peduncle converge there with the broad dendritic fields of the PE1 at their proximal base (domain 1). Additionally, less numerous branches reach the more distal PE1 finger like dendritic arbors (domain 2) (Fig. 6D, arrows). Although we cannot exclude the possibility that other than PCT neurons may constitute the GABA-IR contacts with PE1, we believe that they are the major source of these close appositions, which is strongly supported by the morphology of GABA-IR profiles in the peduncle. In this region, GABA axons possess synapsin spots, indicating en-passant output synapses (Fig. 6B,C). This finding indicates that PCT neurons are the potential source of inhibitory input to the PE1. The inhibitory inputs from distal and proximal dendritic branches of the PE1 neuron may be processed differently, possibly controlling spike initiation more effectively in the proximal part of the integrating segment that is closer to the putative spike initiation area. This interpretation is supported by the finding that spikes recorded in this putative passive membrane area are not fully synchronous to EPSPs, that spikes are rather broad, and that EPSPs can be very large (Fig. 5).
The excitatory input to the PE1 comes from Kenyon cells (Fig. 6, dendritic regions marked with k1 and k2). A subgroup of Kenyon cell axons (type K2, also called clawed Kenyon cells) (Rybak and Menzel, 1993) contact the PE1 at the base of the ventral α lobe, where PE1 forms broad dendritic fields. Clawed Kenyon cells are not the only input to the PE1, because Kenyon cells with somata inside the calycal cup and arborizations either in the lip, collar, and basal ring [class KI (Strausfeld, 2002)] cross the finger-like domains of PE1 (domain 2). In this region, Kenyon cells have been proven to form output synapses onto the PE1 (Rybak, 1994).
Discussion
The search for neural correlates of learning and memory requires recording from neurons during the behavioral process of acquisition and retention. Ideally, the neurons should be identifiable on the level of the individual neuron, and experiments performed with different animals should allow us to repeatedly record from the same neurons. In mammals and birds, neuron categories can be identified according to their response properties and locations, and important insight has been gained using this approach, e.g., in the case of dopamine neurons in the ventral tegmentum (Schultz and Romo, 1990), pyramidal cells in various layers of the hippocampus or adjacent cortices (O'Keefe and Nadel, 1978), or face-recognizing neurons in the lateral lobe (Peirce et al., 2000). Tracing neural activity to individually identified neurons is possible in invertebrates, but only in exceptionally favorable cases. Such a favorable case is the VUMmx1 neuron in the honeybee brain, which was found to serve the function of reward-related reinforcement in appetitive odor learning in honeybees (Hammer, 1993). Another neuron in the bee brain is the PE1 neuron, a single identified mb-extrinsic neuron that was found to reduce its responses in the course of odor learning (Mauelshagen, 1993). Eventually, several to many such individually identifiable neurons need to be recorded simultaneously, with the aim of understanding network properties in establishing and storing memories.
Extracellular recording techniques were applied because only such approaches will allow us to perform multineuron recordings with the necessary time resolution. The PE1 can be identified in extracellular recording because of its spiking properties. We therefore grouped our recordings accordingly into PE1 neurons and non-PE1 neurons, and found that they responded differently during differential odor reward conditioning. PE1 neurons reduce their responses to CS+, and non-PE1 neurons either do not change, increase, or decrease their responses to CS+.
Hungry honeybees quickly learn to respond to an odor as a conditioned stimulus (CS+) if it is followed by sucrose as a rewarding stimulus (US) (Bitterman et al., 1983). CS+ acquisition is expressed in an increasing probability within a group of animals of extending the proboscis (PER) in response to the CS+ before US onset. Neural and cellular correlates of olfactory learning have been found on the level of molecular signaling cascades, neural network and single neuron activities in the antennal lobe, the mb-extrinsic neurons, and the reward neuron VUMmx1 (for review, see Menzel, 2001; Menzel and Giurfa, 2001; Müller, 2002). It was concluded that the olfactory memory traces established in the bee brain are distributed and involve at least the antennal lobes and the mbs. We focus here on the role of mb-extrinsic neurons.
A comparison between intracellular recordings by Mauelshagen (1993) and our extracellular recordings shows that, unlike conclusions drawn from these previous studies, the PE1 neuron reduces its CS+ responses not only for a few minutes but for at least 1 h, and keeps this associative response reduction even after two preceding extinction trials. The differences between the study by Mauelshagen (1993) and ours might lie either in the short period of stable intracellular recordings (∼10 min) or in a lack of transition from short- to middle- or long-term memory under the test conditions applied by Mauelshagen (1993). She worked with isolated bee heads which do not show the conditioned PER. Isolated heads might possibly lack a modulatory input to the brain necessary for the formation of longer-lasting memory.
The question arises whether the associative reduction emerges from upstream neurons or from intrinsic properties of the PE1 (Fig. 7). PE1 receives predominantly excitatory input across the whole peduncle of the mb from Kenyon cells (Menzel and Manz, 2005), also indicated by its multimodal sensitivity (Mauelshagen, 1993; Iwama and Shibuya, 1998; Rybak and Menzel, 1998). Kenyon cells are likely to undergo associative plasticity during learning because the mb has been considered to be a major location of olfactory memory (Menzel, 2001; Heisenberg, 2003). We found previously that clawed Kenyon cells reduce their responses to CS− and do not change (or slightly enhance their responses to CS+ in a test situation resembling the one used here) (Szyszka et al., 2007). It is still possible that other olfactory Kenyon cells reduce their responses to CS+, or that Kenyon cells inhibiting PE1 enhance their responses to CS+. The later possibility is less likely, because only EPSPs and action potentials, but no IPSPs, were elicited in PE1 when Kenyon cells were electrically stimulated (Menzel and Manz, 2005), and no Kenyon cells were found to be GABA-IR. It is also possible that other neurons upstream of PE1 change their odor responses associatively (e.g., inhibitory neurons). Inhibitory input to PE1 within the peduncle of the mb can be traced to side branches of GABA-IR profiles of the PCT (Fig. 6). These neurons are both local and recurrent inhibitory neurons (Grünewald, 1999a). If the PCT neurons are responsible for the associative learning effect, either by developing associative plasticity themselves or by receiving it from upstream networks (e.g., from Kenyon cells or projection neurons, which also terminate on GABA-IR profiles in the lip region of the mb) (Ganeshina and Menzel, 2001), one would expect PCT neurons to enhance their responses to the learned odor. Grünewald (1999b) found a reduction of the response to CS+ in an associative paradigm. These previous findings are difficult to reconcile with the possibility that PCT neurons provide stronger inhibitory input to PE1 for CS+. Either there are other PCT neurons with opposing forms of associative plasticity, or the PCT neurons' associative plasticity depends on modulatory conditions which differed in Grünewald's intracellular recordings and our extracellular recordings.
Reduction of CS+ response in PE1 could also reflect an intrinsic property of this neuron (Fig. 7). PE1 develops associative long-term potentiation (LTP) when a tetanic stimulation of Kenyon cells is paired with depolarization of the PE1 (Menzel et al., 2006). To reconcile this finding with the data reported here, one would have to argue that associative LTP and its counterpart LTD are closely related and can be converted from one to the other form of lasting synaptic plasticity under particular conditions (Bear and Malenka, 1994). Spike-timing plasticity leading to either enhancement or reduction of synaptic efficiency, depending on the precise timing of spikes from Kenyon cells, was reported previously for an mb-extrinsic neuron in the locust (Cassenaer and Laurent, 2007).
It thus appears that associative plasticity in the mb may not be a property of any single neuron type or even a single neuron like the PE1, but is distributed between Kenyon cells, PCT neurons, and α lobe-extrinsic neurons. It is possible that any of these three classes of neurons is composed of a heterogenic collection of neurons with different, even opposing forms of associative plasticity. It is also possible that brain state conditions as defined by the action of modulatory systems change the forms of associative plasticity in any of these neuron types. The unique situation with a single identified neuron, the PE1, has allowed us to detect these ranges of associative plasticity, and provides us with the opportunity to trace the potential sources for these forms of plasticity.
Figure 7 presents a summary of our interpretation. As discussed above, three not mutually exclusive possibilities can be proposed for the development of reduced responses to CS+ in PE1. The PE1 projects to the lateral horn, where it synapses directly or via interneurons onto descending neurons. Descending neurons also receive input from olfactory projection neurons providing direct information from the antennal lobe. Thus, two olfactory pathways converge in the lateral horn on descending neurons, one that transmits antennal lobe information directly and one that has been integrated by the mb (Abel et al., 2001; Kirschner et al., 2006). In crickets (Huber, 1978, 1990) and Drosophila (Martin et al., 1998), the mb provides an overall inhibitory effect on behavior (walking, stridulating) because ablating the mb leads to spontaneous motor output or to a perseveration of ongoing motor activity. It was also proposed for Drosophila that the direct pathway from the antennal lobe to the lateral horn controls experience-independent behaviors, whereas the involvement of the mb is related to learned behavior (Heimbeck et al., 2007). One might, therefore, conclude that one effect of learning as transmitted by neurons like the PE1 is reflected by a reduction of inhibition, a property that would be executed if the PE1 neuron drives inhibitory neurons in the lateral horn. Neurons like the PE1 might not transmit specific information about the learned stimuli (which odor it is, at which concentration, in which context), but rather the information that “these particular stimulus combinations have been learned.”
The non-PE1 neurons cannot yet be related to any anatomical or functional type. Although our data on non-PE1 neurons is small, it is still noteworthy that both decreased and increased responses to CS+ have been found alongside an absence of associative plasticity. These associative effects were only seen in discriminators, animals that had learned to respond to CS+ and CS−. It will be important in future work to trace the connectivity of the neurons with antagonizing associative plasticity.
Footnotes
This work was supported by a Humboldt Foundation stipend to R.O. and the Deutsche Forschungsgemeinschaft (Sfb 515). We thank Dr. Carsten Duch and Maurice Meseke for providing us with the most valuable help in tracing the close attachments of immunostained profiles with the PE1 neuron. We are grateful to Drs. B. Grünewald and M. Nawrot for their suggestions on a previous version of this manuscript and to Astrid Klawitter for help with the GABA immunohistology.
References
- Abel R, Rybak J, Menzel R. Structure and response patterns of olfactory interneurons in the honeybee, Apis mellifera. J Comp Neurol. 2001;437:363–383. doi: 10.1002/cne.1289. [DOI] [PubMed] [Google Scholar]
- Bacon JP, Altman JS. A silver intensification method for cobalt-filled neurones in wholemount preparations. Brain Res. 1977;138:359–363. doi: 10.1016/0006-8993(77)90753-3. [DOI] [PubMed] [Google Scholar]
- Bear MF, Malenka RC. Synaptic plasticity: LTP and LTD. Curr Opin Neurobiol. 1994;4:389–399. doi: 10.1016/0959-4388(94)90101-5. [DOI] [PubMed] [Google Scholar]
- Bitterman ME, Menzel R, Fietz A, Schäfer S. Classical conditioning of proboscis extension in honeybees (Apis mellifera) J Comp Psychol. 1983;97:107–119. [PubMed] [Google Scholar]
- Brandt R, Rohlfing T, Rybak J, Krofczik S, Maye A, Westerhoff M, Hege HC, Menzel R. A three-dimensional average-shape atlas of the honeybee brain and its applications. J Comp Neurol. 2005;492:1–19. doi: 10.1002/cne.20644. [DOI] [PubMed] [Google Scholar]
- Cassenaer S, Laurent G. Hebbian STDP in mushroom bodies facilitates the synchronous flow of olfactory information in locusts. Nature. 2007;448:709–713. doi: 10.1038/nature05973. [DOI] [PubMed] [Google Scholar]
- Evers JF, Schmitt S, Sibilia M, Duch C. Progress in functional neuroanatomy: precise automatic geometric reconstruction of neuronal morphology from confocal image stacks. J Neurophysiol. 2005;93:2331–2342. doi: 10.1152/jn.00761.2004. [DOI] [PubMed] [Google Scholar]
- Galizia CG, Joerges J, Küttner A, Faber T, Menzel R. A semi-in-vivo preparation for optical recording of the insect brain. J Neurosci Methods. 1997;76:61–69. doi: 10.1016/s0165-0270(97)00080-0. [DOI] [PubMed] [Google Scholar]
- Ganeshina OT, Menzel R. GABA-immunoreactive neurons in the mushroom bodies of the honeybee: an electron microscopic study. J Comp Neurol. 2001;437:335–349. doi: 10.1002/cne.1287. [DOI] [PubMed] [Google Scholar]
- Goldman-Rakic PS. Cellular basis of working memory. Neuron. 1995;14:477–485. doi: 10.1016/0896-6273(95)90304-6. [DOI] [PubMed] [Google Scholar]
- Grünewald B. Morphology of feedback neurons in the mushroom body of the honeybee, Apis mellifera. J Comp Neurol. 1999a;404:114–126. doi: 10.1002/(sici)1096-9861(19990201)404:1<114::aid-cne9>3.3.co;2-r. [DOI] [PubMed] [Google Scholar]
- Grünewald B. Physiological properties and response modulations of mushroom body feedback neurons during olfactory learning in the honeybee Apis mellifera. J Comp Physiol A Neuroethol Sens Neural Behav Physiol. 1999b;185:565–576. [Google Scholar]
- Hammer M. An identified neuron mediates the unconditioned stimulus in associative olfactory learning in honeybees. Nature. 1993;366:59–63. doi: 10.1038/366059a0. [DOI] [PubMed] [Google Scholar]
- Heimbeck G, Bugnon V, Gendre N, Keller A, Stocker RF. A central neural circuit for experience-independent olfactory and courtship behavior in Drosophila. Proc Natl Acad Sci USA. 2007;98:15336–15341. doi: 10.1073/pnas.011314898. [DOI] [PMC free article] [PubMed] [Google Scholar]
- Heisenberg M. What do the mushroom bodies do for the insect brain? An introduction. Learn Mem. 1998;5:1–10. [PMC free article] [PubMed] [Google Scholar]
- Heisenberg M. Mushroom body memoir: from maps to models (review) Nat Rev Neurosci. 2003;4:266–275. doi: 10.1038/nrn1074. [DOI] [PubMed] [Google Scholar]
- Huber F. The insect nervous system and insect behaviour. Anim Behav. 1978;26:969–981. [Google Scholar]
- Huber F. Nerve cells and insect behavior-studies on crickets. Am Zool. 1990;30:609–627. [Google Scholar]
- Iwama A, Shibuya T. Physiology and morphology of olfactory neurons associating with the protocerebral lobe of the honeybee brain. J Insect Physiol. 1998;44:1191–1204. doi: 10.1016/s0022-1910(98)00084-5. [DOI] [PubMed] [Google Scholar]
- Kirschner S, Kleineidam CJ, Zube C, Rybak J, Grünewald B, Rössler W. Dual olfactory pathway in the honeybee Apis mellifera. J Comp Neurol. 2006;499:933–952. doi: 10.1002/cne.21158. [DOI] [PubMed] [Google Scholar]
- Klagges BRE, Heimbeck G, Godenschwege TA, Hofbauer A, Pflugfelder GO, Reifegerste R, Reisch D, Schaupp M, Buchner S, Buchner E. Invertebrate synapsins: a single gene codes for several isoforms in Drosophila. J Neurosci. 1996;16:3154–3165. doi: 10.1523/JNEUROSCI.16-10-03154.1996. [DOI] [PMC free article] [PubMed] [Google Scholar]
- Martin JR, Ernst R, Heisenberg M. Mushroom bodies suppress locomotor activity in Drosophila melanogaster. Learn Mem. 1998;5:179–191. [PMC free article] [PubMed] [Google Scholar]
- Mauelshagen J. Neural correlates of olfactory learning in an identified neuron in the honey bee brain. J Neurophysiol. 1993;69:609–625. doi: 10.1152/jn.1993.69.2.609. [DOI] [PubMed] [Google Scholar]
- Menzel R. Searching for the memory trace in a mini-brain, the honeybee. Learn Mem. 2001;8:53–62. doi: 10.1101/lm.38801. [DOI] [PubMed] [Google Scholar]
- Menzel R, Giurfa M. Cognitive architecture of a mini-brain: the honeybee. Trends Cogn Sci. 2001;5:62–71. doi: 10.1016/s1364-6613(00)01601-6. [DOI] [PubMed] [Google Scholar]
- Menzel R, Manz G. Neural plasticity of mushroom body-extrinsic neurons in the honeybee brain. J Exp Biol. 2005;208:4317–4332. doi: 10.1242/jeb.01908. [DOI] [PubMed] [Google Scholar]
- Menzel R, Müller U. Learning and memory in honeybees: from behavior to neural substrates. Annu Rev Neurosci. 1996;19:379–404. doi: 10.1146/annurev.ne.19.030196.002115. [DOI] [PubMed] [Google Scholar]
- Menzel R, Erber J, Masuhr T. Learning and memory in the honeybee. In: Barton-Browne L, editor. Experimental analysis of insect behaviour. Berlin: Springer; 1974. pp. 195–217. [Google Scholar]
- Menzel R, Brembs B, Giurfa M. Cognition in invertebrates. In: Kaas JH, editor. Evolution of nervous systems, Vol II: Evolution of nervous systems in invertebrates. Oxford: Academic; 2006. pp. 403–422. [Google Scholar]
- Mizunami M, Okada R, Li YS, Strausfeld NJ. Mushroom bodies of the cockroach: Activity and identities of neurons recorded in freely moving animals. J Comp Neurol. 1998;402:501–519. [PubMed] [Google Scholar]
- Müller U. Learning in honeybees: from molecules to behaviour. Zool. 2002;105:313–320. doi: 10.1078/0944-2006-00075. [DOI] [PubMed] [Google Scholar]
- Okada R, Ikeda J, Mizunami M. Sensory responses and movement-related activities in extrinsic neurons of the cockroach mushroom bodies. J Comp Physiol A Neuroethol Sens Neural Behav Physiol. 1999;185:115–129. [Google Scholar]
- O'Keefe J, Nadel J. New York: Oxford UP; 1978. The hippocampus as a cognitive map. [Google Scholar]
- Peirce JW, Leigh AE, Kendrick KM. Configurational coding, familiarity and the right hemisphere advantage for face recognition in sheep. Neuropsychologia. 2000;38:475–483. doi: 10.1016/s0028-3932(99)00088-3. [DOI] [PubMed] [Google Scholar]
- Rolls ET, Critchley HD, Mason R, Wakeman EA. Orbitofrontal cortex neurons: role in olfactory and visual association learning. J Neurophysiol. 1996;75:1970–1981. doi: 10.1152/jn.1996.75.5.1970. [DOI] [PubMed] [Google Scholar]
- Rybak J. Freie Universität Berlin; 1994. Die strukturelle organisation der pilzkörper und synaptische konnektivität protocerebraler interneuronen im gehirn der honigbiene, apis mellifera. Eine licht- und elektronenmikroskopische studie. PhD thesis. [Google Scholar]
- Rybak J, Mauelshagen J. The PE-1 neuron of the honeybee- an efferent pathway from the mushroom bodies to the protocerebral lobe. In: Elsner N, Breer H, editors. Proceedings of the 22nd Göttingen Neurobiology Conference 1994; Stuttgart: Georg Thieme; 1994. p. 830. [Google Scholar]
- Rybak J, Menzel R. Anatomy of the mushroom bodies in the honey bee brain: the neuronal connections of the alpha-lobe. J Comp Neurol. 1993;334:444–465. doi: 10.1002/cne.903340309. [DOI] [PubMed] [Google Scholar]
- Rybak J, Menzel R. Integrative properties of the Pe1-neuron, a unique Mushroom body output neuron. Learn Mem. 1998;5:133–145. [PMC free article] [PubMed] [Google Scholar]
- Schäfer S, Bicker G. Distribution of GABA-like immunoreactivity in the brain of the honeybee. J Comp Neurol. 1986;246:287–300. doi: 10.1002/cne.902460302. [DOI] [PubMed] [Google Scholar]
- Schröter U, Menzel R. A new ascending sensory tract to the calyces of the honeybee mushroom body, the subesophageal-calycal tract. J Comp Neurol. 2003;465:168–178. doi: 10.1002/cne.10843. [DOI] [PubMed] [Google Scholar]
- Schröter U, Malun D, Menzel R. Innervation pattern of suboesophageal VUM neurons in the honeybee brain. Cell Tissue Res. 2007;327:647–667. doi: 10.1007/s00441-006-0197-1. [DOI] [PubMed] [Google Scholar]
- Schultz W. Predictive reward signal of dopamine neurons. J Neurophysiol. 1998;80:1–27. doi: 10.1152/jn.1998.80.1.1. [DOI] [PubMed] [Google Scholar]
- Schultz W, Romo R. Dopamine neurons of the monkey midbrain: contingencies of responses to stimuli eliciting immediate behavioral reactions. J Neurophysiol. 1990;63(3):607–624. doi: 10.1152/jn.1990.63.3.607. [DOI] [PubMed] [Google Scholar]
- Strausfeld NJ. Organization of the honey bee mushroom body: representation of the calyx within the vertical and gamma lobes. J Comp Neurol. 2002;450:4–33. doi: 10.1002/cne.10285. [DOI] [PubMed] [Google Scholar]
- Sutherland GR, McNaughton B. Memory trace reactivation in hippocampal and neocortical neuronal ensembles. Curr Opin Neurobiol. 2000;10:180–186. doi: 10.1016/s0959-4388(00)00079-9. [DOI] [PubMed] [Google Scholar]
- Szyszka P, Okada R, Galkin A, Menzel R. Olfactory learning effects measured in the honeybee mushroom bodies. Presented at Symposium 2 of the 31th Göttingen Neurobiology Conference/6th Meeting of the German Neuroscience Society; Göttingen, Germany. 2007. [Google Scholar]