Abstract
Neural ensembles were recorded from the CA3 region of rats running on T-based decision tasks. Examination of neural representations of space at fast time scales revealed a transient but repeatable phenomenon as rats made a decision: the location reconstructed from the neural ensemble swept forward, first down one path and then the other. Estimated representations were coherent and preferentially swept ahead of the animal rather than behind the animal, implying it represented future possibilities rather than recently traveled paths. Similar phenomena occurred at other important decisions (such as in recovery from an error). Local field potentials from these sites contained pronounced theta and gamma frequencies, but no sharp wave frequencies. Forward-shifted spatial representations were influenced by task demands and experience. These data suggest that the hippocampus does not represent space as a passive computation, but rather that hippocampal spatial processing is an active process likely regulated by cognitive mechanisms.
Keywords: hippocampus, place cell, neural ensemble, vicarious trial, visual error, decision making, cognition
Introduction
The hippocampus and associated medial temporal lobe areas play a central role in declarative and episodic memory and damage within these areas produces profound deficits (Scoville and Milner, 1957; Squire, 1992; Nadel and Moscovitch, 1997). These types of memory can be characterized by replay or recall of previously encoded information and experience (Loftus and Palmer, 1974; Tulving, 1984; Squire, 1992; Cohen and Eichenbaum, 1993). More recently, damage to the hippocampus has also been shown to correspond to deficits in imagining new experiences (Hassabis et al., 2007) and supports the assertion that similar neural mechanisms may provide the basis for experiential construction of the past and future. Although many computational models suggest mechanisms by which the hippocampus might mediate such memory functions (McNaughton and Morris, 1987; Redish, 1999; Howard et al., 2005; Jensen and Lisman, 2005), direct observations of the neurophysiological mechanisms underlying such functions have been limited.
Among the clearest observations linking behavior, memory and medial temporal lobe neurophysiology has been the hippocampal place cell (O'Keefe and Nadel, 1978; Redish, 1999). Place cells display high levels of spatial selectivity, primarily firing within a small area called a place field. Place cells have been shown to consistently disambiguate different environments (Leutgeb et al., 2005; Wills et al., 2005). However, these analyses examined neural activity at long time scales (on the order of minutes) and do not qualitatively match the short temporal specificity that characterizes declarative or episodic memory as defined by human studies (Squire, 1992; Cohen and Eichenbaum, 1993; Maguire et al., 1997; Howard et al., 2005; Hassabis et al., 2007). Use of declarative or episodic memory as exemplified by route planning (Maguire et al., 1997) require much less time than the physical instantiation of these solutions (on the order of fractions of seconds to seconds rather than minutes).
From an information processing perspective, declarative memory use can be conceptualized as the use of learned information outside the place or context of its initial presentation. Applied to hippocampal place cells, this perspective suggests that place cell activity that occurs outside a cell's place field might signal an information processing state corresponding to the use of declarative-like memory in rats. Such place field activity has been observed to show a replay of recent experience at fast time scales during sharp-wave ripple complexes occurring during task performance (Foster and Wilson, 2006; Jackson et al., 2006; O'Neill et al., 2006) and during slow-wave sleep after task performance (Wilson and McNaughton, 1994; Kudrimoti et al., 1999; Nadasdy et al., 1999; Lee and Wilson, 2002). Place cells have also been observed to change firing probabilities quickly in relation to the ongoing theta rhythm, showing fast dynamics in spatial representation that flow from slightly behind the animal to slightly forward of the animal within a theta cycle (phase precession) (O'Keefe and Recce, 1993; Skaggs et al., 1996); however, the role of phase precession in navigation is still unknown. Transient nonlocal spatial representations that occur during task performance might allow the consideration of potential alternatives, and might be indicative of a trajectory planing process (Daw et al., 2005; Jensen and Lisman, 2005; Ferbinteanu et al., 2006). To examine whether nonlocal representations might occur during rodent navigation, we recorded large neural ensembles from the hippocampi of rats trained on two spatial decision tasks. We found transient nonlocal representations occurring at critical choice points.
Materials and Methods
Animals.
Male Fisher–Brown–Norway hybrid rats (Harlan, Indianapolis IN, age 7–14 months at time of implantation) were maintained on a synchronous day/night cycle. Animals were handled for at least 1 week before beginning behavioral training. Rats were food deprived to no less than 80% of their body weight during behavioral training; water was available ad libitum in the home cage at all times. All procedures were in accordance with National Institutes of Health guidelines for animal care and were approved by the Institutional Animal Care and Use Committee at the University of Minnesota.
Surgery, recording, and histology.
After pretraining to proficiency, rats were implanted with a 14-tetrode microdrive (Neuro-Hyperdrive; Kopf, Tujunga, CA) directed toward the CA3 hippocampal subfield (anteroposterior −3.8 mm and mediolateral 4.0 mm from bregma). Briefly, rats were anesthetized with Nembutal (sodium pentobarbital, 40–50 mg/kg; Abbott Laboratories, North Chicago, IL) and maintained using isoflurane (0.5–2% isoflurane vaporized in medical grade oxygen). The hyperdrive was secured in place with dental acrylic (Perm reline and repair resin; Hygenic, Akron, OH) surrounding eight anchor screws and a ground screw. Immediately after surgery, animals received ketoprophen (5 mg/kg, s.c.). After surgery, three doses of 5 ml sterile saline (0.9%) mixed with Baytril (in a dose of 25 mg/kg) were administered subcutaneously (one dose every 12 h). Animals were allowed to recover in an incubator until they were ambulatory. Once animals were ambulatory, 0.8 ml Children's Tylenol (Fort Washington, PA) was administered orally. For 2 d after surgery, rats had access to water containing Children's ibuprophen (15 mg/kg, available in a dilution of 15 mg/kg/20–25 ml of water). Rats were allowed 2 d to recover from surgery before resuming behavioral experiments. In the first few hours postsurgery, all tetrodes were advanced ∼1 mm. Twelve tetrodes were slowly advanced toward the pyramidal cell layer over the 10 d after surgery, one tetrode was lowered to the hippocampal fissure, and one tetrode was left in corpus callosum or a quiet region of cortex to be used as a superficial reference.
Spike activity was recorded using a 64 channel Neuralynx (Tucson AZ) Cheetah system, which sampled voltage at 32 kHz for each channel, filtered between 600 Hz and 6 kHz. When the voltage on any of the four channels of a single tetrode reached threshold, a 1 ms window of the spike waveform on each of the four channels on the tetrode was recorded and timestamped with microsecond resolution (Neuralynx). After the experiment, spikes were manually clustered into putative cells on the basis of their waveform properties (MClust 3.4, Redish et al., http://web.ahc.umn.edu/∼redish/mclust) based on automatically derived clusters found via k-means and expectation-maximization algorithms (KlustaKwik 1.5, Harris, http://klustakwik.sourceforge.net/). Local field potentials (LFPs) were sampled at 2 kHz and bandpass filtered from 1 to 425 Hz. Cross-frequency correlation analysis was conducted as in the study by Masimore et al. (2004). Data for theta-frequency analysis were taken from the fissure tetrode. Data for high-frequency ripple analysis were taken from pyramidal cell layer tetrodes. CA3 was initially distinguished by the presence of low frequency sharp-wave ripples at the pyramidal cell layer (Ylinen et al., 1995; Csicsvari et al., 1999).
After task performance, rats were overdosed on nembutal and perfused with formalin. After 24 h in formalin, brains were transferred to a 30% sucrose-formalin solution, sliced, and stained with cresyl violet using standard procedures. All recording locations were verified to lie in the CA3 region of the dorsal hippocampus.
The multiple-T task.
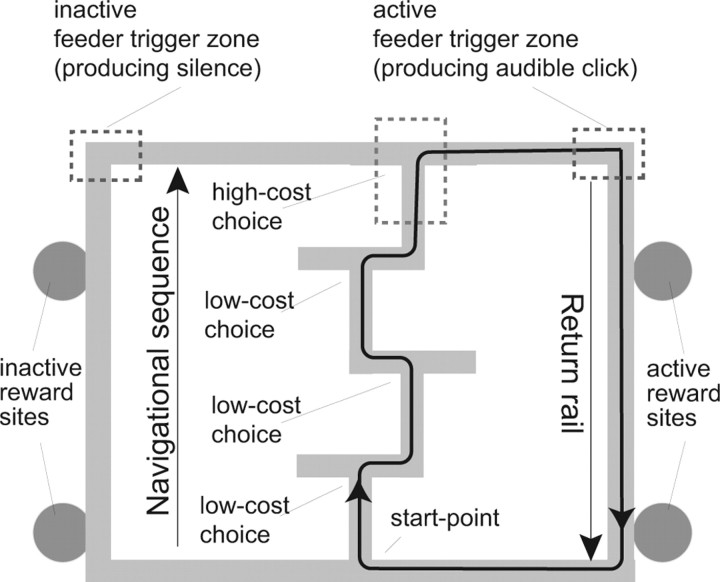
The task was identical to that used by Schmitzer-Torbert and Redish (2002, 2004) (see Fig. 1). The task consisted of a sequence of 4 T turns with return rails after the final turn, making it a lap based task. Food was provided at two sites on each return rail. On any specific day, only one pair of sites (i.e., the right or left) provided food reward. However, both sites on that rewarded side provided food reward on each lap. Each feeder provided two 45 mg food pellets (Standard Formula P; Research Diets, New Brunswick, NJ) on each lap. The sequence remained constant within a day, but changed between days. Errors were defined as entry into an incorrect maze arm. Rats ran one 40 min session each day. The maze size was 165 × 165 cm and the track width was 10 cm. There are 24 = 16 available track configurations. On a 4T maze, the chance of making a lap with no error is (0.5)4 = 0.0625.
Figure 1.
The multiple-T maze. The task consists of four T choice points with food reward available at two sites on each return rail. Only feeders on one side of the track were rewarded in each session.
The cued-choice task.
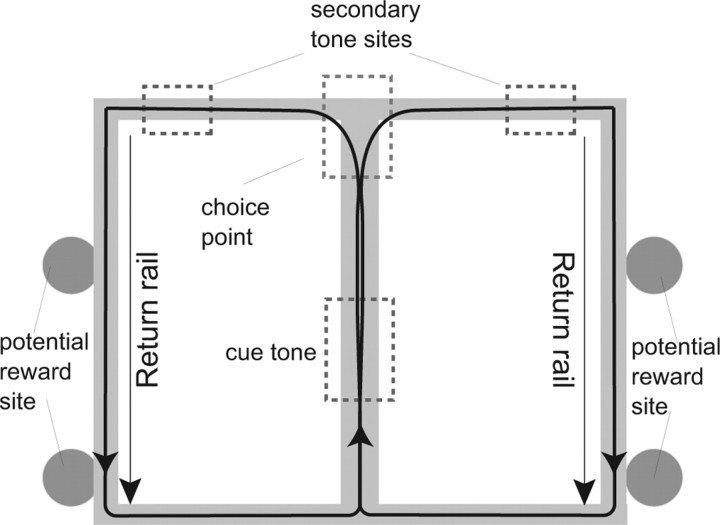
The task consisted of a single T turn with return rails after the final turn, making it a lap based task. Food was provided at two sites on each return rail. On any specific lap, only one pair of sites (i.e., the right or left) provided food reward. A low-frequency (3 kHz, left) or high-frequency (6 kHz, right) cue tone played on the center stem and indicated which food sites would provide reward. A second tone that matched the cue tone sounded on the T arms if the rat made the correct decision (see Fig. 2). As a result, a rat often reversed its course if no tone was encountered on the T arms. Errors were defined as entrance into the incorrect tone area. Rats ran one 30–40 min session each day. The maze size was 165 × 165 cm and the track width was 10 cm.
Figure 2.
The cued-choice maze. The task consists of a single T turn with food reward available at two sites on each return rail. On each lap, a cue tone on the center stem (red dashed box) signaled whether the left or right arm would be rewarded. If and only if the rat made the correct turn, a matching tone would play at the T arm (blue dashed boxes).
Rats were trained following a pretraining protocol that first required the rats to run for laps to a single side of the track whereas the other side was blocked. The tone corresponding to the appropriate side was played at the primary and secondary cue sites on all laps and all laps were rewarded. After single-side pretraining, each rat was given two or three sessions of directed pretraining where they were blocked from making incorrect decisions. During this phase, the rewarded side was determined according to pseudorandom order; reward was available pseudorandomly at the left or right feeders on each trial, but the number of left rewards and the number of right rewards was constrained to be equal within each 10- or 20-trial block. After directed pretraining, the rats were provided undirected sessions with pseudorandom ordered blocks of 10 or 20 laps. This ensured that the proportion of left and right choices remained approximately constant independent of the total number of laps run on a particular day, but also ensured that any decision process that did not take the cue-tone into account would lead the rat to chance (50% correct). All neurophysiological analyses were taken from sessions in this final phase, which precluded the availability of any strategy that did not take the cue tone into account.
Place fields and extrafield firing.
Place fields were identified as contiguous pixels with areas of >120 cm2 with average activity >20% of the field maximum rate (Huxter et al., 2003). Extrafield firing was identified as spikes occurring outside of these defined place fields.
Reconstruction at fast time scales.
We extended the recursive Bayesian decoding framework of Brown et al. (1998) by explicitly allowing the possibility that neural representations may operate on multiple (cognitive) time scales potentially different from behavioral time scales (Johnson et al., 2008). For completeness, the complete decoding algorithm is presented below.
The decoding algorithm uses Bayes' theorem to recursively estimate the position x⃗t of the animal in the maze at time t based on the spiking activity of an ensemble of neurons through time t, St. The algorithm makes this position estimate in two parts: a state prediction for a subsequent time step based on a dynamic state model p(x⃗t x⃗t−1) and a correction of the prediction according to newly observed spikes. The predictive component finds the probability of the animal's position at time t conditioned on previous position probability p(x⃗t−1|St − 1) according to the following equation:
 |
whereas the correction component modifies this probability based on a newly acquired set of spike observations as follows:
 |
Here, s⃗t is the (binary) spike observations at time t, St = {s1,… St} is the spiking history of the ensemble, and the dynamic model p(x⃗t|x⃗t−1) is the probability that an animal will occupy position x⃗t given its last position x⃗t−1. The dynamic model effectively filters spiking data according to previous position probabilities. Because our interest was in the behavior of the hippocampal representation of space rather than simply animal behavior, we used a Gaussian transition kernel to describe the temporal evolution of the representation. This transition model introduces no directional bias into decoding estimates. We exploited the Markov property to allow the transition model to evolve faster than behavior by modifying the transition kernel by a temporal scaling factor n such that the transition probability at n steps into the future is given by the following:
 |
In the spatial case, the scaling factor n acts as the spatiotemporal compression factor and for an effective dynamic model p(x⃗t|x⃗t−1)eff = p(x⃗t|x⃗t−1)basen. Using the Gaussian transition kernel p(x⃗t|x⃗t−1)eff in place of the base dynamic model in equation 1 allows for decoding of neural representations with transition dynamics n times faster than animal behavior. These methods are described in additional detail in Johnson et al. (2008). All decoding results were found using a 4–8× compression factor.
The reconstruction analysis required no formal definition of place fields. For computational simplicity, spiking activity across the ensemble was assumed to be conditionally independent. Thus, p(s⃗t|x⃗t) was found by a product of single-unit probabilistic tuning curves p(si|x⃗), where i is a cell index. Each single-unit probability was found by binning the rat's positions during spiking for a given cell across the entire session and normalizing by the number of position samples found in each bin. The base transition model p(x⃗t|x⃗t−1)base was found by fitting the distances traveled by the animal ‖x⃗t − x⃗t−1‖ across the entire session as a normally distributed random walk. The resulting probability of transition to a new spatial state was thus dependent only on the distance of the trajectory required for the spatial transition and was independent of the spatial direction of the transition. Computations were performed over positions binned onto a base 32 × 32 grid (∼5 × 5 cm per bin) with time steps of 20 ms. To reduce computing time, unvisited grid elements were removed.
Nonlocality of reconstruction: error distance.
The nonlocality of reconstruction was calculated as the radial distance between the decoded maximum a posteriori position and the animal's true position. Because of differences in sampling rates (reconstructed positions were sampled at 25 Hz at 40 ms intervals while video tracking data were sampled at 60 Hz), video tracker samples were interpolated (basic spline; Matlab) to obtain matched times.
Behavioral analyses: pausing and variability of orientation of motion.
Linear velocity was calculated using the adaptive windowing procedure proposed by Janabi-Sharifi et al. (2000). This algorithm provides for both accurate speed estimates and an accurate estimate of the time of speed change. Locations with a speed of <1 cm/s were identified as pausing locations. Orientation of motion was calculated from the arctangent of the dx and dy terms of the linear velocity. Variability of orientation of motion was determined by applying the Janabi-Sharifi et al. (2000) algorithm to the orientation term. Locations with variability of motion ≥120°/s were defined as high-orientation variability locations.
Behavioral analyses at the “choice point.”
A small rectangle was identified around the final choice of the multiple-T maze and the top of the central arm of the cued-choice maze (see Figs. 8, 9). Anytime the animal entered this rectangle from the navigation sequence (multiple-T) or the central arm (cued-choice) was defined as a “choice.” The time spent at the choice point began when the animal entered the choice point from the south and ended when the animal left the rectangle, turning either left or right. Times in which the animal returned across the choice-point rectangle after correcting an error (i.e., entering from the east or west) were not included in choice analyses.
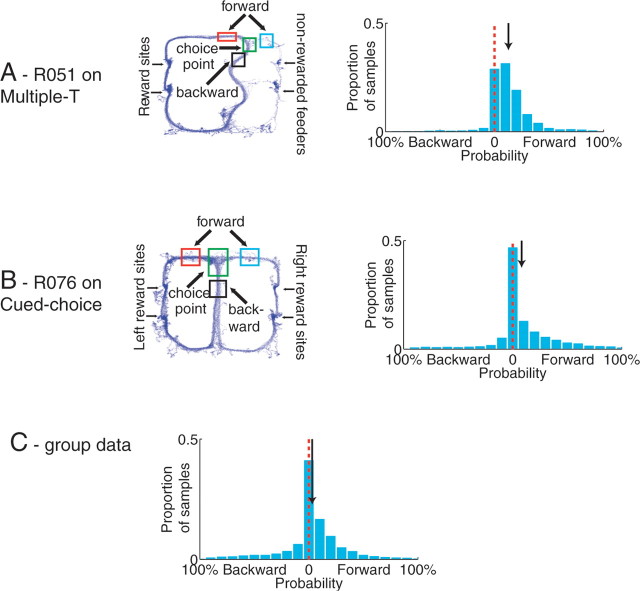
Figure 8.
The nonlocal reconstruction events occurring at the choice point are forward of the animal. A, B, Specific examples from two data sets. Three regions of interest were defined (to the left of the animal, to the right of the animal, and behind the animal). Proportions of reconstructed probability p(x|S) for each region were measured. Red line indicates 0, and the black arrow indicates the median. The median was significantly >0 in all measured data sets. A, Multiple-T. B, Cued-choice. C, Joint probability between forward probability intensity and backward probability intensity (log units). Note the strong preference for forward over backward.
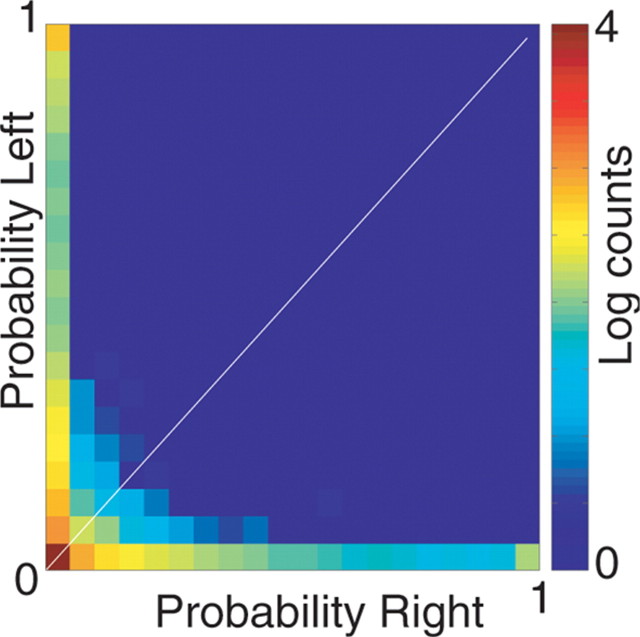
Figure 9.
The nonlocal reconstruction events occurring at the choice point are concentrated in each arm separately. Joint probability of probability intensity concentrated on each arm (log units). Note the strong preference for one arm over the other with no joint probability in both directions simultaneously.
Dynamics of the forward sweep.
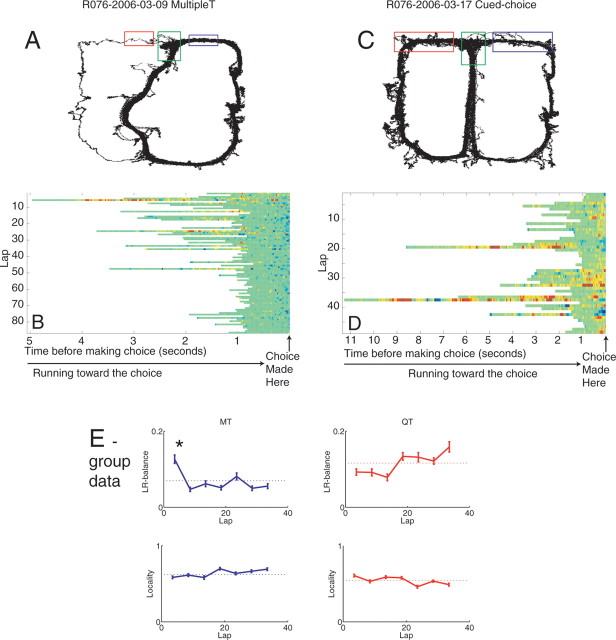
The forwardness of the distribution was measured as the difference between the proportion of the reconstructed probability occurring in front of the animal (see Fig. 8, left and right areas) and the proportion of the reconstructed probability occurring behind the animal (see Fig. 8, black areas). The joint probability of the forward direction was measured as the proportion of the reconstruction probability in the left and right areas (see Fig. 9). The left–right (LR) balance of the forward sweep was measured as the absolute value of the difference between the proportions of the reconstructed probability distribution p(x|S) occurring in the left and right areas (see Fig. 17, red and blue rectangles). The mean LR balance was measured for all multiple-T sessions and for all cued-choice sessions. ANOVA was used to assess for significant effects and included task and lap as factors. Significant differences were then identified post hoc using T tests with stringent α = 0.0001 thresholds. The locality of the reconstruction was measured as the proportion of the reconstructed probability occurring in the central area (green rectangle) (see Fig. 17). In these analyses, only the first 40 laps were included in the analyses so that all sessions could be included.
Figure 17.
Choice point behavior and neural activity changes as a function of task and experience. Both time in the center stem and nonlocal activity decreased with experience on the multiple-T task; no such changes were observed on the cued-choice task. Plots show spatial neural activity at the choice point (colors) localized to the choice point (green), the left arm (red), or the right arm (blue). Laps increase from top to bottom. Data are presented as time series until exit from the choice point in 40 ms samples. A, B, Multiple-T. C, D, Cued-choice task. E, Group data. LR balance was defined as the mean absolute difference between the probabilities in the left and right arm areas for each lap. The LR balance was significantly increased only on the first five laps of the multiple-T task. The locality was the mean probability within the central choice point area for each lap. For details, see Materials and Methods.
Sweep identification.
Sweep times at the choice point were obtained by visual inspection. For this analysis, reconstruction estimates were found at 20 ms intervals. Sweeps were identified as coherent deviation of the posterior distribution from the animal's actual position that exceeded typical phase precession deviations and which lasted for >40 ms (three time slices). Phase precession was observed as the animal approached the choice point and also at the choice point. Start times were judged to occur as the probability distribution strongly matched the animal's actual position at sweep initiation. Stop times were judged to occur as the probability distribution returned to the animal's actual position. A small number of sweeps (<3%) contained incoherent deviation of the posterior distribution (very broad and high entropy) and were removed from subsequent analysis. All sweep time judgments were performed blind to spiking or local field potential data.
Local field potential analysis.
The frequency composition of local field potentials at the choice point was examined using frequency-detection methods capable of detecting transient oscillatory events in long data series (Masimore et al., 2004). The method calculates the cross-frequency self-coherence within a signal. Because local field potential oscillations signals do not occur at a single, sharp frequency (i.e., sharp-wave ripple complexes include components from the 100–220 Hz range) (O'Keefe and Nadel, 1978), they appear as identifiable pockets of high correlation in the cross-frequency correlation plot (Masimore et al., 2004).
Subsequent analysis examined specific frequency ranges or frequencies of interest. Sharp-wave (SW) ripples were identified as epochs in which the local field potential power increased to >7σSW within the 100–250 Hz frequency range (Csicsvari et al., 1999). The SD of the ripple power σSW was found from all data collected within the session. Similarly, gamma power was examined in the 30–80 Hz frequency range and was also normalized by the SD (σg) for comparison. The SD of gamma power σg was found from all data collected within the session.
LFP phase.
LFP data were bandpass filtered at theta frequencies between 6 and 10 Hz (128th order). Theta phase was estimated using basic Hilbert transform methods (Matlab). To determine whether sweeps times were aligned with theta, a phase analysis compared the distribution of phases at sweep start and end times versus a random distribution using Watson's test for circular data (Zar, 1999).
Results
Behavior
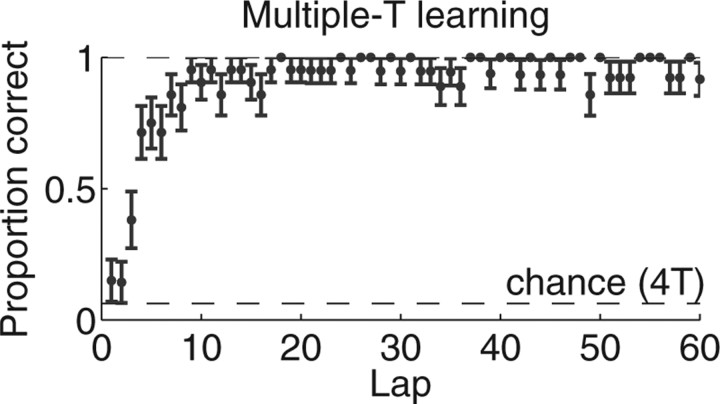
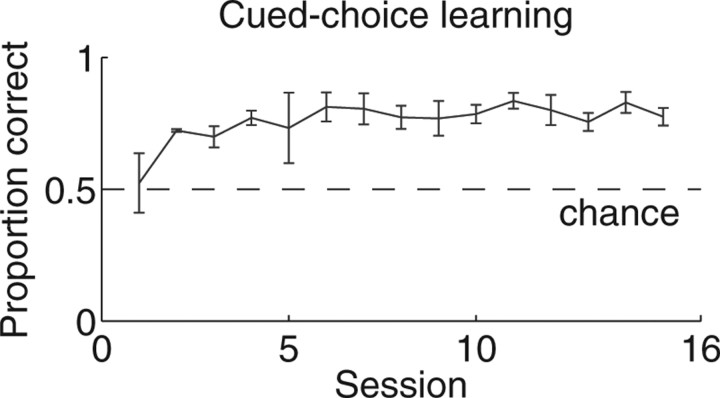
Rats learned to run both the multiple-T (Fig. 1) and cued-choice (Fig. 2) tasks successfully (rats made significantly more correct turns than chance; multiple-T, binomial test, p < 10−5; cued choice, binomial test, p < 0.05). On the multiple-T task, rats began not different from chance and quickly reduced errors within a single session (Fig. 3). On the cued-choice task, rats chose correctly better than 70% of the time (Fig. 4). Because of the pretraining protocol in which each cue tone was associated with a direction while the other side was blocked, it was possible for rats to start the open (decision making) phase of the cued-choice task above chance.
Figure 3.
Learning on the multiple-T task. Within each session, the probability of completing a lap without an error started not significantly different from chance and increased quickly over the initial laps. The mean and SE are shown for 21 novel sessions over six animals.
Figure 4.
Learning on the cued-choice task. Over 15 sessions, the probability of making the correct choice increased significantly. The mean and SE are shown for both left and right choices over two animals.
Electrophysiology
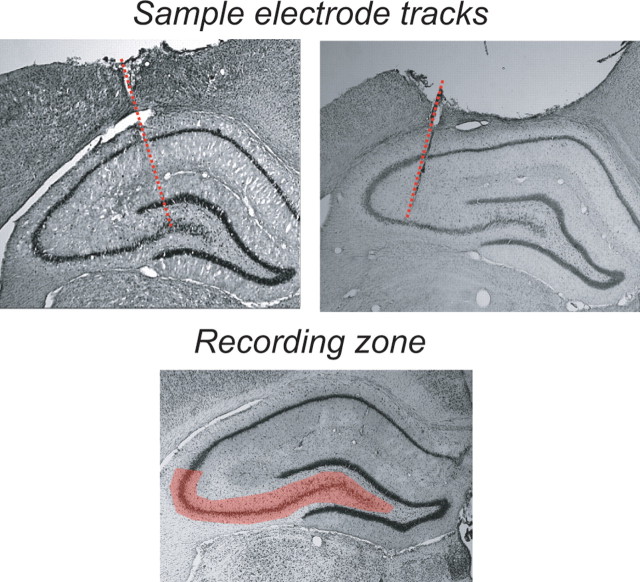
Two hundred thirty-seven spike-trains were recorded from the dorsal CA3 region of three rats (four sessions with ensembles of 33–72 cells) (Table 1). Electrodes were confirmed to lie in the CA3 region of the hippocampus (Fig. 5).
Figure 5.
Recording sites came from the CA3 region of hippocampus.
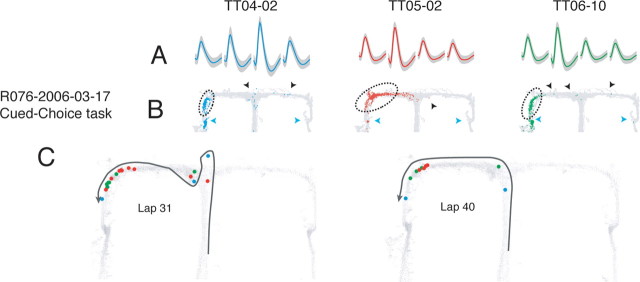
Individual cells showed well defined place fields and sometimes multiple place fields similar to other track based tasks. The distribution of place fields covered the environment (place field coverage ranged from two to 25 cells at each pixel). However, these well isolated cells also displayed scattered spiking activity outside their place fields during specific behaviors. Extrafield spiking occurred simultaneously across a subset of the neural ensemble at feeder sites during grooming, eating, and other pausing behaviors during sharp waves punctuating hippocampal nontheta, large-amplitude irregular activity (LIA) states (consistent with previous observations of reactivation and replay at feeder sites) (Kudrimoti et al., 1999; Jensen and Lisman, 2000; Foster and Wilson, 2006; O'Neill et al., 2006; Jackson et al., 2006). However, extrafield firing also occurred during the theta local field potential state, coincident with pausing behavior at the final choice point of the multiple-T task, at the main choice point of the cued-choice task, and as the rat revised his choice after making a decision (error correction).
Extrafield firing at the high-cost decision point
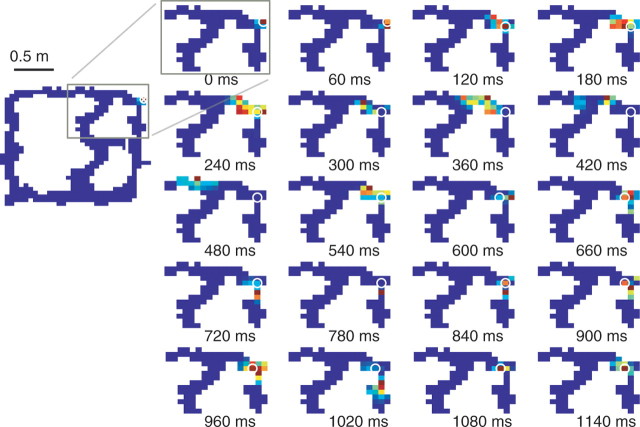
When the rat reaches the end of the navigation sequence on the multiple-T maze, he faces a high-cost choice; making the incorrect choice means a long (≥3 m) journey around the track before being given another chance. Rats often paused at that final choice. During those pauses, cells with primary place fields on the top arm and return rails fired spikes even though the rat was outside the cell's place field (Fig. 6). Although the reconstructed distribution p(x|S) tracked the animal well through the main path of the maze, when the rat paused at the final choice, the reconstructed distribution became nonlocal, sweeping ahead of the rat, first down one choice and then the other (Fig. 7, supplemental movies 1–3, available at www.jneurosci.org as supplemental material). This nonlocal neural activity occurred reliably when the animal paused at the final choice of the sequence. These events were rare, but reliably observable, occurring at a rate of 0.63 ± 0.21 sweeps/s (mean ± SE, calculated over sessions), while animals were at the choice point. Sweeps lasted for 0.15 ± 0.025 s (mean ± SE, calculated over sessions). Animals spent an average of 9 ± 2% (mean ± SE, calculated over sessions) of their time at the choice point in these nonlocal representations; during the remainder of the time, representations were primarily local. This meant that animals showed 0.7 ± 0.2 sweeps/lap (mean ± SE, calculated over sessions) (Table 2).
Figure 6.
Extrafield firing in hippocampal place cells at the choice point on the cued-choice task. A, Average waveforms (gray; SD) for three simultaneously recorded, well isolated place cells. B, Spatial activity of each cell across the full session. The light gray lines indicate the rat's positions. Colored dots indicate the rat's position at the time of a spike. Blue triangles indicate feeder locations; black triangles indicate extrafield spiking. Dotted lines delineate place field boundaries. Place fields were defined as a contiguous region with an average firing rate exceeding 20% peak field rate (Huxter et al., 2003; Leutgeb et al., 2004). Note the sparseness preceding the place field in the red cell (TT05-02) in B. It is possible that some of this sparse early activity is also extrafield firing. Classically defined place fields are included for illustration only; all spikes were included in all analyses. C, Place cell activity on specific trajectories. Light gray lines again indicate animal positions across the full session. Colored dots show animal positions at the time of cell spiking. Black trajectory arrows indicate direction of motion along the trajectory. Note that extrafield firing primarily occurs at the choice point.
Figure 7.
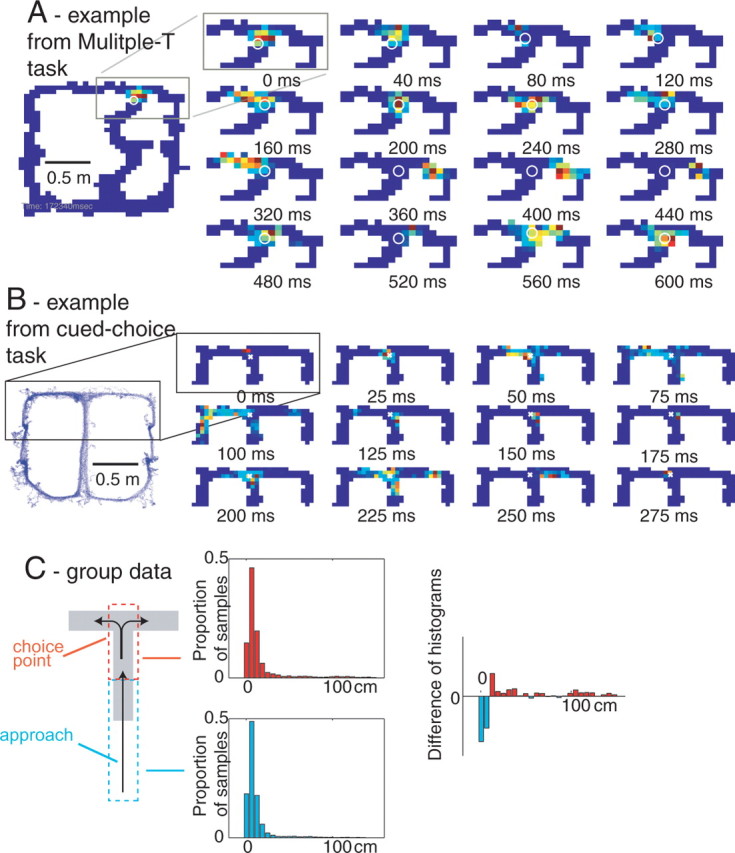
Forward-shifted neural representations at the choice point. A, B, The representation closely tracked the rat's position through the stem of the final T choice point for both the multiple-T (A) and cued-choice tasks (B). When the rat paused at the final choice point, the representation moved ahead of the animal and sampled each arm. The representation intensity is shown in pseudocolor (red, high probability; blue, low probability) and the animal's position shown as a white open circle. C, Distribution of distances between reconstructed location and actual location for the choice point (red, top) and for the immediately preceding duration-matched approach to the choice point (cyan, bottom). The approach contains more local representations whereas the choice point contains more nonlocal representations. The medians of the two distributions are different (Wilcoxon rank-sum test, p < 10−10).
Nonlocal representations at the choice point preferentially sweep forward of the animal
To test whether the nonlocal reconstruction at choice points occurred preferentially ahead of the animal or behind the animal, we compared the proportion of the reconstructed probability distribution p(x|S) reconstructing ahead of the animal to the proportion behind the animal. As can be seen in Figure 8, the nonlocal reconstruction probability was concentrated predominantly ahead of the animal. Forward locations were averaged together and the difference between forward locations and backward locations was calculated for each 125 ms time window that the animal was at the central choice point. The median difference (shown by the arrow) was significantly >0 in all measured data sets. (Sign rank test, p < 10−10 for all sessions).
Nonlocal representations at the choice point sweep down the two choices separately
Given that the nonlocal reconstruction is concentrated forward of the animal rather than behind it, an important question is whether it is simply spreading forward of the animal in all available directions (as would be predicted by current models of phase precession) (Skaggs et al., 1996; Yamaguchi, 2003; Jensen and Lisman, 2005), or whether it is concentrated on each choice separately. Examining the single time-window slices in Figure 5 suggests that the representation swept forward along only one choice at a time. To directly test this hypothesis, we measured the joint probability of the distribution of reconstruction contributing to the left and right boxes shown in Figure 8. As can be seen in Figure 9, the high probabilities were found primarily along the axes of the two-dimensional histogram and not near the diagonal, suggesting that decoded representations did not spread in both directions simultaneously.
Extrafield firing during error correction
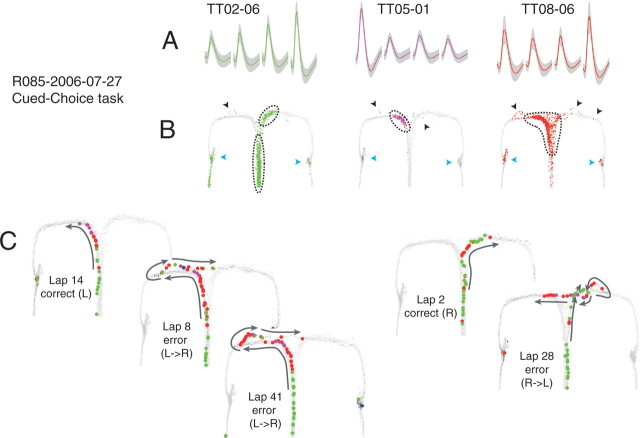
The hypothesis that these extrafield firing and nonlocal representations occurring at key decision points (such as the high-cost choice point on the two tasks) predicts that extrafield firing and nonlocal representations should also occur at other decisions made within the tasks. On these two tasks, animals were allowed to turn around on the top arm (before the final turn onto the return rails). This means that rats were faced with a decision on error laps in which they made the wrong choice on the high-cost choice. On the multiple-T task, this occurred when the rat did not hear the expected feeder click sound when it reached the feeder trigger zone (Fig. 1). On the cued-choice task, this occurred when the rat did not hear the expected confirmation tone (secondary tone site) (Fig. 2). As predicted, place cells showed extrafield firing on error laps (Fig. 10). Reconstruction analyses found that the p(x|S) distribution swept down the two potential choices (forward to the feeder or back toward the choice point and the other choice) (Fig. 11, supplemental movie 4, available at www.jneurosci.org as supplemental material).
Figure 10.
Extrafield firing in hippocampal place cells during error correction on the cued-choice task. A, Average waveforms (gray, SD) for three simultaneously recorded, well isolated place cells. B, Spatial activity of each cell across the full session. The light gray lines indicate the rat's positions. Colored dots indicate the rat's position at the time of a spike. Blue triangles indicate feeder locations; black triangles indicate extrafield spiking. Dotted lines delineate place field boundaries. Place fields were defined as a contiguous region with an average firing rate exceeding 15% peak field rate (Huxter et al., 2003; Leutgeb et al., 2004). C, Place cell activity on specific trajectories. Light gray lines again indicate animal positions across the full session. Colored dots show animal positions at the time of cell spiking. Black trajectory arrows indicate the direction of motion along the trajectory. Note that extrafield firing sometimes occurs before the animal turns back toward the choice point on reversals.
Figure 11.
Error correction in the hippocampal neural ensemble. Again, the representation closely tracked the rat's position from the choice point to the feeder trigger zone. The rat turned back toward the choice point and the representation moved into the opposite maze arm. The representation intensity is indicated by color (red, high probability; blue, low probability), and the actual position of the animal is indicated by an open circle. Panels are arranged from left to right and top to bottom in 60 ms intervals.
Nonlocal representations are correlated but not defined by the orientation of motion
As can be seen in Figure 9, the reconstruction probability forward of the animal predominantly concentrated at either the left or right directions. It is thus important to measure the extent to which these directions of forward representation relate to the orientation of the animal. Orientation of motion of the animal was measured as defined above (see Materials and Methods). Although there was a significant correlation (p(slope = 0) ≤ 10−10), there were also cases in which the probability was predominantly leftward while the rat moved rightward, and vice versa (Fig. 12).
Figure 12.
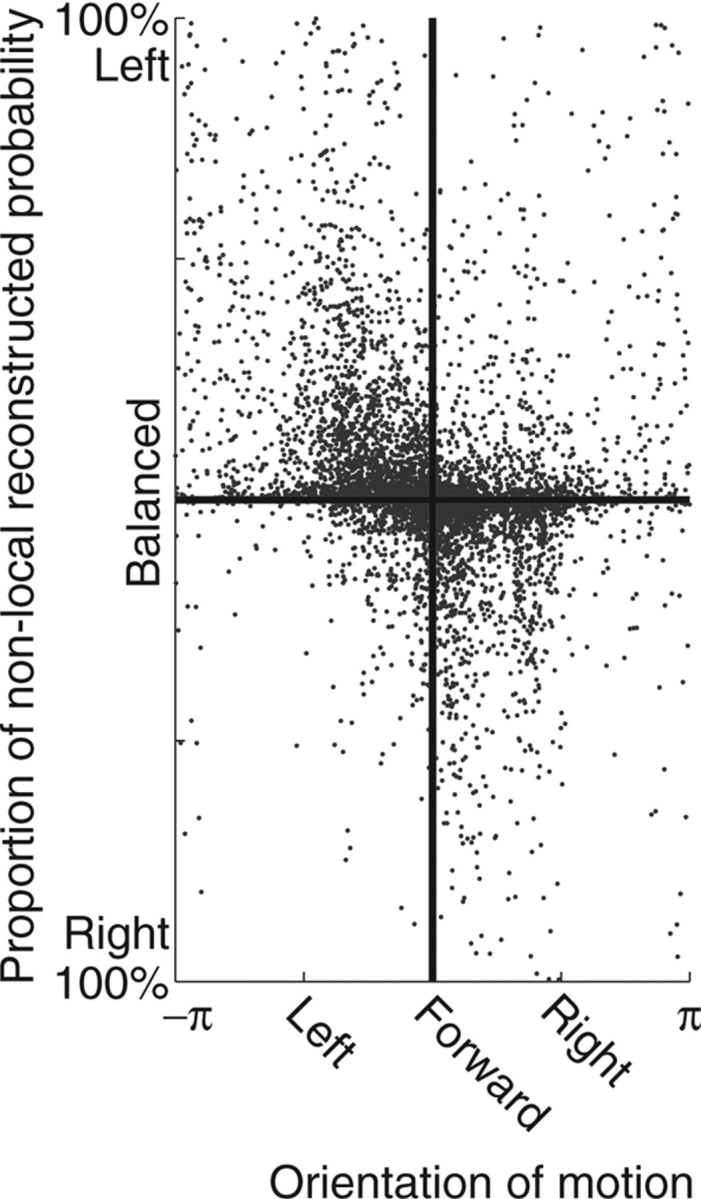
Direction of nonlocal reconstructed representation as a function of the orientation of motion of the animal. For all samples at the choice point, the direction of nonlocal reconstruction was measured as the proportion to the left of the animal minus the proportion to the right of the animal. Although there was a significant correlation (p(slope = 0) ≤ 10−10), there were also samples reaching left while the animal moved right and vice versa.
Nonlocal representations occur at locations of highly variable orientation of motion
The observation that the choice point of the cued-choice task, the final choice of the multiple-T task, and at reversals on both tasks suggests that nonlocal representations may occur generally where rats pause and re-orient. To test this hypothesis, we calculated locations where animals paused (total linear velocity ≤1 cm/s), locations where animals varied their orientation of motion (total angular velocity ≥120°/s), and compared the reconstruction error distance during these conditions. As can be seen in Figure 13, the animals tended to show variable orientation of motion at the feeders, at the final choice point, and at recovery from errors. When the distribution of reconstruction errors was compared between these variable orientation of motion positions and the rest of the task, variable orientation of motion positions included more nonlocal reconstructions (Wilcoxon rank-sum test, p < 10−10).
Figure 13.
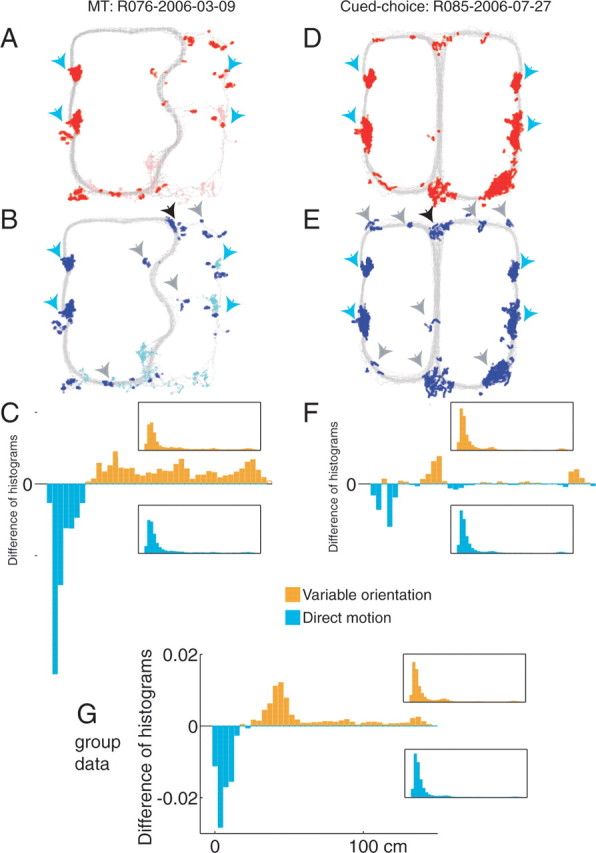
Reconstruction error is more nonlocal at locations where animals show a highly variable orientation of motion. A, D, Locations where the animal paused. Gray dots indicate all locations sampled during the full session; red dots indicate locations where the animal paused. Lighter color dots in A indicate pauses occurring in the last two laps, during which the animal no longer actively searched for food. B, E, Locations where the animal showed a high variability of orientation of motion. Lighter color dots in B indicate variable orientations occurring in the last two laps, during which the animal no longer actively searched for food. C, F, Difference between histograms of reconstruction error distance during samples with variable orientation of motion (B, E, blue dots) and during the rest of the session. Reconstruction distance was greater during samples with variable orientation of motion (Wilcoxon rank-sum test, p < 10−10, C; p < 0.00005, F). A–C, Multiple-T. D–F, Cued choice. Blue triangles indicate feeder locations. Black triangles indicate the choice point studied in Figure 5. Gray triangles indicate other pause locations during which animals spent time varying their orientation of motion, including the reversal locations studied in Figure 11. G, Group data showing that the tendency to show an increased nonlocality of reconstruction during variable orientation motion is a general property of the entire data set.
Local field potentials
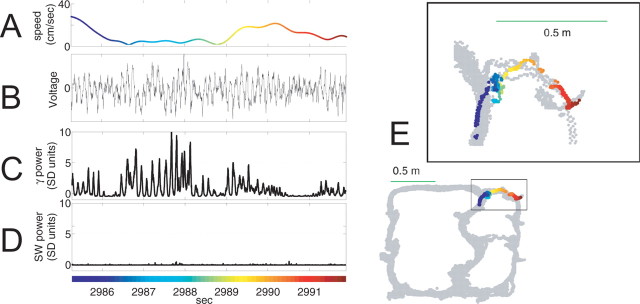
Extrafield firing has been known to occur during sharp-wave ripple complexes within LIA episodes (O'Keefe and Nadel, 1978; Kudrimoti et al., 1999; Jensen and Lisman, 2000; Foster and Wilson, 2006; Jackson et al., 2006; O'Neill et al., 2006). Local field potential traces at the choice point displayed strong theta oscillations and no apparent sharp-wave ripple activity (Fig. 14). To determine the hippocampal brain state and identify whether sharp-wave ripple complexes within theta might be occurring at the choice point, we examined the local field potential frequency composition using frequency-detection methods capable of detecting even very rare and transient oscillatory events in long data series (Masimore et al., 2004). As shown in Figure 15, the method clearly identifies both theta and sharp-wave frequency components across complete sessions (left). However, when only data in which the animal was at the choice point were considered, no sharp-wave components were seen. Instead, the analysis identified the presence of theta (7 Hz) and gamma (30–80 Hz) frequencies. This analysis method is sensitive enough to identify even transient sharp-wave ripple complexes occurring within theta episodes (O'Neill et al., 2006). As can be seen in Figure 15, B and C, there was no power at sharp-wave ripple frequencies during pausing behavior at the stem or choice point. Comparisons between local field potentials at the choice point, the maze stem, and the feeders revealed slight differences between choice point and the stem local field potentials, but large differences from those at the feeders. Local field potentials at the feeders displayed diminished gamma power and increased sharp-wave ripple activity. In summary, nonlocal representations were observed at both the feeders (reactivation, route replay) (Jackson et al., 2006; Johnson et al., 2008) and at choice points (sweeps), but occurred in much different local field potential “brain states.”
Figure 14.
CA3 LFP during choice point behavior. A–E, Sample local field potential during a pause at the choice point (Fig. 5, supplemental movie 1, available at www.jneurosci.org as supplemental material). A, Absolute velocity. B, Raw local field potential trace. C, Gamma power (filtered at 30–80 Hz) z scores based on the distribution drawn from the full session. D, Sharp-wave ripple-power (filtered at 100–250 Hz) z-scores based on the distribution drawn from the full session. E, Gray dots indicate all positions sampled by the animal over the entire session. Colored dots indicate the path of the animal sampled during time corresponding to LFP data on the left. Colors indicate the passage of time and are consistent between left and right panels.
Figure 15.
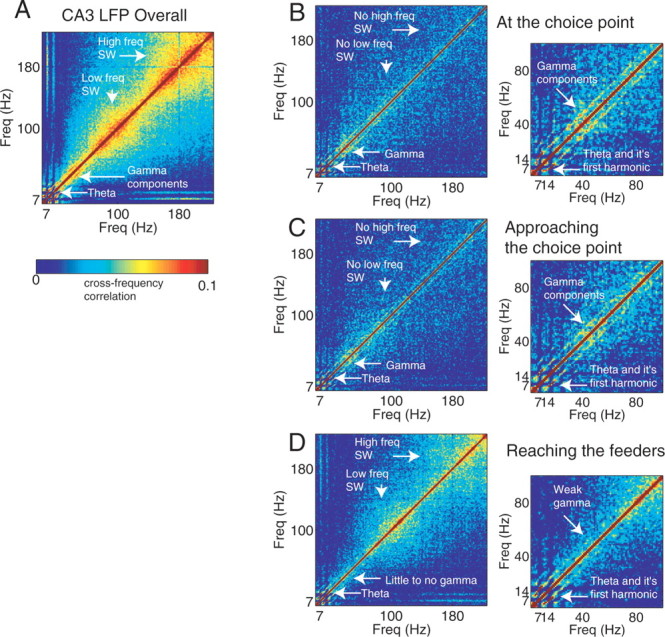
CA3 LFP during choice-point behavior and other maze areas. A, Average cross-frequency correlations from all available 40 min sessions. In these plots, important frequencies show up as high-correlated blocks (Masimore et al., 2004). Data include additional sessions from which spikes were not available (data averaged over 16 sessions from 3 animals). Note the clear indications of theta (at 7–10 Hz) and the low-frequency (100–150 Hz) and high-frequency (200 Hz) sharp waves in the overall plot (left). B, Average cross-frequency correlations at choice point times. C, Average cross-frequency correlations at stem times. D, Average cross-frequency correlations at feeder arrival. Note that local field potentials at the choice point and stem include gamma (30–80 Hz) but no low- or high-frequency sharp waves. This contrasts with feeder times, which display decreased theta and gamma correlations, but strong correlations at low- and high-frequency sharp-wave ripple frequencies.
As suggested by Figure 14, these sweep events are occurring during hippocampal states including strong theta components. As shown in Table 2, the mean length of the sweep corresponded closely to that of a single theta cycle [mean sweep length, 153 ± 13 ms, not significantly different from 7 Hz (140 ms); z test, p = 0.86]. However, some sweeps did last much longer than a single theta cycle (length of longest sweep, 1.4 s). To analyze the phase relationships between the sweeps and theta, sweep start and stop times were identified as described in Materials and Methods. Whereas sweep start times showed a nonsignificant trend to primarily occur at phases close to the peak of theta at the hippocampal fissure (Watson's circular U2 = 0.12; p = 0.1), sweep stop times showed a statistically significant tendency to stop on the rising phase of theta (Watson's circular U2 = 0.52; p < 0.0001) (Fig. 16).
Figure 16.
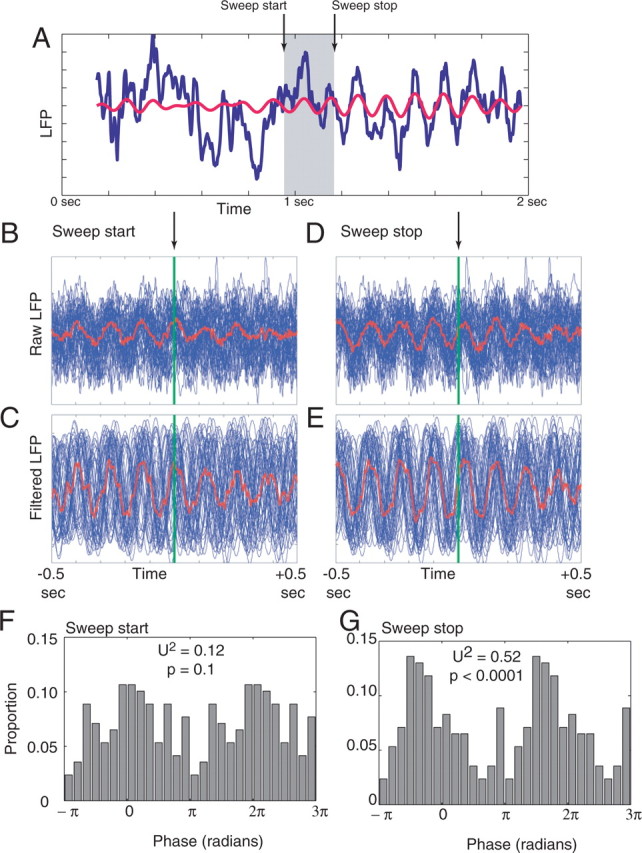
Phase relationships between sweeps and theta. A, Example local field potential showing the raw (blue) and theta-filtered (red) local field potential surrounding a 200 ms sweep. Note how the sweep spans several theta cycles. B, Distribution of LFP aligned to start times from all sweeps occurring within one session R076-2006-03-09. Start time corresponds to the green line. All samples are shown in blue; the average is shown in red. C, Distribution of filtered-LFP signals aligned to start times from all sweeps occurring within that same session. D, E, Equivalent plots showing LFP alignment of sweep stop times. F, Group data for all sessions showing histogram of distribution of theta phase of sweep start times. G, Group data for all sessions showing histogram of distribution of theta phase of sweep stop times.
Development of nonlocal representations with experience
If nonlocal representations within the hippocampus provide information to decision-making brain modules, then these representations may change as a function of task demands. To examine this possibility, we compared within-session changes in the nonlocal spatial representations at the choice point on the multiple-T and cued-choice tasks. The primary difference between the two tasks is within-session learning in that the spatial position of reward on the multiple-T task is consistent within each session and changes from day to day (Schmitzer-Torbert and Redish, 2002). In contrast, the spatial position of reward on the cued-choice task varies from lap to lap, but the relationship between cues and reward is maintained from day to day.
Behaviorally, rats on the cued-choice task paused for longer at the choice point than rats on the multiple-T task (t(234) = 2.49; p ≤ 0.05). Over the course of each session on the multiple-T task, rats paused for less time on later laps than on earlier laps (significant negative slope, choice point time by lap linear regression; F(1,91) = 21.59, p < 0.05). In contrast, no such reduction was seen on the cued-choice task (choice point time by lap linear regression; F(1,81) = 0.03, not significant).
As can be seen in Figure 17, during the first part of the multiple-T task, the reconstructed distribution p(x|S) first swept down both possibilities, but then, as the behavior automated, sweeps down the unrewarded choice (left on the session shown) decreased. In late laps, the total amount of nonlocal reconstructed probability decreased. In contrast, on the cued-choice task, the forward component of the sweep maintained nonlocality, sweeping down both directions throughout the task. There was a significant effect of both task, lap, and their interaction on the proportion of the probability sweeping to the left or the right at any time (ANOVA, effect of lap, df = 38, F = 9.4, p < 10−10; effect of task, df = 1, F = 113.3, p < 10−10; interaction, df = 38, F = 9.5, p < 10−10). In particular, the LR balance of the forward sweeps (measured as the difference between left and right probabilities), was significantly larger than the mean difference only during the first five laps of the multiple-T task. The proportion of the reconstruction probability at the location of the rat remained relatively constant, increasing slightly over laps on the multiple-T task, decreasing slightly over laps on the cued-choice task (ANOVA, effect of lap, df = 38, F = 7.1, p < 10−10; effect of task, df = 1, F = 91.6, p < 10−10; interaction, df = 38, F = 8.9, p < 10−10).
Discussion
Neural ensembles recorded from the CA3 region of rats running on T-based decision tasks displayed transient activity at decision points indicative of positions different from the rat's current position (leading to nonlocal reconstruction). Projection of these activities onto spatial location showed that during these decision-making events the location reconstructed from the neural ensemble swept forward of the animal, first down one path and then the other. Reconstructed representations were coherent and preferentially swept ahead of the animal rather than behind the animal. Similar nonlocal representations were observed as rats recovered from an error. Local field potentials from these sites displayed strong power in theta and gamma frequencies and no sharp waves. Nonlocal spatial representations were influenced by task demands and experience.
Nonlocal representations
That extrafield spiking maintained spatial organization across multiple simultaneously recorded cells during extrafield activity implies that the extrafield spiking may coincide with transient, nonlocal representations of events or locations. In these tasks, all essential information can be projected onto space (i.e., location of the animal). As a result, memory (sequences and episodes) and any decision-related processes present within hippocampal ensemble dynamics can be made observable by examining dynamic changes in the spatial representation. It is critical to note the reconstruction analysis makes no fundamental assumption regarding spatial representation within the hippocampus, only that memory and decision-making signals may be coherently projected onto space in these tasks.
Nonlocal decoding at the choice point displayed sequential activity associated with either of the T maze arms or the reward locations. Nonlocal representations and reconstructed locations were found predominantly forward of the animal's position at the choice point and were not temporally coincident with nonlocal representations behind the animal's position at the choice point or a general nondirectional spreading of the representation (Fig. 8). Reconstruction in front of but not behind the animal suggests that the information is related to representation of future paths rather than a replay of recent history. To determine whether this effect resulted from a nonspecific forward shift or a directionally specific forward shift, we found the joint distribution of probabilities in the left and right arms (Fig. 9). The nonlocal reconstructions observed here did not occur in both forward directions simultaneously: the representation encoded first one arm of the T and then the other.
Planning paths with cognitive maps
The cognitive map was originally proposed to explain the flexible spatial navigation abilities observed in animals (O'Keefe and Nadel, 1978). Several researchers (O'Keefe and Speakman, 1987; Lenck-Santini et al., 2002; Rosenzweig et al., 2003) have shown that behavior aligns to the goal locations expected given an active place field distribution, whereas other researchers (Frank et al., 2000; Wood et al., 2000; Ferbinteanu and Shapiro, 2003; Ainge et al., 2007a; Hok et al., 2007) have shown goal-sensitivity during navigation processes. These previous results suggest that how the animal's current position is represented contributes to navigation, but the mechanism by which the hippocampal representation contributes to navigation remains an open question. The results presented here show that when animals pause during behavior, the hippocampal representation becomes transiently nonlocal. At high-cost choice points and at the correction of errors, the hippocampal representation sweeps forward along the potential paths available to the animal. These transient nonlocal signals could provide a potential substrate for the prediction of the consequences of decisions and the planning of paths to goals.
How is this signal evaluated?
Nonlocal forward representations are not sufficient for the consideration of future possibilities. Such consideration processes would also require mechanisms for evaluation of nonlocal representations as well as mechanisms for flexible translation into behavior. Previous models of goal-directed navigation have suggested that goal-directed navigation arises from a planning-capable system based on the consideration of possibilities (Jensen and Lisman, 1998, 2005; Koene et al., 2003; Daw et al., 2005; Redish and Johnson, 2007). These models suggest that some structure is providing the animal with a prediction of the consequences of its actions, from which an evaluation of the goal can be reached, and a decision made. Whereas some of these models (Daw et al., 2005) have suggested a role of prefrontal cortex in this prediction, other models (Jensen and Lisman, 1998, 2005; Koene et al., 2003; Redish and Johnson, 2007) have suggested hippocampus as a source of this prediction. Although there are other candidates, two structures have been suggested as the key to the evaluation process: the orbitofrontal cortex (Schoenbaum and Roesch, 2005; Feierstein et al., 2006; Padoa-Schioppa and Assad, 2006; Schoenbaum et al., 2006) and the ventral striatum (Lavoie and Mizumori, 1994; Daw, 2003; O'Doherty et al., 2004). Neurons in the ventral striatum show reward correlates (Lavoie and Mizumori, 1994; Miyazaki et al., 1998; Carelli et al., 2000; Martin and Ono, 2000; Carelli, 2002; Carelli and Wondolowski, 2003) and anticipate predicted reward (Schultz et al., 1992; Miyazaki et al., 1998; Martin and Ono, 2000; Yun et al., 2004). The hippocampus projects to ventral striatum (McGeorge and Faull, 1989; Finch, 1996; Swanson, 2000) and ventral striatal firing patterns reflect hippocampal neural activity (Martin, 2001; Pennartz et al., 2004). Neurons in the orbitofrontal cortex encode parameters relating the value of potential choices (Tremblay and Schultz, 1999; Schoenbaum and Roesch, 2005; Padoa-Schioppa and Assad, 2006). Davis et al. (2006) reported that anticipatory neural firing of goal-related information in orbitofrontal cortex was dependent on hippocampal integrity. This may explain why we have not observed a correlation between the directions reconstructed and the choices made by the animal on the cued-choice task: the hippocampus may only be providing the prediction component; evaluation of the value of that prediction and the making of the decision may happen downstream of the hippocampal prediction process.
Does the representation have to reach the goal to be useful for the evaluation of potential choices?
As can be seen in supplemental movies 1–4 (available at www.jneurosci.org as supplemental material), many of the sweeps proceed only partially down the potential forward paths and evaporate before they reach the goal (It is important, however, to note that the experiments reported here are based on ensembles of several dozen cells. It is possible that some of the observed sweeps proceed farther down the potential path toward the goal than can be observed with these recordings. It is possible that future recordings with larger ensembles may provide for more definitive statements about the dynamics of the forward-sweeping process.). As has been established in the animal learning literature, it is possible for secondary reinforcers to train additional associations (Pavlov, 1927; Domjan, 1998). Both tasks include explicit secondary reinforcers [the click of the feeder (multiple-T) (Fig. 1) and the secondary tones (cued choice) (Fig. 2)] and many of the sweeps do reach those secondary tones. However, it is also possible that the locations on the paths to the goal have themselves become secondary reinforcers. All that would be needed for evaluation of the potential choices would be that the nonlocal representation reach a point at which the expected value can be evaluated. Thus, a sweep that reaches to a point on the path leading to a goal could be used to appraise the expected reward on taking that path as long as there was value associated with that location (Sutton and Barto, 1998). The critical test of this hypothesis will be to examine downstream structures during these nonlocal representations to determine how the nonlocal information is used.
Vicarious trial and error
Rats faced with difficult decisions vicariously sample the different choices before committing to a decision (Meunzinger, 1938; Hu and Amsel, 1995; Hu et al., 2006). These “vicarious trial and error” (VTE) behaviors (Meunzinger, 1938; Tolman, 1939; Hu and Amsel, 1995; Hu et al., 2006) or “microchoices” (Brown, 1992; Hudon et al., 2002) appear as small head movements alternating between the potential choices. We observed VTE movements in both the multiple-T and cued-choice tasks. We identified VTE-like times quantitatively as times with a highly variable orientation of motion. These VTE-like times tended to include more nonlocal representations than other navigation times (Fig. 13). Although VTE behaviors often appear as fast changes in movement orientation at time scales longer than 500 ms, it is possible that the multiple stages of information processing associated with VTE (representation of nonlocal information, evaluation and comparison to a criterion, reorientation or choice) may occur at shorter time scales. VTE movements are diminished with hippocampal lesions (Hu and Amsel, 1995), and are related to hippocampal activity levels on hippocampus-dependent tasks (Hu et al., 2006). VTE has been proposed to provide a choice-consideration mechanism and to underlie complex decision planning (Tolman, 1939). The exact relationship between the forward sweep phenomena reported here and vicarious trial and error remains to be fully elucidated, but an intriguing area of future study would be to examine hippocampal representations during explicitly identified VTE phenomena.
Phase precession
Both hippocampal interneurons and pyramidal cells fire in specific relationships to local field potentials (Klausberger et al., 2003; Somogyi and Klausberger, 2005). During the theta state, pyramidal cells fire at specific phases of the LFP theta rhythm, which then proceed through behavior (O'Keefe and Recce, 1993; Skaggs et al., 1996; Dragoi and Buzsaki, 2006). This phase precession encodes a sweep of spatial representation from behind the animal to in front of the animal in each theta cycle. The sweep events reported here generally lasted approximately a single theta cycle, although some sweeps lasted much longer. Moreover, the distance encoded by our sweeps was often much larger than is typically seen during phase precession. During sweeps that lasted longer than the expected 140 ms (one cycle at 7 Hz), theta oscillations sometimes appeared to degrade transiently (Fig. 16A), restarting only on the conclusion of the sweep (Fig. 16D,E,G). This may suggest that the theta rhythm within the local field potential and the sweep process are both generated from similar processes.
However, the phase relationships predicted from single-cell recordings (Skaggs et al., 1996) suggest that phase precession sweeps should start at the location of the rat at the peak of theta and end ahead of the rat at the subsequent rising phase of theta. This closely matches our observations (Fig. 16). Phase precession has been suggested as a means of planning future trajectories (Jensen and Lisman, 1998, 2005; Yamaguchi, 2003), but has never been studied in situations in which rats must select from multiple available paths. The exact relationship between the forward sweep phenomena reported here and phase precession remains to be fully elucidated, but studying phase precession using reconstructive techniques like those used here is likely to be fruitful.
Prospective place cells: single cells and ensembles
The representation of future paths that we have seen at the choice point would be visible at the single-cell level if the representation swept down one path more than the other. This may occur in highly overtrained animals or in tasks where the next path is known in advance. At the single-cell level, these would appear as prospective cells with firing dependent on the future path. Place field activity on maze segments common to multiple paths is modulated by the current path or trajectory of the animal (Frank et al., 2000; Wood et al., 2000; Ferbinteanu and Shapiro, 2003; Ainge et al., 2007b; Griffin et al., 2007) (but see Bower et al., 2005). The suggestion that prospective place cells are reflective of preferential sweeping down one potential choice over another suggests that the difference in firing rate between future choices (i.e., the amount of prospective firing seen) should depend on the balance between the considered paths. Previous experiments have found that single-cell measurements are more prospective on versions of tasks that are less dependent on hippocampal integrity (e.g., cyclical T-maze alternation tasks) (Wood et al., 2000) and become less prospective on versions of tasks that are more hippocampus-dependent (e.g., T-maze tasks with an imposed delay) (Ainge et al., 2005, 2006, 2007b; Griffin et al., 2007). This is presumably because the representation is sweeping down both paths more equally on the more hippocampally dependent versions of these tasks.
Conclusion
Multiple learning and memory processes mediate decision-making behavior (Packard and McGaugh, 1996; Poldrack et al., 2001; Daw et al., 2005). The primary distinction between these learning and memory systems can be characterized by a trade-off between a flexible, fast-learning, computationally costly planning system and an inflexible, slow-learning, computationally efficient cache system (O'Keefe and Nadel, 1978; Redish, 1999; Daw et al., 2005; Redish and Johnson, 2007). A planning system allows an animal to flexibly compute outcomes resulting from variable task contingencies, a process that requires prospective memory (Daw et al., 2005; Redish and Johnson, 2007). Computational models of prospective memory have suggested that cortical–hippocampal interactions, particularly caused by theta-gamma interactions, may allow hippocampal neurons to reactivate previously experienced temporal sequences (Jensen and Lisman, 1998, 2005; Koene et al., 2003; Eichenbaum, 2004). The similarities between these models and the observations of forward shifted neural representations and their coincidence with theta and gamma rhythms at the choice point suggest that the hippocampus may provide prospective memory signals to downstream evaluation and decision making modules.
Footnotes
This work was supported by National Institutes of Mental Health Grant R01-MH06829 (A.J., A.D.R.), the Land Grant Professorship program at the University of Minnesota (A.D.R.), the Center for Cognitive Sciences at the University of Minnesota (T32HD007151) (A.J.), a Fulbright Scholarship (A.J.), and a 3M Graduate Fellowship (A.J.). We thank Mallika Arudi, Deborah Bang, Dan Bernal, Kristin Bohnhorst, Chris Boldt, Giuseppe Cortese, Maniezheh Firouzi, Mandy Huber, Sarah Jutila, Monica Kumar, Morgan Little, Susan Nwoke, and Kelsey Seeland for help with data collection and processing, as well as for helpful discussions. We thank Neil C. Schmitzer-Torbert, Jadin Jackson, Matthijs van der Meer, John Ferguson, Edvard Moser, and Bruce Overmier for helpful discussions. We are particularly grateful to Paul Schrater for help with data analysis.
References
- Ainge JA, van der Meer MA, Wood ER. Disparity between sequence-dependent hippocampal activity and hippocampal lesion effects on a continuous t-maze task. Soc Neurosci Abstr. 2005;31:776–13. [Google Scholar]
- Ainge JA, Tamosiunaite M, Woergoetter F, Dudchenko P. Prospective coding in CA1 hippocampal place cells on a maze with multiple choice points. Soc Neurosci Abstr. 2006;32:68–20. doi: 10.1523/JNEUROSCI.2011-07.2007. [DOI] [PMC free article] [PubMed] [Google Scholar]
- Ainge JA, Tamosiunaite M, Woergoetter F, Dudchenko PA. Hippocampal CA1 place cells encode intended destination on a maze with multiple choice points. J Neurosci. 2007a;27:9769–9779. doi: 10.1523/JNEUROSCI.2011-07.2007. [DOI] [PMC free article] [PubMed] [Google Scholar]
- Ainge JA, van der Meer MA, Langston RF, Wood ER. Exploring the role of context-dependent hippocampal activity in spatial alternation behavior. Hippocampus. 2007b;17:988–1002. doi: 10.1002/hipo.20301. [DOI] [PubMed] [Google Scholar]
- Bower MR, Euston DR, McNaughton BL. Sequential-context-dependent hippocampal activity is not necessary to learn sequences with repeated elements. J Neurosci. 2005;25:1313–1323. doi: 10.1523/JNEUROSCI.2901-04.2005. [DOI] [PMC free article] [PubMed] [Google Scholar]
- Brown EN, Frank LM, Tang D, Quirk MC, Wilson MA. A statistical paradigm for neural spike train decoding applied to position prediction from ensemble firing patterns of rat hippocampal place cells. J Neurosci. 1998;18:7411–7425. doi: 10.1523/JNEUROSCI.18-18-07411.1998. [DOI] [PMC free article] [PubMed] [Google Scholar]
- Brown MF. Does a cognitive map guide choices in the radial-arm maze? J Exp Psychol. 1992;18:56–66. doi: 10.1037//0097-7403.18.1.56. [DOI] [PubMed] [Google Scholar]
- Carelli RM. Nucleus accumbens cell firing during goal-directed behaviors for cocaine vs “natural” reinforcement. Physiol Behav. 2002;76:379–387. doi: 10.1016/s0031-9384(02)00760-6. [DOI] [PubMed] [Google Scholar]
- Carelli RM, Wondolowski J. Selective encoding of cocaine versus natural rewards by nucleus accumbens neurons is not related to chronic drug exposure. J Neurosci. 2003;23:11214–11223. doi: 10.1523/JNEUROSCI.23-35-11214.2003. [DOI] [PMC free article] [PubMed] [Google Scholar]
- Carelli RM, Ijames SG, Crumling AJ. Evidence that separate neural circuits in the nucleus accumbens encode cocaine versus “natural” (water and food) reward. J Neurosci. 2000;20:4255–4266. doi: 10.1523/JNEUROSCI.20-11-04255.2000. [DOI] [PMC free article] [PubMed] [Google Scholar]
- Cohen NJ, Eichenbaum H. Memory, amnesia, and the hippocampal system. Cambridge, MA: MIT; 1993. [Google Scholar]
- Csicsvari J, Hirase H, Czurko A, Buzsaki G. Fast network oscillations in the hippocampal CA1 region of the behaving rat. J Neurosci. 1999;19:RC20. doi: 10.1523/JNEUROSCI.19-16-j0001.1999. [DOI] [PMC free article] [PubMed] [Google Scholar]
- Davis JB, Donahue RJ, Discenza CB, Waite AA, Ramus SJ. Hippocampal dependence of anticipatory neuronal firing in the orbitofrontal cortex of rats learning an odor-sequence memory task. Soc Neurosci Abstr. 2006;32:66–7. [Google Scholar]
- Daw ND. Carnegie Mellon University; 2003. Reinforcement learning models of the dopamine system and their behavioral implications. PhD thesis. [Google Scholar]
- Daw ND, Niv Y, Dayan P. Uncertainty-based competition between prefrontal and dorsolateral striatal systems for behavioral control. Nat Neurosci. 2005;8:1704–1711. doi: 10.1038/nn1560. [DOI] [PubMed] [Google Scholar]
- Domjan M. The principles of learning and behavior. Ed 4. Belmont, CA: Brooks/Cole; 1998. [Google Scholar]
- Dragoi G, Buzsaki G. Temporal encoding of place sequences by hippocampal cell assemblies. Neuron. 2006;50:145–157. doi: 10.1016/j.neuron.2006.02.023. [DOI] [PubMed] [Google Scholar]
- Eichenbaum H. Hippocampus: cognitive processes and neural representations that underlie declarative memory. Neuron. 2004;44:109–120. doi: 10.1016/j.neuron.2004.08.028. [DOI] [PubMed] [Google Scholar]
- Feierstein CE, Quirk MC, Uchida N, Sosulski DL, Mainen ZF. Representation of spatial goals in rat orbitofrontal cortex. Neuron. 2006;60:495–507. doi: 10.1016/j.neuron.2006.06.032. [DOI] [PubMed] [Google Scholar]
- Ferbinteanu J, Shapiro ML. Prospective and retrospective memory coding in the hippocampus. Neuron. 2003;40:1227–1239. doi: 10.1016/s0896-6273(03)00752-9. [DOI] [PubMed] [Google Scholar]
- Ferbinteanu J, Kennedy PJ, Shapiro ML. Episodic memory: from brain to mind. Hippocampus. 2006;16:704–715. doi: 10.1002/hipo.20204. [DOI] [PubMed] [Google Scholar]
- Finch DM. Neurophysiology of converging synaptic inputs from rat prefrontal cortex, amygdala, midline thalamus, and hippocampal formation onto single neurons of the caudate/putamen and nucleus accumbens. Hippocampus. 1996;6:495–512. doi: 10.1002/(SICI)1098-1063(1996)6:5<495::AID-HIPO3>3.0.CO;2-I. [DOI] [PubMed] [Google Scholar]
- Foster DJ, Wilson MA. Reverse replay of behavioural sequences in hippocampal place cells during the awake state. Nature. 2006;440:680–683. doi: 10.1038/nature04587. [DOI] [PubMed] [Google Scholar]
- Frank LM, Brown EN, Wilson M. Trajectory encoding in the hippocampus and entorhinal cortex. Neuron. 2000;27:169–178. doi: 10.1016/s0896-6273(00)00018-0. [DOI] [PubMed] [Google Scholar]
- Griffin AL, Eichenbaum H, Hasselmo ME. Spatial representations of hippocampal CA1 neurons are modulated by behavioral context in a hippocampus-dependent memory task. J Neurosci. 2007;27:2416–2423. doi: 10.1523/JNEUROSCI.4083-06.2007. [DOI] [PMC free article] [PubMed] [Google Scholar]
- Hassabis D, Kumaran D, Vann SD, Maguire EA. Patients with hippocampal amnesia cannot imagine new experiences. Proc Natl Acad Sci USA. 2007;104:1726–1731. doi: 10.1073/pnas.0610561104. [DOI] [PMC free article] [PubMed] [Google Scholar]
- Hok V, Lenck-Santini PP, Roux S, Save E, Muller RU, Poucet B. Goal-related activity in hippocampal place cells. J Neurosci. 2007;27:472–482. doi: 10.1523/JNEUROSCI.2864-06.2007. [DOI] [PMC free article] [PubMed] [Google Scholar]
- Howard MW, Fotedar MS, Datey AV, Hasselmo ME. The temporal context model in spatial navigation and relational learning: toward a common explanation of medial temporal lobe function across domains. Psychological Rev. 2005;112:75–116. doi: 10.1037/0033-295X.112.1.75. [DOI] [PMC free article] [PubMed] [Google Scholar]
- Hu D, Amsel A. A simple test of the vicarious trial-and-error hypothesis of hippocampal function. Proc Natl Acad Sci USA. 1995;92:5506–5509. doi: 10.1073/pnas.92.12.5506. [DOI] [PMC free article] [PubMed] [Google Scholar]
- Hu D, Xu X, Gonzalez-Lima F. Vicarious trial-and-error behavior and hippocampal cytochrome oxidase activity during Y-maze discrimination learning in the rat. Int J Neurosci. 2006;116:265–280. doi: 10.1080/00207450500403108. [DOI] [PubMed] [Google Scholar]
- Hudon C, Dor'e FY, Goulet S. Spatial memory and choice behavior in the radial arm maze after fornix transection. Prog Neuropsychopharmacol Biol Psychiatry. 2002;26:1113–1123. doi: 10.1016/s0278-5846(02)00245-2. [DOI] [PubMed] [Google Scholar]
- Huxter J, Burgess N, O'Keefe J. Independent rate and temporal coding in hippocampal pyramidal cells. Nature. 2003;425:828–832. doi: 10.1038/nature02058. [DOI] [PMC free article] [PubMed] [Google Scholar]
- Jackson JC, Johnson A, Redish AD. Hippocampal sharp waves and reactivation during awake states depend on repeated sequential experience. J Neurosci. 2006;26:12415–12426. doi: 10.1523/JNEUROSCI.4118-06.2006. [DOI] [PMC free article] [PubMed] [Google Scholar]
- Janabi-Sharifi F, Hayward V, Chen CS. Discrete-time adaptive windowing for velocity estimation. IEEE Trans Neural Syst Rehabil Eng. 2000;8:1003–1009. [Google Scholar]
- Jensen O, Lisman JE. An oscillatory short-term memory buffer model can account for data on the Sternberg task. J Neurosci. 1998;18:10688–10699. doi: 10.1523/JNEUROSCI.18-24-10688.1998. [DOI] [PMC free article] [PubMed] [Google Scholar]
- Jensen O, Lisman JE. Position reconstruction from an ensemble of hippocampal place cells: contribution of theta phase encoding. J Neurophysiol. 2000;83:2602–2609. doi: 10.1152/jn.2000.83.5.2602. [DOI] [PubMed] [Google Scholar]
- Jensen O, Lisman JE. Hippocampal sequence-encoding driven by a cortical multi-item working memory buffer. Trends Neurosci. 2005;28:67–72. doi: 10.1016/j.tins.2004.12.001. [DOI] [PubMed] [Google Scholar]
- Johnson A, Jackson J, Redish AD. Holscher C, Munk MH. Mechanisms of information processing in the brain: encoding of information in neural populations and networks. Cambridge, UK: Cambridge UP; 2008. Measuring distributed properties of neural representations beyond the decoding of local variables: implications for cognition. in press. [Google Scholar]
- Klausberger T, Magill PJ, Marton LF, Roberts JDB, Cobden PM, Buzsaki G, Somogyi P. Brain-state and cell-type-specific firing of hippocampal interneurons in vivo. Nature. 2003;421:844–848. doi: 10.1038/nature01374. [DOI] [PubMed] [Google Scholar]
- Koene RA, Gorchetchnikov A, Cannon RC, Hasselmo ME. Modeling goal-directed spatial navigation in the rat based on physiological data from the hippocampal formation. Neural Networks. 2003;16:577–584. doi: 10.1016/S0893-6080(03)00106-0. [DOI] [PubMed] [Google Scholar]
- Kudrimoti HS, Barnes CA, McNaughton BL. Reactivation of hippocampal cell assemblies: effects of behavioral state, experience, and EEG dynamics. J Neurosci. 1999;19:4090–4101. doi: 10.1523/JNEUROSCI.19-10-04090.1999. [DOI] [PMC free article] [PubMed] [Google Scholar]
- Lavoie AM, Mizumori SJ. Spatial-, movement- and reward-sensitive discharge by medial ventral striatum neurons in rats. Brain Res. 1994;638:157–168. doi: 10.1016/0006-8993(94)90645-9. [DOI] [PubMed] [Google Scholar]
- Lee AK, Wilson MA. Memory of sequential experience in the hippocampus during slow wave sleep. Neuron. 2002;36:1183–1194. doi: 10.1016/s0896-6273(02)01096-6. [DOI] [PubMed] [Google Scholar]
- Lenck-Santini PP, Muller RU, Save E, Poucet B. Relationships between place cell firing fields and navigational decisions by rats. J Neurosci. 2002;22:9035–9047. doi: 10.1523/JNEUROSCI.22-20-09035.2002. [DOI] [PMC free article] [PubMed] [Google Scholar]
- Leutgeb JK, Leutgeb S, Treves A, Meyer R, Barnes CA, Moser EI, McNaughton BL, Moser MB. Progressive transformation of hippocampal neuronal representations in “morphed” environments. Neuron. 2005;48:345–358. doi: 10.1016/j.neuron.2005.09.007. [DOI] [PubMed] [Google Scholar]
- Leutgeb S, Leutgeb JK, Treves A, Moser MB, Moser EI. Distinct ensemble codes in hippocampal areas CA3 and CA1. Science. 2004;305:1295–1298. doi: 10.1126/science.1100265. [DOI] [PubMed] [Google Scholar]
- Loftus E, Palmer J. Reconstruction of automobile destruction. J Verbal Learn Verbal Behav. 1974;13:585–589. [Google Scholar]
- Maguire EA, Frackowiak RS, Frith CD. Recalling routes around London: activation of the right hippocampus in taxi drivers. J Neurosci. 1997;17:7103–7110. doi: 10.1523/JNEUROSCI.17-18-07103.1997. [DOI] [PMC free article] [PubMed] [Google Scholar]
- Martin PD. Locomotion towards a goal alters the synchronous firing of neurons recorded simultaneously in the subiculum and nucleus accumbens of rats. Behav Brain Res. 2001;124:19–28. doi: 10.1016/s0166-4328(01)00209-1. [DOI] [PubMed] [Google Scholar]
- Martin PD, Ono T. Effects of reward anticipation, reward presentation, and spatial parameters on the firing of single neurons recorded in the subiculum and nucleus accumbens of freely moving rats. Behav Brain Res. 2000;116:23–38. doi: 10.1016/s0166-4328(00)00249-7. [DOI] [PubMed] [Google Scholar]
- Masimore B, Kakalios J, Redish AD. Measuring fundamental frequencies in local field potentials. J Neurosci Methods. 2004;138:97–105. doi: 10.1016/j.jneumeth.2004.03.014. [DOI] [PubMed] [Google Scholar]
- McGeorge AJ, Faull RL. The organization of the projection from the cerebral cortex to the striatum in the rat. Neuroscience. 1989;29:503–537. doi: 10.1016/0306-4522(89)90128-0. [DOI] [PubMed] [Google Scholar]
- McNaughton BL, Morris RG. Hippocampal synaptic enhancement and information storage within a distributed memory system. Trends Neurosci. 1987;10:408–415. [Google Scholar]
- Meunzinger KF. Vicarious trial and error at a point of choice. I. A general survey of its relation to learning efficiency. J Genet Psychol. 1938;53:75–86. [Google Scholar]
- Miyazaki K, Mogi E, Araki N, Matsumoto G. Reward-quality dependent anticipation in rat nucleus accumbens. NeuroReport. 1998;9:3943–3948. doi: 10.1097/00001756-199812010-00032. [DOI] [PubMed] [Google Scholar]
- Nadasdy Z, Hirase H, Czurko A, Csicsvari J, Buzsaki G. Replay and time compression of recurring spike sequences in the hippocampus. J Neurosci. 1999;19:9497–9507. doi: 10.1523/JNEUROSCI.19-21-09497.1999. [DOI] [PMC free article] [PubMed] [Google Scholar]
- Nadel L, Moscovitch M. Memory consolidation, retrograde amnesia and the hippocampal complex. Curr Opin Neurobiol. 1997;7:217–227. doi: 10.1016/s0959-4388(97)80010-4. [DOI] [PubMed] [Google Scholar]
- O'Doherty J, Dayan P, Schultz J, Deichmann R, Friston K, Dolan RJ. Dissociable roles of ventral and dorsal striatum in instrumental conditioning. Science. 2004;304:452–454. doi: 10.1126/science.1094285. [DOI] [PubMed] [Google Scholar]
- O'Keefe J, Nadel L. The hippocampus as a cognitive map. Oxford: Clarendon; 1978. [Google Scholar]
- O'Keefe J, Recce M. Phase relationship between hippocampal place units and the EEG theta rhythm. Hippocampus. 1993;3:317–330. doi: 10.1002/hipo.450030307. [DOI] [PubMed] [Google Scholar]
- O'Keefe J, Speakman A. Single unit activity in the rat hippocampus during a spatial memory task. Exp Brain Res. 1987;68:1–27. doi: 10.1007/BF00255230. [DOI] [PubMed] [Google Scholar]
- O'Neill J, Senior T, Csicsvari J. Place-selective firing of CA1 pyramidal cells during sharp wave/ripple network patterns in exploratory behavior. Neuron. 2006;49:143–155. doi: 10.1016/j.neuron.2005.10.037. [DOI] [PubMed] [Google Scholar]
- Packard MG, McGaugh JL. Inactivation of hippocampus or caudate nucleus with lidocaine differentially affects expression of place and response learning. Neurobiol Learn Mem. 1996;65:65–72. doi: 10.1006/nlme.1996.0007. [DOI] [PubMed] [Google Scholar]
- Padoa-Schioppa C, Assad JA. Neurons in the orbitofrontal cortex encode economic value. Nature. 2006;441:223–226. doi: 10.1038/nature04676. [DOI] [PMC free article] [PubMed] [Google Scholar]
- Pavlov I. Conditioned reflexes. Oxford: Oxford UP; 1927. [Google Scholar]
- Pennartz CM, Lee E, Verheul J, Lipa P, Barnes CA, McNaughton BL. The ventral striatum in off-line processing: ensemble reactivation during sleep and modulation by hippocampal ripples. J Neurosci. 2004;24:6446–6456. doi: 10.1523/JNEUROSCI.0575-04.2004. [DOI] [PMC free article] [PubMed] [Google Scholar]
- Poldrack RA, Clark J, Pare-Blagoev EJ, Shohamy D, Moyano JC, Myers C, Gluck MA. Interactive memory systems in the human brain. Nature. 2001;414:546–550. doi: 10.1038/35107080. [DOI] [PubMed] [Google Scholar]
- Redish AD. Beyond the cognitive map: from place cells to episodic memory. Cambridge MA: MIT; 1999. [Google Scholar]
- Redish AD, Johnson A. A computational model of craving and obsession. Ann NY Acad Sci. 2007;1104:324–339. doi: 10.1196/annals.1390.014. [DOI] [PubMed] [Google Scholar]
- Rosenzweig ES, Redish AD, McNaughton BL, Barnes CA. Hippocampal map realignment and spatial learning. Nature Neuroscience. 2003;6:609–615. doi: 10.1038/nn1053. [DOI] [PubMed] [Google Scholar]
- Schmitzer-Torbert NC, Redish AD. Development of path stereotypy in a single day in rats on a multiple-T maze. Archives Italiennes de Biologie. 2002;140:295–301. [PubMed] [Google Scholar]
- Schmitzer-Torbert NC, Redish AD. Neuronal activity in the rodent dorsal striatum in sequential navigation: separation of spatial and reward responses on the multiple-T task. J Neurophysiol. 2004;91:2259–2272. doi: 10.1152/jn.00687.2003. [DOI] [PubMed] [Google Scholar]
- Schoenbaum G, Roesch M. Orbitofrontal cortex, associative learning, and expectancies. Neuron. 2005;47:633–636. doi: 10.1016/j.neuron.2005.07.018. [DOI] [PMC free article] [PubMed] [Google Scholar]
- Schoenbaum G, Roesch M, Stalnaker TA. Orbitofrontal cortex, decision making, and drug addiction. Trends Neurosci. 2006;29:116–124. doi: 10.1016/j.tins.2005.12.006. [DOI] [PMC free article] [PubMed] [Google Scholar]
- Schultz W, Apicella P, Scarnati E, Ljungberg T. Neuronal activity in monkey ventral striatum related to the expectation of reward. J Neurosci. 1992;12:4595–4610. doi: 10.1523/JNEUROSCI.12-12-04595.1992. [DOI] [PMC free article] [PubMed] [Google Scholar]
- Scoville WB, Milner B. Loss of recent memory after bilateral hippocampal lesions. J Neurol Neurosurg Psychiatry. 1957;20:11–21. doi: 10.1136/jnnp.20.1.11. [DOI] [PMC free article] [PubMed] [Google Scholar]
- Skaggs WE, McNaughton BL, Wilson MA, Barnes CA. Theta phase precession in hippocampal neuronal populations and the compression of temporal sequences. Hippocampus. 1996;6:149–173. doi: 10.1002/(SICI)1098-1063(1996)6:2<149::AID-HIPO6>3.0.CO;2-K. [DOI] [PubMed] [Google Scholar]
- Somogyi P, Klausberger T. Defined types of cortical interneurone structure space and spike timing in the hippocampus. J Physiol (Lond) 2005;562:9–26. doi: 10.1113/jphysiol.2004.078915. [DOI] [PMC free article] [PubMed] [Google Scholar]
- Squire LR. Memory and the hippocampus: a synthesis from findings with rats, monkeys, and humans. Psychol Rev. 1992;99:195–231. doi: 10.1037/0033-295x.99.2.195. [DOI] [PubMed] [Google Scholar]
- Sutton RS, Barto AG. Reinforcement learning: an introduction. Cambridge MA: MIT; 1998. [Google Scholar]
- Swanson LW. Cerebral hemisphere regulation of motivated behavior. Brain Res. 2000;886:113–164. doi: 10.1016/s0006-8993(00)02905-x. [DOI] [PubMed] [Google Scholar]
- Tolman EC. Prediction of vicarious trial and error by means of the schematic sowbug. Psychol Rev. 1939;46:318–336. [Google Scholar]
- Tremblay L, Schultz W. Relative reward preference in primate orbitofrontal cortex. Nature. 1999;398:704–708. doi: 10.1038/19525. [DOI] [PubMed] [Google Scholar]
- Tulving E. Precis of elements of episodic memory. Behav Brain Sci. 1984;7:223–238. [Google Scholar]
- Wills TJ, Lever C, Cacucci F, Burgess N, O'Keefe J. Attractor dynamics in the hippocampal representation of the local environment. Science. 2005;308:873–876. doi: 10.1126/science.1108905. [DOI] [PMC free article] [PubMed] [Google Scholar]
- Wilson MA, McNaughton BL. Reactivation of hippocampal ensemble memories during sleep. Science. 1994;265:676–679. doi: 10.1126/science.8036517. [DOI] [PubMed] [Google Scholar]
- Wood ER, Dudchenko PA, Robitsek RJ, Eichenbaum H. Hippocampal neurons encode information about different types of memory episodes occurring in the same location. Neuron. 2000;27:623–633. doi: 10.1016/s0896-6273(00)00071-4. [DOI] [PubMed] [Google Scholar]
- Yamaguchi Y. A theory of hippocampal memory based on theta phase precession. Biol Cybern. 2003;89:1–9. doi: 10.1007/s00422-003-0415-9. [DOI] [PubMed] [Google Scholar]
- Ylinen A, Bragin A, Nadasdy Z, Jando G, Szabo I, Sik A, Buzsaki G. Sharp wave-associated high-frequency oscillation (200 Hz) in the intact hippocampus: network and intracellular mechanisms. J Neurosci. 1995;15:30–46. doi: 10.1523/JNEUROSCI.15-01-00030.1995. [DOI] [PMC free article] [PubMed] [Google Scholar]
- Yun IA, Wakabayashi KT, Fields HL, Nicola SM. The ventral tegmental area is required for the behavioral and nucleus accumbens neuronal firing responses to incentive cues. J Neurosci. 2004;24:2923–2933. doi: 10.1523/JNEUROSCI.5282-03.2004. [DOI] [PMC free article] [PubMed] [Google Scholar]
- Zar JH. Biostatistical analysis. Ed 4. Upper Saddle River, NJ: Prentice-Hall; 1999. [Google Scholar]


