

Abstract
Single-unit recording studies have demonstrated a close link between neural activity in the middle temporal (MT) area and motion perception. In contrast, researchers using functional magnetic resonance imaging and multivoxel pattern analysis methods have recently documented direction-specific responses within many regions of the visual system (e.g., visual cortical areas V1–V4v) not normally associated with motion processing. Our goal was to determine how these direction-selective response patterns directly relate to the conscious perception of motion. We dissociated neuronal responses associated with the perceptual experience of motion from the physical presence of motion in the display by asking observers to report the perceived direction of an ambiguous stimulus. Activation patterns in the human MT complex closely matched the reported perceptual state of the observer, whereas patterns in other visual areas did not. These results suggest that, even when selective responses to a given feature are distributed relatively broadly across the visual system, the conscious experience of that feature may be primarily based on activity within specialized cortical areas.
Keywords: consciousness, decision, fMRI, sensory neurons, vision, visual motion
Introduction
Neurons in the middle temporal (MT) area of the macaque monkey play an important role in motion perception (Dubner and Zeki, 1971; Zeki, 1974; Maunsell and Van Essen, 1983; Albright et al., 1984): single MT neurons discriminate random-dot motion patterns (RDPs) as well as observers (Newsome et al., 1989), lesions of MT selectively impair motion discrimination (Newsome and Pare, 1988), and MT responses predict directional judgments about ambiguous RDPs that contain equal motion energy in all directions (Britten et al., 1996). In contrast, recent investigations using multivoxel pattern analysis (MVPA) methods and functional magnetic resonance imaging (fMRI) reveal that many regions of human visual cortex (even regions not thought to contain direction-selective neurons such as visual cortical areas V2v and V3v) also encode information about motion direction (Kamitani and Tong, 2005, 2006; Serences and Boynton, 2007) (see also Haynes and Rees, 2005). This surprising result suggests either that motion perception in humans is based on a far more anatomically distributed code than in nonhuman primates or that the MVPA studies performed to date have not, in fact, been successful in isolating the neural mechanisms that support motion perception.
Observers in previous MVPA studies were either presented with one of several directions of motion or they were asked to selectively attend to one direction of motion within a display that contained two overlapping RDPs (Kamitani and Tong, 2006; Serences and Boynton, 2007). Consequently, the subjective experience of the observer was always correlated with either the actual or the attended direction of motion, making it difficult to clearly distinguish patterns of activation related to motion perception from patterns that reflect the encoding of other correlated sensory properties in the stimulus display. For example, neurons in V1 encode local motion signals from individual components of a moving stimulus (Movshon and Newsome, 1996; Rust et al., 2006), and many regions of early visual cortex show a strong response bias for radial (compared with tangential) patterns (Sasaki et al., 2006). Thus, classification accuracy may have been driven by either sensory or attentional modulations of these orthogonal stimulus properties and not necessarily by motion perception per se.
In the present study, observers were asked to report the perceived direction of either an unambiguous or an ambiguous RDP. When the stimulus contained unambiguous motion, MVPA revealed that most regions of the visual hierarchy [including V1–V4v, V3a, and human MT complex (hMT+)] encoded directional information (replicating Kamitani and Tong, 2006; Serences and Boynton, 2007). In contrast, the reported direction of ambiguous-motion displays was predicted by the pattern of activity in hMT+ and possibly in V3a but not by the pattern in any other visual area that we examined. Importantly, in these ambiguous-motion displays, the subjective experience of the observer was dissociated from the presence of global motion signals in the sensory stimulus (and thus from other correlated sensory factors as well).
These data suggest that neural activity in hMT+ is closely linked with the perception of motion, reconciling results from single-unit and MVPA fMRI investigations. More generally, the results underscore the importance of relating behavioral and neurophysiological measures when trying to determine whether activity in a cortical area has perceptual significance (Newsome et al., 1989; Buracas et al., 2005; Brouwer and van Ee, 2007; Williams et al., 2007). A given cortical area may show selectivity for a stimulus property and even show feature-specific attentional modulations for that property without those responses being directly related to the perceptual state of the observer.
Materials and Methods
Participants.
Ten neurologically intact observers participated in this study; all observers gave written informed consent in accord with the human subjects committee at The Salk Institute for Biological Studies (La Jolla, CA). Data from one observer were discarded because of technical problems that prevented the completion of the experimental session. Each observer was trained for 30 min outside the scanner and participated in a single 2 h scanning session. Compensation was $10 per hour for training and $30 per hour for scanning.
Unambiguous- and ambiguous-motion experiment.
The behavioral task is shown in Figure 1. All visual stimuli were rendered in black on a light gray background and were viewed via a front projection screen system (n = 7) or an Avotec (Stuart, FL) Silent Vision SV-701 Fiber Optic Visual System (n = 2). Observers were instructed to maintain visual fixation on a central square that was present throughout the duration of each scan (subtending 0.3° visual angle). Two additional small dots of the same size were presented 3.5° above fixation and ±5° to the left and right of fixation.
Figure 1.

Behavioral task. Stimulus display consisted of two RDPs, one presented on either side of the central fixation point. Each 12 s stimulus epoch was interleaved with a 12 s intertrial interval when only the small fixation points were visible. The percentage of dots moving coherently could be either 100 or 50% (unambiguous motion) or 0% (ambiguous motion). On unambiguous-motion trials, both RDPs moved in the same direction of global motion. Occasionally (four times per trial), the speed of the dots in either the left or the right aperture slowed briefly, cueing the observer to report the currently perceived direction of motion with a manual button-press response.
On each 12 s trial, two RDPs were presented within invisible circular apertures (subtending 6° diameter) centered 3.5° above fixation and ±5° to the left and right of fixation. On one-third of the trials, 100% of the dots in both fields moved coherently at either 45° or 135°, and, on another one-third of the trials, 50% of the dots in each field moved coherently (data from these 100 and 50% coherence trials were collapsed to form unambiguous-motion trials). On the unambiguous-motion trials, dots in both stimulus apertures moved in the same direction of global motion. The remaining one-third of the trials were ambiguous-motion trials, in which each dot moved in a unique direction determined by a uniform distribution spanning 0–360° (0% coherent motion). To encourage the perception of global motion on ambiguous-motion trials, observers were told that there was actually some coherent motion in the display.
Each small square dot moved at 4°/s, subtended 0.15° on a side, and had a limited lifetime of 12, 16.6 ms frames (200 ms); there were 225 of these small dots in each aperture. Four times on each trial, the dots in either the left or the right aperture slowed briefly (by 1.5–2°/s for 1 s) which cued the observer to report the currently perceived direction of global motion in the dot fields. The first target was presented 1.5 ± 0.75 s after the start of the trial, and each subsequent target was presented 2.75 ± 0.75 s after the previous target. On one-half of the scans, observers pressed a button with their right pointer finger to indicate 45° motion and a button with their right middle finger to indicate 135° motion. This mapping was reversed on the remaining scans (and the order was counterbalanced across observers). This counterbalancing was done so that motor responses would not be systematically correlated with the reported perceptual state of the observer. The next trial began after a blank intertrial-interval (ITI) of 12 s (with only the small fixation points visible); the ITI was introduced to minimize the influence of motion after-affects on direction judgments. There were 18 trials in each scanning run, presented in a pseudorandomized trial order. At the end of each block, feedback was given about discrimination accuracy based solely on performance on 50 and 100% coherent motion trials. A trial was counted as correct and considered for subsequent analysis if (1) the observer correctly identified the global direction of the RDP on unambiguous-motion trials, and (2) the observer did not switch his/her answer during a trial (switching occurred on 1.5% of unambiguous-motion trials and on 2.3% of ambiguous-motion trials).
Retinotopic mapping procedures.
Retinotopic mapping data were obtained in one to two scans per observer using a checkerboard stimulus and standard presentation parameters [stimulus flickering at 8 Hz and subtending 45° of polar angle (Engel et al., 1994; Sereno et al., 1995)]. This procedure was used to identify ventral visual areas V1v, V2v, V3v, and V4v, as well as dorsal region V3A, which contains a representation of both the upper and the lower visual field. To aid in the visualization of early visual cortical areas revealed by the functional localizer and retinotopic mapping procedures, we projected the retinotopic mapping data onto a computationally inflated representation of each observer's gray/white matter boundary.
fMRI data acquisition and analysis.
MRI scanning was performed on a Signa EXCITE 3 tesla GE Healthcare (Little Chalfont, UK) “short-bore” scanner equipped with an eight-channel head coil at the Center for Functional Magnetic Resonance Imaging, University of California, San Diego. During scanning, a custom-made bite bar was used to restrict head movement. Anatomical images were acquired using a spoiled gradient-recalled acquisition in a steady state T1-weighted sequence that yielded images with a 0.97 × 0.97 × 1 mm resolution. Whole-brain echo planar functional images (EPIs) were acquired in 32 transverse slices (repetition time, 2000 ms; echo time, 30 ms; flip angle, 90°; image matrix, 64 × 64; field of view, 220 mm; slice thickness, 3 mm, no gap).
Data analysis was performed using BrainVoyager QX (version 1.86; Brain Innovation, Maastricht, The Netherlands) and custom time series analysis and pattern classification routines written in Matlab (version 7.1; MathWorks, Natick, MA). Data from the unambiguous- and ambiguous-motion experiment were collected in either seven (n = 1) or eight (n = 8) scans per subject, with each scan lasting 440 s. EPIs were corrected using an unwarping procedure (the FUGE algorithm; FMRIB Software Library, University of Oxford Centre for Functional MRI of the Brain, Oxford, UK), slice time corrected, motion corrected (both within and between scans), and high-pass filtered (three cycles per run) to remove low-frequency temporal components from the time series.
Region of interest selection.
To identify visually responsive regions in visual cortex, a general linear model (GLM) was used to find voxels responding more strongly during all epochs of stimulation (i.e., 0, 50, and 100% coherent motion) compared with fixation. Regressors in the GLM were created by convolving a boxcar model of the stimulus protocol with a gamma function. Regions of interest (ROIs) in V1, V2v, V3v, V4v, and V3a were defined as the 75 most responsive voxels within each retinoptopically defined area (supplemental Fig. 1, available at www.jneurosci.org as supplemental material). We were only able to identify V3a in 16 of 18 hemispheres (we only identified left V3a in one observer and right V3a in another). Human MT+ was defined as the 75 most responsive voxels selected from a larger group of edge-contiguous voxels that were lateral to the parietal-occipital sulcus and beyond the retinotopically organized visual areas and likely contained voxels from within both MT and MST (hence the moniker hMT+; mean ± SD x, y, z Talairach coordinates of left hMT+ ROIs, −42 ± 2.2, −64 ± 5.4, 7 ± 4.3; mean coordinates of right hMT+ ROIs, 42 ± 2.9, −59 ± 5.3, 5 ± 4.2). IPS was defined as the 75 most responsive voxels selected from a larger group of edge-contiguous voxels superior to the parietal-occipital junction within the intraparietal sulcus (IPS), and the frontal eye field (FEF) was similarly selected from a group of edge-contiguous voxels near the junction of the precentral sulcus and the superior frontal sulcus. Supplemental Figure 2 (available at www.jneurosci.org as supplemental material) shows the location of the IPS and FEF ROIs in each observer in native scanner space, as well as a group average map in Talairach space to show the mean locations of IPS and FEF ROIs (Talairach and Tournoux, 1988). We choose 75 voxels because this was close to the lowest common number of voxels available across all visual areas (in most observers, V2v and V3v contained the fewest voxels). However, it should be noted that most visual areas contained >75 voxels, including area hMT+, and that increasing the number of voxels entered into the analysis had little impact on the data (we tested pattern sizes up to 90 voxels) (see Fig. 3). The mean amplitude of the blood oxygenation level-dependent response computed across observers within the V1 and hMT+ ROIs is shown in supplemental Figure 3 (available at www.jneurosci.org as supplemental material).
Figure 3.

Classification accuracy as a function of multivoxel pattern size. Classification accuracy for the reported direction of unambiguous stimuli (light gray bars) and ambiguous stimuli (dark gray bars) computed using different numbers of voxels within V3a and hMT+. In V3a, classification accuracy was above chance on ambiguous-motion trials only for pattern sizes of 85 and 90 voxels (and marginally significant with a pattern size of 75 voxels). In contrast, activation patterns in hMT+ predicted the reported direction of ambiguous stimuli across all pattern sizes. *p < 0.05, **p < 0.01, ***p < 0.005. Error bars reflect SEM across observers.
Multivoxel pattern analysis.
First, we extracted the raw time series from each of the 75 voxels within each ROI (e.g., left V1) during a time period extending from 6 to 14 s after the presentation of each stimulus. The epoched time series from each voxel was then normalized using a z-transform. Temporal epochs from unambiguous-motion trials from all but one scan were extracted to form a “training” dataset for the classification analysis. This training dataset was used to generate two mean activation patterns comprising the response in each voxel to 135° and 45° unambiguous-motion trials. Next, epochs from both unambiguous- and ambiguous-motion trials from the remaining scan were defined as a “test” set (note that we use the term “scan” to refer to an entire 440 s data collection sequence so the training and test data are always independent). All test data belonging to a particular stimulus/perceptual condition were then averaged together, creating a mean activation pattern characterizing the responses across the 75 voxels within the currently considered ROI. Only data from unambiguous-motion trials were used to generate the training activation pattern, so all test activation patterns (from both unambiguous- and ambiguous-motion trials) were compared against patterns of activation evoked by unambiguous-motion stimuli.
We then classified each test pattern by computing the Mahalanobis distance (md) between the test activation pattern that was currently under consideration (a vector of voxel responses, X) and each activation pattern that characterized the mean response to either 135° or 45° unambiguous motion during the training scans:
where S is the pooled covariance matrix estimated from the training images, and X̄i is the mean training activation vector for each direction condition i. The parameters S and X̄i were computed using only data from the training set. The test activation vector was then assigned to the condition for which md(i) was smallest. This procedure was repeated using a “hold-one-scan-out” cross-validation procedure so that the images from every scan were used as test images in turn. Thus, if the observer completed eight scans, the overall classification accuracy was defined as the average classification accuracy across all eight possible permutations of holding one scan out as the test set and using the remaining scans as a training set. Classification was performed using activation vectors of different lengths, with the most discriminating voxels [determined using a pooled variance t test computed only using the training activation vectors (Haynes and Rees, 2005)] entered first (until all 75 voxels from the ROI were included). Chance classification accuracy was always 50% because we were trying to predict whether or not the observer indicated 45° or 135° motion. Classification accuracy was computed separately for each ROI based on the 75 most responsive voxels within that ROI (e.g., 75 voxels from left hMT+); accuracy data from complementary ROIs in each hemisphere were then averaged because no significant differences were observed between left and right visual areas.
The Mahalanobis distance between two activation patterns is similar to the Euclidian distance between the patterns, except that the variance of each voxel and the covariance (or correlation) between voxels is taken into account. The sum of squared differences between the test pattern and each of the training patterns is captured by the product of the first and last terms in the above equation (yielding the Euclidian distance between the patterns). This distance is then weighted by the covariance matrix S, which accounts for the variance of each voxel (along the main diagonal of the matrix), as well as the covariance between voxels (off diagonal elements). Therefore, voxels that are either noisy (high variance) or strongly correlated with other voxels (high covariance) will contribute less to the estimated distance between the test and training patterns. As a result, when a test pattern is assigned to a particular condition (135° or 45° motion), it simply means that the weighted distance between the test pattern and the respective training pattern is smaller than the weighted distance between the test pattern and the alternative training pattern. This might occur either because there is a high degree of similarity between the patterns across all voxels or because some smaller subset of highly reliable and independent voxels shows a similar pattern. Thus, this approach differs from simple correlation and from the Euclidian distance metric because it not only accounts for similarity between patterns but also for the reliability and independence of each variable (voxel) in the pattern.
We also tested classification accuracy after removing the mean activation level from each voxel-by-voxel response pattern (Fig. 2 C). This was done because differences in mean activation levels can contribute to overall classification accuracy because the Mahalanobis distance is based on a “sum of squared differences” between patterns. However, removing the mean from each activation pattern results in a rank deficient (and non-invertible) covariance matrix S. Therefore, we used the normalized Euclidian distance as our distance metric, which is the sum-of-squared-differences weighted by the variance of each voxel (i.e., the main diagonal of the covariance matrix S). Thus, this normalized Euclidian distance is identical to the Mahalanobis distance except that correlations between voxels are not taken into account.
Figure 2.
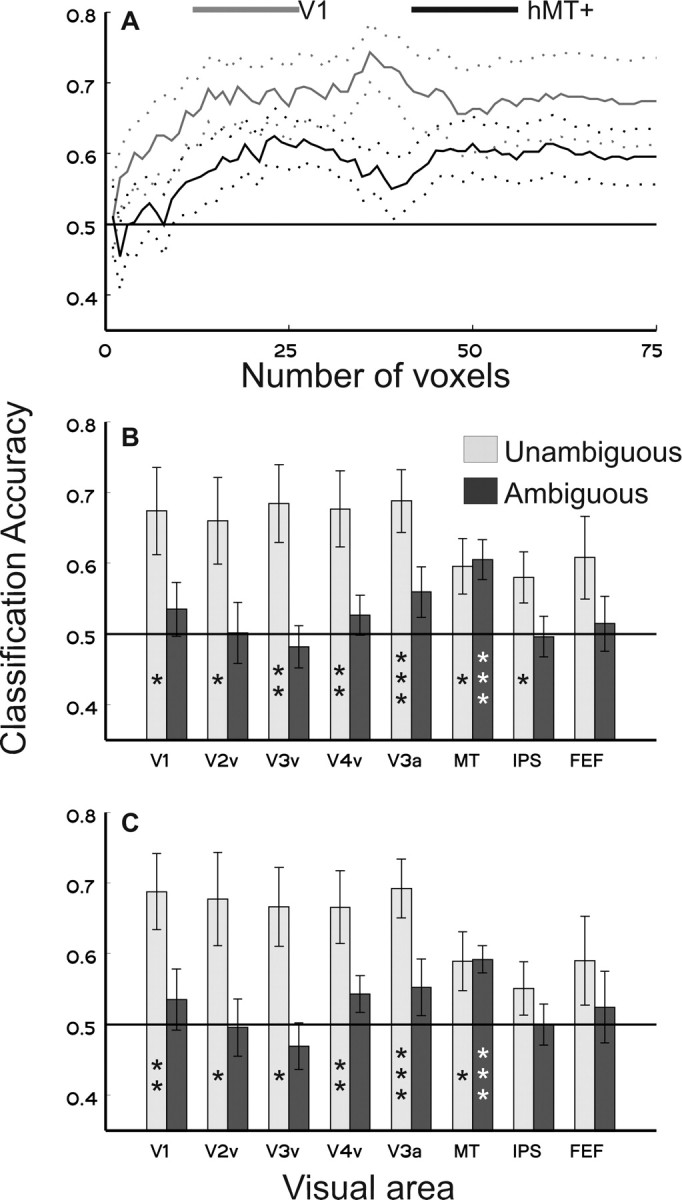
Classification accuracy for unambiguous- and ambiguous-motion stimuli. A, Classification accuracy of unambiguous-motion stimuli plotted as a function of the number of voxels included in the pattern analysis from V1 (light gray line) and from hMT+ (solid black line). B, Classification accuracy from each visual area with all 75 voxels included. Light gray bars indicate accuracy on unambiguous-motion trials, and dark gray bars indicate accuracy on ambiguous-motion trials (planned paired t tests against chance, *p < 0.05, **p < 0.01, ***p < 0.005). C, Classification accuracy after removing the mean activation levels from each multivoxel pattern before analysis. Error bars reflect SEM across observers.
Computing directional bias of ambiguous RDPs.
Although the ambiguous RDPs were generated using a uniform distribution of dot directions over 360°, slight directional biases occurred over the course of each 12 s trial because of random replotting of “expired” dots and because each dot started in a random position within the aperture. To evaluate the possibility that these small directional biases contributed to behavioral choices made during the experiment, we summed the projections of the dot displacements in each of the two target directions (135° and 45°) across the two RDPs:
 |
where a is an index over RDP apertures, d is an index over the component dots in each RDP, t is an index over stimulus frames (720 frames at 60 Hz equals 12 s), V is either 135° or 45°, Vd is the angle of the trajectory of the dth dot, and the last term is the displacement of the dot on frame t (speed of the dot). In addition, we also computed the motion energy during successive 500 ms temporal epochs preceding a cue that instructed the observers to report the currently perceived direction (a slowing of one of the apertures). This analysis was performed because the observers might have been basing their decisions on weak motion energy biases that occurred just before or during the cue period (see Fig. 4).
Figure 4.

Motion energy bias in RDPs on ambiguous-motion trials. In all panels, the gray shaded region indicates the epoch during which an RDP slowed to cue the observer to report the currently perceived direction of motion. Dashed lines depict calculations based on motion energy in both apertures, and solid lines depict calculations based only on the motion energy in the aperture containing the motion cue. Time 0 corresponds to the end of the 1 s cue period. All data points reflect the total motion energy integrated from the corresponding time on the x-axis until the end of the 1 s cue period (e.g., leftmost points indicate motion energy integrated over the 2500 ms preceding the end of the cue period). A, Percentage of ambiguous-motion trials containing more motion energy at 135° averaged over temporal epochs preceding all cue presentations (there were 4 cues on each trial). B, Percentage correspondence between motion energy bias and behavioral responses on a trial-by-trial basis, averaged over temporal epochs preceding all cue presentations. C, Same as A, except based only on the temporal epoch immediately preceding the first cue on each trial. D, Same as B, except based only on the temporal epoch immediately preceding the first cue on each trial.
Eye tracking.
Eye tracking was performed at 60 Hz during scanning for two of the observers using a MR-compatible camera built into the video display goggles (Avotec Silent Vision SV-701 Fiber Optic Visual System). Data were first corrected for eyeblinks and linear drift, and then stable fixations that occurred outside of a 0.25° window surrounding the center of the screen were identified (a “fixation” was defined as a 200 ms epoch during which eye position did not deviate more than 0.25°). We then computed the mean X and Y position of the eye during all fixations away from the center of the screen for each condition. We also repeated this analysis during temporal epochs corresponding to the cues that instructed the observers to report the currently perceived direction of motion.
Results
The behavioral task is depicted in Figure 1. Because discrimination was well above chance on both 50 and 100% motion coherence trials, we collapsed data from these conditions (mean ± SEM, 94 ± 1.5 and 95 ± 1.7%, respectively). On 0% coherent motion trials, there was no correct answer (by definition); however, observers reported each possible direction with approximately equal frequency (50.4 ± 5.4% of trials reported as translating at 135°, averaged across all observers).
To assess the amount of information about unambiguous-motion stimuli encoded in each visual area, we first identified the 75 most visually responsive voxels in each region of occipital cortex (V1–V4v), human MT (hMT+), IPS, and FEF. A linear pattern classifier was then used to determine how well the pattern of activation within a given visual area discriminated the reported direction of the RDP. Prediction accuracy was computed for each observer by calculating the mean prediction accuracy across all eight unique permutations of holding one scan out as a test set and using the remaining scans as a training set (see Materials and Methods). This multivariate analysis assumes that many single voxels contain a slight preponderance of neurons tuned to a particular feature (such as a particular direction of motion), giving rise to a weak but detectable response bias (Haxby et al., 2001; Haynes and Rees, 2005; Kamitani and Tong, 2005; Norman et al., 2006; Peelen and Downing, 2007). The pattern of activation across an ensemble of weakly selective voxels can then be used to predict what feature is present in the stimulus (Haynes and Rees, 2005; Kamitani and Tong, 2005), attended to by the observer (Kamitani and Tong, 2005, 2006; Serences and Boynton, 2007) or, as in the present experiment, perceived by the observer.
With the possible exception of FEF, the pattern of activation in all visual areas contained sufficient information to classify the reported direction of unambiguous-motion stimuli (Fig. 2 A,B, light gray bars). Surprisingly, response patterns in early visual areas such as V1 classified stimulus direction more accurately than patterns in putative motion-selective areas such as hMT+. However, directly comparing classification accuracy between different visual areas is problematic because anatomical differences are likely to strongly influence the results (e.g., the organization of the underlying functional topology and the amount of “folding” along the cortical surface). In addition, early visual areas such as V1 are often three or more times larger than regions such as hMT+. Thus, the 75 most responsive voxels from V1 may provide higher signal-to-noise ratios compared with the 75 most active voxels from hMT+. For these reasons, we focus here on comparing classification accuracy within a visual area while observers viewed either unambiguous- or ambiguous-motion stimuli.
We next used the same pattern classifier that was trained to recognize unambiguous RDPs to predict the reported direction of ambiguous RDPs. Because global motion signals were essentially absent in the ambiguous stimuli, we reasoned that classification accuracy should be above chance only in those cortical regions in which activity is associated with the perceptual or decisional state of the observer (rather than associated with the sensory properties of the stimulus). In contrast to the unambiguous-motion condition, classification accuracy for the reported direction of ambiguous motion was only significant in hMT+ and marginally significant in area V3a (p < 0.1) (Fig. 2 B, dark gray bars). Because the algorithm was trained only using unambiguous-motion trials, the successful classification of ambiguous-motion stimuli demonstrates that the pattern evoked when the observer reported perceiving 135° or 45° more closely resembled the pattern evoked by the corresponding unambiguous-motion direction (for a more detailed description of how the similarity between patterns is defined, see Materials and Methods, Mulitvoxel pattern analysis). Indeed, the pattern of activation in hMT+ discriminates unambiguous and ambiguous stimuli approximately equally well (59.5 and 60.5%, respectively), suggesting that the perceptual or decisional state of the observer strongly modulates activity in this region even when no global motion signal is present in the display.
The observation that hMT+ is sensitive to the reported direction of ambiguous motion is consistent with reports from a similar single-unit physiology study (Williams et al., 2003). However, Williams et al. (2003) also reported selectivity for ambiguous motion within the lateral intraparietal region (LIP), whereas we did not observe selectivity within our IPS ROI. The reason for this potential discrepancy is not clear, but it may be simply the case that our IPS ROI does not correspond to the same functional region of parietal cortex; additional studies that specifically target the human analog to LIP will be needed to test this possibility.
The linear classification algorithm that we used (Fig. 2 B) can be influenced by differences in the mean activation level between conditions collapsed across all voxels in a visual area, because the Mahalanobis distance is a weighted sum of squared differences between each voxel in the patterns. As a result, differences in both the pattern of activation and in the overall mean activation level may both potentially contribute to the estimated distance between patterns. To evaluate this possibility, we replicated the main classification results after explicitly removing the mean signal level from each activation pattern (Fig. 2 C). In general, the results from this control analysis are similar to the data reported in Figure 2 B, suggesting that it is the pattern of activation that is primarily driving classification accuracy as opposed to overall differences in signal amplitude.
Finally, because the number of voxels entered into the analysis may influence peak classification accuracy, we replicated the main results from V3a and hMT+ using a range of pattern sizes (from 60–90 voxels) (Fig. 3). Additional voxels beyond the original 75 were added based on the next most responsive n voxels from each ROI (the V3a and hMT+ ROIs across all observers had a minimum of 90 voxels from which to select). Note that, although classification accuracy of ambiguous stimuli based on responses from hMT+ is uniformly significant across all pattern sizes, classification accuracy in V3a is only marginally significant at a pattern size of 75 and significant for pattern sizes of 85 and 90 voxels (p < 0.05). Based on the data depicted in Figures 2 and 3, it is apparent that classification accuracy based on activation patterns in V3a is not as robust as classification accuracy based on activation patterns in hMT+. However, given data from previous studies implicating V3a in motion processing (Tootell et al., 1997; Vanduffel et al., 2001; Orban et al., 2003; Serences and Boynton, 2007), we tentatively endorse the notion that V3a plays an important role in human motion perception in the absence of global motion signals. When possible, we also computed classification accuracy using a range of pattern sizes in the remaining visual areas; classification accuracy did not rise above significance in any region for any pattern size tested (i.e., 60–90 voxels).
On ambiguous-motion trials, the direction of each small dot in an RDP was assigned based on a uniform distribution over 360°. However, small biases in global motion could arise over the 12 s presentation period because each dot started in a randomized position within the circular aperture and had a limited “lifetime” of 200 ms. To assess the possibility that behavioral choices were driven by these small directional biases, we computed the projections of the dot displacements in the two target directions on each trial, summed across all dots in both apertures. Over all trials, there was no significant bias in the RDPs on ambiguous-motion trials (mean ± SEM, 48.6 ± 2.2% of trials had a slight bias toward 135°), suggesting that the randomized starting position and the limited dot lifetimes had little impact on total motion energy. The trial-by-trial correspondence between the motion bias of the RDPs and the subjects' response was 49.1 ± 1.7% of trials, which was not different from chance. In contrast, there was a perfect (100%) trial-by-trial correspondence between motion energy and behavioral choice on correct unambiguous-motion trials. As an additional check, we also computed the directional bias of the RDPs and the trial-by-trial stimulus bias/behavioral response correspondence in several discrete time bins preceding each cue that instructed the observer to report the currently perceived direction of motion (Fig. 4). We found no reliable evidence for either directional biases in the ambiguous RDPs or for a correspondence between directional biases and the reported percept of the observer. We therefore conclude that, on ambiguous-motion trials, observers were not basing their behavioral choices on small directional biases in the RDPs.
On unambiguous-motion trials, small differences in eye position that covaried with the reported direction of motion may have induced systematic modulations in activation patterns within retinoptically organized regions of visual cortex. However, it is unlikely that such eye movements were made on ambiguous-motion trials because there was no net global motion signal for the observer to track. In addition, eye movements should exert the largest influence on classification accuracy within V1, in which retinoptopic organization is most apparent. However, classification accuracy for the reported direction of an ambiguous stimulus based on the pattern of activation in V1 was not significantly different from chance (Fig. 2 B). Finally, we monitored eye position during scanning in two observers; deviations in eye position as a function of the reported direction of motion on both unambiguous- and ambiguous-motion trials were very small (<0.5° visual angle) (supplemental Figs. 4–6, available at www.jneurosci.org as supplemental material).
Discussion
Single-unit studies by Newsome and colleagues show a robust link between activity in macaque MT and motion perception (Newsome and Pare, 1988; Newsome et al., 1989; Salzman et al., 1990; Britten et al., 1996), even when the monkey is viewing an ambiguous stimulus (Britten et al., 1996). In apparent contrast to these single-unit studies, recent fMRI studies have shown that many stages of human visual cortex show direction-specific response patterns, including regions not commonly thought to be motion selective such as V2v and V3v (Kamitani and Tong, 2006; Serences and Boynton, 2007). We replicated these previous fMRI results by showing that nearly all regions of visual cortex encode information about the direction of an unambiguous-motion stimulus. These results might be taken to imply that motion processing is distributed across wider regions of cortex than the single-unit physiology data suggest. However, it is possible that some of these regions encode information about stimulus motion (or related sensory features) without directly reflecting the observers' perceptual state. In contrast, using an ambiguous-motion condition that closely resembles that of Britten et al. (1996), we find that behavioral choices correlate with systematic modulations only within hMT+ and less reliably in V3a.
Although our data suggest that response patterns within specific subregions of the visual system track the reported perceptual state of the observer, hMT+ is not thought to act alone to build a percept of moving stimuli in the visual field. Instead, directional selectivity in MT is thought to be based on converging inputs from V1 neurons that encode motion signals from small regions of the visual field [as in the “aperture problem” (Movshon and Newsome, 1996; Britten, 2003; Rust et al., 2006)]. However, by using an ambiguous stimulus to remove systematic sensory input, our data support the idea that activity in hMT+ plays an important role in supporting motion perception, in agreement with previous studies (Britten et al., 1996). On this account, although critical information may feed into hMT+ from other brain regions under unambiguous viewing conditions, it is ultimately the activation pattern in hMT+ that is read out to generate the perceptual experience of motion (Salzman et al., 1990).
Several recent reports have shown that direction-selective activation patterns can be found across a variety of cortical areas even when the stimulus remains constant and observers simply attend to different directions of motion (Kamitani and Tong, 2006; Serences and Boynton, 2007). However, our data suggest that, although feature-specific modulations are widespread, only a subset of these modulations actually correspond to changes in perception. Therefore, great care must be taken when interpreting neuroimaging data; it is possible that a cortical area may encode information about a particular stimulus feature, or even be modulated by attention to a particular feature, without actually being related to the reported perceptual experience of the observer.
Although observers were instructed to report the “perceived direction” of ambiguous stimuli, it is possible that they arbitrarily chose a direction independent of their subjective perceptual experience. If this is the case, then activation patterns in hMT+ would not correspond to perceptual representations but rather to the decisional state of the observer. However, this interpretation contradicts much of the single-unit recording literature, in which MT is generally thought to provide perceptual signals on which subsequent decisions are based (Britten et al., 1996; Ditterich et al., 2003). In addition, the activation patterns we report here cannot reflect a representation of the ultimate motor output because the response effectors associated with each direction of motion were counterbalanced. Nevertheless, we cannot rule out the possibility that the patterns of activation observed in hMT+ did correspond to an abstract code that represents the response (135° or 45°) independent of both the phenomenal perceptual experience of the observer and the appropriate motor output.
In apparent contrast to previous reports (Shadlen and Newsome, 2001), we found a low correspondence between activation patterns in putative human oculomotor areas (IPS and FEF) and the reported direction of ambiguous motion. However, in most previous studies, the selected direction of motion was reported using a saccadic eye movement (with some exceptions, see Williams et al., 2003). In this situation, oculomotor areas of the visual system (e.g., LIP) integrate sensory evidence in favor of the most appropriate motor response given the available evidence (Mazurek et al., 2003; Huk and Shadlen, 2005). Given the manual responses made by our observers (and the counterbalanced response mappings), it is not surprising that we failed to observe strong modulations in IPS and FEF during ambiguous viewing conditions.
In conclusion, our results support the notion that the subjective experience of a given feature may be based primarily on activity within specialized cortical regions. Three recent fMRI studies show a similar correlation between subjective experience and activity within specific subregions of visual cortex. First, amplitude modulations in the fusiform face area predict perceptual judgments about whether or not an ambiguous “Mooney face” image (Mooney, 1957) is a face or a non-face object (McKeeff and Tong, 2007). Second, fluctuations in the pattern of activity across the lateral occipital complex predicted success on an object discrimination task, whereas patterns of activity in earlier regions did not (Williams et al., 2007). Finally, ambiguous “structure from motion” can be decoded based on the responses in hMT+ and other areas sensitive to structure from motion (Brouwer and van Ee, 2007). Together with the present results, these data support the notion that, even when responses to a given feature are distributed relatively broadly across the visual system, the conscious experience of that feature may still be closely linked to a specialized cortical area.
Footnotes
This work was supported by National Institutes of Health Grants EY12925 and EY017261. We thank Ione Fine and Charles Chubb for helpful comments. J.T.S. and G.M.B. conceived research and wrote this manuscript; J.T.S. designed the experiment and analyzed data.
References
- Albright TD, Desimone R, Gross CG. Columnar organization of directionally selective cells in visual area MT of the macaque. J Neurophysiol. 1984;51:16–31. doi: 10.1152/jn.1984.51.1.16. [DOI] [PubMed] [Google Scholar]
- Britten KH. The middle temporal area: motion processing and the link to perception. In: Chalupa LM, Werner JS, editors. Visual neurosciences. Cambridge, MA: MIT; 2003. [Google Scholar]
- Britten KH, Newsome WT, Shadlen MN, Celebrini S, Movshon JA. A relationship between behavioral choice and the visual responses of neurons in macaque MT. Vis Neurosci. 1996;13:87–100. doi: 10.1017/s095252380000715x. [DOI] [PubMed] [Google Scholar]
- Brouwer GJ, van Ee R. Visual cortex allows prediction of perceptual states during ambiguous structure-from-motion. J Neurosci. 2007;27:1015–1023. doi: 10.1523/JNEUROSCI.4593-06.2007. [DOI] [PMC free article] [PubMed] [Google Scholar]
- Buracas GT, Fine I, Boynton GM. The relationship between task performance and functional magnetic resonance imaging response. J Neurosci. 2005;25:3023–3031. doi: 10.1523/JNEUROSCI.4476-04.2005. [DOI] [PMC free article] [PubMed] [Google Scholar]
- Ditterich J, Mazurek ME, Shadlen MN. Microstimulation of visual cortex affects the speed of perceptual decisions. Nat Neurosci. 2003;6:891–898. doi: 10.1038/nn1094. [DOI] [PubMed] [Google Scholar]
- Dubner R, Zeki SM. Response properties and receptive fields of cells in an anatomically defined region of the superior temporal sulcus in the monkey. Brain Res. 1971;35:528–532. doi: 10.1016/0006-8993(71)90494-x. [DOI] [PubMed] [Google Scholar]
- Engel SA, Rumelhart DE, Wandell BA, Lee AT, Glover GH, Chichilnisky EJ, Shadlen MN. fMRI of human visual cortex. Nature. 1994;369:525. doi: 10.1038/369525a0. [DOI] [PubMed] [Google Scholar]
- Haxby JV, Gobbini MI, Furey ML, Ishai A, Schouten JL, Pietrini P. Distributed and overlapping representations of faces and objects in ventral temporal cortex. Science. 2001;293:2425–2430. doi: 10.1126/science.1063736. [DOI] [PubMed] [Google Scholar]
- Haynes JD, Rees G. Predicting the orientation of invisible stimuli from activity in human primary visual cortex. Nat Neurosci. 2005;8:686–691. doi: 10.1038/nn1445. [DOI] [PubMed] [Google Scholar]
- Huk AC, Shadlen MN. Neural activity in macaque parietal cortex reflects temporal integration of visual motion signals during perceptual decision making. J Neurosci. 2005;25:10420–10436. doi: 10.1523/JNEUROSCI.4684-04.2005. [DOI] [PMC free article] [PubMed] [Google Scholar]
- Kamitani Y, Tong F. Decoding the visual and subjective contents of the human brain. Nat Neurosci. 2005;8:679–685. doi: 10.1038/nn1444. [DOI] [PMC free article] [PubMed] [Google Scholar]
- Kamitani Y, Tong F. Decoding seen and attended motion directions from activity in the human visual cortex. Curr Biol. 2006;16:1096–1102. doi: 10.1016/j.cub.2006.04.003. [DOI] [PMC free article] [PubMed] [Google Scholar]
- Maunsell JH, Van Essen DC. Functional properties of neurons in middle temporal visual area of the macaque monkey. I. Selectivity for stimulus direction, speed, and orientation. J Neurophysiol. 1983;49:1127–1147. doi: 10.1152/jn.1983.49.5.1127. [DOI] [PubMed] [Google Scholar]
- Mazurek ME, Roitman JD, Ditterich J, Shadlen MN. A role for neural integrators in perceptual decision making. Cereb Cortex. 2003;13:1257–1269. doi: 10.1093/cercor/bhg097. [DOI] [PubMed] [Google Scholar]
- McKeeff TJ, Tong F. The timing of perceptual decisions for ambiguous face stimuli in the human ventral visual cortex. Cereb Cortex. 2007;17:669–678. doi: 10.1093/cercor/bhk015. [DOI] [PubMed] [Google Scholar]
- Mooney CM. Age in the development of closure ability in children. Can J Psychol. 1957;11:219–226. doi: 10.1037/h0083717. [DOI] [PubMed] [Google Scholar]
- Movshon JA, Newsome WT. Visual response properties of striate cortical neurons projecting to area MT in macaque monkeys. J Neurosci. 1996;16:7733–7741. doi: 10.1523/JNEUROSCI.16-23-07733.1996. [DOI] [PMC free article] [PubMed] [Google Scholar]
- Newsome WT, Pare EB. A selective impairment of motion perception following lesions of the middle temporal visual area (MT) J Neurosci. 1988;8:2201–2211. doi: 10.1523/JNEUROSCI.08-06-02201.1988. [DOI] [PMC free article] [PubMed] [Google Scholar]
- Newsome WT, Britten KH, Movshon JA. Neuronal correlates of a perceptual decision. Nature. 1989;341:52–54. doi: 10.1038/341052a0. [DOI] [PubMed] [Google Scholar]
- Norman KA, Polyn SM, Detre GJ, Haxby JV. Beyond mind-reading: multi-voxel pattern analysis of fMRI data. Trends Cogn Sci. 2006;10:424–430. doi: 10.1016/j.tics.2006.07.005. [DOI] [PubMed] [Google Scholar]
- Orban GA, Fize D, Peuskens H, Denys K, Nelissen K, Sunaert S, Todd J, Vanduffel W. Similarities and differences in motion processing between the human and macaque brain: evidence from fMRI. Neuropsychologia. 2003;41:1757–1768. doi: 10.1016/s0028-3932(03)00177-5. [DOI] [PubMed] [Google Scholar]
- Peelen MV, Downing PE. Using multi-voxel pattern analysis of fMRI data to interpret overlapping functional activations. Trends Cogn Sci. 2007;11:4–5. doi: 10.1016/j.tics.2006.10.009. [DOI] [PubMed] [Google Scholar]
- Rust NC, Mante V, Simoncelli EP, Movshon JA. How MT cells analyze the motion of visual patterns. Nat Neurosci. 2006;9:1421–1431. doi: 10.1038/nn1786. [DOI] [PubMed] [Google Scholar]
- Salzman CD, Britten KH, Newsome WT. Cortical microstimulation influences perceptual judgements of motion direction. Nature. 1990;346:174–177. doi: 10.1038/346174a0. [DOI] [PubMed] [Google Scholar]
- Sasaki Y, Rajimehr R, Kim BW, Ekstrom LB, Vanduffel W, Tootell RB. The radial bias: a different slant on visual orientation sensitivity in human and nonhuman primates. Neuron. 2006;51:661–670. doi: 10.1016/j.neuron.2006.07.021. [DOI] [PubMed] [Google Scholar]
- Serences JT, Boynton GM. Feature-based attentional modulations in the absence of direct visual stimulation. Neuron. 2007;55:301–312. doi: 10.1016/j.neuron.2007.06.015. [DOI] [PubMed] [Google Scholar]
- Sereno MI, Dale AM, Reppas JB, Kwong KK, Belliveau JW, Brady TJ, Rosen BR, Tootell RB. Borders of multiple visual areas in humans revealed by functional magnetic resonance imaging. Science. 1995;268:889–893. doi: 10.1126/science.7754376. [DOI] [PubMed] [Google Scholar]
- Shadlen MN, Newsome WT. Neural basis of a perceptual decision in the parietal cortex (area LIP) of the rhesus monkey. J Neurophysiol. 2001;86:1916–1936. doi: 10.1152/jn.2001.86.4.1916. [DOI] [PubMed] [Google Scholar]
- Talairach J, Tournoux P. Co-planar stereotaxic atlas of the human brain. New York: Thieme; 1988. [Google Scholar]
- Tootell RB, Mendola JD, Hadjikhani NK, Ledden PJ, Liu AK, Reppas JB, Sereno MI, Dale AM. Functional analysis of V3A and related areas in human visual cortex. J Neurosci. 1997;17:7060–7078. doi: 10.1523/JNEUROSCI.17-18-07060.1997. [DOI] [PMC free article] [PubMed] [Google Scholar]
- Vanduffel W, Fize D, Mandeville JB, Nelissen K, Van Hecke P, Rosen BR, Tootell RB, Orban GA. Visual motion processing investigated using contrast agent-enhanced fMRI in awake behaving monkeys. Neuron. 2001;32:565–577. doi: 10.1016/s0896-6273(01)00502-5. [DOI] [PubMed] [Google Scholar]
- Williams MA, Dang S, Kanwisher NG. Only some spatial patterns of fMRI response are read out in task performance. Nat Neurosci. 2007;10:685–686. doi: 10.1038/nn1900. [DOI] [PMC free article] [PubMed] [Google Scholar]
- Williams ZM, Elfar JC, Eskandar EN, Toth LJ, Assad JA. Parietal activity and the perceived direction of ambiguous apparent motion. Nat Neurosci. 2003;6:616–623. doi: 10.1038/nn1055. [DOI] [PubMed] [Google Scholar]
- Zeki SM. Functional organization of a visual area in the posterior bank of the superior temporal sulcus of the rhesus monkey. J Physiol (Lond) 1974;236:549–573. doi: 10.1113/jphysiol.1974.sp010452. [DOI] [PMC free article] [PubMed] [Google Scholar]