

Abstract
To understand how odor information is represented and processed in the antennal lobe (AL) of Drosophila melanogaster, we have optically recorded glomerular calcium responses to single odors and odor mixtures from olfactory sensory neurons (OSNs) and projection neurons (PNs). Odor mixtures offer a good tool to analyze odor processing because experimental results can be tested against clear predictions. At the level of the OSNs, the representation of odor mixtures could be predicted from the response patterns of the components in most cases. PN responses to mixtures, however, provide evidences of interglomerular inhibition. Application of picrotoxin (PTX), an antagonist of GABAA-like receptors, enhanced odor responses, modified their temporal course, and eliminated mixture suppression at the PN level. Our results can be best explained by postulating the existence of at least two local networks in the fly AL: a glomerulus specific network, which includes excitatory and inhibitory connections and a PTX sensitive inhibitory global network that acts on all glomeruli with proportional strength to the global AL input.
Keywords: Drosophila melanogaster, olfaction, odor mixture, odor processing, antennal lobe, calcium imaging
Introduction
Most naturally occurring odors are mixtures of many chemical compounds. Often the identity of individual components themselves is lost in the blend, suggesting that the codes for each component interact in the nervous system to modify their individuality.
There is a long tradition in studying behavioral responses to odor mixtures both in vertebrates (Laing and Francis, 1989; Kay et al., 2003, 2005; Wiltrout et al., 2003; Cometto-Muniz et al., 2005) and invertebrates (Derby et al., 1996; Smith, 1998; Deisig et al., 2003), and technical advances have recently allowed a physiological approach. Studies in vertebrates analyzed the peripheral level (Duchamp-Viret et al., 2003; Oka et al., 2004), the olfactory bulb (Giraudet et al., 2002; Tabor et al., 2004; Lin et al., 2005) and the olfactory cortex (Lei et al., 2006; Zou and Buck, 2006). Several studies in invertebrates have focused mostly on the peripheral aspects (Akers and Getz, 1993; Derby, 2000; Deisig et al., 2006; Carlsson et al., 2007). For the antennal lobe (AL), the insect analog of the olfactory bulb, odor mixtures were studied in the pheromone system of moths and locusts (Christensen and Hildebrand, 1987; Anton and Hansson, 1996, 1998; Hansson and Anton, 2000) and with respect to temporal aspects (Lei et al., 2002; Heinbockel et al., 2004). In this study, we make quantitative predictions about neuronal responses to odor mixtures in the AL of Drosophila. These predictions can unveil network interactions, bringing us forward in our quest to understand neural processing.
In Drosophila each olfactory sensory neuron (OSN) expresses one (or two) class-specific odor receptors (ORs), and all OSNs expressing the same OR generally innervate one of ∼50 glomeruli (Couto et al., 2005; Fishilevich and Vosshall, 2005). Insect glomeruli are the interaction sites between OSNs, local neurons (LNs) and projection neurons (PNs), which correspond to vertebrate mitral/tufted cells. OSN activity is not simply relayed to the PNs in the AL, but is modified by interaction with the LN network (Wilson et al., 2004; Wilson and Laurent, 2005; Shang et al., 2007). Around 100 LNs branch across AL glomeruli, most of which innervate all or most glomeruli (Stocker et al., 1990; Ng et al., 2002; Wilson and Laurent, 2005; Shang et al., 2007). In contrast, most PNs branch in only one glomerulus (Marin et al., 2002; Wong et al., 2002).
The stereotypic organization of the Drosophila olfactory system, its relative simplicity, and the availability of genetic tools offer an ideal model to analyze odor-mixture coding. We have therefore measured odor-evoked calcium responses at the input and output of the AL network in identified glomeruli across many animals. Thus, we quantified the odor information fed into the network (OSN input) and the result of network processing (PN output). In addition, we used pharmacological tools to gain information about the role of specific network components. We present evidence showing that glomerulus specific modulation and global inhibition are involved in the shaping of PN responses in the fly AL.
Materials and Methods
Flies.
Adult female Drosophila melanogaster (aged 1–3 weeks) were used. Flies were reared in standard medium (100 ml, containing 91.8 ml of water, 11.8 g of sugar beet syrup, 1.08 g of yeast, 0.406 g of agar, 9.4 g of cornmeal, and 0.24 ml of propionic acid) and kept in incubators at 25°C, 50–60% relative humidity, with a 12 h light/dark regimen.
All experimental flies contained the calcium dependent fluorescent sensor G-CaMP (Nakai et al., 2001) in the P[UAS:G-CaMP 1.3] insertion in the first chromosome (crossed from ywP[UAS:G-CaMP];CyO/Sp;+; flies provided by Jing Wang, University of California, San Diego, San Diego, CA), together with a promoter:Gal4 insertion to direct expression of the calcium sensor to the desired neuron population. Mass labeling of OSNs was achieved with flies of the following genotype: ywP[UAS:G-CaMP];P[Or83b:Gal4] (provided by Leslie Vosshall, Rockefeller University, New York, NY). Or83b is an ubiquitous olfactory coreceptor, and this line drives expression in at least 60% of all OSNs (Larsson et al., 2004).
OSNs innervating glomerulus DM2 only were measured in ywP[UAS:G-CaMP];+;P[Or22a:Gal4]/TM2 flies. OSNs innervating glomeruli DM3 and DM5 were of genotype ywP[UAS:G-CaMP]/P[Or33b:Gal4];CyO/+; P[UAS:G-CaMP]/+ or ywP[UAS:G-CaMP]/P[Or33b:Gal4];Sp/+; P[UAS:G-CaMP]/+ (new crosses were set up every week and F1 flies were used). The second copy of G-CaMP was required to enhance the fluorescence. No differences between the two genotypes (CyO vs Sp) were found. The parental lines ywP[UAS:G-CaMP];CyO/Sp; P[UAS:G-CaMP] as well as P[Or33b:Gal4] and +;+;P[Or22a:Gal4] were provided by Leslie Vosshall. PN flies were of the following genotype: ywP[UAS:G-CaMP];P[GH146:Gal4]/CyO (stable line crossed from +; P[GH146:Gal4] flies provided by Reinhard Stocker, University of Fribourg, Fribourg, Switzerland). These flies express G-CaMP in ∼90 uniglomerular PNs and some multiglomerular PNs, covering ∼60% of the estimated 150 PNs found in each AL (Stocker et al., 1997; Jefferis et al., 2001).
Fly preparation.
Flies were prepared as described previously (Pelz et al., 2006). Briefly, flies were immobilized on ice for 10 min and then fixed to a Plexiglas stage by the head and neck, with thorax and abdomen hanging (supplemental Fig. 1A, available at www.jneurosci.org as supplemental material). Legs and abdomen were fixed to the stage with n-eicosane (Sigma, Deisenhofen, Germany) to reduce movement. Antennae were pulled forward using fine wire (Rediohm-800; H. P. Reid, Palm Coast, FL) to allow visual access to the antennal lobes. Then, a thin polyethylene foil supported by a plastic coverslip was sealed to the head with two-component silicon (KwikSil; WPI, Berlin, Germany) and a hole was cut to expose the cuticle. After placing a drop of Ringer's saline [containing (in mm) 130 NaCl, 5 KCl, 2 MgCl2, 2 CaCl2, 36 saccharose, and 5 HEPES, pH 7,3) (Estes et al., 1996) on top of the head, we cut a window in the cuticle. Glands and airbags were removed, and saline was exchanged several times. Flies were now ready for imaging.
Imaging.
Images were acquired with a CCD camera (TILL Photonics, Graefelfing, Germany) mounted on a fluorescence microscope (BX51WI; Olympus, Tokyo, Japan) equipped with a 20× water-dip objective (numerical aperture, 0.95; X LUM Plan FI; Olympus). Excitation light of 465 nm was produced with a monochromator (Polychrome II; TILL Photonics). A 490 nm dichroic mirror was used together with a 506–547 nm bandpass emission filter. Binned image size was 153 × 106 pixels on chip, corresponding to 245 × 170 μm at the preparation. We varied the exposure time between 70 and 120 ms to adjust for different basal fluorescence values across preparations. Eight-second films were recorded with an acquisition rate of 4 Hz. Odors were applied 3 s into each measurement. The interstimulus interval (ISI) was 2 min.
Stimulation.
For the experiments shown in Figures 1, 2, and 6 a constant air stream generated with a vibrating armature air compressor (Rietschle Thomas, Schopfheim, Germany) and regulated to a flow of 240 ml/min with a rotameter (Analyt, Muellheim, Germany) was split into six independent channels. In each of these channels the air could be directed either through an empty 20 ml glass vial or through a glass vial containing 5 ml of odor dilution in mineral oil (10−2 v/v) or mineral oil alone. Glass vials were sealed with aluminum ring caps with a silicon-Teflon septum. Beside the dilution in the solvent mineral oil, odors were further diluted 1:6 in the air stream.
Figure 1.
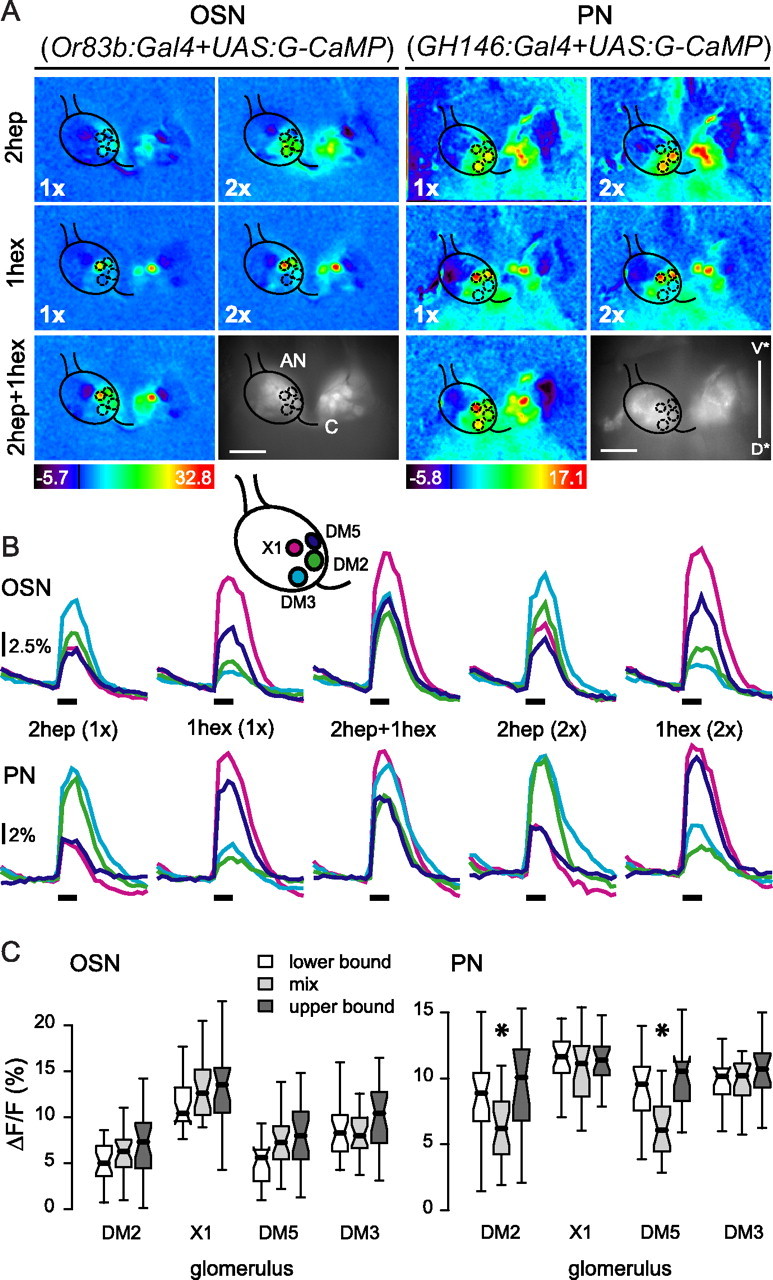
Representation of odor mixtures in the AL shows mixture suppression in PNs. A, Color-coded odor response patterns and anatomical view (raw fluorescence) for one fly for OSNs (left) and one fly for PNs (right). 2-Heptanone (2hep) and 1-hexanol (1hex) were presented alone [at onefold (1×) and twofold (2×) concentration] and together as mixture (2hep + 1hex; 1× each). The mask overlaying the left ALs shows the position of four identified glomeruli. The numbers on the color scale indicate the maximum and minimum ΔF/F (%), the black line is ΔF/F = 0. AN, Antennal nerve; C, commissure. Scale bar, 50 μm. V* and D* correspond to the ventral and dorsal directions, respectively, tilted from the neural axis (supplemental Fig. 1A, available at www.jneurosci.org as supplemental material). B, Median time traces of the responses to 2hep (1× and 2×), 1hex (1× and 2×), and the mixture measured in glomeruli DM2, DM3, DM5, and X1 (for details on glomerulus identification, see Materials and Methods; see scheme for glomerulus localization). The time of odor stimulation (1 s) is indicated by the black bar below each trace group. Scale bar: 2.5% ΔF/F for OSNs and 2% ΔF/F for PNs n as in C. C, Box plots of OSN (left) and PN (right) responses to the best odor at 1× concentration (lower bound), the mixture (2hep + 1hex), and the best odor at 2× concentration (upper bound) in each analyzed glomerulus. 2-Heptanone was the best odor for glomeruli DM2 and DM3; 1-hexanol was the best odor for glomeruli DM5 and X1. Asterisks indicate the two cases in which the response to the mixture was significantly lower than the lower bound (p < 0.05, Wilcoxon's test for paired samples; nlower bound OSN = 23 animals, nupper bound OSN = 22, nlower bound PN = 22, nupper bound PN = 17).
Figure 2.
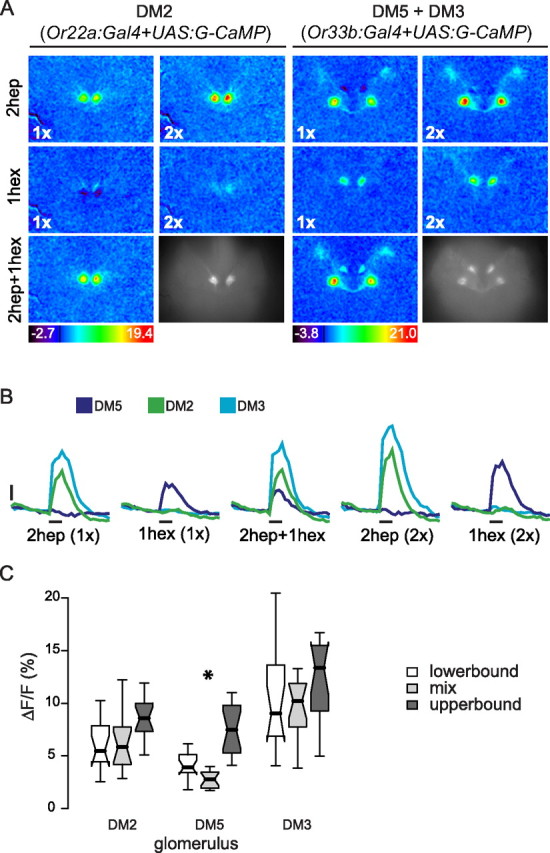
Mixture suppression at the OSN level in glomerulus DM5. A, Anatomical pictures and color-coded response patterns for 1-hexanol, 2-heptanone, and their mixture in flies where single classes of OSNs were labeled. Or22a:Gal4 was used to label OSNs innervating DM2 (left). Or33b:Gal4 was used to label OSNs innervating DM3 and DM5 (right). B, Median time traces of the responses to 2-heptanone (1× and 2×), 1-hexanol (1× and 2×), and the mixture (1× + 1×) measured in glomeruli DM2, DM3, and DM5. The time of odor stimulation (1 s) is indicated by the black bar below each trace group. Scale: 2.5% ΔF/F. n = 14 animals for DM2; n = 16 for DM3 and DM5. C, Box plot of the responses to the best odor at 1× concentration (lower bound), the mixture (2hep + 1hex; 1× each), and the best odor at 2× concentration (upper bound) in glomeruli DM2, DM3, and DM5. 2-Heptanone was the best odor for DM2 and DM3 and 1-hexanol for DM5. Asterisks indicate the case in which the response to the mixture was significantly lower than the lower bound (p < 0.05, Wilcoxon's test for paired samples).
Figure 6.
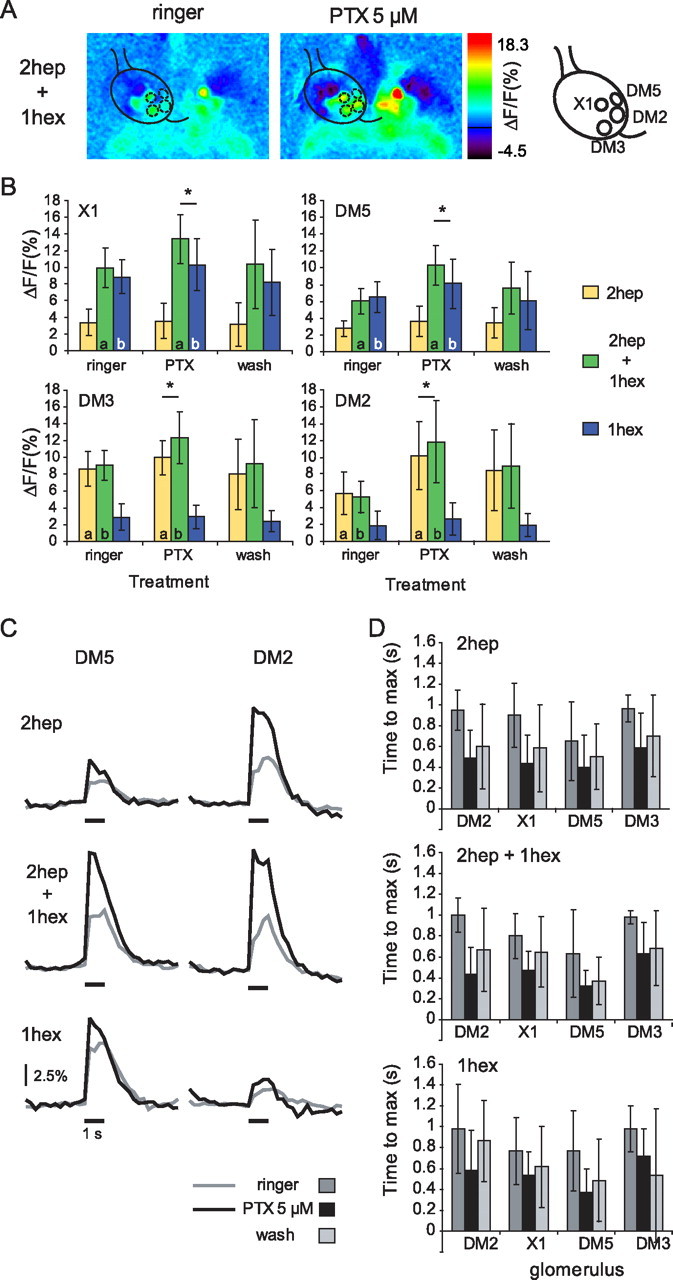
PTX modulates PN responses. A, Color-coded response to the mixture (1hep + 1hex) before (left) and during (right) application of PTX 5 μm (for the responses to the single odors, see supplemental Fig. 3, available at www.jneurosci.org as supplemental material). The position of the analyzed glomeruli is indicated by the mask over the left AL. The numbers in the color scale indicate the minimum and maximum ΔF/F (%) used for scaling. B, Mean response amplitude to 2hep, 1hex, and their mixture in glomeruli X1, DM5, DM3, and DM2 before (ringer), during (PTX), and after treatment (wash). The asterisks indicate a significant difference between the lower bound and the response to the mixture. The letters indicate a significant difference between the treatments (ringer vs PTX) (in all cases, p < 0.05) within each odor stimulus (two-way repeated-measures ANOVA and planned comparisons). Wash data were not included in the statistical test. Error bars indicate the SD of the mean (n = 15). C, Effect of PTX on the time course of odor responses: median responses to 1-heptanone, 1-hexanol, and the mixture in glomeruli DM5 and DM2 before (ringer; gray line) and during application of PTX 5 μm (black line) (n = 15). The traces corresponding to the wash were excluded for clarity. The time of odor presentation (1 s) is indicated by the black bar under each trace. Scale: 2.5% ΔF/F. Notice that PTX leads to an increase in response amplitude in particular within the first 500 ms. D, Time to maximum (mean ± SD) of the odor response measured for 2-heptanone, 1-hexanol, and the mixture in glomeruli DM2, DM3, DM5, and X1. A two-way repeated-measures ANOVA indicated no significant difference in the time to maximum between the odors (1-hexanol, 2-heptanone, and mixture), but a significant difference in the time to maximum between the treatments (ringer and PTX; p < 0.05). No significant interaction was found between the two factors (odors and treatment). Each glomerulus was tested separately. As shown in C, the time to maximum is significantly longer before PTX application than during PTX application. This effect could be “washed out” to a certain degree (not tested).
The switch between air and odor was performed by simultaneously activating two pinch valves (two-way solenoid pinch valves; Farmington Engineering, Madison, CT), one placed before the odor/air vial and the other one after the odor/air vial. Two valves for each channel, one before and one behind the odor-containing vial, were required to avoid contamination by passive odor diffusion. After the second set of valves all odor channels were plugged to a six-to-one Teflon manifold with a small mixing chamber. The output of the manifold (φ = 1 mm) was directed to the fly antennae. To achieve the same concentration for the single odors and the odors in the binary mixture, two channels were simultaneously opened for all stimulations (e.g., 1-hexanol plus mineral oil, 2-heptanone plus mineral oil, or 1-hexanol plus 2-heptanone). Odors were also presented at double concentration opening two channels containing the same odor simultaneously. An air exhaust was placed behind the preparation to rapidly eliminate the odor molecules from the fly's environment.
For the experiments in Figures 3–5, a main air flow (11 min) was directed to the fly through a glass tube (∼5 mm diameter). A secondary air stream was added through a lateral hole in the glass tube (150 ml/min). The secondary air stream was added to the main air stream with a 6:1 Teflon manifold, which collected the double outputs of three magnetic valves (The Lee Company, Westbrook, CT). Each magnetic valve had two positions. In the closed position air was guided to the manifold through an empty Pasteur pipette and in the open position through a Pasteur pipette containing two round filter papers (φ = 1 cm) loaded with 20 μl of odor dilution or mineral oil. All odors were diluted 1:100 in mineral oil. Odor mixtures were achieved by simultaneous switching of two or three valves. Odor-loaded Pasteur pipettes were disconnected from the valves immediately after each block of stimulations (three single odors plus four mixtures) and clean air was flushed through the valves for 1 min to avoid contamination. Filter papers were replaced after each experiment. The following odors were used: 1-butanol, isopentyl acetate, propionic acid, 2-heptanone, and 1-hexanol. The following binary and ternary mixtures were tested: 1-butanol/isopentyl acetate; 1-butanol/propionic acid; propionic acid/isopentyl acetate; 1-butanol/pentyl acetate/propionic acid; 1-hexanol/2-heptanone, 1-hexanol/propionic acid; 2-heptanone/propionic acid; and 1-hexanol/2-heptanone/propionic acid.
Figure 3.
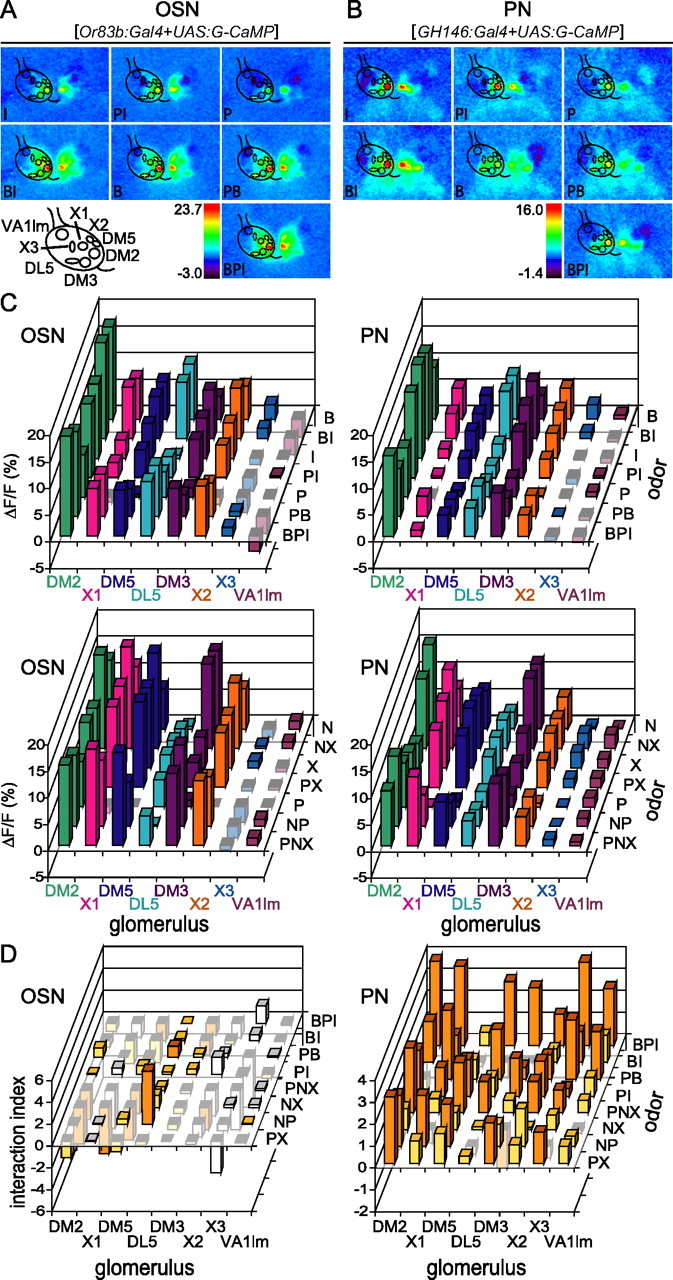
Mixture suppression is more frequent in PNs than in OSNs. A, Example of OSN responses to 1-butanol (B), isopentyl acetate (I), propionic acid (P), all binary mixtures (BI, PI, PB), and the ternary mixture (BPI). The mask over the left AL shows the position of eight identified glomeruli. B, Example of PN responses to the same odors as in A. The mask over the left AL shows the position of eight identified glomeruli. C, Amplitude of median responses to B, I, P, all binary mixtures and the ternary mixture (BI, PI, PB, and BPI) (top row), and to 2-heptanone (N), 1-hexanol (X), propionic acid (P), all binary mixtures (NX, PX, NP) and the ternary mixture (PNX) (bottom row). Note that some odors elicit negative responses in some glomeruli. Left, OSN (n = 9); right, PN (n = 10–15). D, Interaction index (lower bound − response to the mixture, where the lower bound is the response to the best component for the corresponding mixture) for OSNs and PNs. Orange bars indicate cases in which the lower bound was significantly different from the response to the mixture (Wilcoxon signed rank test, p < 0.05) indicating significant inhibitory interactions. Yellow bars indicate cases in which no significant difference was found between the lower bound and the mixture (Wilcoxon signed rank test, p > 0.05). White bars indicate cases in which at least one of the components evoked a negative response (these cases were excluded from the quantitative analysis) (see Results). Significant interaction indices <0 indicate cases in which mixture suppression can be excluded. Note that mixture synergism was not tested in this experiment. Left, OSN; right, PN.
Figure 4.
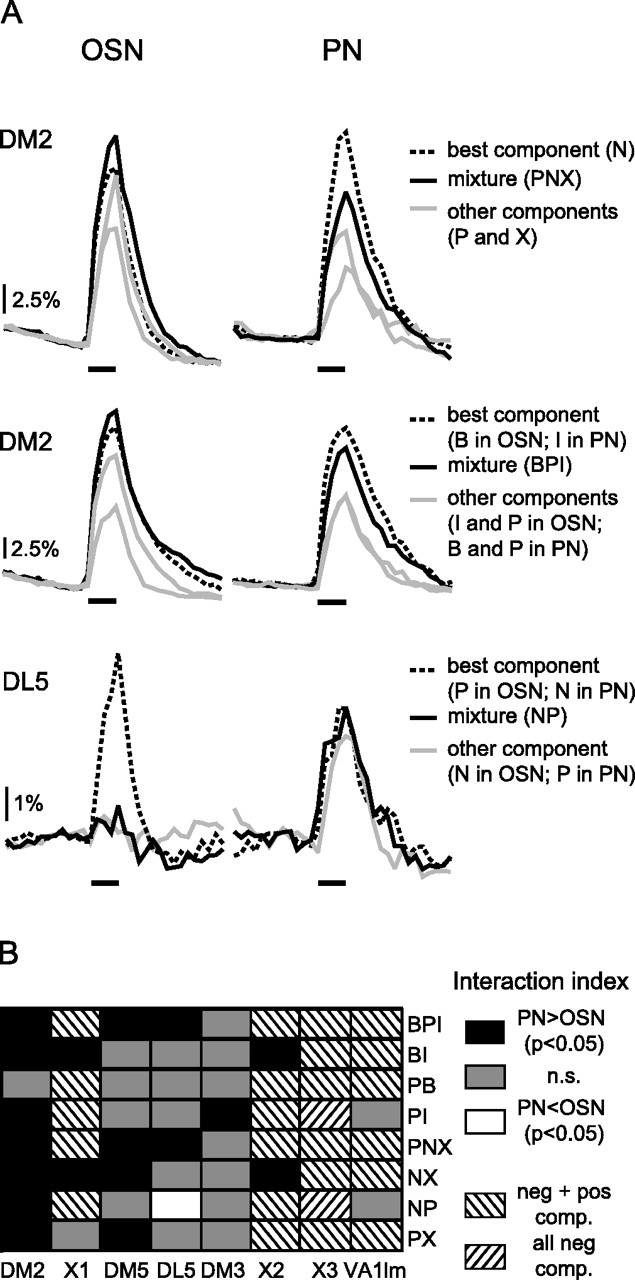
OSNs and PNs show different mixture-interaction profiles. A, Median traces of the responses to the components and mixtures in three exemplary cases. Top, Responses to propionic acid (P), 2-heptanone (N; best odor), 1-hexanol (X), and their ternary mixture (PNX) in glomerulus DM2. The response to the mixture was above the response to the best component (lower bound, the interaction index was significantly <0) in OSNs and below the lower bound (interaction index significantly >0) in PNs, indicating mixture suppression in PNs only. Middle, Responses to 1-butanol (B; best odor in OSNs), propionic acid (P), isopentyl acetate (I; best odor in PNs) and their ternary mixture (BPI) in glomerulus DM2. The interaction index was not significantly different from 0 for the OSNs, and significantly >0 for the PNs, indicating that mixture suppression is stronger in PNs than OSNs. Note that the best component for this mixture differed between OSNs and PNs. Bottom, Responses to 1-heptanone (N), propionic acid (P), and their binary mixture (NP) in glomerulus DM5. The interaction index was significantly >0 for the OSNs and not significantly different from 0 for the PNs, indicating mixture suppression at OSN level but not at PN level. Note that the best component was P in OSNs and N in PNs. Median traces from nine flies for OSNs and 10 for PNs. B, Comparison of the interaction profiles between OSNs and PNs. A two-way ANOVA with the factors neuron type (levels: OSN and PN) and odor mixture (levels: BI, PI, PB, NX, NP, PX, BPI, and PNX) was performed for each glomerulus, and followed by pairwise multiple comparisons (Holm-Sidak method). Black cells indicate significant differences between the interaction indices of OSNs and PNs, where the interaction index in PNs was higher than the interaction index in OSNs. Gray cells correspond to no significant differences between PNs and OSNs. The white cell corresponds to the only case in which the interaction index was significantly lower in PNs than in OSNs (DL5 for NP; A, bottom). Striped cells indicate cases that were excluded because of the negative responses to at least one component. nOSN = 9; nPN = 10–15.
Figure 5.
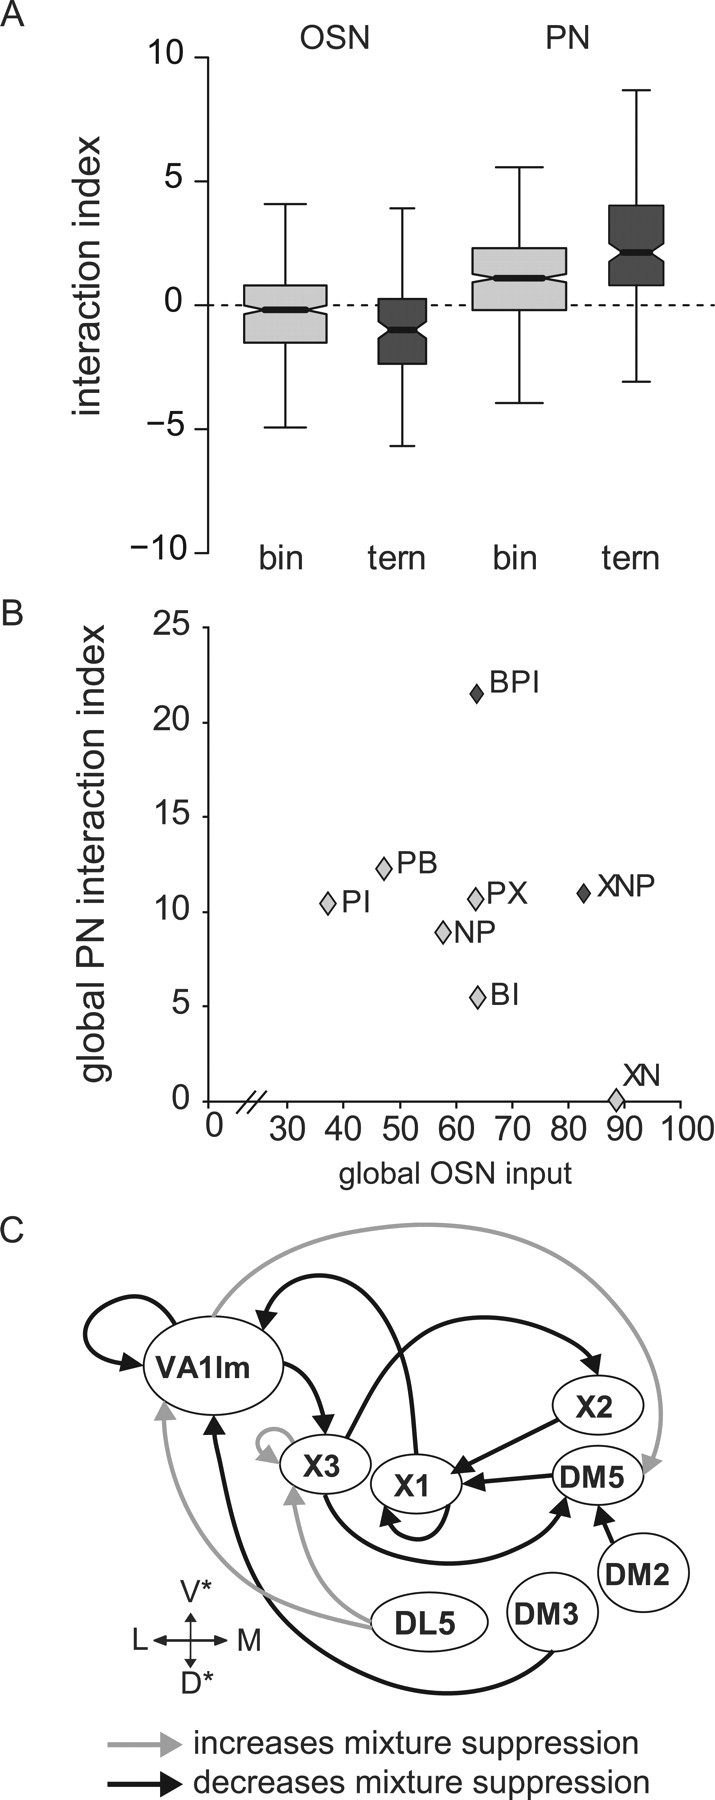
Glomerulus-specific interactions shape mixture responses in PNs. A, Box plot of the interaction index for binary and ternary mixtures in OSNs and PNs pooled over all mixtures, glomeruli, and animals. The width of the boxes is proportional to the number of observations (binary OSN, n = 432, 9 animals; ternary OSN, n = 144, 9 animals; binary PN, n = 558, 15 animals; ternary PN, n = 186, 15 animals) (see Materials and Methods for details on the box-plot symbolism). Note that the interaction index is larger in PNs than in OSNs, and larger for ternary mixtures than for binary mixtures. B, Relationship between the global input to the AL during mixture stimulation (cumulative OSN responses over all glomeruli), and the global interaction index in the PNs (cumulative PN interaction indices over all glomeruli). No significant correlation could be found between the two variables (Spearman rank order correlation, p > 0.4). Light gray symbols correspond to binary mixtures, and dark gray symbols correspond to ternary mixtures. C, Functional connectivity map reflecting the correlation analysis between the input to single glomeruli (OSN) and the interaction index in the PNs of single glomeruli (Table 1). Black arrows from glomerulus A to glomerulus B indicate cases in which the activity in glomerulus A positively affects the activity in glomerulus B (increased input to A correlates with decreased mixture suppression in B). Gray arrows indicate cases in which the activity of glomerulus A negatively affects the activity in glomerulus B (increased input to A correlates with increased mixture suppression in B). Glomeruli are arranged according to their position in the AL. Within the AL, these connections need not be direct, but might be mediated via intermediary glomeruli.
Odors were acquired from Sigma, and were of the highest purity available. New odor dilutions were prepared every week for the first experiment set, and once every month for the second set. Odor presentation lasted 1 s in all experiments. Odors were presented in a pseudorandomized sequence across animals. In all cases, odor mixtures were performed in such a way that the concentration of each component was the same during the single odor presentation and the presentation in the mixture. Thus, the total amount of odor molecules was higher during mixture presentation.
Pinch valves and magnetic valves were activated by a 12 V pulse given by a VC6 controller unit (perfusion valve system; Warner Instruments, Hamden, CT). Stimulation was controlled electronically with custom written software (Olfastim; provided by Alexander Galkin, Free University of Berlin, Berlin, Germany), which sent digital pulses to the corresponding channels through a USB digital–analog converter (Mem-Pio; BMC Messsysteme, Maisach, Germany).
Odor concentration was in the lower part of the dynamic range of the concentration–response curve for all odors (supplemental Fig. 2, available at www.jneurosci.org as supplemental material) (our unpublished observation).
Pharmacology.
A stock solution of Picrotoxin (Sigma) was prepared with DMSO (100 mm) and aliquots were kept protected from light at −20°C. Before each experiment, the stock solution was further diluted in Ringer's solution to achieve a final concentration of 5 μm. In each stimulation block, the two single odors and their mixture were presented with an ISI of 2 min. After two such blocks, the Ringer's solution covering the brain was exchanged with a solution containing PTX. After 2 min the stimulation block was presented again twice. Then, the PTX solution was removed by suction and the brain was flushed with Ringer's solution several times. The stimulation block was presented again twice after washing. Odor sequence within each stimulation block was changed in a pseudorandomized way within and between experiments.
The concentration of PTX was set to 5 μm because concentrations of 10 μm and higher induced spontaneous calcium waves in the AL, which made it impossible to analyze the data. Control application of DMSO 0.005% (v/v) alone produced no changes in response amplitude or temporal dynamic (supplemental Fig. 4, available at www.jneurosci.org as supplemental material).
Data analysis.
Flies with reliable calcium responses throughout the protocol and no or negligible responses to mineral oil were considered for data analysis. Data were processed with custom made routines written in IDL (Research Systems, Boulder, CO). First, films were corrected for lateral movement artifacts using anatomical landmarks. A bleach correction was performed by fitting a logarithmic function of the form F(t) = a × e(bt) + c to the average light intensity change in the AL over time, excluding those frames covering 4.5 s after stimulus onset. After bleach correction, the relative calcium change was calculated for each frame i as (ΔF/F)i (%) = (F(i) − F0)/F0 × 100, where F(i) is the absolute fluorescence of the ith frame and F0 the average fluorescence of the five frames before stimulus onset (background fluorescence).
Color-coded images were generated by taking the average fluorescence of four frames during stimulation minus the average fluorescence of the four frames before stimulus. A Gaussian filter was applied to these images (with a three pixel kernel) to reduce noise.
To identify the glomeruli, a set of odors was presented at a concentration that only elicits responses in one or few known classes of OSNs (de Bruyne et al., 2001; Hallem et al., 2004; Couto et al., 2005; Fishilevich and Vosshall, 2005; Pelz et al., 2006). Glomerulus identification was also performed based on anatomical cues. Some glomeruli could be reliably identified in all flies but not assigned to a glomerulus in the Drosophila antennal lobe atlas (Laissue et al., 1999) because of the lack of spatial resolution. The following landmark odors and concentrations were used for glomerulus identification: ethyl-hexanoate 10−6 (v/v) for DM2; pentyl acetate 10−6 (v/v) for DM3, E2-hexenal 10−4 (v/v) for DL5, and ethyl-3-hydroxybutyrate 10−6 (v/v) for DM5. VA11m was identified because of its location at the point where the antennal nerve enters the AL. Glomerulus X1 was characterized by its response to 1-butanol and 1-hexanol and could correspond to glomerulus DC2 because of its position. Glomerulus X2 was activated by 1-butanol and was located next to glomerulus DM5. This glomerulus could correspond to VM2 because of its position. Glomerulus X3 was characterized by its negative response to propionic acid in the OSNs and the vicinity to a glomerulus activated by 1-butanol (X1).
For time traces, the average light intensity of a 7 × 7 pixel square (corresponding to 2.6 × 2.6 μm) for each glomerulus was calculated. The response amplitude was calculated in the same way as the color-coded images (see above).
The time to maximum was calculated as the time (in milliseconds) from stimulus onset to the maximum of the calcium response (see Fig. 6).
Statistical analysis.
Additional analysis was performed with Microsoft Excel (Office 2003; Microsoft, Redmond, WA), R (http://www.R-project.org), SigmaStat (SPSS, Chicago, IL), and Statistica (Statsoft, Tulsa, OK).
For each glomerulus and mixture, the lower bound was calculated as the response to the strongest component. The upper bound was the response to a twofold higher concentration of the same odor. This test is based on the null hypothesis explained in the Results (supplemental Fig. 1B, available at www.jneurosci.org as supplemental material). A single-tailed Wilcoxon signed rank test (α = 0.025) comparing the measured response to the mixture and the lower or upper bound was performed for each glomerulus (in the second set of experiments only the lower bound was available and tested). In OSNs, some glomeruli showed negative responses to some odors. Because the null hypothesis does not apply to negative responses (see Results) (supplemental Fig. 1C, available at www.jneurosci.org as supplemental material), all odor mixtures that contained components that evoked negative responses were excluded from the statistical analysis and evaluated qualitatively.
In the pharmacological experiment, a two-way repeated-measures ANOVA was performed for each glomerulus. Planned comparisons between the response to the mixture and the lower bound in each treatment phase (odor effect; levels, 2-heptanone, 1-hexanol and mixture) and between the responses to each odor under the different treatments (treatment effect; levels, Ringer's solution and PTX) were performed using contrasts for the least square difference means (general linear model, performed with Statistica). A two-way repeated-measures ANOVA was performed to compare the time to reach maximum for the different odors and treatments. In all cases the first presentation of each stimulus under control conditions (Ringer's solution) was compared with the second presentation during the PTX treatment (see above) for each odor. Because not all animals gave reliable responses after PTX treatment, the wash phase of the experiment was left out of the statistical analysis.
The box plots in Figures 1D, 2C, and 5A contain the following information: the whiskers correspond to ± 1.5 × interquartile range (IQR). The hinges correspond to Q25 and Q75 (first and third quartiles). The line in the middle of the box shows the median of the distribution. The notches represent ±1.58 × IQR/, and give a rough idea of the 95% confidence interval for the difference between two medians (in cases of similar N) (McGill et al., 1978). In Figure 5A, the width of the boxes is proportional to the number of observations.
Results
To understand the way in which the AL network of Drosophila processes olfactory information, we analyzed the glomerular responses to a series of monomolecular odorants and their binary and ternary mixtures. Odor-evoked calcium changes were measured in OSNs and PNs.
The null hypothesis
As a first step in the analysis of mixture representation and processing it is necessary to establish what would be the expected response to an odor mixture in the absence of interactions between its components. Because the response profile of OSNs in Drosophila is determined by the OR they express (Hallem et al., 2004) and each glomerulus receives input from only one class of OSNs, we can base the predictions about the expected outcome in the case of no interaction on a model of two ligands binding a single receptor binding site (Tabor et al., 2004). If component A is the best ligand in a mixture of A and B, and the concentrations of A and B are within the dynamic range of the concentration-response relationships for that receptor, the stimulation with AB should result in one of the following cases: (1) if A activates the receptor and B does not, the response to the mixture (R[AB]) should correspond to the response to A (R[A]); (2) if A and B activate the receptor with equal intensity, so that AB would be comparable with AA, R[AB] should be as high as R[AA] (i.e., odor A presented at double concentration); (3) finally, if A and B activate the receptor, but are not equally potent as ligands, R[AB] should lie between R[A] and R[AA]. Therefore, if the measured response to the mixture R[AB] is either lower than R[A] or higher than R[AA], then the components of the mixture must “interact” at some level. We define the first case (R[AB]<R[A]) as “mixture suppression” and the second case (R[AB]>R[AA]) as “mixture synergism” (supplemental Fig. 1B, available at www.jneurosci.org as supplemental material). In the case of the olfactory system, mixture suppression or synergism can arise at the receptor level (e.g., when B is a competitive antagonist of A), or at the level of the neural network. This null hypothesis is only valid for mixtures whose components elicit increases in neuronal activity (positive components), and not for those with components that decrease neuronal activity (negative components). Mixtures containing positive and negative components might not fulfill the assumption that all components bind to the same receptor site. In such cases, we defined the no-interaction interval as the interval between the responses to both components (supplemental Fig. 1C, available at www.jneurosci.org as supplemental material). Finally, the case of mixtures containing only negative components must be treated separately because their concentration-response curves are not monotonic (data not shown).
Representation of single odors and binary mixtures
We first analyzed the response patterns of OSNs and PNs in flies stimulated with 1-hexanol (single and double concentration), 2-heptanone (single and double concentration), and their binary mixture. Color-coded pictures of the odor-evoked calcium responses are shown in Figure 1A (movies of these measurements are available at http://neuro.uni_konstanz.de/silbering). Odor responses were reliable across animals, with 2-heptanone activating glomeruli DM2 and DM3 and 1-hexanol activating glomeruli DM5 and X1 (Fig. 1A,B). A twofold increase in odor concentration induced responses of higher amplitude (1–3% response increase). Other glomeruli were active only in some animals, or could not be unambiguously identified. Responses followed a monophasic time course: calcium concentration increased rapidly with stimulus onset and decreased after reaching a maximum at or briefly after stimulus offset.
The glomerular response pattern to the binary mixture qualitatively corresponded to the combined response patterns to the single odors: all glomeruli present in the response pattern of either component were also active after stimulation with the mixture, and no new glomeruli were recruited (Fig. 1A,B). No qualitative differences were found in the time course of the responses between the single components and the mixture (Fig. 1B).
To analyze the existence of mixture interactions we measured the amplitude of the response to each component and the mixture, and defined the lower and upper bound of the no-interaction interval for each glomerulus (see above and Materials and Methods).
For OSNs, the amplitude of the response to the mixture was within the no-interaction interval in all glomeruli (Fig. 1C). In contrast, PN responses to the mixture were significantly lower than the lower bound in glomeruli DM2 and DM5 (Wilcoxon signed rank test, p < 10−4; n = 22), and were within the no interaction interval for X1 and DM3 (p > 0.1). The lack of mixture suppression in the OSNs could evidence the lack of interaction of the two odors at the peripheral level, or could be caused by masking of small signal decreases by scattered light from neighboring glomeruli.
To exclude the possibility that mixture interactions in OSNs might have been masked by light scattering, we repeated the experiment in flies where the expression of G-CaMP was restricted to single glomeruli. Expression in glomeruli DM2, DM5, and DM3 was driven by the promoter regions of OR22a and OR33b respectively (Fishilevich and Vosshall, 2005). Color-coded responses and morphological views are shown in Figure 2A. For glomeruli DM2 and DM3, no mixture interaction was found at the single glomerulus level: the response to the binary mixture was between the lower and upper bound (Fig. 2B,C). In glomerulus DM5, however, responses to the mixture were below the lower bound (Wilcoxon signed rank test, p < 0.001; n = 16). Summing up, we found mixture suppression in glomerulus DM5 at the level of the OSNs. This could result from interactions at the receptor-ligand level or they could be mediated by the AL network, e.g., through presynaptic inhibitory input onto OSN axons. Mixture suppression was still present in the PNs in glomerulus DM5. In glomerulus DM2 mixture interactions only occurred in PNs but not in OSNs (Figs. 1C, 2C) indicating an effect of the AL network. There was no interaction in glomeruli X1 and DM3 in any of the tested neuron populations.
Because the measured response to the mixture was in all cases below the upper bound of the no-interaction interval, we conclude that no mixture synergism takes place in the fly AL for the mixture of 1-hexanol and 2-heptanone.
A glomerulus specific network alters the representation of single odors and mixtures in PNs
Are mixture interactions odor-dependent? Do they increase with increasing complexity of the mixture? To answer these questions we tested an additional set of odors and its binary and ternary mixtures. Because there were no cases of mixture synergism in the first set of experiments, odors were measured only at one concentration and the data were tested for mixture suppression only. Two sets of three odors were tested: the first set included 1-hexanol (X), 2-heptanone (N) and propionic acid (P), and the second set included isopentyl acetate (I), 1-butanol (B) and propionic acid. Eight glomeruli (DM2, DM3, DM5, DL5, VA1lm, X1, X2, and X3) (see Materials and Methods) responded reliably to at least one of the tested odors and were used for subsequent analysis. The spatial representation of B, I, P, all binary mixtures and the ternary mixture in OSNs and PNs is shown in Figure 3, A and B. The response amplitudes for each single odor and the mixtures are shown in Figure 3C.
Interestingly the best odor for a given mixture in a given glomerulus was not always the same for OSNs and PNs. In glomerulus DM2, for example, responses to 1-butanol were higher than responses to isopentyl acetate in OSNs, but lower in PNs (Fig. 3C, supplemental Table 1, available at www.jneurosci.org as supplemental material). These differences in the relative response magnitudes for different odors within a glomerulus are additional evidence that, even during stimulation with monomolecular odors, PN responses are shaped by the AL network, in such a way that the gain for each glomerulus is regulated in an odor-specific way.
We defined an interaction index as the difference between the lower bound and the measured response to the mixture. Positive interaction indices significantly higher than zero indicate mixture suppression. Interaction indices not significantly different from zero correspond to the cases where the response to the mixture is not significantly different from the lower bound, and might reflect weak mixture suppression (Duchamp-Viret et al., 2003). Negative interaction indices significantly lower than zero indicate absence of mixture suppression. The interaction indices for all mixtures in OSNs and PNs are shown in Figure 3D.
The interaction profile was different in OSNs and PNs (Figs. 3D, 4B). Although only two cases of mixture suppression were found in OSNs (both in glomerulus DL5), every glomerulus showed suppression for at least two mixtures in the PNs (Fig. 3D). Some examples of the interaction dissimilarities between OSNs and PNs are shown in Figure 4A.
In OSNs, we found cases with negative responses to one component of the mixture and positive or no responses to the other component. For example, in glomerulus X3, the response to propionic acid was negative but the response to 1-butanol was positive (Fig. 3C). These cases, as well as cases where the responses to the mixture and both components were negative were excluded from the quantitative analysis used for the mixtures containing activating components (see above). The analysis of those mixtures containing positive and negative components (Fig. 4B) revealed no cases of mixture interactions, i.e., the responses to the mixtures were always within the no-interaction interval defined by the responses to the single components (supplemental Fig. 1C, available at www.jneurosci.org as supplemental material). Two mixtures contained negative components only (PI and NP in glomerulus X3). In both cases the response to the mixture was not significantly different from the response to the component with the strongest negative response.
The differences between OSNs and PNs in their interaction profiles were statistically tested with a two-way ANOVA for each glomerulus (excluding the mixtures containing inhibiting components). The interaction between the factors (neuron type vs odor mixture) was significant in all glomeruli except X2. Post hoc paired comparisons show that the differences between OSNs and PNs are odor and glomerulus dependent. Therefore, at least part of these interactions must be mediated by a network that is not uniform across the AL.
Another analysis confirmed this observation: across all glomeruli, the interaction index was higher for the binary mixtures than for the ternary mixtures in OSNs, whereas at the PN level, the interaction index was higher for ternary mixtures than for binary mixtures (Fig. 5A). Because the addition of a component to the mixture almost always implies an increase in the total input to the AL, an increase in mixture suppression with increasing mixture complexity could involve a global inhibitory network. However, because no significant correlation was found between the global input to the AL (measured as the cumulative OSN activity over all glomeruli) and the global interaction index in the PNs (measured as the cumulative interaction index over all glomeruli) (Fig. 5B) (Spearman rank order correlation, p > 0.4), mixture suppression cannot be mediated only by a global network.
To investigate whether glomerulus-specific connections could explain the observed mixture interactions, we analyzed the correlation between the input (OSN response to the different mixtures) and the interaction index in the PNs for all glomerulus pairs. The result of this analysis is the matrix of correlation coefficients shown in Table 1. A positive correlation coefficient (rij > 0) indicates that the interaction index in a glomerulus i increases with increasing OSN activity in a glomerulus j and suggests the existence of inhibitory connections from glomerulus j to glomerulus i, either directly or via intermediaries. For example, increased activity in glomerulus DL5 is correlated with increased mixture suppression in glomerulus X3 (Fig. 5C, gray arrow from DL5 to X3). A negative correlation coefficient (rij < 0) indicates that mixture suppression in a glomerulus i decreases with increasing OSN activity in a glomerulus j, and suggests the existence of excitatory connections from glomerulus j to glomerulus i; for example, input activity in glomerulus X3 is correlated with a decrease in mixture suppression in glomerulus DM5 (Fig. 5C, black arrow). These effects might be mediated by direct or indirect connections between the glomeruli, through which the input to one glomerulus influences the output from another glomerulus. Note that the relationships are not symmetrical. The model in Figure 5C, based on the correlation coefficients shown in Table 1, shows that in most cases increased input to one glomerulus is correlated with a decrease of the mixture suppression in other glomeruli. Such glomeruli might be connected through excitatory LNs and/or a disinhibitory circuit of inhibitory LNs. Some inhibitory effects were found, which would point to the existence of glomerulus specific inhibitory connections (see Discussion).
Table 1.
Correlation between input and interaction index in single glomeruli
| PN interaction index | OSN input |
|||||||
|---|---|---|---|---|---|---|---|---|
| DM2 | X1 | DM5 | DL5 | DM3 | X2 | X3 | VA1lm | |
| DM2 | −0.17 | 0.12 | 0.38 | 0.10 | −0.02 | 0.14 | −0.14 | 0.29 |
| X1 | 0.21 | −0.79* | −0.69* | 0.33* | −0.48 | −0.79* | 0.19 | −0.52 |
| DM5* | −0.76* | 0.17 | 0.12 | −0.67 | 0.10* | −0.10 | −0.88* | 0.74* |
| DL5 | 0.21 | −0.36 | −0.10 | 0.26 | −0.50 | −0.24 | 0.05 | −0.19 |
| DM3 | −0.29 | −0.36 | −0.07 | 0.10 | −0.43 | −0.36 | −0.26 | 0.00 |
| X2 | −0.43 | −0.38 | −0.31 | −0.41 | −0.02 | −0.60 | −0.69* | 0.43 |
| X3 | 0.48 | −0.21 | −0.10 | 0.83* | −0.60 | 0.05 | 0.74* | −0.71* |
| VA1lm | 0.48 | −0.76* | −0.62 | 0.83* | −0.71* | −0.52 | 0.55 | −0.81* |
Each cell shows the correlation coefficient calculated with the Spearman rank order correlation between the response in the OSNs and the interaction index in the PNs for all pairs of glomeruli. Asterisks show cases where the correlation was significant (p < 0.05). Correlation coefficients >0 indicate that the mixture suppression in the PNs increased with increased input. Correlation coefficients <0 indicate that the mixture suppression decreased with increased input. The former cases could be explained with inhibitory connections between the glomeruli. The latter cases could be explained with excitatory connections between the glomeruli (Fig. 5C).
Pharmacological manipulation of mixture interactions
The data provided so far show that inhibitory interactions among glomeruli (e.g., mixture suppression) influence odor responses in PNs. A large population of inhibitory interneurons is GABAergic. As in mammals, fast GABAergic inhibition in insects is mediated by PTX-sensitive GABAA-like receptors. We therefore analyzed PN response patterns induced by 1-hexanol, 2-heptanone and their mixture before and during application of PTX (Fig. 6).
Application of PTX (5 μm) did not qualitatively alter the population of activated glomeruli for the single odors or for the mixture: all glomeruli active in the absence of PTX (i.e., DM2, DM3, DM5, and X1) were also active during drug application and no additional glomeruli were recruited (Fig. 6A).
However, PTX significantly increased the responses in the strongest glomeruli for each odor, i.e., for 2-heptanone in glomeruli DM2 and DM3 (two-way repeated-measures ANOVA and planned comparisons, p < 0.001 and p < 0.05, respectively; n = 15), and for 1-hexanol in glomeruli DM5 and X1 (p < 0.05; n = 15) (Fig. 6B). The amplitudes of the responses evoked by the mixture were significantly increased in all analyzed glomeruli (p < 0.001 for DM2; p < 10−4 for X1; p < 10−6 for DM5; p < 10−4 for DM3).
PTX treatment did not only change the response amplitudes but also their time courses, unveiling the existence of a phasic component in odor responses (in the first 500 ms after stimulus onset), which is likely blocked by inhibitory input under control conditions (Fig. 6C). Accordingly, the time to reach the maximum was shifted from ∼1000 ms to ∼500 ms after stimulus onset during PTX application (Fig. 6C,D) (two-way repeated-measures ANOVA, p < 0.001; n = 15). The shift in the time to reach the maximum of the response was independent of the glomerulus and the odor (interaction treatment × odor, p > 0.05 for all glomeruli).
Responses to the mixture before PTX application corresponded to the expected responses calculated from the components' responses. Thus, unlike the animals in the first experiment (Fig. 1C), these animals did not show significant mixture suppression in any glomerulus. The pharmacological experiments (Fig. 6) were performed in spring and summer, whereas those shown in Figure 1 were performed in the preceding fall and winter. The genetic background of the fly strain could have drifted during this time period. Alternatively, the differences between the two independent experimental groups could suggest that olfactory networks within the AL are partially influenced by factors that we could not control, such as ambient air odors during development. In other words, there appears to be a plastic component in the AL, developmentally, environmentally, or otherwise, which we did not study here. During PTX application, however, responses to the mixture were significantly higher than the lower bound in all measured glomeruli (Fig. 6C) (two-way repeated-measures ANOVA, n = 15, p < 0.05 for DM2; p < 10−4 for X1; p < 0.005 for DM5; p < 0.005 for DM3). This result shows that the magnitude of the inhibitory input blocked by PTX was higher during stimulation with a mixture than during stimulation with the single components. Thus, PTX treatment revealed a mixture suppression in all glomeruli that was invisible under control conditions. The fact that all glomeruli show a PTX sensitive inhibition and that the inhibition was stronger when more glomeruli were activated (single odor vs mixture) is in agreement with the existence of a global inhibitory network which receives input in all or most glomeruli and makes output onto all or most glomeruli. A global inhibitory network, however, cannot explain the effects found in the first two experiments, where mixture suppression was glomerulus specific and odor dependent. Thus, at least two different local networks must be independently shaping the PN responses in the fly AL: a PTX sensitive global network and a glomerulus specific network.
Discussion
We have analyzed the role of the AL network in odor processing using two approaches. First, we investigated the existence and sources of across-glomeruli interaction by comparing the responses to odorants and their mixtures. Second, we pharmacologically manipulated the AL network with a GABAA antagonist (PTX) and compared odor and mixture responses before and during drug application.
To assess the existence of mixture interactions we have chosen a simple and conservative hypothesis. For each glomerulus we have defined the response to the most potent odor as the lower bound of the no-interaction interval, and the response to a twofold higher concentration of the same odor as the upper bound. We argue that all responses that lie within this range can be fully predicted from the components' responses, in whichas responses that fall outside this interval represent cases of mixture interaction (modified from Tabor et al., 2004). This is a conservative approach, which reduces the number of false positives, but might underestimate the occurrence of mixture interactions. For example, when both odors elicit a response, but the response to the mixture matches the lower bound of our estimation (i.e., the response to the strongest component), there is a weak mixture suppression (Duchamp-Viret et al., 2003), but these cases would be ignored in our conservative analysis. Indeed, our pharmacological treatment with PTX (Fig. 6) shows that there are global inhibitory interactions that remain undetected with this conservative null hypothesis. Furthermore, as shown in Figures 1 and 2, scattered light masks weak cases of mixture suppression in the experiment using mass staining of AL neurons. Therefore the significant effects found must reflect very strong cases of mixture interaction.
Glomerulus-specific interactions shape AL output
OSN responses to mixtures could mostly be predicted from the components' responses, in agreement with previous findings (Tabor et al., 2004; Deisig et al., 2006; Carlsson et al., 2007). There were rare cases of mixture suppression in OSNs (e.g., the responses to the mixture of 1-hexanol and 2-heptanone in glomerulus DM5, Fig. 2). Different mechanisms could underlie mixture interactions in OSNs peripherally: (1) different odors might have different diffusion times in the fluid that surrounds the OSNs (Laing, 1987), (2) mixture components might interact at the molecular level because of their receptor binding properties (Oka et al., 2004), or (3) they might activate antagonistic or synergistic second messenger cascades (Duchamp-Viret et al., 2003). Furthermore, presynaptic modulations at the axonal terminals are possible: (4) inhibitory input from the AL/OB network can reduce depolarization in OSN axons, thus reducing glomerular calcium signals of OSNs (Distler and Boeckh, 1997; Wachowiak et al., 2002; McGann et al., 2005; Wachowiak et al., 2005). Additional experiments are required to understand these mixture interactions at the AL input.
In contrast, we found strong mixture interactions in PNs (Figs. 1, 3, and 4), showing that these are mediated by the AL network. We did not find any case of mixture synergism. Inhibitory interactions (mixture suppression) were not globally distributed, but limited to certain glomeruli, depending on the mixture tested. We calculated the correlation between the input strength (OSN response) and the mixture interaction at the PN level (PN interaction index) for all glomeruli pairs. The result is a matrix of proposed between and within glomeruli effects (Table 1). Activity in some glomeruli enhanced mixture suppression in others or themselves (cases with positive correlation coefficient, e.g., glomerulus DL5 onto VA1lm or glomerulus X3 onto itself). Activity in other glomeruli reduced mixture suppression in others or themselves (cases with negative correlation coefficients, e.g., glomerulus DM2 onto glomerulus DM5 or glomerulus VA1lm onto itself) (Fig. 5C). Odor and glomerulus specific mixture suppression might result from dedicated, glomerulus specific inhibitory neurons or from the interplay between a global inhibitory network and glomerulus specific lateral excitatory input (Olsen et al., 2007) (see below). Such mixture suppression could contribute to the synthetic nature of odor perception, whereby odor blends often acquire a unique quality and are not perceived just as the sum of its components, sometimes to a degree where all information about the components is no longer perceptually available.
Fast GABA neurotransmission is involved in constitutive global inhibition and mixture suppression
Previous studies have shown that GABA is one of the neurotransmitters involved in odor processing in the insect AL (Sachse and Galizia, 2002; Wilson and Laurent, 2005). In our experiments, application of the GABAA antagonist PTX increased the amplitude of odor responses, modified their time courses and revealed mixture suppression. PTX had its strongest effect during the first 500 ms of the odor response, suggesting that GABAA receptors mediate an inhibitory input that suppresses the phasic component of odor responses in PNs. This result is consistent with previous pharmacological studies in Drosophila showing that PTX application only affects the early phase of the odor response, whereas blockers of metabotropic GABA receptors affect a later phase of the response (Wilson and Laurent, 2005). LNs which respond to odors with short bouts of action potentials are known from electrophysiological recordings (Wilson et al., 2004). It is possible that PTX blocks the inhibition of these LNs onto PNs or OSN axons.
The inhibitory network that is affected by PTX treatment is likely to be a functionally homogeneous, global network because the effect of PTX increased with stronger input to the AL. We thus conclude that a PTX sensitive global inhibitory network, which receives input in all or most glomeruli and gives output in all or most glomeruli, constitutively suppresses odor responses in the AL. Although we cannot exclude that glomerulus specific effects are also mediated by fast GABA neurotransmission, our results provide no evidences in this direction.
Glomerular PN response patterns reflect the integrated input from OSNs, GABAergic multiglomerular LNs, and putative glomerulus-specific excitatory and/or inhibitory LNs. Because OSNs show almost no mixture suppression, mixture suppression in the PNs must reflect the integrated input from LN network. For example, global inhibitory input could suppress responses in all glomeruli (see Fig. 6) whereas glomerulus-specific excitatory input enhances responses only in a subgroup of glomeruli, thus creating a glomerulus specific interaction profile.
What is the neuronal substrate of mixture interactions? In flies, both GABAergic and cholinergic multiglomerular LNs have been described (Stocker, 1994; Ng et al., 2002; Shang et al., 2007). Multiglomerular GABAergic LNs could fulfill the task of the global inhibitory network. Alternatively, the inhibitory global network may consist of a family of neurons with glomerulus specific connectivity. Furthermore, it has been proposed that multiglomerular cholinergic LNs could be involved in broadening the response profile of PNs (Shang et al., 2007), and that broadening of PN response profiles occurs in a glomerulus dependent manner (Olsen et al., 2007). LNs which innervate only a few glomeruli could be involved in such glomerulus-specific interactions. Alternatively, it is conceivable that multiglomerular LNs with widespread arborization possess electrical subcompartments and/or that their receptors and synapses are asymmetrically distributed along the branches, thus acting as functionally asymmetrical neurons despite their homogeneous morphology. Morphologically asymmetrical LNs, with dense innervation in one glomerulus and weak innervation in others, have been described in honeybees (Fonta et al., 1993). These neurons could be involved in sharpening of PN response profiles (Sachse and Galizia, 2002; Galan et al., 2004; Linster et al., 2005).
Together, we found evidences for several functional interaction modes in the Drosophila AL. Some interactions occur within olfactory glomeruli (see recurrent connections in Fig. 5C). Others are global and sensitive to PTX and, thus, likely to be mediated by GABAA receptors. This network might mediate a global gain control or might be involved in action potential synchronization (Laurent, 1996; Christensen et al., 2003; Sachse and Galizia, 2006). Finally, glomerulus-specific interactions were found, which could be mediated by inhibitory (Wilson and Laurent, 2005), and excitatory connections (Shang et al., 2007). Their role could be to decorrelate across-glomeruli patterns to increase the coding capacity of the system (Wilson et al., 2004; Linster et al., 2005). Together, these networks create an astounding and as yet far from being understood computational complexity within the first olfactory neuropile of the fly.
Footnotes
This work was supported by the Volkswagen (VW) Stiftung (VW 1/75-399), the Deutscher Akademischer Austausch Dienst, and the Bundesministerium für Bildung und Forschung (01 GQ0771). We thank Leslie Vosshall for providing Gal4 lines, Beate Eisermann for excellent technical assistance, Alexander Galkin for supplying the stimulation software Olfastim, Mathias Ditzen for providing data analysis tools, Marien de Bruyne for helpful advice, and Paul Szyszka, Daniela Pelz, and two anonymous reviewers for valuable comments on this manuscript.
References
- Akers RP, Getz WM. Response of olfactory receptor neurons in honeybees to odorants and their binary mixtures. J Comp Physiol A Neuroethol Sens Neural Behav Physiol. 1993;173:169–185. [Google Scholar]
- Anton S, Hansson BS. Antennal lobe interneurons in the desert locust Schistocerca gregaria (Forskal): processing of aggregation pheromones in adult males and females. J Comp Neurol. 1996;370:85–96. doi: 10.1002/(SICI)1096-9861(19960617)370:1<85::AID-CNE8>3.0.CO;2-H. [DOI] [PubMed] [Google Scholar]
- Anton S, Hansson BS. Central processing of aggregation pheromones in solitary and gregarious desert locusts, Schistocerca gregaria. Ann NY Acad Sci. 1998;855:525–528. doi: 10.1111/j.1749-6632.1998.tb10620.x. [DOI] [PubMed] [Google Scholar]
- Carlsson MA, Chong KY, Daniels W, Hansson BS, Pearce TC. Component information is preserved in glomerular responses to binary odor mixtures in the moth Spodoptera littoralis. Chem Senses. 2007;32:433–443. doi: 10.1093/chemse/bjm009. [DOI] [PubMed] [Google Scholar]
- Christensen TA, Hildebrand JG. Male-specific, sex pheromone-selective projection neurons in the antennal lobes of the moth Manduca sexta. J Comp Physiol A Neuroethol Sens Neural Behav Physiol. 1987;160:553–569. doi: 10.1007/BF00611929. [DOI] [PubMed] [Google Scholar]
- Christensen TA, Lei H, Hildebrand JG. Coordination of central odor representations through transient, non-oscillatory synchronization of glomerular output neurons. Proc Natl Acad Sci USA. 2003;100:11076–11081. doi: 10.1073/pnas.1934001100. [DOI] [PMC free article] [PubMed] [Google Scholar]
- Cometto-Muniz JE, Cain WS, Abraham MH. Odor detection of single chemicals and binary mixtures. Behav Brain Res. 2005;156:115–123. doi: 10.1016/j.bbr.2004.05.014. [DOI] [PubMed] [Google Scholar]
- Couto A, Alenius M, Dickson BJ. Molecular, anatomical, and functional organization of the Drosophila olfactory system. Curr Biol. 2005;15:1535–1547. doi: 10.1016/j.cub.2005.07.034. [DOI] [PubMed] [Google Scholar]
- de Bruyne M, Foster K, Carlson JR. Odor coding in the Drosophila antenna. Neuron. 2001;30:537–552. doi: 10.1016/s0896-6273(01)00289-6. [DOI] [PubMed] [Google Scholar]
- Deisig N, Lachnit H, Sandoz JC, Lober K, Giurfa M. A modified version of the unique cue theory accounts for olfactory compound processing in honeybees. Learn Mem. 2003;10:199–208. doi: 10.1101/lm.55803. [DOI] [PMC free article] [PubMed] [Google Scholar]
- Deisig N, Giurfa M, Lachnit H, Sandoz JC. Neural representation of olfactory mixtures in the honeybee antennal lobe. Eur J Neurosci. 2006;24:1161–1174. doi: 10.1111/j.1460-9568.2006.04959.x. [DOI] [PubMed] [Google Scholar]
- Derby CD. Learning from spiny lobsters about chemosensory coding of mixtures. Physiol Behav. 2000;69:203–209. doi: 10.1016/s0031-9384(00)00202-x. [DOI] [PubMed] [Google Scholar]
- Derby CD, Hutson M, Livermore BA, Lynn WH. Generalization among related complex odorant mixtures and their components: analysis of olfactory perception in the spiny lobster. Physiol Behav. 1996;60:87–95. doi: 10.1016/0031-9384(95)02237-6. [DOI] [PubMed] [Google Scholar]
- Distler PG, Boeckh J. Synaptic connections between identified neuron types in the antennal lobe glomeruli of the cockroach, Periplaneta americana: II. Local multiglomerular interneurons. J Comp Neurol. 1997;383:529–540. doi: 10.1002/(sici)1096-9861(19970714)383:4<529::aid-cne9>3.0.co;2-4. [DOI] [PubMed] [Google Scholar]
- Duchamp-Viret P, Duchamp A, Chaput MA. Single olfactory sensory neurons simultaneously integrate the components of an odour mixture. Eur J Neurosci. 2003;18:2690–2696. doi: 10.1111/j.1460-9568.2003.03001.x. [DOI] [PubMed] [Google Scholar]
- Estes PS, Roos J, van der BA, Kelly RB, Krishnan KS, Ramaswami M. Traffic of dynamin within individual Drosophila synaptic boutons relative to compartment-specific markers. J Neurosci. 1996;16:5443–5456. doi: 10.1523/JNEUROSCI.16-17-05443.1996. [DOI] [PMC free article] [PubMed] [Google Scholar]
- Fishilevich E, Vosshall LB. Genetic and functional subdivision of the Drosophila antennal lobe. Curr Biol. 2005;15:1548–1553. doi: 10.1016/j.cub.2005.07.066. [DOI] [PubMed] [Google Scholar]
- Fonta C, Sun XJ, Masson C. Morphology and spatial distribution of bee antennal lobe interneurons responsive to odours. Chem Senses. 1993;18:101–119. [Google Scholar]
- Galan RF, Sachse S, Galizia CG, Herz AV. Odor-driven attractor dynamics in the antennal lobe allow for simple and rapid olfactory pattern classification. Neural Comput. 2004;16:999–1012. doi: 10.1162/089976604773135078. [DOI] [PubMed] [Google Scholar]
- Giraudet P, Berthommier F, Chaput M. Mitral cell temporal response patterns evoked by odor mixtures in the rat olfactory bulb. J Neurophysiol. 2002;88:829–838. doi: 10.1152/jn.2002.88.2.829. [DOI] [PubMed] [Google Scholar]
- Hallem EA, Ho MG, Carlson JR. The molecular basis of odor coding in the Drosophila antenna. Cell. 2004;117:965–979. doi: 10.1016/j.cell.2004.05.012. [DOI] [PubMed] [Google Scholar]
- Hansson BS, Anton S. Function and morphology of the antennal lobe: new developments. Annu Rev Entomol. 2000;45:203–231. doi: 10.1146/annurev.ento.45.1.203. [DOI] [PubMed] [Google Scholar]
- Heinbockel T, Christensen TA, Hildebrand JG. Representation of binary pheromone blends by glomerulus-specific olfactory projection neurons. J Comp Physiol A Neuroethol Sens Neural Behav Physiol. 2004;190:1023–1037. doi: 10.1007/s00359-004-0559-7. [DOI] [PubMed] [Google Scholar]
- Jefferis GS, Marin EC, Stocker RF, Luo L. Target neuron prespecification in the olfactory map of Drosophila. Nature. 2001;414:204–208. doi: 10.1038/35102574. [DOI] [PubMed] [Google Scholar]
- Kay LM, Lowry CA, Jacobs HA. Receptor contributions to configural and elemental odor mixture perception. Behav Neurosci. 2003;117:1108–1114. doi: 10.1037/0735-7044.117.5.1108. [DOI] [PubMed] [Google Scholar]
- Kay LM, Crk T, Thorngate J. A redefinition of odor mixture quality. Behav Neurosci. 2005;119:726–733. doi: 10.1037/0735-7044.119.3.726. [DOI] [PubMed] [Google Scholar]
- Laing DG. Coding of chemosensory stimulus mixtures. Ann NY Acad Sci. 1987;510:61–66. doi: 10.1111/j.1749-6632.1987.tb43468.x. [DOI] [PubMed] [Google Scholar]
- Laing DG, Francis GW. The capacity of humans to identify odors in mixtures. Physiol Behav. 1989;46:809–814. doi: 10.1016/0031-9384(89)90041-3. [DOI] [PubMed] [Google Scholar]
- Laissue PP, Reiter C, Hiesinger PR, Halter S, Fischbach KF, Stocker RF. Three-dimensional reconstruction of the antennal lobe in Drosophila melanogaster. J Comp Neurol. 1999;405:543–552. [PubMed] [Google Scholar]
- Larsson MC, Domingos AI, Jones WD, Chiappe ME, Amrein H, Vosshall LB. Or83b encodes a broadly expressed odorant receptor essential for Drosophila olfaction. Neuron. 2004;43:703–714. doi: 10.1016/j.neuron.2004.08.019. [DOI] [PubMed] [Google Scholar]
- Laurent G. Dynamical representation of odors by oscillating and evolving neural assemblies. Trends Neurosci. 1996;19:489–496. doi: 10.1016/S0166-2236(96)10054-0. [DOI] [PubMed] [Google Scholar]
- Lei H, Christensen TA, Hildebrand JG. Local inhibition modulates odor-evoked synchronization of glomerulus-specific output neurons. Nat Neurosci. 2002;5:557–565. doi: 10.1038/nn0602-859. [DOI] [PubMed] [Google Scholar]
- Lei H, Mooney R, Katz LC. Synaptic integration of olfactory information in mouse anterior olfactory nucleus. J Neurosci. 2006;26:12023–12032. doi: 10.1523/JNEUROSCI.2598-06.2006. [DOI] [PMC free article] [PubMed] [Google Scholar]
- Lin DY, Zhang SZ, Block E, Katz LC. Encoding social signals in the mouse main olfactory bulb. Nature. 2005;434:470–477. doi: 10.1038/nature03414. [DOI] [PubMed] [Google Scholar]
- Linster C, Sachse S, Galizia CG. Computational modeling suggests that response properties rather than spatial position determine connectivity between olfactory glomeruli. J Neurophysiol. 2005;93:3410–3417. doi: 10.1152/jn.01285.2004. [DOI] [PubMed] [Google Scholar]
- Marin EC, Jefferis GS, Komiyama T, Zhu H, Luo L. Representation of the glomerular olfactory map in the Drosophila brain. Cell. 2002;109:243–255. doi: 10.1016/s0092-8674(02)00700-6. [DOI] [PubMed] [Google Scholar]
- McGann JP, Pirez N, Gainey MA, Muratore C, Elias AS, Wachowiak M. Odorant representations are modulated by intra- but not interglomerular presynaptic inhibition of olfactory sensory neurons. Neuron. 2005;48:1039–1053. doi: 10.1016/j.neuron.2005.10.031. [DOI] [PubMed] [Google Scholar]
- McGill R, Tuckey JW, Larson WA. Variations of box plots. Am Stat. 1978;32:12–16. [Google Scholar]
- Nakai J, Ohkura M, Imoto K. A high signal-to-noise Ca2+ probe composed of a single green fluorescent protein. Nat Biotechnol. 2001;19:137–141. doi: 10.1038/84397. [DOI] [PubMed] [Google Scholar]
- Ng M, Roorda RD, Lima SQ, Zemelman BV, Morcillo P, Miesenbock G. Transmission of olfactory information between three populations of neurons in the antennal lobe of the fly. Neuron. 2002;36:463–474. doi: 10.1016/s0896-6273(02)00975-3. [DOI] [PubMed] [Google Scholar]
- Oka Y, Omura M, Kataoka H, Touhara K. Olfactory receptor antagonism between odorants. EMBO J. 2004;23:120–126. doi: 10.1038/sj.emboj.7600032. [DOI] [PMC free article] [PubMed] [Google Scholar]
- Olsen SR, Bhandawat V, Wilson RI. Excitatory interactions between olfactory processing channels in the Drosophila antennal lobe. Neuron. 2007;54:89–103. doi: 10.1016/j.neuron.2007.03.010. [DOI] [PMC free article] [PubMed] [Google Scholar]
- Pelz D, Roeske T, Syed Z, de Bruyne M, Galizia CG. The molecular receptive range of an olfactory receptor in vivo (Drosophila melanogaster Or22a) J Neurobiol. 2006;66:1544–1563. doi: 10.1002/neu.20333. [DOI] [PubMed] [Google Scholar]
- Sachse S, Galizia CG. Role of inhibition for temporal and spatial odor representation in olfactory output neurons: a calcium imaging study. J Neurophysiol. 2002;87:1106–1117. doi: 10.1152/jn.00325.2001. [DOI] [PubMed] [Google Scholar]
- Sachse S, Galizia CG. Topography and dynamics of the olfactory system. In: Grillner S, Graybiel AM, editors. Microcircuits: the interface between neurons and global brain function. Cambridge, MA: MIT; 2006. pp. 251–274. [Google Scholar]
- Shang Y, Claridge-Chang A, Sjulson L, Pypaert M, Miesenbock G. Excitatory local circuits and their implications for olfactory processing in the fly antennal lobe. Cell. 2007;128:601–612. doi: 10.1016/j.cell.2006.12.034. [DOI] [PMC free article] [PubMed] [Google Scholar]
- Smith BH. Analysis of interaction in binary odorant mixtures. Physiol Behav. 1998;65:397–407. doi: 10.1016/s0031-9384(98)00142-5. [DOI] [PubMed] [Google Scholar]
- Stocker RF. The organization of the chemosensory system in Drosophila melanogaster: a review. Cell Tissue Res. 1994;275:3–26. doi: 10.1007/BF00305372. [DOI] [PubMed] [Google Scholar]
- Stocker RF, Lienhard MC, Borst A, Fischbach KF. Neuronal architecture of the antennal lobe in Drosophila melanogaster. Cell Tissue Res. 1990;262:9–34. doi: 10.1007/BF00327741. [DOI] [PubMed] [Google Scholar]
- Stocker RF, Heimbeck G, Gendre N, de Belle JS. Neuroblast ablation in Drosophila P[GAL4] lines reveals origins of olfactory interneurons. J Neurobiol. 1997;32:443–456. doi: 10.1002/(sici)1097-4695(199705)32:5<443::aid-neu1>3.0.co;2-5. [DOI] [PubMed] [Google Scholar]
- Tabor R, Yaksi E, Weislogel JM, Friedrich RW. Processing of odor mixtures in the zebrafish olfactory bulb. J Neurosci. 2004;24:6611–6620. doi: 10.1523/JNEUROSCI.1834-04.2004. [DOI] [PMC free article] [PubMed] [Google Scholar]
- Wachowiak M, Cohen LB, Ache BW. Presynaptic inhibition of olfactory receptor neurons in crustaceans. Microsc Res Tech. 2002;58:365–375. doi: 10.1002/jemt.10144. [DOI] [PubMed] [Google Scholar]
- Wachowiak M, McGann JP, Heyward PM, Shao Z, Puche AC, Shipley MT. Inhibition of olfactory receptor neuron input to olfactory bulb glomeruli mediated by suppression of presynaptic calcium influx. J Neurophysiol. 2005;94:2700–2712. doi: 10.1152/jn.00286.2005. [DOI] [PMC free article] [PubMed] [Google Scholar]
- Wilson RI, Laurent G. Role of GABAergic inhibition in shaping odor-evoked spatiotemporal patterns in the Drosophila antennal lobe. J Neurosci. 2005;25:9069–9079. doi: 10.1523/JNEUROSCI.2070-05.2005. [DOI] [PMC free article] [PubMed] [Google Scholar]
- Wilson RI, Turner GC, Laurent G. Transformation of olfactory representations in the Drosophila antennal lobe. Science. 2004;303:366–370. doi: 10.1126/science.1090782. [DOI] [PubMed] [Google Scholar]
- Wiltrout C, Dogra S, Linster C. Configurational and nonconfigurational interactions between odorants in binary mixtures. Behav Neurosci. 2003;117:236–245. doi: 10.1037/0735-7044.117.2.236. [DOI] [PubMed] [Google Scholar]
- Wong AM, Wang JW, Axel R. Spatial representation of the glomerular map in the Drosophila protocerebrum. Cell. 2002;109:229–241. doi: 10.1016/s0092-8674(02)00707-9. [DOI] [PubMed] [Google Scholar]
- Zou Z, Buck LB. Combinatorial effects of odorant mixes in olfactory cortex. Science. 2006;311:1477–1481. doi: 10.1126/science.1124755. [DOI] [PubMed] [Google Scholar]