

Abstract
Different phases of motor skill learning appear to involve different physiological processes, with long-term potentiation (LTP) occurring at existing synapses in early and cortical reorganization involving synaptogenesis in later phases. Here, we test the evolution of skill learning-dependent changes in motor plasticity and excitability in six subjects trained to perform rapid thumb abductions over 5 d. Plasticity was examined using paired-associative stimulation (PAS) of the median nerve and motor cortex to induce LTP-like “PAS given with an interstimulus interval of 25 ms (PAS25)” or long-term depression (LTD)-like “PAS given with an interstimulus interval of 10 ms (PAS10)” plasticity. Excitability was tested by measuring recruitment of motor-evoked-potentials “input–output (IO) curve” and of short-latency intracortical inhibition (SICI curve), and sensorimotor organization (SMO). Task performance improved continuously over 5 d. After practice on day 1, the PAS25 effect reversed from facilitation to inhibition whereas the slope of the IO curve increased and the level of SICI decreased. These effects on IO curve and SICI were still present or even enhanced before the last practice on day 5, and were not changed by it. The effect of proprioceptive input from the trained muscle on SMO was also strengthened before practice on day 5. In contrast, PAS-induced plasticity was not influenced by motor practice on day 5, and had returned to prepractice values. The interference with PAS-induced plasticity suggests that the initial performance improvement relies on increasing the efficacy of existing synaptic connections. However, the long-lasting changes in the IO curve, SICI curve, and SMO suggest that continued practice enhances performance by changing Motor cortical organization. We hypothesize that new synaptic connections might have formed that allow LTP/LTD-susceptibility to be restored without reducing synaptic strength and performance skill.
Keywords: motor cortex, excitability, plasticity, transcranial magnetic stimulation, long-term motor learning
Introduction
Skilled motor performance is acquired in several stages: an initial and fast within-session improvement that is consolidated over the next few hours without requiring practice, followed by a slower phase of incremental gains in performance that emerge after continued practice (Karni et al., 1998; Muellbacher et al., 2002). It is thought that different mechanisms support these short- and long-term learning processes (Karni et al., 1998; Kleim et al., 2004). In animals, a period of motor skill training occludes experimentally induced long-term potentiation (LTP) and enhances long-term depression (LTD), strongly suggesting that skill learning involves LTP (Rioult-Pedotti et al., 1998). During late phases of motor skill learning, cortical synaptogenesis and motor-map reorganization occur (Kleim et al., 2004) whereas preliminary results suggest that the susceptibility for LTP and LTD is restored (Rioult-Pedotti and Donoghue, 2000, 2003).
Noninvasive techniques in humans also suggest that LTP-like plasticity is involved in early motor learning. Paired-associative stimulation (PAS) consisting of transcranial magnetic stimulation (TMS) of the motor cortex combined with electrical stimulation of the median nerve can be used to measure LTP- “PAS given with an interstimulus interval of 25 ms (PAS25)” and LTD-like “PAS given with an interstimulus interval of 10 ms (PAS10)” effects (Stefan et al., 2000; Wolters et al., 2003). As in animals, a period of motor learning reversed or occluded LTP-like effects, whereas it either enhanced LTD-like effects or left them unchanged (Ziemann et al., 2004; Stefan et al., 2006). However, only a few studies have addressed the effect of longer-term motor practice. These described an expansion in cortical output maps to muscles involved in the trained task (Pascual-Leone et al., 1995; Svensson et al., 2003), but did not examine LTP/LTD-like effects. Interestingly, professional musicians who undergo years of motor practice have increased recruitment of corticospinal and intracortical connections as well as enhanced synaptic plasticity, possibly resulting from an increase in the number of synapses through synaptogenesis (Rosenkranz et al., 2007).
The present study was designed to explore, in six healthy individuals, the evolution and potential interrelation of changes in motor cortical plasticity and excitability from those seen after a single session into those seen after multiple sessions of motor practice. Subjects practiced a ballistic thumb abduction task for 5 consecutive days, while motor cortical excitability and plasticity were tested before, on the first day, and on the last day of practice. As in previous studies (Rosenkranz et al., 2007), TMS paradigms were used to measure the excitability of corticospinal projections to the small hand muscles “input–output curves (IO curves)” (Ridding and Rothwell, 1997) as well as short-interval intracortical inhibition (SICI curves) (Kujirai et al., 1993; Ziemann et al., 1996c; Orth et al., 2003; Ilic et al., 2002) and sensorimotor organization assessed by measuring the response to proprioceptive stimulation of the same hand muscles (Rosenkranz and Rothwell, 2003). Motor plasticity was evaluated using PAS in two sets of experiments, testing LTP (PAS25)- and LTD (PAS10)-like effects separately. Our hypothesis was that long-term consolidated learning would restore the ability of synapses to undergo LTP- and LTD-like changes, but would be accompanied by lasting changes in the excitability and/or organization of the motor cortex.
Materials and Methods
Subjects
Six healthy right-handed subjects (two female), aged 26–38 years, gave informed consent for the study, which was approved by the joint ethics committee of the Institute of Neurology and National Hospital for Neurology and Neurosurgery, London, UK. All experiments conform to the Declaration of Helsinki.
Motor practice
The task was adopted from Muellbacher et al. (2002). Subjects were required to make rapid thumb abduction movements of the right hand paced by a brief 1000 Hz tone at a rate of 0.5 Hz. They continued for 4 min, had a 4 min break to prevent fatigue, and then continued the task for an additional 4 min. Thumb acceleration was measured using a uniaxial accelerometer (Vibro-meter SA, Fribourg, Switzerland) mounted on the distal phalanx in the abduction–adduction axis. The raw signal was amplified and digitized (rate, 2 kHz; CED Micro 1401; Cambridge Electronic Design, Cambridge, UK) and fed into the laboratory computer for off-line analysis. Subjects received online visual feedback of acceleration during the task and were continuously encouraged by the experimenter to increase the peak amplitude to produce faster and faster abduction movements. All subjects became faster during the sessions, and we quantified the learning effect by measuring the increase in the value of the mean peak acceleration for each set of 30 movements (i.e., per minute).
TMS
TMS was performed using two Magstim 200 stimulators connected to a figure-eight-shaped coil with an internal wing diameter of 7 cm by a Y-cable (Magstim, Dyfed, UK). The coil was held with the handle pointing backwards and laterally ∼45° to the interhemispheric line to evoke anteriorly directed current in the brain and was optimally positioned to obtain motor-evoked potentials (MEPs) in the abductor pollicis brevis (APB) muscle. Stimulation intensities are quoted in Table 1 as a percentage of maximal stimulator output (±SE).
Table 1.
The mean stimulus intensities (±SE) are given for the aMT, SI1mV, and SMO condition SIs in percentage of stimulator output, and for the sensory threshold
| PAS25 |
PAS10 |
|||||||
|---|---|---|---|---|---|---|---|---|
| aMT (%) | SI-1mV (%) | SMO SI (%) | Sensory threshold (mV) | aMT (%) | SI-1mV (%) | SMO SI (%) | Sensory threshold (mV) | |
| day 0 | 31.3 ± 2.5 | 47.2 ± 3.9 | 28.7 ± 4.2 | 32.0 ± 6.3 | 30.8 ± 2.4 | 47.7 ± 4.4 | 29.0 ± 4.2 | 32.5 ± 8.2 |
| day 1 | 31.5 ± 3.0 | 48.3 ± 4.4 | 32.0 ± 4.1 | 34.3 ± 4.0 | 30.5 ± 2.5 | 48.0 ± 4.5 | 29.7 ± 4.3 | 31.3 ± 6.0 |
| day 5 | 31.5 ± 3.0 | 45.2 ± 4.4 | 32.0 ± 4.1 | 34.3 ± 4.0 | 29.3 ± 2.6 | 45.0 ± 4.3 | 28.8 ± 3.5 | 29.7 ± 5.2 |
EMG recording
Surface electromyographic (EMG) recordings in a belly-to-tendon montage were made from the APB, the first dorsal interosseus (FDI), and the abductor digiti minimi (ADM) muscle of the right hand. The raw signal was amplified and filtered with a bandpass filter of 30 Hz to 1 kHz (Digitimer, Welwyn Garden City, UK). Signals were digitized at 2 kHz (CED Power1401; Cambridge Electronic Design) and stored on a laboratory computer for off-line analysis.
Experimental parameters
Corticospinal excitability.
At the beginning of each experiment, the stimulus intensity (SI) needed to evoke an MEP of approximately 1 mV peak-to-peak amplitude (SI1mV) was defined. SI1mV was used to record 15 MEPs at baseline, and after motor practice and/or PAS (see below, Experimental protocol). The mean amplitude of these responses was calculated in each subject.
In addition, we measured the input–output relationship of MEP amplitude to stimulus intensity (IO curve). The intensities of single TMS stimuli were expressed as a percentage of SI1mV. Ten MEPs each were recorded with 50%, 70%, 80%, 90%, 100% (equal to SI1mV), 110%, 120%, 130%, and 150% of SI1mV. For each subject, the peak-to-peak amplitudes on each single trial were used to calculate the mean amplitudes for each stimulus intensity.
SICI.
The input–output relation for short-interval intracortical inhibition (SICI curve) (Ziemann et al., 1996c; Orth et al., 2003; Rosenkranz et al., 2007) was measured before and after motor practice (see below, Experimental protocol) using subthreshold conditioning stimulus intensities of 70%, 80%, and 90% of active motor threshold (aMT). The aMT was defined as the minimum intensity needed to evoke an MEP of >200 μV in five of 10 trials in the tonically active APB (∼20% of maximal contraction as assessed visually on an oscilloscope) and was tested before each SICI measurement. The conditioning stimulus preceded the suprathreshold test stimulus (intensity, SI1mV) by 3 ms (Kujirai et al., 1993). Ten trials each were recorded for each intensity of conditioning stimulus. Before, in between, and after the blocks, five single test pulses were given to ensure that the unconditioned MEP size was stable. In case the MEP was out of the 0.7–1.3 mV range, the test stimulus intensity was readjusted and the experiment restarted. The peak-to-peak amplitude of the conditioned and test MEPs was measured for each single trial to calculate the mean amplitude and percentage SICI for the three different conditioning stimulus intensities.
This approach allowed us to measure the level of SICI at a single conditioning intensity as well as the recruitment of SICI (SICI curve) defined as the increase in SICI with increasing intensities of conditioning stimulus.
SMO.
SMO was measured using our previously described protocol (Rosenkranz and Rothwell, 2003). Three electromechanical vibrators (Ling Dynamics System, Hertfordshire, UK), each with a 0.7-cm-diameter probe, were used to apply vibration to the muscle belly of either the APB, FDI, or ADM muscle in randomized order (frequency of 80 Hz; amplitude, 0.2–0.5 mm) in trains of 1.5 s duration. EMG in the vibrated muscle was continuously monitored for any signs of muscle contraction that might reflect either voluntary movement or occurrence of the tonic vibration reflex (Hagbarth and Eklund, 1968), and those trials were excluded.
SICI, using an interstimulus interval (ISI) of 3 ms, was measured with and without short-term vibration of either the APB, FDI, or ADM muscle. Peak-to-peak amplitudes of MEPs after single or paired TMS pulses were measured in all three hand muscles simultaneously.
The test stimulus intensity was adjusted to give an MEP of ∼1 mV peak-to-peak (SI1mV) in the relaxed APB muscle and the intensity of the conditioning stimulus was set so as to produce ∼50% inhibition in the no-vibration condition. Single (test pulse alone) or pairs of pulses were applied randomly every 5 s.
Vibration was applied for 1.5 s, starting 1 s before the TMS test pulses were applied. A total of 80 trials were collected with 10 trials of each condition. The peak-to-peak amplitude of the MEPs evoked in each of the three hand muscles was measured on each single trial so that the mean amplitude and percentage SICI for the four vibration conditions could be calculated.
PAS.
PAS consisted of 200 electrical stimuli of the right median nerve at the wrist paired with a single TMS pulse over the hot spot of the APB muscle area of the left hemisphere at a rate of 0.25 Hz. Electrical stimulation was applied through a bipolar electrode (cathode proximal) using square-wave pulses (duration, 0.2 ms) at an intensity of three times the perceptual threshold. TMS was delivered through a figure-eight coil (diameter of each wing, 70 mm) connected to a Magstim 200 magnetic stimulator and held in the same position as described above. Stimulation was applied at an intensity adjusted to evoke an MEP of ∼1 mV (SI1mV) in the relaxed APB.
Subjects took part in two different long-term practice studies. In randomized order, the effects of PAS given with an interstimulus interval of 25 ms (PAS25) and of 10 ms (PAS10) between peripheral and TMS stimuli were tested. The former has been shown previously to induce a long-lasting MEP increase (Stefan et al., 2000, 2002) and the latter an MEP decrease (Wolters et al., 2003). Subjects were instructed to look at their stimulated hand and count the peripheral electrical stimuli they perceived. The MEPs evoked in the APB were displayed online during the intervention to control for the correct coil position and stored for off-line analysis.
Experimental protocol
The motor practice studies took place over 5 consecutive days (Monday to Friday). Figure 1 shows which experimental parameters were measured and which interventions were performed before (day 0) and during the motor practice week (day 1 to day 5). To test the effect of the PAS25 and PAS10 protocols in the same subjects, all subjects took part in two different long-term practice experiments, which were, in each subject, separated by at least 6 months.
Figure 1.

Experimental protocol performed on days 0, 1, and 5. Subjects participated in two sets of experiments using this experimental protocol, testing the effect of PAS25 and PAS10 separately. All experiments and sessions of motor practice were performed in the morning.
On day 0, which was, for all subjects, at least 5 d before the motor practice week (days 1–5), the baseline SMO as well as the effect of PAS on MEPs and IO curves was measured. On day 1 (Monday), the MEPs and IO curve, as well as the SICI curve were measured before and after the first session of motor practice. This was immediately followed by the PAS protocol and subsequent measurement of the MEPs and IO curve.
On day 2, 3, and 4 (Tuesday through Thursday), subjects only performed the motor practice at a set time in the morning (usually at 10 A.M.). On day 5, the SMO was tested first followed by the same protocol as on day 1. The SMO was tested in either the PAS25 or PAS10 week.
Data analysis and statistics
The aMT, intensities of conditioning (conditioning SI), and test stimuli (SI1mV) expressed as percentages of stimulator output, and the sensory thresholds (in millivolts) are given in Table 1. The comparability of these stimulus parameters between the PAS25 and PAS10 studies and between days 0, 1, and 5, as well as the motor performance in the first minute of day 1 between the PAS25 and PAS10 studies, were tested by paired t test.
For statistical analysis, repeated-measures ANOVA with the within-subject factors day, which included data from day 0 and/or day 1 and/or day 5 (for details, see Results), before or after PAS, PAS type, and before or after motor practice were performed as three-way and two-way ANOVAs with follow-up analyses where appropriate.
To simplify the data set obtained by measuring the IO curves, the slopes defined as the steepness of the linear regression line through the given data points between 90% and 130% SI1mV were calculated.
After testing for comparability, the MEP, IO curve, SICI, and SMO data obtained in the PAS25 and PAS10 studies at baseline and after motor practice were pooled and the effect of motor practice alone was calculated on these pooled data sets.
For the statistical analysis of the PAS effect on MEPs and IO curves on days 0, 1, and 5, the data were normalized in two different ways, one using data recorded after motor practice (i.e., immediately before PAS) as baseline and a second using data before practice as baseline (for details, see Results). In view of this, two versions of the statistics were calculated and only those results are reported that turned out to be significant in both versions.
We set the significance levels for the ANOVAs to p < 0.01 to correct for multiple comparisons, and for the t tests to p < 0.05. All data are given as means ± SE.
Results
None of the subjects experienced any side effects of TMS testing during these experiments. During muscle vibration, there was no evidence of a tonic vibration reflex in the EMG of any of the subjects. In addition, none of them reported any perception of illusory movements during vibration.
Table 1 displays the stimulus parameters used on days 0, 1, and 5. A two-way ANOVA with the factors day and PAS type revealed no significant main effects or interactions for any of the parameters. The number of peripheral nerve stimuli counted during the PAS protocols was, on average, 201 ± 2 and did not differ either between PAS25 and PAS10 or between day 1 and day 5.
Motor performance
Figure 2 shows the mean peak acceleration per minute of practice; the data are normalized to the individuals' mean thumb acceleration over the first minute of the first practice session, which was not different between the subjects (one-way ANOVA, subject, F(5,42) = 7.07; p = 0.09). Furthermore, there was also no difference within subjects in the way acceleration increased over the course of practice in the PAS25 and PAS10 practice weeks; therefore, the behavioral data were pooled for each subject.
Figure 2.

Behavioral data showing the peak acceleration averaged for each minute of practice on each day. The practice was performed in two 4 min blocks, with a 4 min break in between to prevent fatigue. The data are normalized to the performance during the first minute of practice on day 1, which was not significantly different between the subjects (one-way ANOVA for subject, F(5,42) = 7.07; p = 0.09). The data obtained in the PAS25 and PAS10 studies have been pooled in this graph because there was no significant difference in performance on the two occasions.
A two-way ANOVA performed with the main factors day and minute showed a significant main effect of both factors (day, F(4,20) = 14.1, p = 0.00001; minute, F(7,35) = 6.88, p = 0.00004), but no significant interaction (F(28,140) = 0.53; p = 0.97). Thus, although the within-day increase in mean peak acceleration per minute practice may appear to be smaller on day 5 than day 1, the lack of an interaction effect means that we cannot conclude that they differ in the present set of data.
Effect of motor practice on MEPs and IO curves in APB
Figure 3 displays the MEPs (millivolts ± SE) recorded in the APB before and after motor practice on days 1 and 5.
Figure 3.

Mean (±SE) amplitude of the MEPs of APB on days 1 and 5, before and after the first or last motor practice. On day 1, motor practice increased the MEP size significantly (t test, p = 0.0004), although it had no influence on day 5. (ANOVA, day 1/day 5 by motor practice, F(1,5) = 187.43; p < 0.0001).
There was no difference in any subject between the MEP amplitudes collected in the PAS25 and PAS10 weeks, so these values were pooled to simplify the data set.
Practice increased MEPs on day 1 (paired t test, p = 0.0004), but had no effect on day 5. A two-way ANOVA with the factors day 1/day 5 and motor practice showed a significant main effect of motor practice (F(1,5) = 123.54; p = 0.0001) and a significant interaction (F(1,5) = 187.43; p < 0.0001).
Figure 4 shows the IO curves obtained in the APB before and after motor practice on days 1 and 5. There was no difference within subjects in the IO curves measured in the PAS25 and PAS10 weeks “two-way ANOVAs, significant main effect of stimulus intensity (F(8,40) > 80.8; p < 0.0001), but not of PAS type nor any significant interaction between the factors”. This allowed us to pool the two data sets to provide a single IO curve before and after motor practice on days 1 and 5 as illustrated in Figure 4A–C.
Figure 4.

IO curves measured in the APB muscle on days 1 and 5, before and after motor practice. A–C display the mean MEP amplitude (±SE) on the y-axis against the stimulus intensity on the x-axis (in percentage of SI1mV). A shows the IO curves measured on day 1 before and after the first motor practice. B shows the data for day 5 before and after the last motor practice. C compares the baseline IO curve on days 1 and 5 before motor practice. Asterisks indicate statistically significant differences between the displayed curves (paired t test, *p ≤ 0.05; **p ≤ 0.01). D displays the slopes of the IO curves on day 1 and day 5 before (white column) and after (gray column) motor practice. The slope of the curve has been calculated for the approximately linear part between 90 and 130% SI1mV. The IO curve on day 1 was significantly steeper after motor practice. In contrast, practice had no effect on the IO curve on day 5. However, the baseline IO curve on day 5 was steeper than on day 1. Statistical results (t test, p values) of the direct comparison of the slopes before and after motor practice on days 1 and 5 are given in D.
Given that the IO curves were approximately linear between 90% aMT and 130% aMT (Fig. 4A–C, gray box), we calculated the slope of the IO curves to summarize the data provided in a single value (Fig. 4D).
On day 1 (Fig. 4A,D), motor practice increased the steepness of the IO curve, whereas on day 5 (Fig. 4B,D) it did not change. The IO curve before the last motor practice on day 5 was steeper than the IO curve before the first motor practice on day 1 (Fig. 4C).
We compared the effect of practice on days 1 and 5 by performing a two-way ANOVA on the slope data of Figure 4D. This showed significant main effects of day 1/day 5 (F(1,5) = 28.23; p = 0.003) and motor practice (F(1,5) = 8.33; p = 0.009) and a significant interaction (F(1,5) = 38.3; p = 0.002). Thus, the effect of motor practice was significantly different on day 1 and day 5.
Follow-up analyses were conducted on the IO curves of day 1 and day 5 separately (Fig. 4A–C). A two-way ANOVA with the factors motor practice and stimulus intensity on IO curves on day 1 showed significant main effects (motor practice, F(1,5) = 31.09, p = 0.003; stimulus intensity, F(8,40) = 68.26, p < 0.0001) as well as a significant interaction (F(8,40) = 10.27; p < 0.0001). However, the same two-way ANOVA on IO curves on day 5 only showed a significant main effect of stimulus intensity (F(8,40) = 126.58; p < 0.0001), but no significant main effect for motor practice or interaction of these factors.
Finally, comparing baseline data before motor practice on day 1 with day 5 (Fig. 4C) revealed significant main effects of day 1/day 5 (F(1,5) = 2.262; p = 0.003) and stimulus intensity (F(8,40) = 138.72; p < 0.0001) and a significant interaction (F(8,40) = 14.93; p < 0.0001).
Effect of motor practice on SICI curves
Figure 5 displays the SICI data obtained with conditioning SIs of 70, 80, and 90% aMT. The SICI curves in each subject were the same in the PAS25 and PAS10 practice weeks, so that the values have been pooled into a single simplified dataset. An upward shift indicates a reduction of SICI, a downward shift an increase of SICI. Increasing the conditioning SI increased the amount of inhibition in all curves.
Figure 5.

SICI obtained with a stimulus intensities of 70, 80, and 90% of aMT. The amount of inhibition is displayed as the size of the conditioned MEP as a percentage of MEP evoked by the test pulse alone (±SE). A displays the SICI before and after the first motor practice on day 1. B shows the same data for day 5. C displays a comparison of the SICI on day 1 and day 5 before motor practice. Higher values indicate reduced SICIs; lower values indicate increased SICIs. On day 1, practice reduced SICI, although this was not the case on day 5. However, there was less SICI before motor practice on day 5 than on day 1 (ANOVA, day 1/day 5 by conditioning SI, F(2,10) = 12.61; p = 0.002). Asterisks indicate statistically significant differences when comparing the displayed data directly (paired t tests, *p ≤ 0.05; **p ≤ 0.001).
Motor practice on day 1 (Fig. 5A) decreased SICI measured at all conditioning SI. However, on day 5 (Fig. 5B), practice had no effect. The baseline SICI on day 5 before the last motor practice was reduced at all conditioning SI compared with the baseline SICI at day 1; furthermore, the SICI curve was steeper on day 5 (Fig. 5C).
A three-way ANOVA with the factors day 1/day 5, motor practice, and conditioning SI showed significant main effects of all three factors (day 1/day 5, F(1,5) = 18.66, p = 0.007; motor practice, F(1,5) = 71.05, p = 0.0004; conditioning SI, F(2,10) = 302.04, p < 0.0001) together with a significant interaction between them (F(2,10) = 5.0; p = 0.009). The latter indicates that SICI is influenced differently by practice on day 1 and day 5.
A two-way ANOVAs for the SICI on day 1 alone showed significant main effects of the factors motor practice (F(1,5) = 44.15; p = 0.001) and conditioning SI (F(2,10) = 122.52; p < 0.0001), but no significant interaction between them. This was attributable to the fact that motor practice reduced SICI similarly at all conditioning SI. In contrast, on day 5 (Fig. 5B), the same two-way ANOVA showed only a significant main effect of the factor conditioning SI (F(2,10) = 153.6; p < 0.0001), but not of motor practice and no significant interaction, indicating that there was no within-session effect of motor practice.
Finally, a two-way ANOVA comparing the SICI before motor practice on day 1 and day 5 with the factors day 1/day 5 and conditioning SI showed significant main effects (day 1/day 5, F(1,5) = 27.60, p = 0.003; conditioning SI, F(2,10) = 266.78, p < 0.0001) as well as a significant interaction (F(2,10) = 12.61; p = 0.002), indicating that the baseline SICI curves are significantly influenced by long-term motor practice.
Effect of motor practice on SMO
Figure 6 displays the SMO recorded in the APB, the FDI, and ADM muscles. As described previously (Rosenkranz and Rothwell, 2003), vibration of the homotopic muscle decreased SICI in that muscle (column goes up), whereas in the nonvibrated muscles SICI is increased (column goes down). The pattern appears to be similar on day 0 and day 5 in APB, but not in FDI and ADM; in these muscles, the amount of SICI recorded during vibration of APB is less on day 5 compared with day 0 (column is higher on day 5). This was confirmed by two-way ANOVAs on the data from each muscle separately with the factors day 0/day 5 and vibration condition. These showed a significant interaction between the factors in FDI and ADM (F(2,10) > 3.92; p < 0.01), but not in APB. Subsequent paired t tests indicated that this was caused by a change in the effect of vibration of APB on the 2 d (see statistical results in Fig. 6).
Figure 6.
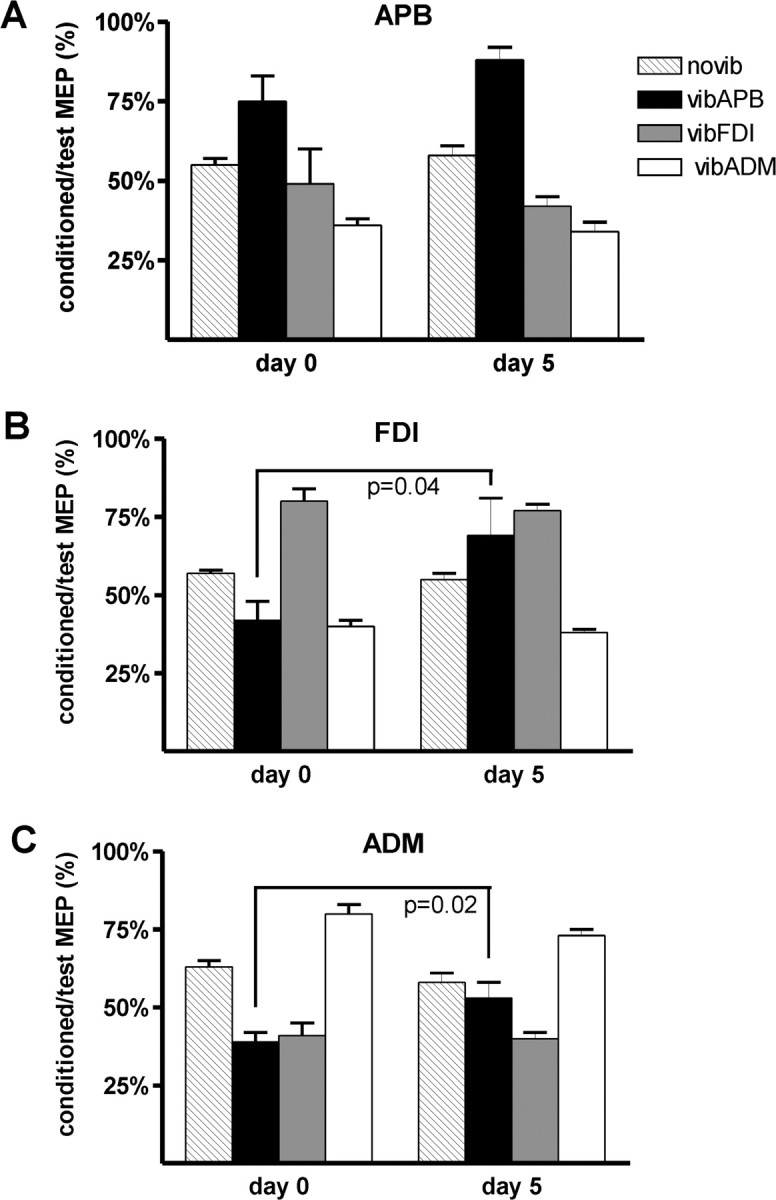
Effect of motor practice on SMO. SICI (±SE) is expressed as percentage inhibition relative to unconditioned control values. A–C show data obtained in APB, FDI, and ADM, respectively. Each graph shows two sets of data, for days 0 and 5. On each day, the four columns display the amount of SICI measured without muscle vibration (novib), during vibration of APB (vibAPB), during vibration of FDI (vibFDI), and during vibration of ADM (vibADM). A decrease in SICI is shown as increased column size and an increase in SICI as reduced column size. On day 1, short-term vibration decreases SICI in the vibrated muscle and increases SICI in the nonvibrated muscles. On day 5, vibAPB causes a stronger decrease of SICI, especially in the APB and FDI. Statistical results (t test; p values) of direct comparisons of days 0 and 5 are given in the figure.
Influence of motor practice on PAS-induced effects
MEPs
Figure 7 displays the effect of motor practice on the response to the PAS25 and PAS10 protocols. The data are normalized to the MEPs recorded immediately before PAS, which on day 0 refers to the baseline MEPs, and on days 1 and 5 to the MEPs after motor practice.
Figure 7.

Mean MEP (±SE) on days 0, 1, and 5 in the APB. A shows the MEPs on day 0 expressed as percentage of baseline MEPs. B and C show the MEPs on days 1 and 5, respectively, expressed as percentages of MEPs after motor practice. On day 0, PAS25 enhanced and PAS10 decreased the MEPs. On day 1, motor practice increased the MEP relative to baseline, but the subsequent PAS effect was changed: both PAS10 and PAS25 decreased the MEP. On day 5, motor practice did not change MEP size relative to baseline whereas the PAS effects were similar to those on day 0. The interaction of day 0/day 1/day 5 by PAS type by before/after PAS was significant (three-way ANOVA, p < 0.004).
On day 0 (Fig. 7A), the PAS protocols produced the expected effects of MEP facilitation after PAS25 and suppression after PAS10 (Stefan et al., 2000; Wolters et al., 2003). A two-way ANOVA on the data confirmed this with a significant before/after PAS by PAS type interaction (F(1,5) = 44.51; p = 0.001), but with no significant main effects. Subsequent paired t tests indicated that the changes in MEP after PAS25 and PAS10 were significant (paired t tests, p < 0.0006).
On day 1 (Fig. 7B) of the PAS25 and PAS10 weeks, motor practice increased the MEPs in APB significantly (t tests, p < 0.001).
Because the PAS effect is described relative to the measures taken before, the choice of baseline MEP, either before or after motor practice, would influence the statistical results. To control for this we took a conservative approach: ANOVAs that included the factor before/after PAS were calculated in two versions. One used the MEPs recorded after practice (i.e., immediately before PAS) as baseline and the second used MEPs before practice as baseline. Only those results are reported that turned out to be significant in both versions of the statistics.
After motor practice on day 1, the effect of PAS25 was opposite to that observed on day 0; instead of increasing MEPs, PAS25 reduced MEP amplitudes. In contrast, the effect of PAS10 in reducing MEPs tended to be stronger than on day 0. The result was that both forms of PAS reduced MEP amplitudes (two-way ANOVA showed no significant before/after PAS by PAS type interaction, but a significant main effect of before/after PAS; F(1,5) > 41.28; p < 0.001).
On day 5 (Fig. 7C), motor practice had no significant influence on the MEP amplitude (t test; p > 0.8) and the effect of the PAS25 and PAS10 protocols were comparable with those observed on day 0. A two-way ANOVA now showed a significant before/after PAS by PAS type interaction (F(1,5)>77.16; p < 0.0001) as well as significant main effects (before/after PAS, F(1,5)>45.77, p < 0.001; PAS type F(1,5) > 17.46, p < 0.001).
We made formal comparisons of the effects of PAS on days 0, 1, and 5 using a three-way ANOVA with the factors days 0, 1, and 5, PAS type, and before/after PAS. This showed a significant three-way interaction (F(2,10) > 9.79; p < 0.004), and also significant main effects of the factors day 0, day 1, and day 5 (F(2,10) > 8.12; p < 0.008) and PAS type (F(1,5) > 32.07; p < 0.002), but not of before/after PAS. This indicates that the effects of PAS changed over the practice period.
To find out whether the change in PAS effect observed on days 1 and 5 contribute differently to this interaction, additional three-way ANOVAs were performed for the day 0 versus day 1, and day 0 versus day 5, respectively. There was a significant three-way interaction for the factors day 0/day 1 and before/after PAS and PAS type (F(1,5) > 7.76; p < 0.01); however, the interaction of day 0/day 5 and before/after PAS and PAS type was not significant. This shows that the PAS effects on day 1 were different, whereas the PAS effects on day 5 were similar to those on day 0.
IO curves
Figure 8 displays the IO curves measured on day 0 before and after PAS25 or PAS10, and on day 1 and day 5 before and after motor practice and after the subsequent PAS protocols. As described above, the baseline IO curves obtained in the PAS25 and PAS10 studies on days 0, 1, and 5, respectively, were not significantly different and were therefore pooled to provide a single baseline for each day. Similarly, the IO curves obtained after motor practice on days 1 and 5 also have been pooled for the PAS25 and PAS10 studies. To simplify the data sets, the slope of the IO curves described by the approximately linear part of the curves between 90 and 130% SI1mV were calculated (see the gray boxes in the figures) and the statistical analysis was performed on the slope data (Fig. 8D). To control for the fact that motor practice alone changed the slope of the IO curve on day 1, two separate versions were calculated for ANOVAs that involved the factor before/after PAS: one using the data obtained after motor practice (i.e., immediately before PAS) as baseline, and one using the data before motor practice as baseline.
Figure 8.

IO curves on days 0, 1, and 5. A–C display the mean MEP amplitude (±SE) on the y-axis against the stimulus intensity on the x-axis (in percentage of SI1mV). The IO curves obtained before and after motor practice were not significantly different in the experiments testing PAS25 and PAS10 and were therefore pooled. A shows the IO curves measured on day 0 before and after PAS25 and PAS10, respectively. B and C show the IO curves measured on days 1 and 5, respectively. PAS25 increased and PAS10 decreased the steepness of the IO curve on day 0. On day 1, motor practice made the IO curve steeper whereas subsequent PAS25 and PAS10 now reduced the IO curve below baseline levels. On day 5, motor practice had no effect on the IO curve and the effects of PAS25 and PAS10 had returned to those seen on day 0. D shows the slopes for all IO curves as displayed in A–C. Statistical analysis performed on these data with three-way ANOVA showed a significant interaction of day 0/day 1/day 5 by before/after PAS by PAS type (p < 0.01).
On day 0 (Fig. 8A), the slope of the IO curve increased after PAS25 and decreased after PAS10, mirroring the effect seen on MEPs.
On day 1 (Fig. 8B), motor practice increased the slope of the IO curve. Subsequent PAS25 reduced the slope below the baseline values, whereas PAS10 tended to reduce the slope more than on day 0. A two-way ANOVA with the factors before/after PAS and PAS type showed neither a significant interaction nor any significant main effects.
On day 5 (Fig. 8C), motor practice had no effect on the IO curve. PAS now induced similar effects on the slope of the IO curves as on day 0. A two-way ANOVA showed a significant before/after PAS by PAS type interaction (F(1,5) > 49.91; p < 0.0001) and a significant main effect of the factor before/after PAS (F(1,5) > 49.91; p < 0.001).
For the statistical comparison of the PAS effect on different days, the slope data were normalized to values obtained before (day 0; baseline) or after motor practice (days 1 and 5) to correct for differences (data not shown). A three-way ANOVA with the factors day 0/1/5, before/after PAS, and PAS type showed a significant interaction of all three factors (F(2,10) > 5.4; p < 0.01) as well as significant main effects day 0/1/5 (F(2,10) > 21.64; p < 0.0002), before/after PAS (F(1,5)>7.55; p < 0.01), and PAS type (F(1,5) > 36.0; p < 0.002). This indicates that the effect of PAS on the IO curve changed over the practice period.
As with the MEP data, additional subanalyses were performed for the IO slope data to compare the PAS effects on days 1 and 5 separately from those on day 0.
The interaction of the three factors day 0/day 1, before/after PAS, and PAS type was significant (F(1,5) > 9.65; p < 0.01); however, this was not the case for the interaction of day 0/day 5, before/after PAS, and PAS type, showing that the PAS effects on day 1 differed from those on day 0, whereas the PAS effects on day 5 were similar to those on day 0.
Discussion
Subjects' performance of the thumb abduction task continuously improved over the five days of motor practice, yet physiological measures of cortical plasticity and excitability were differentially affected by the first practice session on day 1 compared with the last practice session on day 5. Thus, improvement in performance on day 1 was associated with a reversal of the PAS25 effect from LTP-like to LTD-like plasticity whereas it had returned to prepractice values on day 5 even though task performance was better than on day 1. In contrast, the increase in recruitment of corticospinal output and reduced intracortical inhibition associated with performance improvement on day 1 were maintained and even enhanced on day 5. Indeed, recruitment of intracortical inhibition was now stronger than on day 1. Neither corticospinal excitability nor intracortical inhibition were influenced by the last session of motor practice. Finally, the effect of proprioceptive input from the trained muscle was stronger on day 5, indicating a reorganization of SMO compared with the baseline pattern on day 0.
This suggests that the performance improvements on day 1 and after continued practice until day 5 use different mechanisms. We hypothesize that the improvement of task performance on day 1 occurred through unmasking of pre-existing intracortical connections and increasing the efficacy of existing synaptic connections by LTP-like plasticity. The latter was responsible for interfering with measures of PAS-induced plasticity. However, additional improvements in performance by continued practice until day 5 may have resulted from formation of new synapses. These could maintain enhanced synaptic connectivity, seen here as increased corticospinal and intracortical recruitment, while at the same time allowing measures of PAS-induced plasticity to be restored to prepractice values.
Interaction of motor practice with motor cortical excitability
As described previously, a single session of motor practice enhanced the MEP (Muellbacher et al., 2002; Ziemann et al., 2004; Stefan et al., 2006; Rosenkranz and Rothwell, 2006), increased the steepness of the IO curve (Lotze et al., 2003; Perez et al., 2004; Jensen et al., 2005), and reduced SICI (Liepert et al., 1998, 2004; Perez et al., 2004).
Although subcortical effects can contribute to changes in MEPs and IO curves, evidence for a cortical involvement in the effects we describe comes from the changes observed in the SICI, which are generally recognized to reflect levels of excitability in GABAAergic inhibitory circuits of the motor cortex (DiLazzaro et al., 1998; Hanajima et al., 1998; Ilic et al., 2002) and may involve glutamatergic mechanisms, too (Ziemann, 2004).
However, it should be noted that the amount of SICI depends on the intensity of both the conditioning and the test stimuli. The former was always adjusted to the individual's aMT, which was unchanged by practice. In contrast, although the test MEP amplitude was the same on day 5 as it was before motor practice on day 1, it was larger after practice on day 1 whereas it was unchanged on day 5. An increase of test MEP size within a range of 0.2 to 1 mV is associated with an increase of SICI (Chen, 2004). Thus, if the increase of test MEP amplitude after practice on day 1 had influenced measures of SICI, we would have expected SICI to increase whereas in fact it was reduced. We conclude that reduced SICI after motor practice on day 1 is likely to reflect reduced motor cortical GABAAergic inhibition (Ziemann et al., 1996a,b; Ilic et al., 2002). The latter has been shown to lead to an unmasking of pre-existing intracortical connections in animal studies (Jacobs and Donoghue, 1991) and could conceivably contribute to the increase of corticospinal recruitment that we observed at the same time.
As motor practice continued and task performance improved, the IO curves became even steeper, whereas SICI was reduced at low conditioning stimulus intensities and recruited more strongly at higher intensities. Extensive motor training in animals leads to the formation of new synapses in the adult motor cortex. It has been suggested that this synaptogenesis does not directly contribute to initial skill acquisition, but to its consolidation during later stages of motor learning (Kleim et al., 2004). We hypothesize that a similar mechanism might contribute to the changes observed here in IO curves and SICI such as that more synaptic connections are recruited as the intensity of stimulation increases. Indeed, the more rapid recruitment of both excitation (IO curve) and inhibition (SICI curve) might ensure that motor cortical excitability is kept in balance and under efficient control, while operating with a higher gain. Similar findings have been described previously in a study on motor cortical excitability in professional musicians, as model of very long-term motor practice (Rosenkranz et al., 2007).
Additional evidence for changes in synaptic connectivity after 5 d of practice comes from tests of SMO. Compared with its effect on day 0, the proprioceptive input from the trained APB on day 5 lost its inhibitory effect on projections to neighboring muscles and reduced rather than increased intracortical inhibition. This change is larger than after a single session of motor practice in which inputs expanded only to the directly adjacent muscle (Rosenkranz and Rothwell, 2006). A loss of the usual inhibitory effect of muscle vibration onto nonvibrated hand muscles has been described in focal hand dystonia (Rosenkranz et al., 2005). However, in the present case, it should be noted that the loss of inhibition is input specific and only apparent for proprioceptive input from the trained APB.
The last practice session on day 5 did not induce any additional changes in either MEPs, IO curves, or SICI. This is unlikely to result from a “ceiling effect” of Motor cortical excitability because subsequent PAS25 was able to increase both the MEPs and the slope of the IO curves. Similar results have been reported in a study by Kleim et al. (2006), which tested motor excitability in subjects trained to perform a more complex motor task for 15 d. There were significant within-session effects of training on excitability during the first 5 d of continued training, but not thereafter. But excitability measured before training sessions from day 5 onwards were higher compared with days 1 and 3. This indicates that short-term, within-session plasticity occurs transiently during early stages of training and evolves into long-term, between-session, plasticity during later stages of training. This concept is also supported by imaging studies showing that short- and long-term motor learning activate distinguishable brain networks (Karni et al., 1998; Ungerleider et al., 2002; Floyer-Lea and Matthews, 2005).
Interaction of motor practice with PAS-induced plasticity
As in previous studies (Ziemann et al., 2004; Stefan et al., 2006) our findings show that PAS-induced plasticity is influenced by a single motor practice session and, accordingly, we suggest that this interference is caused by the performance increase engaging a cortical LTP-like mechanism. Theoretical concepts of synaptic modification as well as experimental work (Bienenstock et al., 1982; Kirkwood et al., 1996; Toyoizumi et al., 2005) suggest that the threshold for inducing either LTP or LTD at a synapse depends on the history of synaptic activity. According to this concept, previous activity reduces the probability for LTP-induction whereas it increases the probability for LTD-induction. Such a mechanism could account for the reversal of the PAS25 effect after motor practice on day 1 (Ziemann et al., 2004).
The new finding here is that, although 5 d of motor practice led to a continued increase in subjects' performance, the effect of the PAS protocols in inducing LTP/LTD-like plasticity was restored to prepractice values. Similar findings have been reported in a study on rats showing a restoration of experimentally induced LTP/LTD in the motor cortex after long-term motor learning (Rioult-Pedotti and Donoghue, 2000, 2003).
The precise mechanisms that restore LTP/LTD-like plasticity after extended motor practice are not clear. However, if synaptogenesis occurs, then this could replace synaptic strengthening as a mechanism for improved performance and allow synaptic modification by LTP/LTD-mechanisms to return to initial values. This would be consistent with the presence of sustained changes in parameters of corticospinal and intracortical recruitment as well as intracortical inhibition levels that develop over the motor practice week and likely indicate long-term reorganization. The net result will be that the learnt motor skill is preserved while at the same time the capacity for short-term learning of new skills is restored.
In summary, LTP-like mechanisms are used to increase performance after short-term motor practice, but not to increase further or maintain performance levels while practice is continued. The latter is likely to be supported by an increase in synaptic connectivity by synaptogenesis, which leads to enhanced corticospinal and intracortical recruitment. These findings are important to understand long-term reorganization processes that occur in the brain (e.g., after injury and stroke) and to design interventions that effectively and beneficially support recovery of brain function.
Footnotes
This work was supported by Action Medical Research UK, the Dystonia Medical Research Foundation, the Bachmann-Strauss Dystonia and Parkinson Foundation, and the Medical Research Council.
References
- Bienenstock EL, Cooper LN, Munro PW. Theory for the development of neuron selectivity: orientation specificity and binocular interaction in visual cortex. J Neurosci. 1982;2:32–48. doi: 10.1523/JNEUROSCI.02-01-00032.1982. [DOI] [PMC free article] [PubMed] [Google Scholar]
- Chen R. Interactions between inhibitory and excitatory circuits in the human motor cortex. Exp Brain Res. 2004;154:1–10. doi: 10.1007/s00221-003-1684-1. [DOI] [PubMed] [Google Scholar]
- DiLazzaro V, Restuccia D, Oliviero A, Profice P, Ferrara L, Insola A, Mazzone P, Tonali P, Rothwell JC. Magnetic transcranial stimulation at intensities below active motor threshold activates intracortical inhibitory circuits. Exp Brain Res. 1998;119:265–268. doi: 10.1007/s002210050341. [DOI] [PubMed] [Google Scholar]
- Floyer-Lea A, Matthews PM. Distinguishable brain activation networks for short- and long-term motor skill learning. J Neurophysiol. 2005;94:512–518. doi: 10.1152/jn.00717.2004. [DOI] [PubMed] [Google Scholar]
- Hagbarth KE, Eklund G. Motor effects of muscle vibration in spasticity, rigidity and cerebellar disorders. Electroencephalogr Clin Neurophysiol. 1968;25:407. [PubMed] [Google Scholar]
- Hanajima R, Ugawa Y, Terao Y, Sakai K, Furubayashi T, Machii K, Kanazawa I. Paired-pulse magnetic stimulation of the human motor cortex: differences among I waves. J Physiol (Lond) 1998;509:607–618. doi: 10.1111/j.1469-7793.1998.607bn.x. [DOI] [PMC free article] [PubMed] [Google Scholar]
- Ilic TV, Meintzschel F, Cleff U, Ruge D, Kessler KR, Ziemann U. Short-interval paired-pulse inhibition and facilitation of human motor cortex: the dimension of stimulus intensity. J Physiol (Lond) 2002;545:153–167. doi: 10.1113/jphysiol.2002.030122. [DOI] [PMC free article] [PubMed] [Google Scholar]
- Jacobs KM, Donoghue JP. Reshaping the cortical motor map by unmasking latent intracortical connections. Science. 1991;251:944–947. doi: 10.1126/science.2000496. [DOI] [PubMed] [Google Scholar]
- Jensen JL, Marstrand PC, Nielsen JB. Motor skill training and strength training are associated with different plastic changes in the central nervous system. J Appl Physiol. 2005;99:1558–1568. doi: 10.1152/japplphysiol.01408.2004. [DOI] [PubMed] [Google Scholar]
- Karni A, Meyer G, Rey-Hipolity C, Jezzard P, Adamas MM, Turner R, Ungerleider LG. The acquisition of skilled motor performance: fast and slow experience-driven changes in primary motor cortex. Proc Natl Acad Sci USA. 1998;95:861–866. doi: 10.1073/pnas.95.3.861. [DOI] [PMC free article] [PubMed] [Google Scholar]
- Kirkwood A, Rioult MC, Bear MF. Experience-dependent modification of synaptic plasticity in visual cortex. Nature. 1996;381:526–528. doi: 10.1038/381526a0. [DOI] [PubMed] [Google Scholar]
- Kleim JA, Hogg TM, Vandenberg PM, Cooper NR, Bruneau R, Remple M. Cortical synaptogenesis and motor map reorganization occur during late, but not early, phase of motor skill learning. J Neurosci. 2004;24:628–633. doi: 10.1523/JNEUROSCI.3440-03.2004. [DOI] [PMC free article] [PubMed] [Google Scholar]
- Kleim JA, Kleim E, Schallert K, Chan S, Cramer SC. Coordinated short and long-term motor cortex plasticity with motor skill learning. Soc Neurosci Abstr. 2006;32 60.8/FF2. [Google Scholar]
- Kujirai T, Caramia MD, Rothwell JC, Day BL, Thompson PD, Ferbert A, Wroe S, Asselman P, Marsden CD. Corticocortical inhibition in human motor cortex. J Physiol (Lond) 1993;471:501–519. doi: 10.1113/jphysiol.1993.sp019912. [DOI] [PMC free article] [PubMed] [Google Scholar]
- Liepert J, Classen J, Cohen LG, Hallett M. Task-dependent changes of intracortical inhibition. Exp Brain Res. 1998;118:421–426. doi: 10.1007/s002210050296. [DOI] [PubMed] [Google Scholar]
- Liepert J, Weiss T, Meissner W, Steinrucke K, Weiller C. Excercise-induced changes of motor excitability with and without sensory block. Brain Res. 2004;1003:68–76. doi: 10.1016/j.brainres.2003.12.039. [DOI] [PubMed] [Google Scholar]
- Lotze M, Braun C, Birbaumer N, Anders S, Cohen LG. Motor learning elicited by voluntary drive. Brain. 2003;126:866–872. doi: 10.1093/brain/awg079. [DOI] [PubMed] [Google Scholar]
- Muellbacher W, Ziemann U, Wissel J, Dang N, Kofler M, Facchini S, Boroojerdi B, Poewe W, Hallett M. Early consolidation in human primary motor cortex. Nature. 2002;415:640–644. doi: 10.1038/nature712. [DOI] [PubMed] [Google Scholar]
- Orth M, Snijders AH, Rothwell JC. The variability of intracortical inhibition and facilitation. Clin Neurophysiol. 2003;114:2362–2369. doi: 10.1016/s1388-2457(03)00243-8. [DOI] [PubMed] [Google Scholar]
- Pascual-Leone A, Dang N, Cohen LG, Brasil-Neto JP, Cammarota A, Hallett M. Modulation of muscle responses evoked by transcranial magnetic stimulation during the acquisition of new fine motor skills. J Neurophysiol. 1995;74:1037–1045. doi: 10.1152/jn.1995.74.3.1037. [DOI] [PubMed] [Google Scholar]
- Perez MA, Lungholt BK, Nyborg K, Nielsen JB. Motor skill training induces changes in the excitability of the leg cortical area in healthy humans. Exp Brain Res. 2004;159:197–205. doi: 10.1007/s00221-004-1947-5. [DOI] [PubMed] [Google Scholar]
- Ridding MC, Rothwell JC. Stimulus/response curves as a method of measuring motor cortical excitability in man. Electroencephalogr Clin Neurophysiol. 1997;105:340–344. doi: 10.1016/s0924-980x(97)00041-6. [DOI] [PubMed] [Google Scholar]
- Rioult-Pedotti MS, Friedman D, Hess G, Donoghue JP. Strengthening of horizontal cortical connections following skill learning. Nat Neurosci. 1998;1:230–234. doi: 10.1038/678. [DOI] [PubMed] [Google Scholar]
- Rioult-Pedotti M, Donoghue J. The nature and mechanisms of plasticity. In: Boniface S, Ziemann U, editors. Plasticity in the human nervous system. Cambridge, UK: Cambridge UP; 2003. pp. 1–25. [Google Scholar]
- Rioult-Pedotti MS, Donoghue JP. Neocortical learning regulates synaptic strength by altering the synaptic modification range. Soc Neurosci Abstr. 2000;26 73.2. [Google Scholar]
- Rosenkranz K, Rothwell JC. Differential effect of muscle vibration on intracortical inhibitory circuits in humans. J Physiol (Lond) 2003;551:649–661. doi: 10.1113/jphysiol.2003.043752. [DOI] [PMC free article] [PubMed] [Google Scholar]
- Rosenkranz K, Rothwell JC. Differences between the effects of three plasticity inducing protocols on the organisation of the human motor cortex. Eur J Neurosci. 2006;23:822–829. doi: 10.1111/j.1460-9568.2006.04605.x. [DOI] [PubMed] [Google Scholar]
- Rosenkranz K, Williamon A, Butler K, Cordivari C, Lees AL, Rothwell JC. Pathophysiological differences between musician's dystonia and writer's cramp. Brain. 2005;128:918–931. doi: 10.1093/brain/awh402. [DOI] [PubMed] [Google Scholar]
- Rosenkranz K, Williamon A, Rothwell JC. Motorcortical excitability and plasticity is enhanced in professional musicians. J Neurosci. 2007;27:5200–5206. doi: 10.1523/JNEUROSCI.0836-07.2007. [DOI] [PMC free article] [PubMed] [Google Scholar]
- Stefan K, Kunesch E, Cohen LG, Benecke R, Classen J. Induction of plasticity in the human motor cortex by paired associative stimulation. Brain. 2000;123:572–584. doi: 10.1093/brain/123.3.572. [DOI] [PubMed] [Google Scholar]
- Stefan K, Kunesch E, Benecke R, Cohen LG, Classen J. Mechanisms of enhancement of human motor cortex excitability induced by interventional paired associative stimulation. J Physiol (Lond) 2002;543:699–708. doi: 10.1113/jphysiol.2002.023317. [DOI] [PMC free article] [PubMed] [Google Scholar]
- Stefan K, Wycislo M, Gentner R, Schramm A, Naumann M, Reiners K, Classen J. Temporary occlusion of associative motor cortical plasticity by prior dynamic motor training. Cereb Cortex. 2006;16:376–385. doi: 10.1093/cercor/bhi116. [DOI] [PubMed] [Google Scholar]
- Svensson P, Romaniello A, Wang K, Arendt-Nielsen L, Sessle BJ. Plasticity in corticomotor control of the human tongue musculature induced by tongue-task training. Exp Brain Res. 2003;152:42–51. doi: 10.1007/s00221-003-1517-2. [DOI] [PubMed] [Google Scholar]
- Toyoizumi T, Pfister JP, Aihara K, Gerstner W. Generalised Bienenstock–Cooper–Munro rule for spiking neurons that maximizes information transmission. Proc New York Acad Sci. 2005;102:5239–5244. doi: 10.1073/pnas.0500495102. [DOI] [PMC free article] [PubMed] [Google Scholar]
- Ungerleider LG, Doyon J, Karni A. Imaging brain plasticity during motor skill learning. Neurobiol Learn Mem. 2002;78:553–564. doi: 10.1006/nlme.2002.4091. [DOI] [PubMed] [Google Scholar]
- Wolters A, Sandbrink F, Schlottmann A, Kunesch E, Stefan K, Cohen LG, Benecke R, Classen J. A temporally asymmetric Hebbian rule governing plasticity in the human motor cortex. J Neurophysiol. 2003;89:2339–2345. doi: 10.1152/jn.00900.2002. [DOI] [PubMed] [Google Scholar]
- Ziemann U. TMS and drugs. Clin Neurophysiol. 2004;115:1717–1729. doi: 10.1016/j.clinph.2004.03.006. [DOI] [PubMed] [Google Scholar]
- Ziemann U, Lonnecker S, Steinhoff BJ, Paulus W. The effect of lorazepam on the motor cortical excitability in man. Exp Brain Res. 1996a;109:127–135. doi: 10.1007/BF00228633. [DOI] [PubMed] [Google Scholar]
- Ziemann U, Lonnecker S, Steinhoff BJ, Paulus W. Effects of antiepileptic drugs on motor cortex excitability in humans: a transcranial magnetic stimulation study. Ann Neurol. 1996b;40:367–378. doi: 10.1002/ana.410400306. [DOI] [PubMed] [Google Scholar]
- Ziemann U, Rothwell JC, Ridding MC. Interaction between intracortical inhibition and facilitation in human motor cortex. J Physiol (Lond) 1996c;496:873–881. doi: 10.1113/jphysiol.1996.sp021734. [DOI] [PMC free article] [PubMed] [Google Scholar]
- Ziemann U, Ilic TV, Pauli C, Meintzschel F, Ruge D. Learning modifies subsequent induction of long-term potentiation-like and long-term depression-like plasticity in human motor cortex. J Neurosci. 2004;24:1666–1672. doi: 10.1523/JNEUROSCI.5016-03.2004. [DOI] [PMC free article] [PubMed] [Google Scholar]